Article

Influence of Interface Temperature on the Electric Contact Characteristics of a C-Cu Sliding System

1
College of Electrical and Information Engineering, Lanzhou University of Technology, Lanzhou 730050, China
2
School of Electrical Engineering, Southwest Jiaotong University, Chengdu 611730, China
*
Author to whom correspondence should be addressed.
Coatings 2022, 12(11), 1713; https://doi.org/10.3390/coatings12111713
Submission received: 14 September 2022 / Revised: 23 October 2022 / Accepted: 7 November 2022 / Published: 10 November 2022

Abstract

:
Electrical contact resistance (ECR) and discharge are the key parameters of electrical contact performance for carbon-copper (C-Cu) contacts in the pantograph-contact line system. The change in physical and chemical properties of the C-Cu interface caused by interface temperature is the main reason for the variation in ECR and discharge. In this paper, an electric contact test platform based on interface temperature control was established. The influence of interface temperature on ECR and the discharge characteristics under different current amplitudes were studied. There are opposite trends in the change in ECR and the discharge characteristics with interface temperature under different currents, which results from the competition between interface oxidation and a softening of the contact spots caused by high temperature. The trend of interface oxidation with temperature was analyzed via the quantitative analysis of the composition and content of the oxides at the C-Cu contact interface and is discussed here. The relationship between interface oxidation, ECR, and discharge characteristics was studied. Furthermore, a finite element simulation model was established for estimating the temperature distribution throughout the C-Cu contact spots. The competitive process of the softening and oxidation of the contact spots at different temperatures and currents was analyzed, and the variation mechanism of the ECR and discharge characteristics with interface temperature was studied.

1. Introduction

Carbon-copper (C-Cu) contacts are widely used in railway systems, such as the pantograph-overhead contact line system, collector, grounding brush, and so on. In order to achieve high performance in the self-lubricating properties and conductivity, the C-Cu contacts are used as the key components of energy transfer in the sliding electric contact system [1,2,3]. The stability and quality of transferring power during the relative motion of the C-Cu contact pairs are closely related to the C-Cu electrical contact performance [4]. Generally, the electrical contact resistance (ECR) and discharge rate are used as the evaluation parameters for C-Cu electrical contact performance. In addition, the interface temperature can also reflect the characteristics of electrical contact to a certain extent. Previous research has shown that high contact pressure can reduce ECR and discharge in the C-Cu contacts [5,6,7], while high current results from a high interface temperature [8,9].
However, ECR, discharge, and interface temperature are not independent of each other. The main heat sources of the C-Cu interface temperature include joule heat and discharge arc heat; that is to say, the interface temperature is affected by ECR and discharge [10,11,12]. Meanwhile, a few parts of the rough peaks passed by the current are heated by high interface temperature, which promotes oxidation and reduces the mechanical strength of the contact spot. Then, the film layer and actual contact area change at the contact interface, thus affecting the ECR and discharge. In the field of resistance welding, the influence of interface temperature on ECR has been widely focused on by scholars. The trend for ECR decreases with increasing temperature under higher temperature conditions, while it is without rule for different contact materials in lower temperature environments [13,14,15]. For steel–steel contacts and steel–copper contacts, a steady decrease in ECR with increasing contact temperature was reported [13]. For mild steel–stainless steel contacts, there is a slight increase in ECR between 100 °C and 200 °C [14]. The ECR of copper contacts reaches a local maximum value of around 100 °C [15]. The above results on the influence of temperature on ECR are derived from homogeneous contact pair materials. However, for C-Cu heterogeneous contacts, the significant differences in the material properties and operating conditions lead to distinct results. In addition, research on the correlation between interface temperature and discharge is rarely carried out. Meanwhile, the coupling relationship among interface temperature, ECR, and discharge is complex, so it is difficult to accurately judge the effect of interface temperature on ECR and discharge in the general sliding electrical contact test.
In this paper, a new experimental scheme was designed, which actively adjusts the interface temperature by an external heat source. The change process of ECR and discharge with temperature are observed. The mechanism of the influence of temperature on the electrical contact characteristics is explored through observation morphology analysis and component analysis.

2. Materials and Methods

2.1. Experimental Device

Taking the sliding between the C-Cu electrical sliding contacts in the railway pantograph-contact line system as an example, the research was carried out on the tester, as shown in Figure 1 [16,17]. The experimental device is composed of a moving part, an electric power supply part, and a load-applying part. The moving parts include a turning disc inlay with copper wires, a carbon slider clamp, a stepless motor, etc. The motor drives the turning disc to rotate so that the relative speed of the copper wire and the carbon slider can be adjusted continuously in the range of 30–400 km. The crank-link mechanism helps the C-Cu contacts simulate Z-word motion at a frequency of 3–20 Hz. The electric power supply part can provide 0–800 A adjustable AC/DC current for the contact pair, while the load-applying part can provide 0–300 N adjustable loads for the contact pair.
Figure 2 shows the data acquisition and temperature control system [16,17]. Hall voltage and current sensors are used to collect contact voltage drop and the loop current of the C-Cu contacts with ranges of 0–500 V and 0–800 A, respectively, and the frequency response is 0–100 kHz. The voltage and current data are transmitted and stored by the data acquisition card, and the sampling frequency is set to 5 kHz.
We preset the interface temperature in the temperature controller and heated the slider through a silicon nitride heating sheet. The temperature of the interface was measured by the thermoelectric and infrared thermal imager, and the temperature data were transmitted to the temperature controller in real time so as to control the working state of the heating sheet and ensure the stability of the interface temperature. The monitoring data and infrared image of the surface temperature on the carbon slider can be seen in Figure 3 of reference [17].

2.2. Test Conditions and Test Materials

The used experimental method and subject in this work were developed in a previous work [17]. The parameters of the test, the chemical composition, and the physical properties of the test materials are shown in Table 1 and Table 2.

2.3. Test Data Processing

As shown in Figure 2, the measured voltage drop U consists of three parts, copper voltage drop Ua, carbon voltage drop Ub, and the contact voltage drop Uab. According to the Ohm method, The ECR of the C-Cu contacts is:
R = U a b I = U U a U b I
In this test, Ua and Ub are far less than Uab and can be ignored.
When the carbon slider is separated from the copper contact line, and the off-line voltage drop is greater than the arc starting voltage, discharge occurs [18]. Discharge energy E is related to off-line voltage U, current I, and off-line time t, as shown in Equation (2). The average single discharge energy can be obtained from the discharge energy E and discharges frequency N, as shown in Equation (3).
E = U I d t
e ¯ = E N = U I d t N

3. Results and Discussions

3.1. Influence of Interface Temperature on ECR under Different Current

Figure 3 shows the variation in average ECR (AECR) with interface temperature. The influence of interface temperature on AECR is not consistent under different current conditions. Two opposite phenomena occur. In the first case, when the current is between 10 A and 20 A, the AECR increases with the rise in interface temperature. The rising rate of AECR increases continuously at 10 A but decreases after 240 °C at 20 A. In the second case, when the current is between 60 A and 80 A, the AECR decreases with increasing temperature. At 40 A, the change in ECR with interface temperature is more like the transition of the above two phenomena. An interesting U-shaped AECR curve with temperature rise is observed. At different temperatures, AECR has a relatively uniform trend with current, which has a slow rise and then decreases rapidly with increasing current. The AECR has a local maximum value in the range of the test current, and the local maximum value moves forward with the rise in temperature.
In the case of the C-Cu contacts, AECR also consists of two parts. One part is the contraction resistance generated when the current passes through tiny contact spots. The other part is the velamen resistance generated by the film layer on the surface of the contact spots. The influence of temperature on AECR has two competing mechanisms. On the one hand, it promotes the oxidation of the contact spots and increases the velamen resistance. On the other hand, it softens the material and reduces the contraction resistance. For different currents, how these two different effects (of interface temperature) play a role needs further verification.
The influence of interface temperature on dynamic ECR (DECR) at currents of 10 A and 80 A was further studied, as shown in Figure 4. At 10 A, the DECR fluctuates around 75 mΩ under different interface temperatures, and the fluctuation becomes more serious with the increase in temperature. Therefore, at a current of 10 A, the increase in AECR with interface temperature is mainly caused by increased volatility in DECR. At 80 A, the high temperature significantly suppresses the fluctuation of DECR, and the DECR shifts downward as a whole. The two changes led to a rapid decline in the AECR. When the interface temperature is consistent, the difference between 10 A and 80 A results in a different joule heat injected into the contact spots. A joule heat of 80 A makes the contact spots even hotter. At 10 A, the softening effect of temperature is not obvious, and oxidation is dominant. The formation rate and thickness of the oxide film increase at the contact spots, resulting in enhanced fluctuation in the DECR. At 80 A, the softening effect of the temperature on the material may become the dominant factor, which is consistent with most research results on the influence of temperature on ECR [19,20,21].

3.2. Influence of Interface Temperature on Arc Discharge under Different Current

Figure 5 shows the variation in the discharge characteristic parameters with interface temperature. The effects of temperature on discharge frequency, average single discharge energy, and total discharge energy also have obvious differences under different currents. Two behaviors occurred. Firstly, when the current is in the range of 10 A to 60 A, the discharge frequency increases with a rise in temperature, and the increase rate decreases with the rise in current. The average single discharge energy decreases with the rise in temperature, and the decrease rate increases with the rise in current. As a result, the total discharge energy hardly changes with temperature from 10 A to 40 A, while the total discharge energy decreases with the rise in temperature at 60 A. At the current of 80 A, the variation in the discharge characteristic parameters with interface temperature is quite different. The discharge frequency increased slightly, then almost remained stable, and then decreased rapidly with temperature rise. The average single discharge energy showed an interesting V-shaped distribution with the temperature rise. The total discharge energy decreases rapidly and then keeps stable with temperature rise.
It is easy to understand why the discharge frequency increases and the average single discharge energy decreases with interface temperature rise. The high temperature heats the air near the C-Cu interface, so the breakdown field strength of the air decreases, making the discharge more likely to occur, and the single discharge energy becomes lower. However, at 80 A, the decline in discharge frequency and the rise in single discharge energy with high temperature are difficult to explain, requiring further analysis.

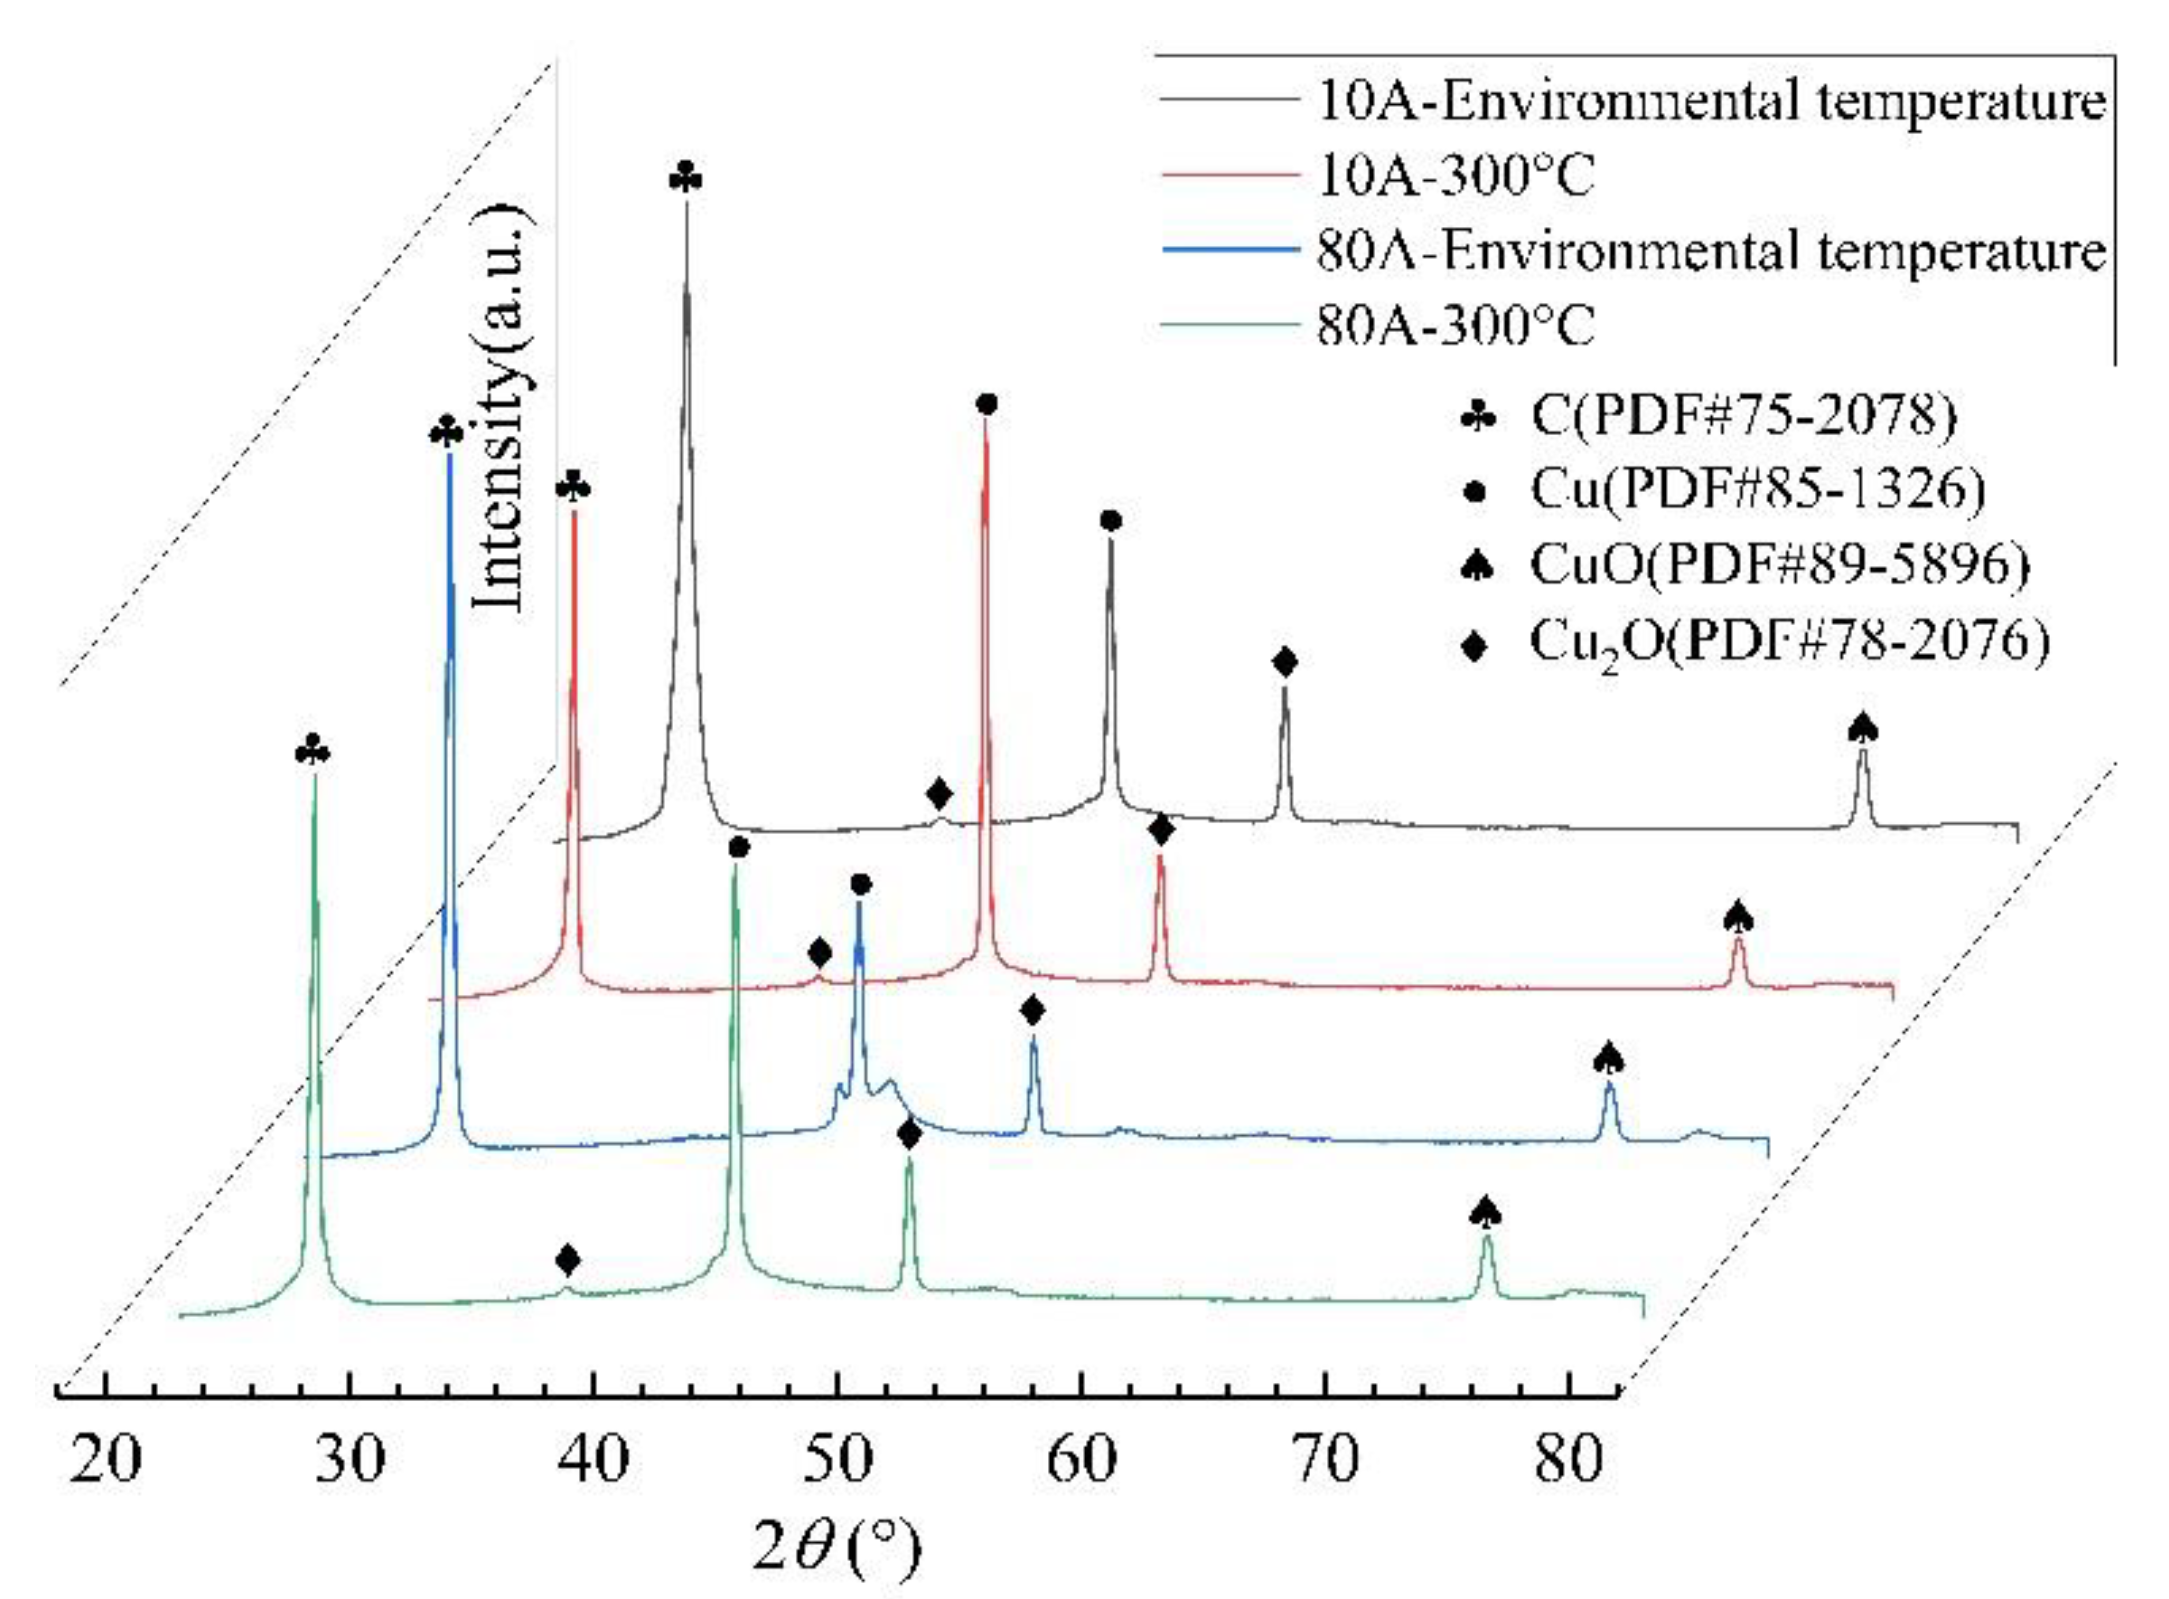
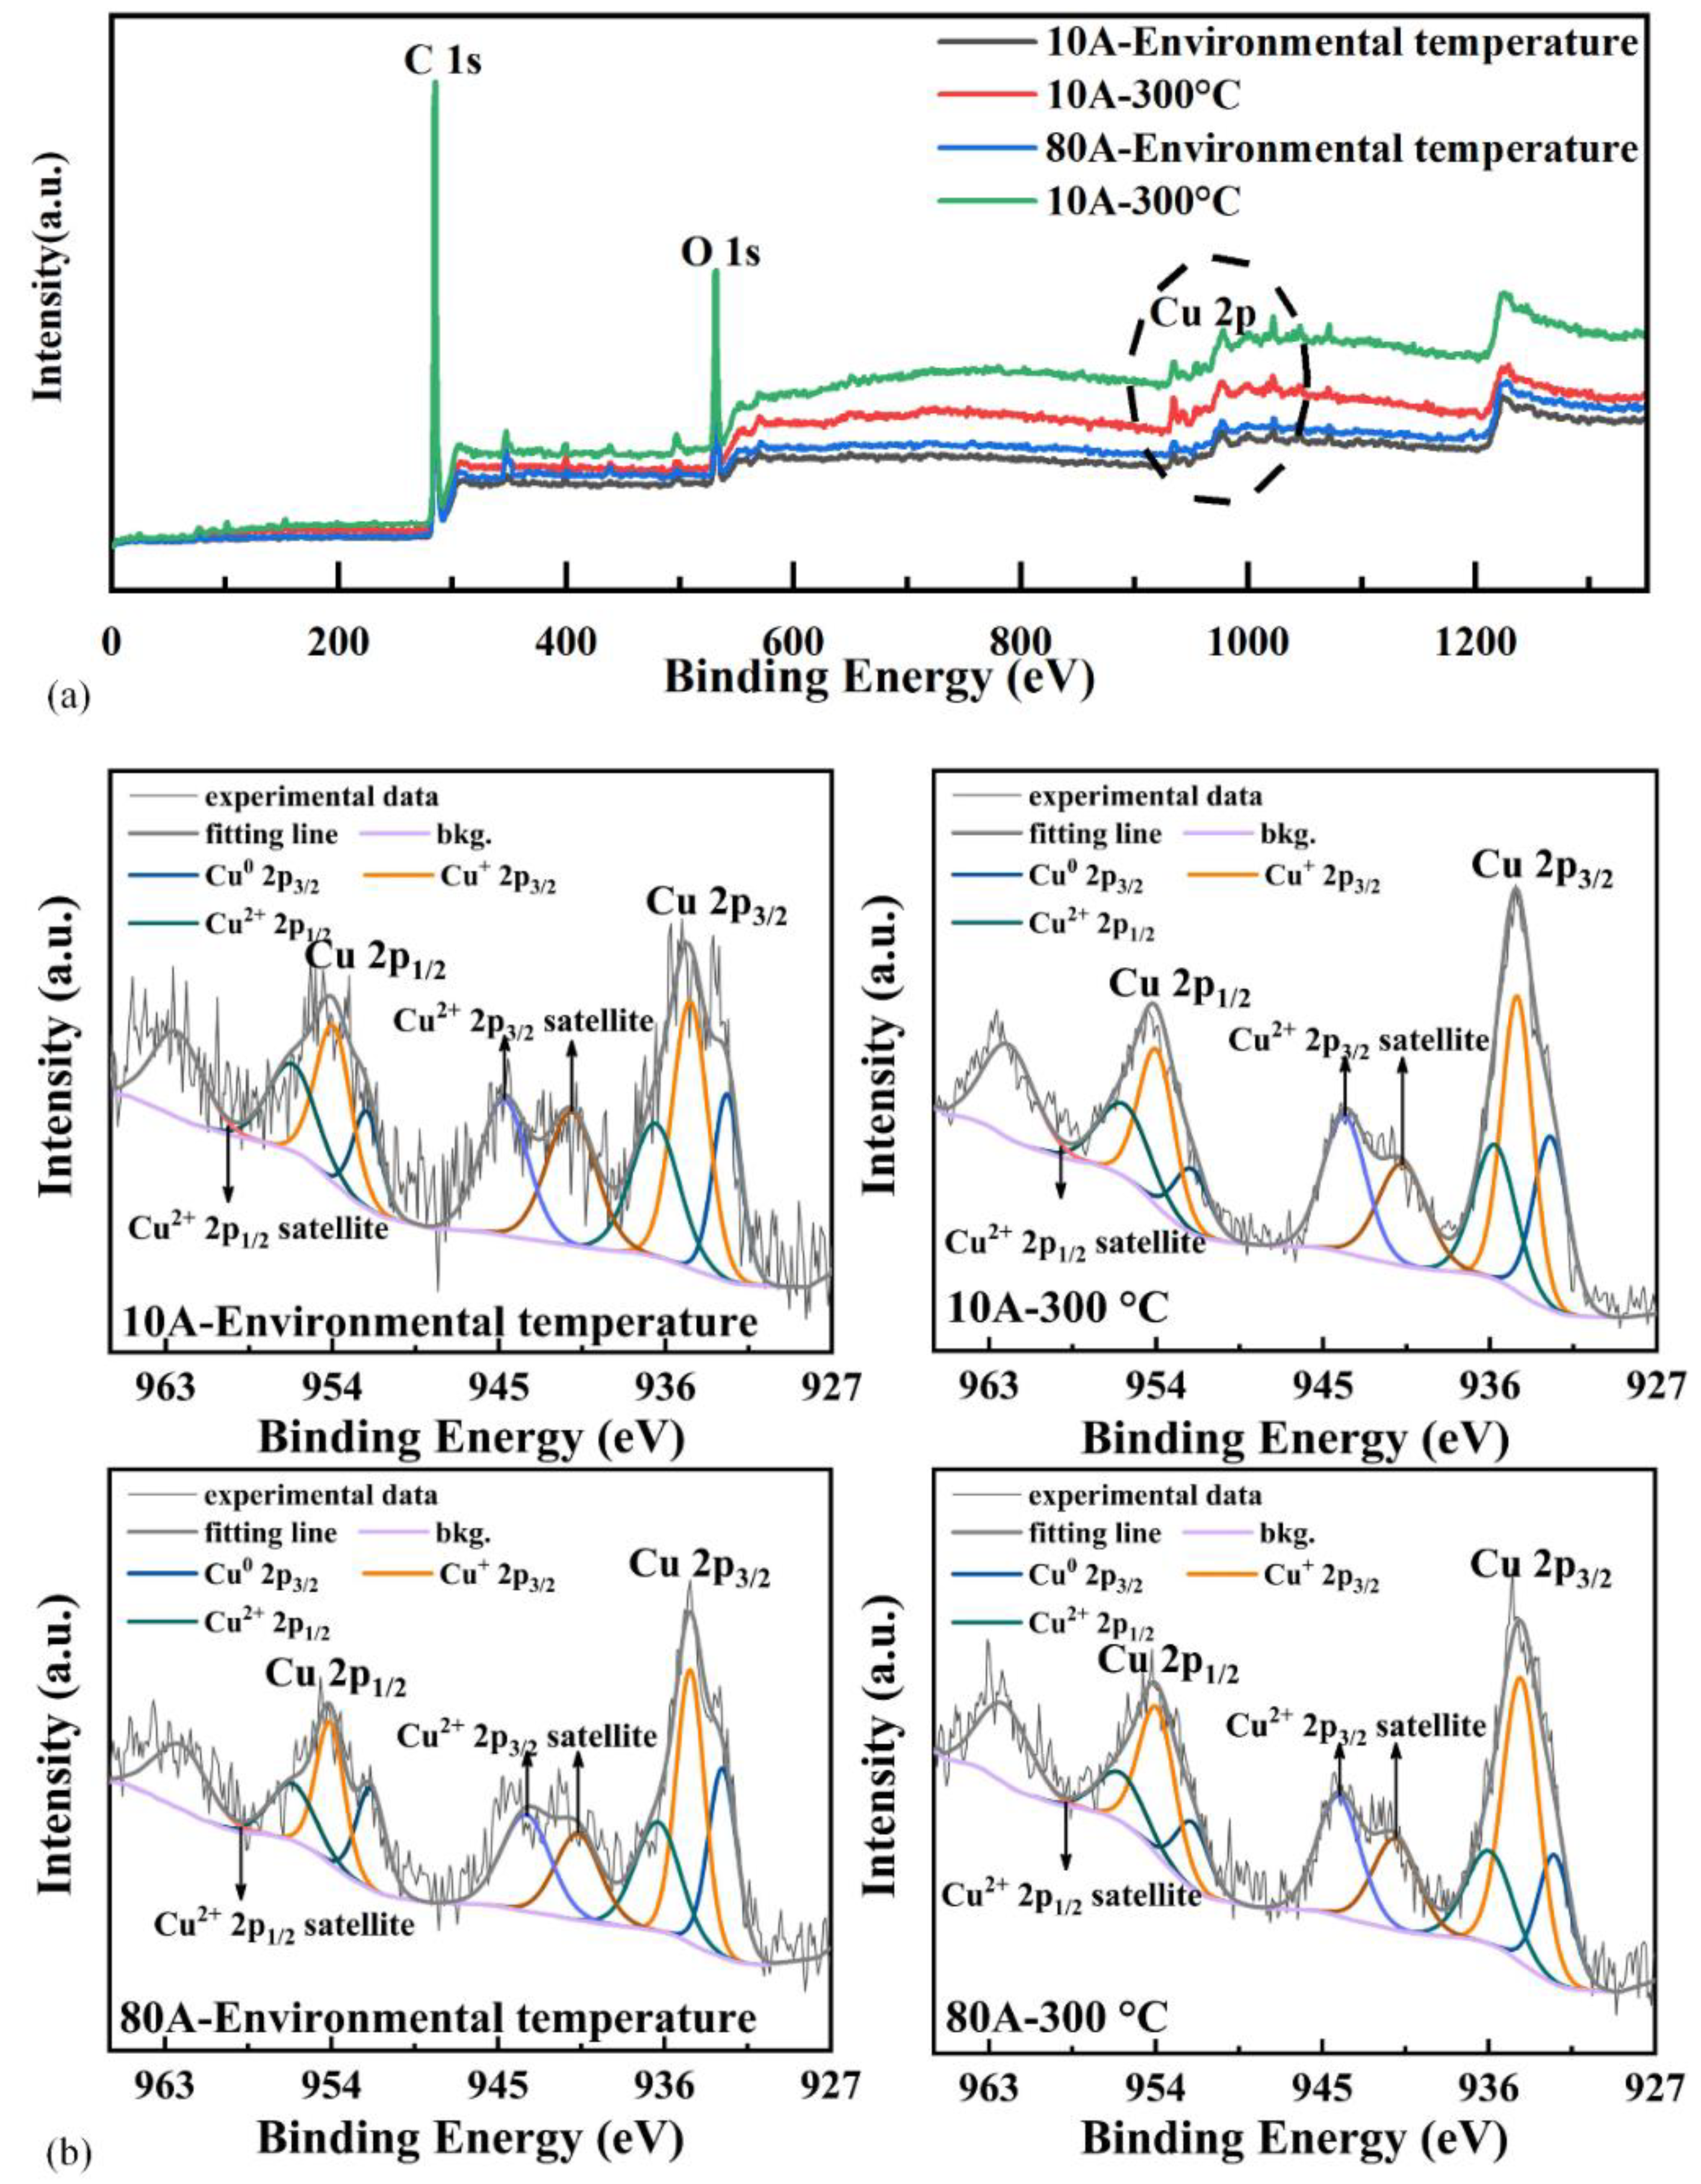
3.3. Phase Composition Analysis under Different Interface Temperature

Figure 6 shows the XRD patterns of the carbon surface with different temperatures and currents, which was shown in previous work [17]. At any temperature, the main peaks are consistent, including the C, Cu, CuO, and Cu2O phases. The copper and copper oxides on the carbon surface are generated by the transfer of the copper contact line to the carbon slider. Among the compounds on the carbon surface, copper oxide, with poor electrical conductivity, is the main factor that produces the velamen resistances of the C-Cu contacts. The interface temperature causes the oxidation of the copper material, and a copper oxide film is formed at the C-Cu interface. Then the wear between the C-Cu interface causes part of the brittle oxide film to fall off, while the exposed copper continues to be oxidized, and a new oxide film is constantly formed. Finally, the oxide content of the interface is stabilized in a certain range. At different temperatures, the change in the oxidation rate of the copper material leads to the difference in the size and thickness of the oxide film that is stable at the C-Cu interface.
Figure 7 shows the XPS survey-scan spectrum of the binding energies from 0 to 1300 eV of the carbon surface with different temperatures and currents. The C 1s, O 1s, and Cu 2p peaks were detected. After the peak fitting of the Cu 2P peaks, the fitting peaks of each valence state were compared with the standard satellite image of the Cu element. It was found that the Cu element mainly consists of Cu0, Cu+, and Cu2+. The results of the XPS further confirmed the existence of a copper oxide film on the C-Cu interface, and the content of the stable copper oxide varied with interface temperature and current. The reason why the ECR changes with the rise in interface temperature can be deduced by analyzing the oxide content.
A quantitative analysis of elements was conducted (and is shown in Figure 7a) to obtain the atomic percentage of the elements on the carbon surface after the test, as shown in Table 3. The contents of copper and oxygen on the carbon surface increase with the interface temperature under different current conditions. When the current is 10 A, the proportion of copper and oxygen at 300 °C increases by 65% and 38.3%, respectively, compared with the same case at room temperature. When the current was 80 A, the content of copper and oxygen at 300 °C increased by 29.6% and 14.6%, respectively, compared with the same case at room temperature. However, the variations in the copper and oxygen content with current are opposite at different interface temperatures. When the interface temperature is room temperature, the proportion of copper and oxygen at 80 A is 21.7% and 8.3% higher than that at 10 A, respectively. However, when the interface temperature is 300 °C, the content of copper and oxygen at 80 A decreases by 4.6% and 10.2% compared with the case at 10 A.
The copper contact line material is transferred to the carbon surface in two main ways. One is through material transfer caused by friction and wear [22]. Another is the transfer of copper vapor and copper droplets to the carbon surface caused by discharge [23]. As can be seen from Figure 5, the total discharge energy remained stable with the variation in the interface temperature at 10 A, indicating that the copper transfer was caused by the discharge and was constant. The high interface temperature aggravated the adhesion effect between the carbon–copper interface, and more copper adhered to the carbon surface in the friction process. However, the total discharge energy decreases with the increase in interface temperature at 80 A, so the copper transfer caused by discharge decreases. Meanwhile, joule heat increases rapidly at 80 A, and the temperature of the contact spots may exceed the softening temperature of copper under the synergistic effect of joule heat and interface temperature. Thus, the copper spots are more likely to undergo plastic deformation under the cutting action of the carbon spots, reducing the amount of copper fractured and transferred to the carbon surface. This is the main reason why the copper content on the carbon surface at 80 A and 300 °C is lower than the case at 10 A and 300 °C. In addition, the increase in discharge energy is the main reason for higher copper content on the carbon surface at 80 A and at room temperature, when compared to that at 10 A at room temperature.
From the fact that the percentage of oxygen elements on the carbon surface is higher than that of copper, not all oxygen elements combine with copper to form copper oxides. Carbon material has a porous structure, so it has an excellent adsorption capacity, and part of the oxygen element on the carbon surface comes from adsorption. With the rise in interface temperature, the oxidation rate of copper increases significantly, and the oxygen content increases accordingly. However, high interface temperature can enhance the activity of the oxygen molecules adsorbed on the carbon surface and cause a desorption phenomenon. As a result, an increment in oxygen element percentage on the carbon surface with interface temperature is smaller than that of the copper element. When the interface temperature is constant, the main reason why the oxygen content changes with current is the joule heat concentrated contact spots. At room temperature, joule heat surges as the current rises, which promotes copper oxidation and increases the oxygen content. However, at 300 °C, the high current (80 A) corresponds to lower oxygen content. The superposition of joule heat and high interface temperature may make the temperature of the contact spots reach the oxidation temperature of the carbon materials. On the one hand, the oxygen element is consumed in the reaction with carbon; on the other hand, high temperature hinders the adsorption of oxygen on the carbon surface. Thus, the oxygen content on the carbon surface decreases slightly with the increase in current at 300 °C.
Through the above analysis, it is difficult to judge the oxidation of the interface film solely from the changes in the content of the copper and oxygen elements on the carbon surface. It is necessary to further quantitatively analyze the changes in the content of the copper elements with different valences (stated in Figure 7b), as shown in Table 4. It can be seen from the table that the content of Cu0 decreases with the increase in interface temperature at 10 A. These results indicate that high interface temperature does promote copper oxidation, and the copper oxide content on the carbon surface obviously increases because the total copper content also increases. In addition, the content of Cu+ increased by 12.42%, while the Cu2+ content decreased by 5.41% at 300 °C. Compared with Cu2O, CuO has higher resistivity. Therefore, the increase in velamen resistance is indeed an important reason for the increase in the AECR and the aggravation fluctuation of the ECR in Figure 4a and Figure 5a. Meanwhile, the presence of the oxide film obstructs the transmission of the current, increasing the discharge frequency of the C-Cu contact spots, which is consistent with the result in Figure 5a. However, when the current is 80 A, the content of Cu0 increases with the increase in the interface temperature, indicating that the content of copper oxide decreases. The possible reason is that the carbon material has reducibility. Under the synergistic effect of high interface temperature (300 °C) and the joule heat at a high current (80 A), the contact spot temperature reaches the temperature at which the reduction reaction of carbon and copper oxides occurs. The copper oxide is reduced to copper, thus increasing the content of the Cu0. As the total content of copper still increases with the increase in interface temperature at 80 A, the content of the copper oxide at the C-Cu interface at 80 A and 300 °C is only slightly higher than that at 80 A and at room temperature. In addition, the decrease in Cu+ content at 80 A and 300 °C leads to a decrease in the resistivity of the oxide film. Therefore, at 80 A, the variation in velamen resistance with interface temperature is not obvious, and its influence on the ECR can be ignored.

3.4. Temperature Distribution of C-Cu Contact Spot under Different Interface Temperature

The actual contact area of the C-Cu interface is only a few tiny contact spots, and the electrical contact behavior of the C-Cu interface only occurs on the contact spots. Since joule heat and friction heat are injected into the contact interface through the contact spots, the temperature at contact spots should be significantly higher than the interface temperature set in the test. The different joule heat leads to different temperatures in the contact spots with the same interface temperature, which also leads to different effects of interface temperature on the ECR and discharge under different current conditions. At present, the temperature distribution of the contact spots can only be estimated by simulation. By referring to the methods in references [24,25], the temperature distribution of the C-Cu contact spots under different currents and interface temperatures were estimated by the finite element method. The reason for the variation in ECR and discharge with temperature was explored.

3.4.1. Finite Element Model of C-Cu Contacts in Pantograph-Contact Line System

The geometric model of C-Cu contacts in the pantograph-contact line system is shown in Figure 8. The “solid mechanics” module and “Joule heat” module in COMSOL Multiphysics was used to calculate the temperature distribution of the C-Cu contact spots. The size and material properties of the physical model are consistent with those in the test, as shown in Table 2. The C-Cu contacts were the contacts between the cylinder and plate, and the nominal contact area between the copper contact line and the carbon slider is only the tangential area under the action of contact pressure. According to Roche’s stress–strain rule, the nominal area of the C-Cu contacts can be obtained through Equations (4)–(6) [26]:
A B = 1.60 3 2 F R C / L
C = 1 υ 1 2 E 1 + 1 υ 2 2 E 2
A m = L 2 R arcsin A B 2 R
where Am is the nominal area of contact; AB is the tangential width of the nominal contact area; F is contact pressure; R is the radius of the copper contact line; L is the width of the carbon slider; υ1 and υ2 are Poisson’s ratios of carbon and copper materials, respectively, and E1 and E2 are the elastic moduli of the carbon and copper materials respectively.
Figure 8. Geometric model of the C-Cu contacts in the pantograph-contact line system.
Coatings 12 01713 g008
The actual electrical contact spots are randomly distributed over the nominal contact area. Previous studies have shown that the number of contact spots in the C-Cu contacts in the pantograph-contact line system is about 15–20, which is largely independent of the size of the nominal contact area [27]. According to Holm’s electrical contact theory, assuming that all contact spots are round and have the same size, the radius of a single contact spot can be estimated by Equation (7).
F = n α A 1 H = n α π a 1 2 H
where F is the contact pressure; n is the number of contact spots; α is the correction coefficient; A1 is the area of a single contact spot; H is the hardness of carbon material, and a1 is the radius of a single contact spot.

3.4.2. Analysis of the Thermal Process of the C-Cu Contact Spots in a Pantograph-Contact Line System

In this study, the temperature rise in the C-Cu contact spots is mainly the result of the combined action of friction heat, joule heat, arc heat, and the external heat source. In the test, before the C-Cu contacts move relative to each other, an external heat source is used to stabilize the temperature of the C-Cu contact interface near the set value. Therefore, the temperature brought by the external heat source is taken as the initial temperature on the C-Cu contact spot. The arc heat mainly acts on a few contact spots where the discharge occurs, and the discharge duration takes a very small proportion of the test time. In order to simplify the calculation and simulation, the influence of the arc heat is not considered. Therefore, the joule heat and friction heat (as shown in Equations (8) and (9)) are mainly considered in the estimation of the temperature rise of the C-Cu contact spots.
q f = μ F v
q r = I 2 R n A 1 = I 2 ( a 1 ρ 1 + a 1 ρ 2 + 4 ρ 3 ) β H 4 n a F
where qf is the friction heat; qr is the joule heat; μ is the dynamic friction coefficient of C-Cu contacts; v is the relative movement velocity of C-Cu contacts; R is the ECR of C-Cu contacts; ρ1 and ρ2 are the resistivities of carbon and copper materials, ρ3 is the resistivity of the surface film, and β is the correction coefficient.
In order to simplify the problem and ensure its generality, the following basic assumptions need to be made during the calculation of the temperature rise of the contact spots:
(1)
Material properties, such as density and thermal conductivity, change little within a certain temperature range, which can be ignored. In the simulation calculation, the material characteristics of carbon, copper, and their contact interface remain unchanged;
(2)
The friction heat and joule heat are completely absorbed by the C-Cu contact spots;
(3)
The distance between each contact spot is far enough, and relative to their size, so the interaction between the contact spots can be ignored;
(4)
The initial temperature of the carbon slider surface is set as the interface temperatures that are controlled by the external heat source in the test. The copper contact line is considered to be infinitely long, and the position that is far enough from the contact areas is set to room temperature (20 °C);
(5)
Only heat conduction and convection are considered in the calculation of the temperature distribution of the C-Cu contact spots, and the thermal radiation process is not considered.

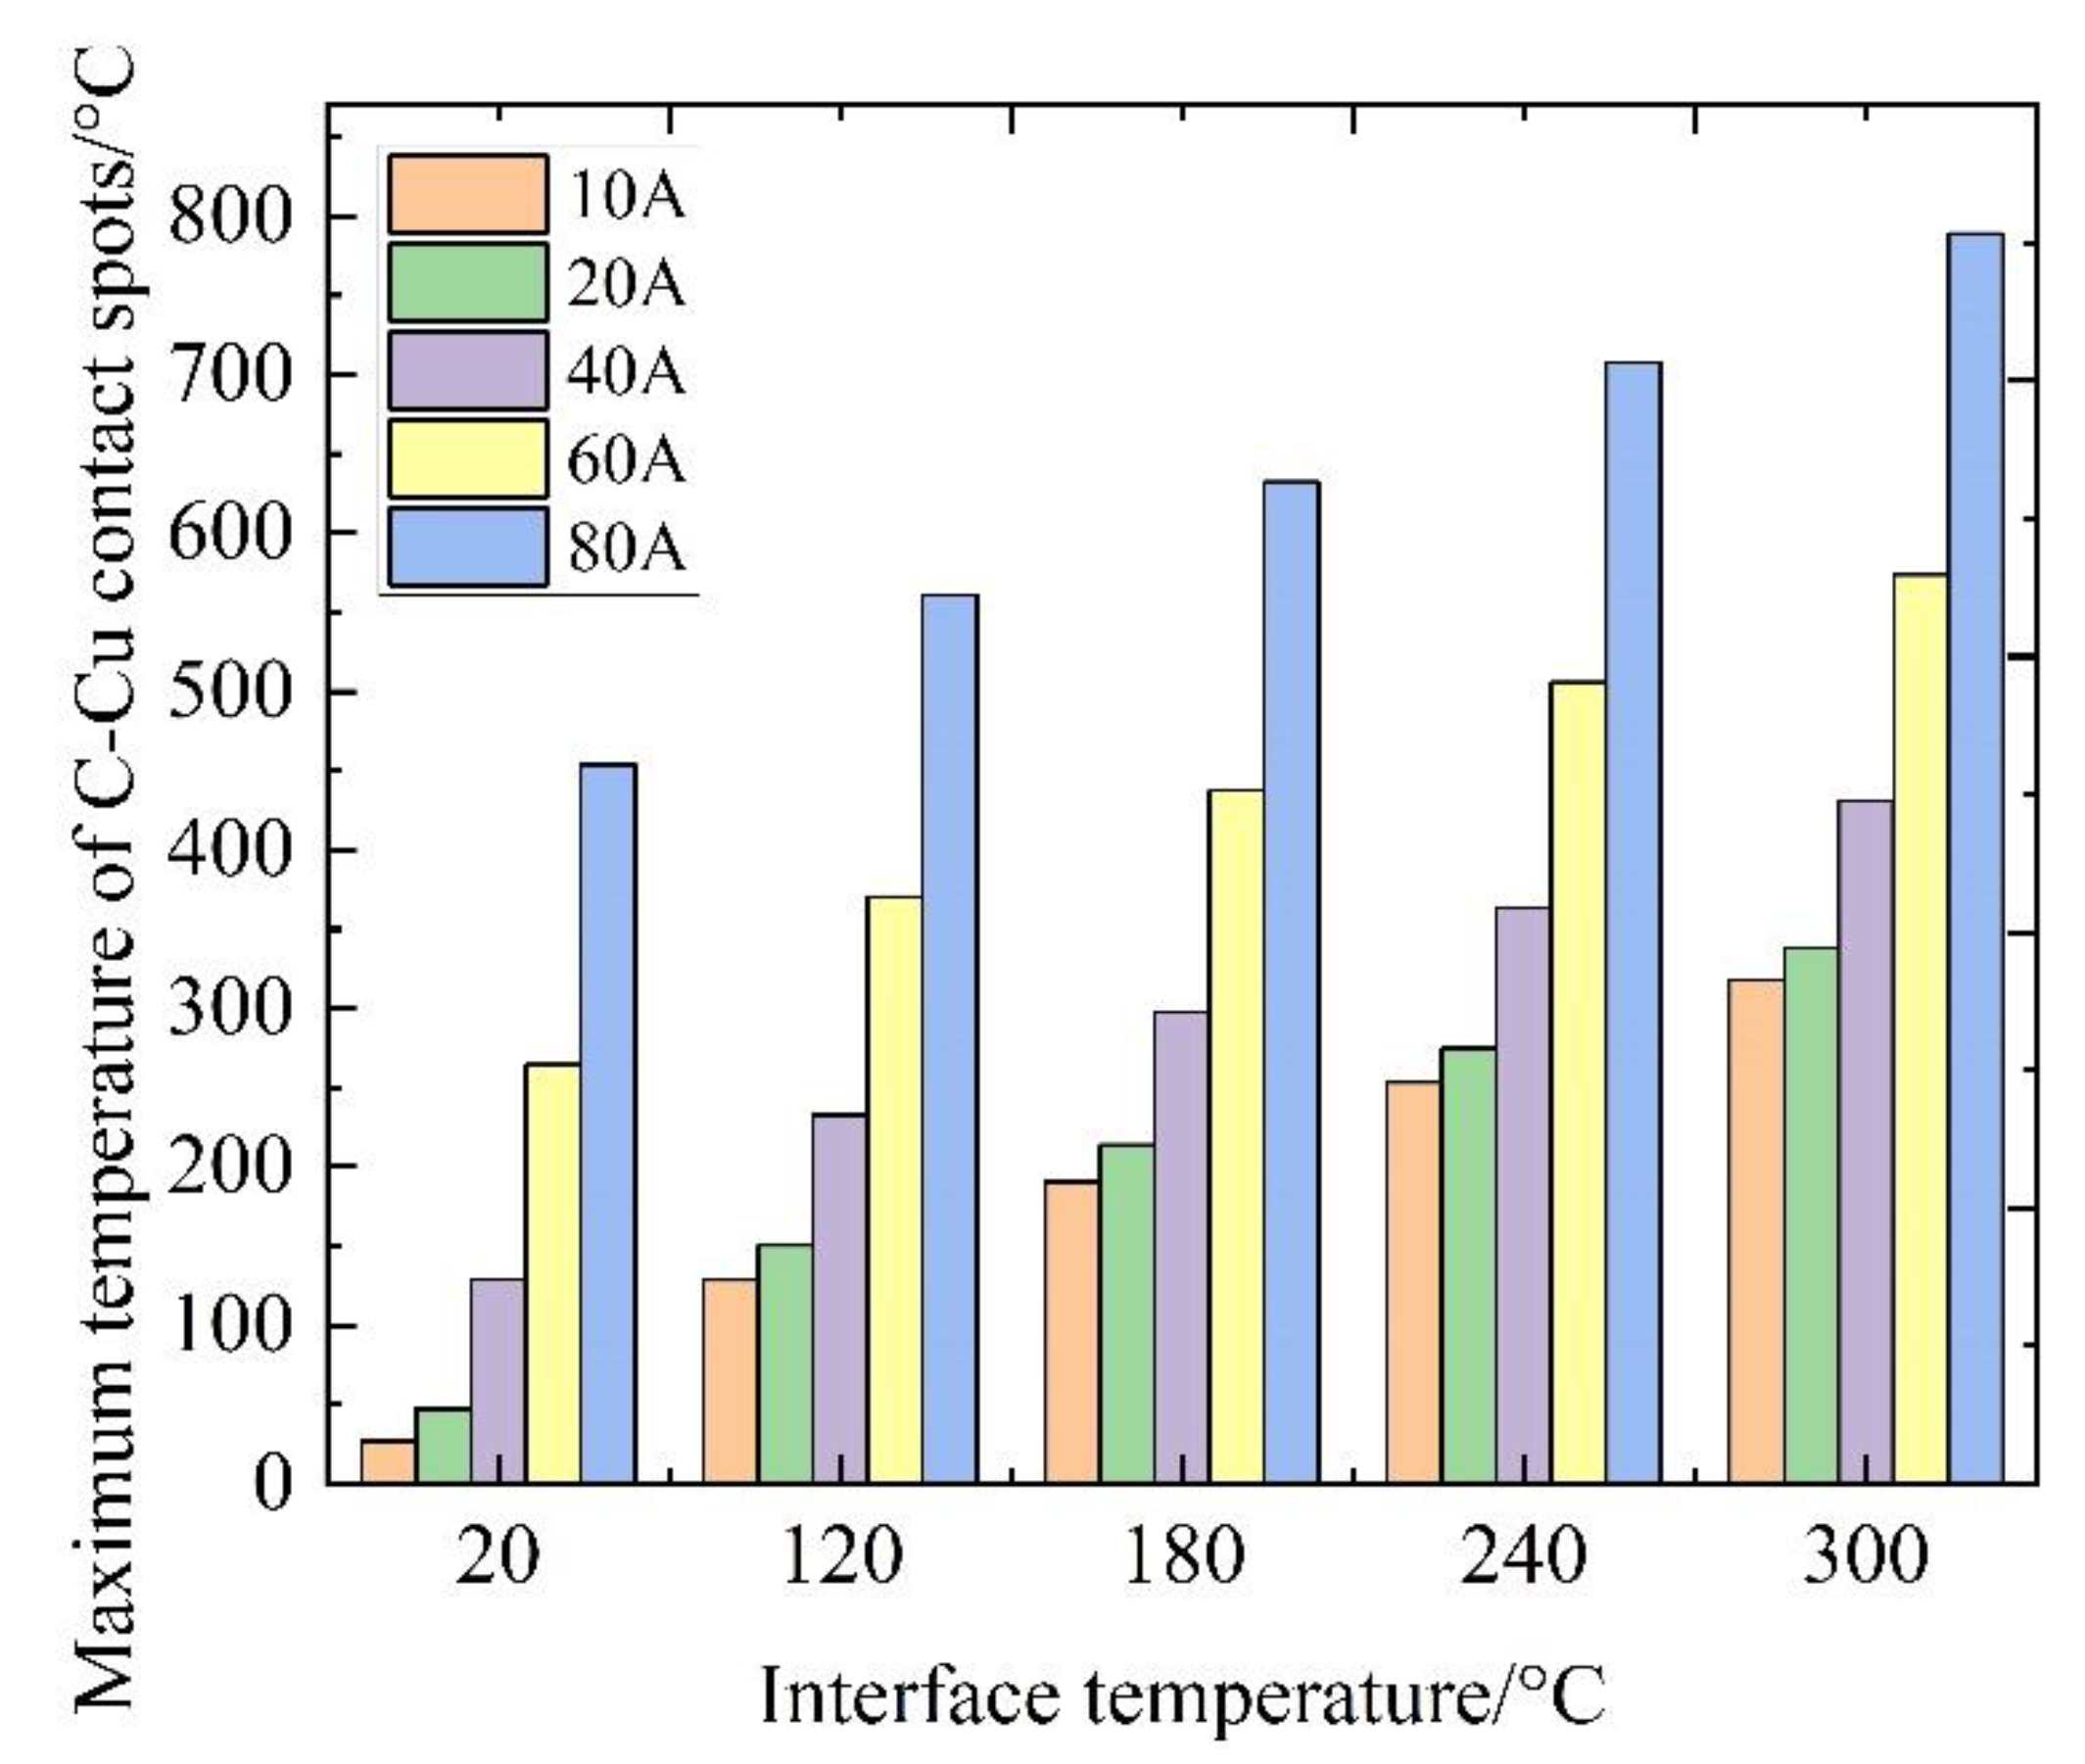
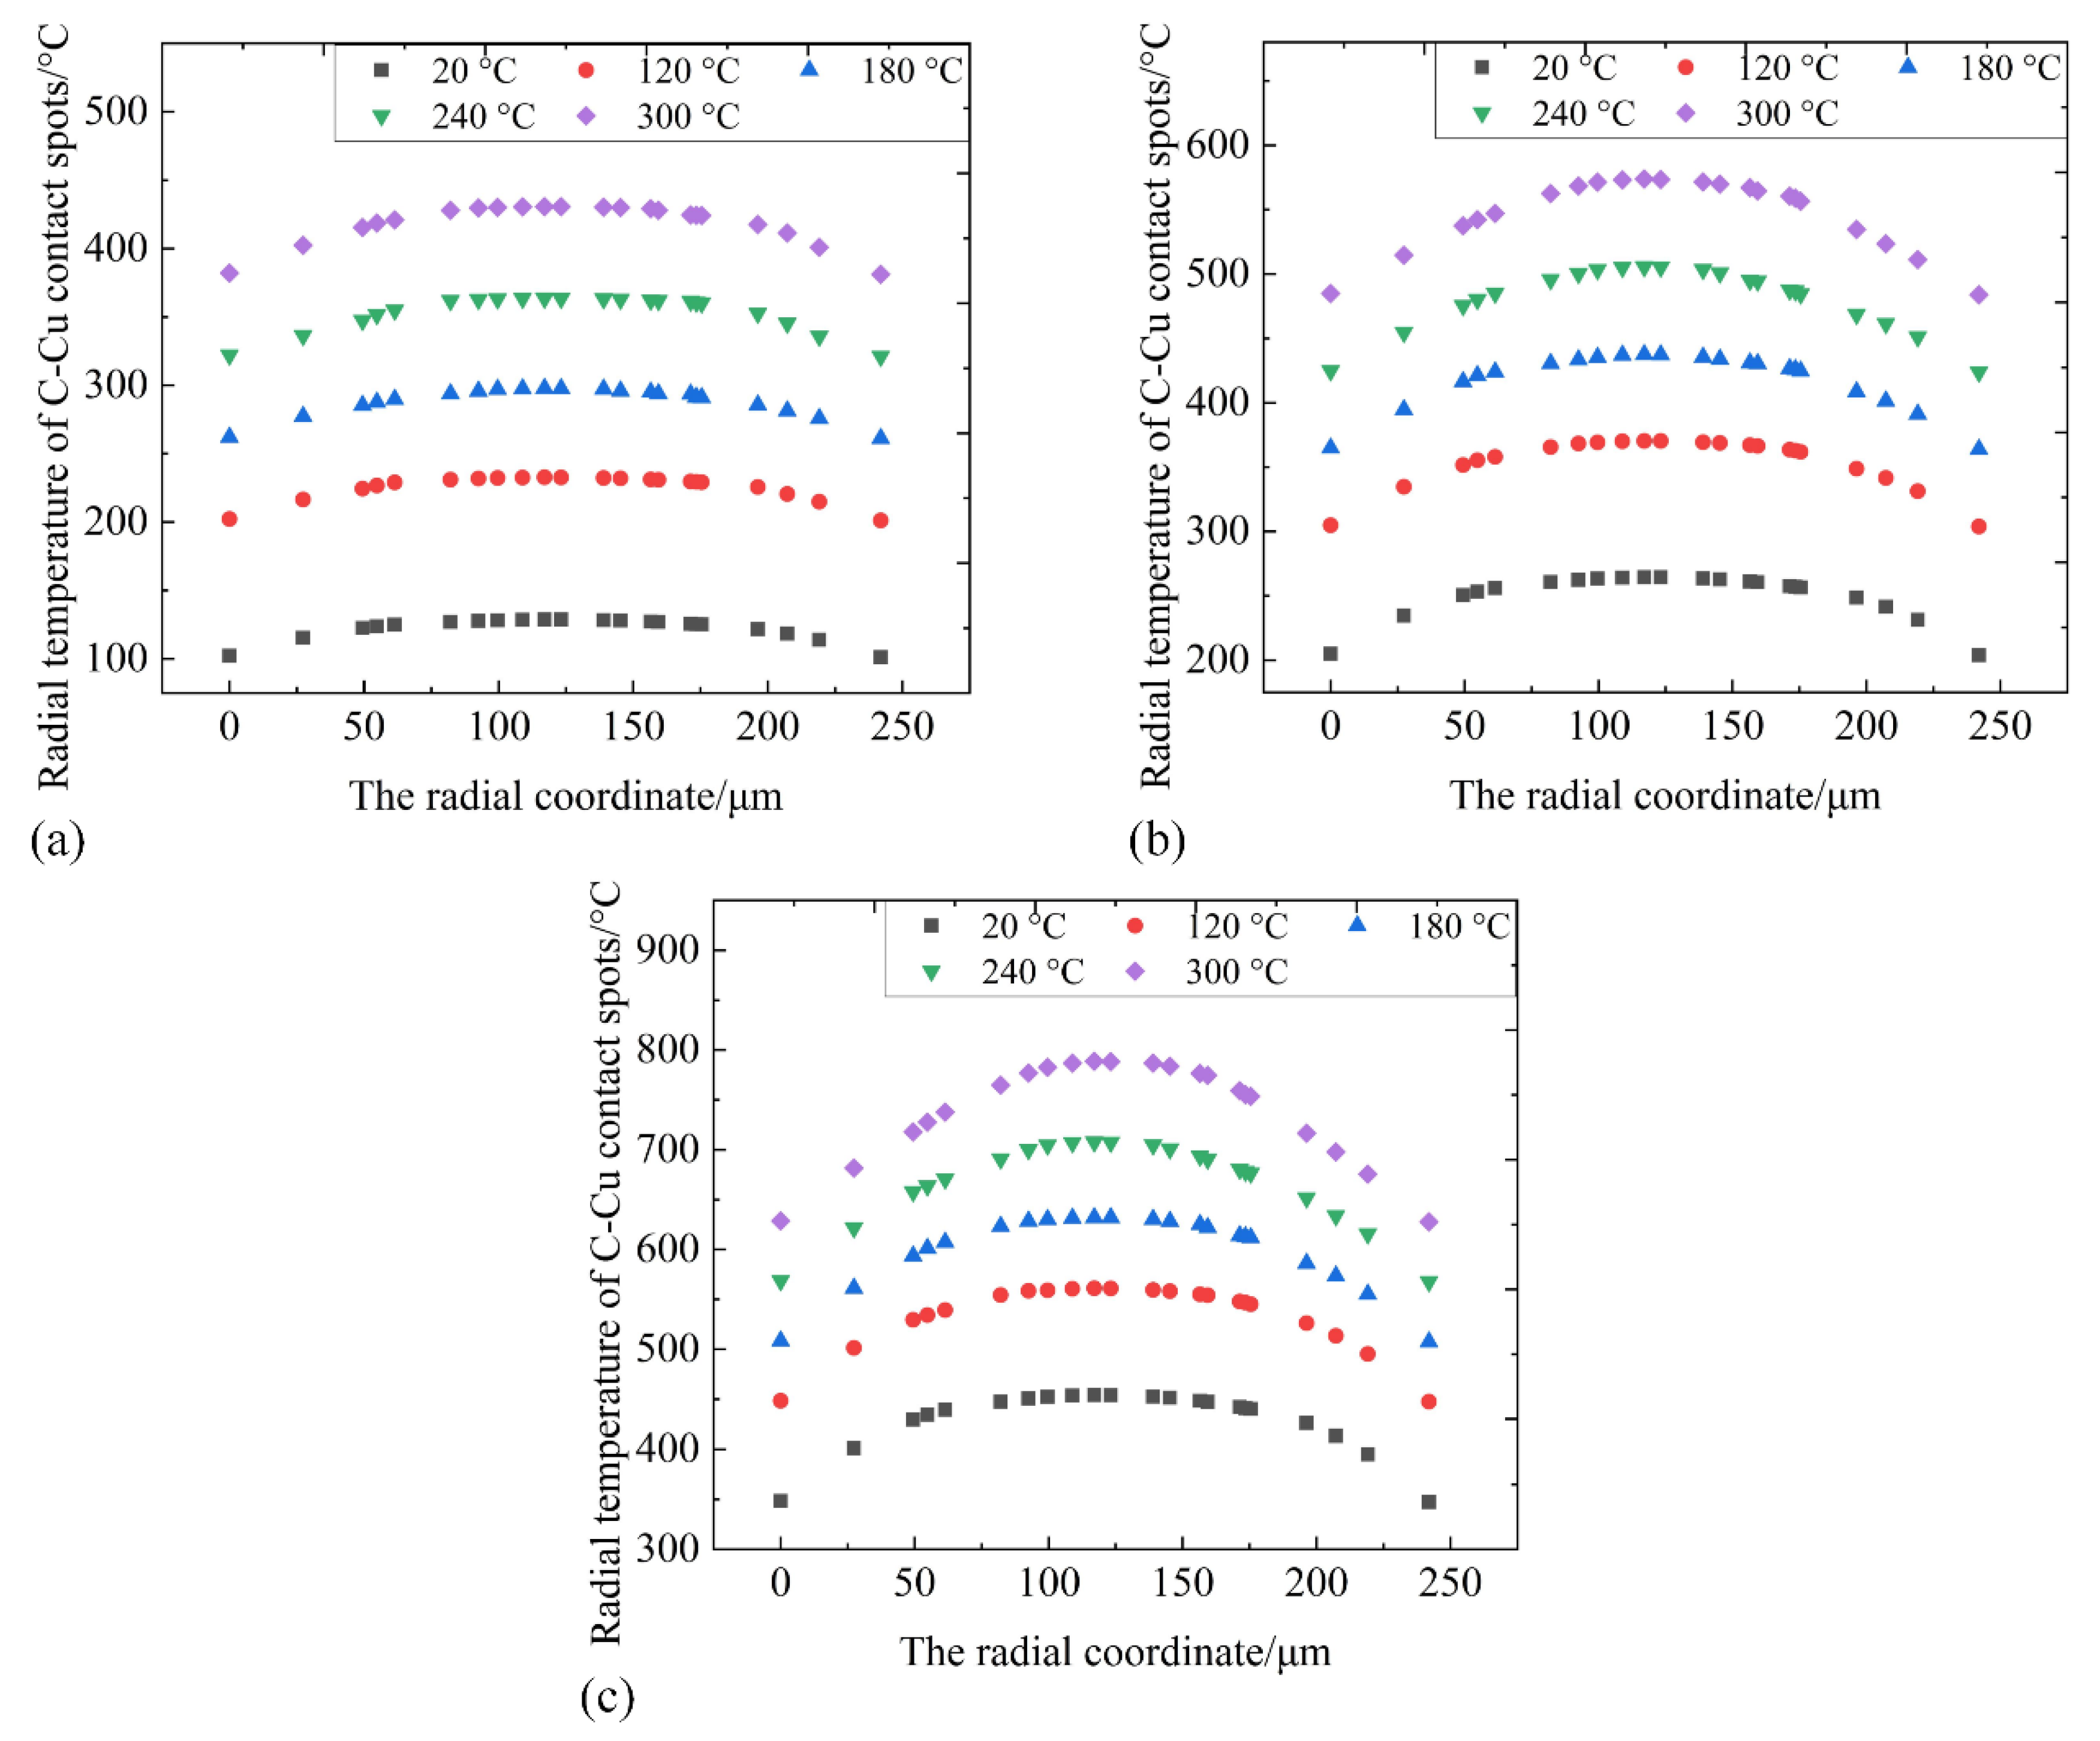
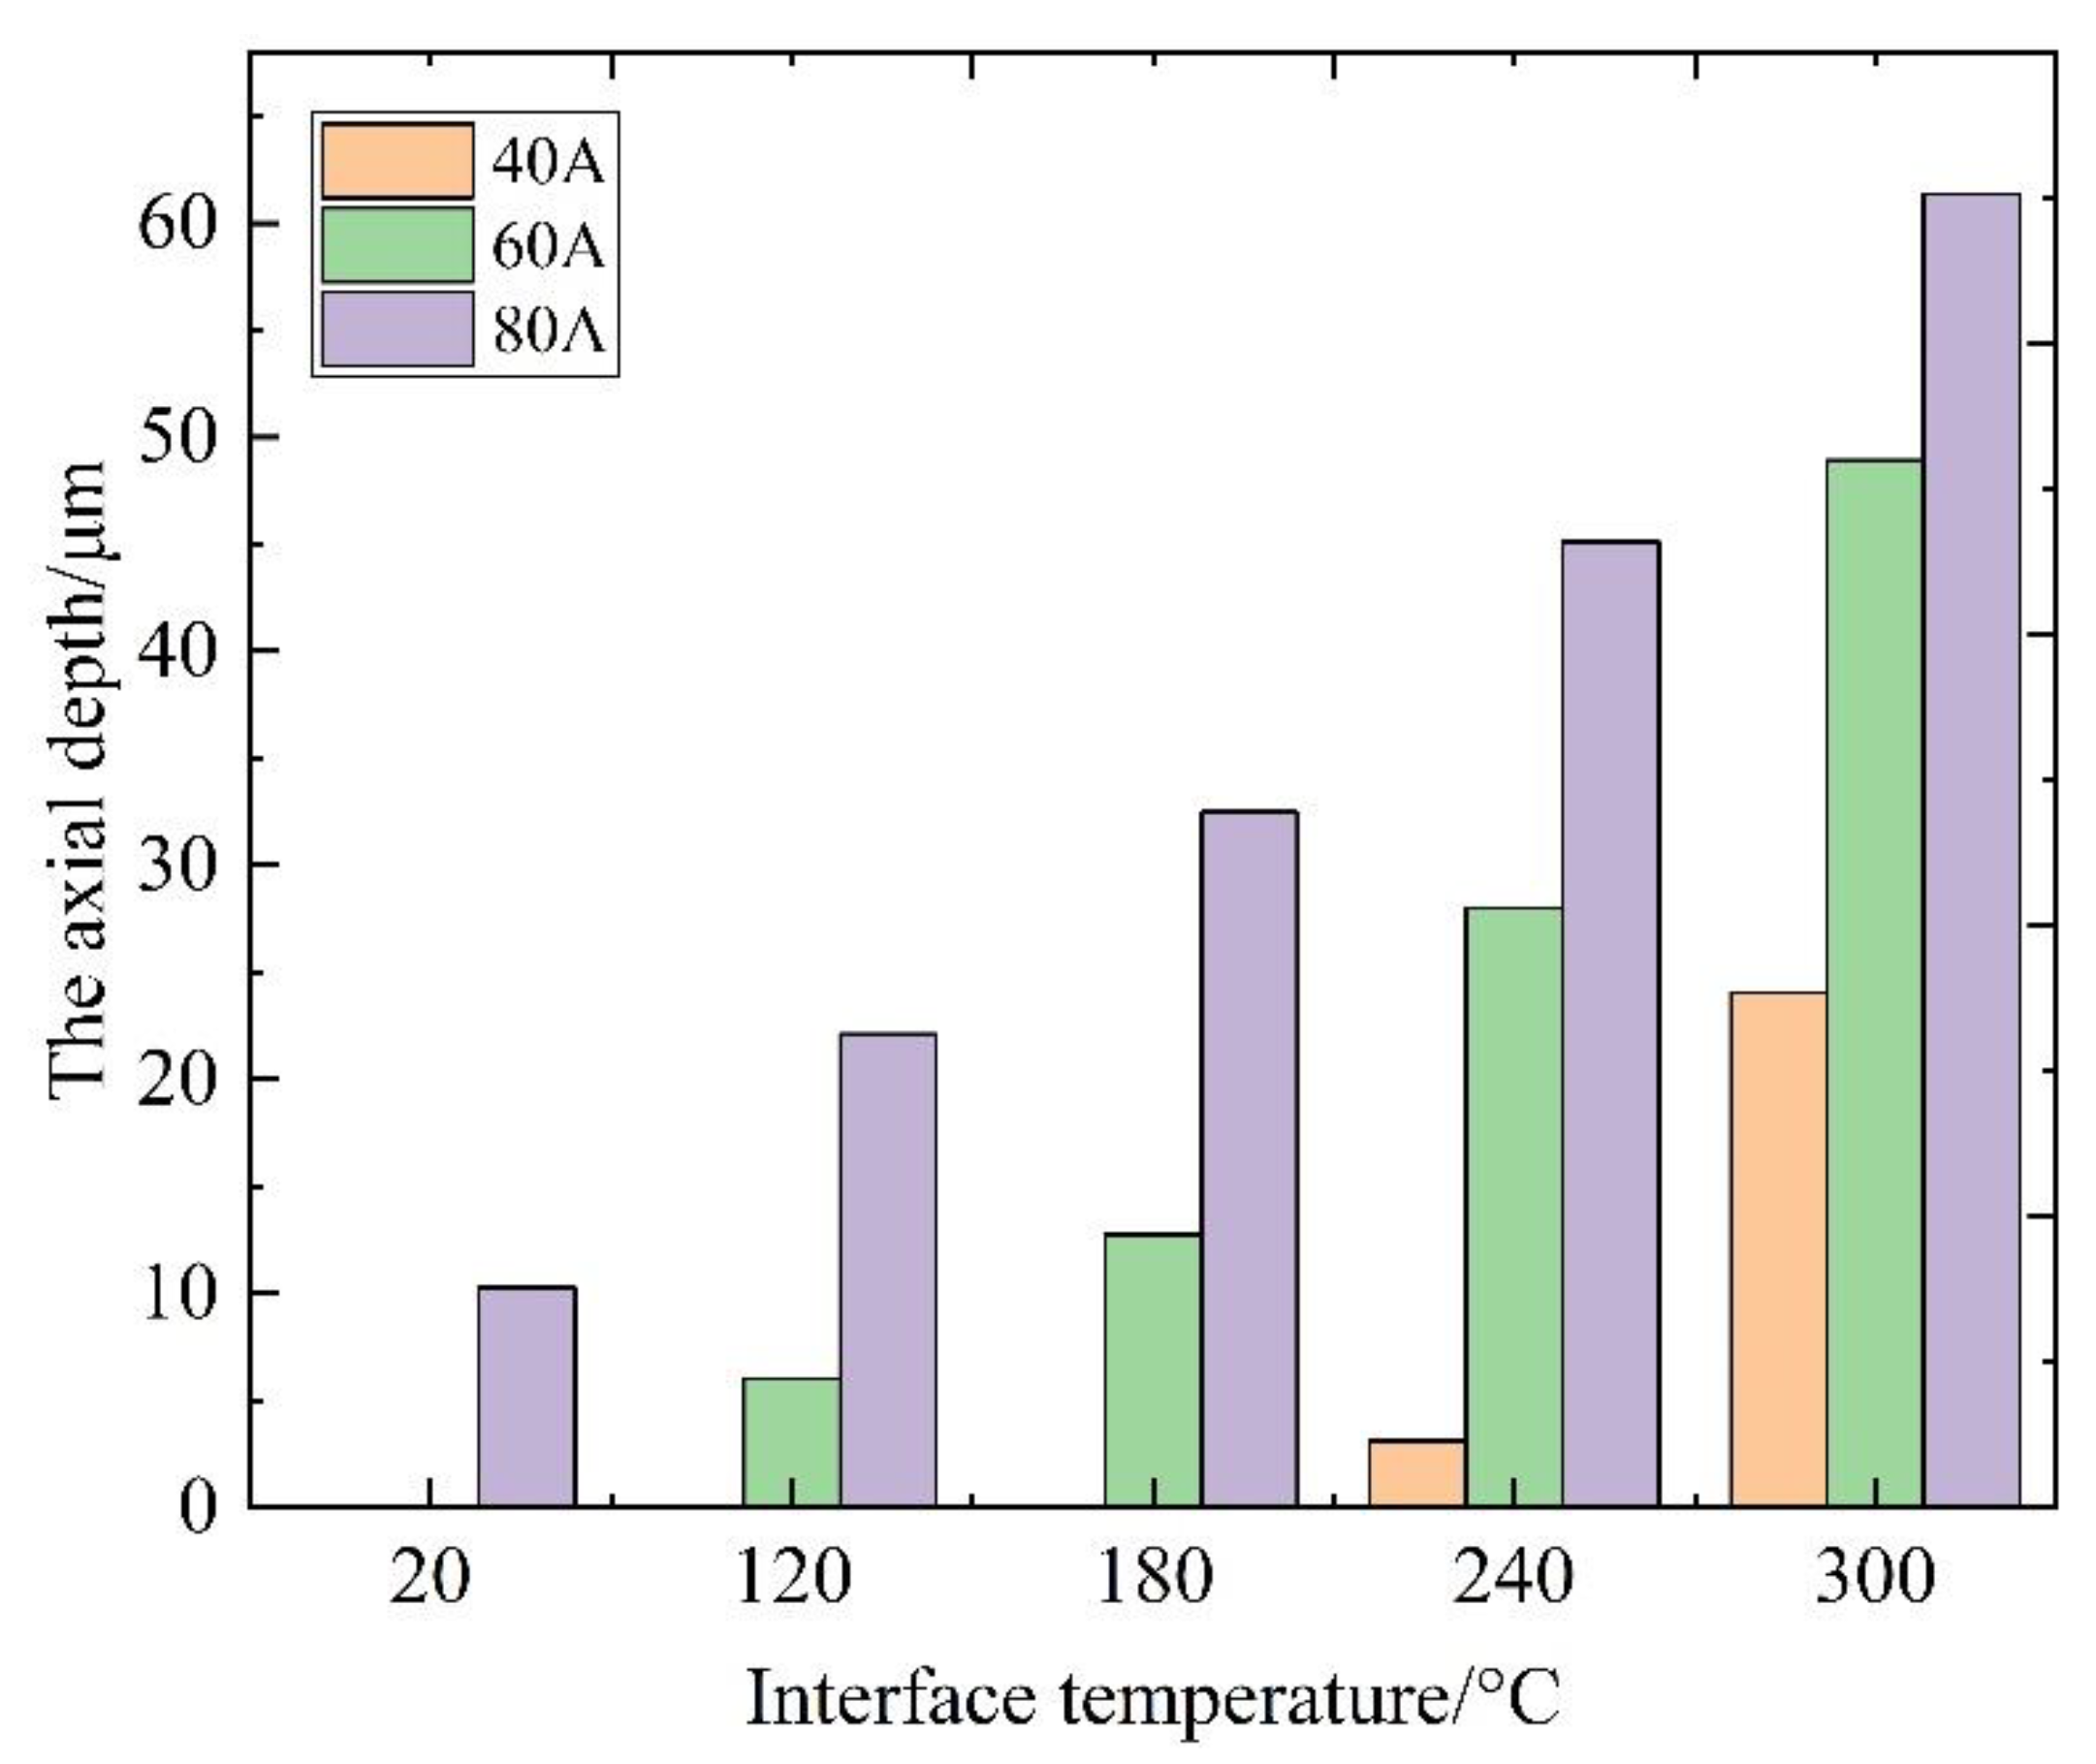
3.4.3. Analysis of Temperature Distribution Characteristics of the C-Cu Contact Spots in the Pantograph-Contact Line System

Figure 9 shows the maximum temperatures of the contact spots at different interface temperatures. It can be seen from Figure 9 that the temperature rise in the C-Cu contact spots is the result of the joint action of interface temperature and joule heat. When the interface temperature is controlled at room temperature, the temperature rise in the contact spots is mainly provided by joule heat. Since joule heat is proportional to the square of the current, a small current increment can cause a surge in joule heat. Therefore, the maximum temperature of the C-Cu contact spots at 10 A is only 26.7 °C, while the joule heat generated by 80 A makes the maximum temperature in the C-Cu contact spots reach 453.9 °C. The maximum temperature difference between the two current conditions is nearly 20 times. When the interface temperature is controlled at 300 °C, the maximum temperature of the contact spots corresponding to the 10 A is 317.8 °C, indicating that, compared with the effect of the interface temperature, the temperature in the contact spots has significant current sensitivity. Therefore, the interface temperature has different effects on the ECR and discharge under different current conditions.
In this test, the softening temperature of the copper material is 350 °C. When the current was ≤20 A, the maximum temperature of the C-Cu contact spots did not exceed the softening temperature of copper at any interface temperature. This means that the hardness of the copper contact spots that changed with interface temperature is basically negligible. The size of the contact spots does not change significantly, and the contraction resistance is basically unchanged. The change in velamen resistance mainly affects the ECR, which is consistent with the change rule of the DECR in Figure 4a. When the current is higher than 40 A, the maximum temperature of the contact spots exceeds the copper softening temperature with the rise in interface temperature. The radial and axial temperature distributions of the contact spots should be further considered to analyze the change in the contraction resistance caused by the softening deformation of copper spots.
Figure 10 shows the radial temperature distribution on the surface of the contact spots in the current range of 40–80 A. The estimated diameter of a single contact spot is about 242 μm. At the same interface temperature, the greater the current, the greater the radial temperature gradient on the contact spots. At 40 A, when the interface temperature reaches 240 °C, only the temperature at the center of contact spots reaches the softening temperature, and the change in the contraction resistance is weak. However, when the interface temperature reaches 300 °C, the whole surface of the contact spots reaches the softening temperature. The deformation increases the surface area of the contact spots and decreases the contraction resistance. Therefore, in Figure 3a, 240 °C is the turning point of the various trends for the AECR at 40 A. When the current is higher than 60 A, the surface temperature on the contact spots is higher than the softening temperature of the copper material, except the interface temperature is room temperature. Under the condition of 80 A at 300 °C, the surface temperature of the contact spots is about twice as much as the softening temperature. In the above case, the influence of the reduction in the contraction resistance caused by material softening on ECR comes into play. The increment in velamen resistance with the increase in the interface temperature is small, as shown in Table 3 and Table 4, so the AECR decreases with the increase in the interface temperature within the current range of 60–80 A, as shown in Figure 3a.
The axial temperature distribution of the contact spots determines the degree of the softening deformation of the contact spots. Figure 11 shows the axial depth at which the contact spot reaches the copper softening temperature at different interface temperatures within the current range of 40–80 A. As can be seen from Figure 11, the axial depth that reaches the softening temperature gradually increases with the increase in the interface temperature, and the maximum depth is up to 61.35 μm. At 60 A, with the increase in interface temperature, the rate of temperature transfer to the axial depth of the contact spots is higher than in the case of 80 A. That is to say, at 60 A, the deformation of the copper spots with interface temperature is more obvious. Therefore, the ECR decreases at a higher rate at 60 A.
The chemical reaction on the surface of contact spots at a high temperature is also an important factor leading to changes in the ECR and interface discharge. The effect of copper oxidation on ECR has been analyzed in the previous section. According to the temperature distribution in Figure 10, two other chemical reactions occur on the surface of the contact spots. The first is the oxidation reaction of carbon materials. As an electronegative gas, the breakdown field strength of the CO2 gas generated by the oxidation reaction of carbon materials is much higher than that of air [28]. In general, the initial oxidation temperature of pyrolytic carbon is 400 °C. Pyrolytic carbon enters the intensive oxidation stage at about 600 °C, and the oxidation rate usually reaches its maximum at around 1200 °C [29]. At 40 A, only the interface temperature reaches 300 °C, and the central area of the contact spot reaches the oxidation temperature of the carbon material. At this time, the oxidation rate is low, and the CO2 produced by oxidation is little. At 60 A, when the interface temperature is higher than 180 °C, the contact spots reach the carbon oxidation temperature. The surface temperature of contact spots increases with the increase in the interface temperature, and the oxidation rate increases, but the temperature of the contact spots never reaches the intensive oxidation temperature. Therefore, the CO2 generated near the C-Cu contact area can only slow down the decreasing rate of the breakdown field strength caused by the temperature rise. Specifically, in Figure 6 at 60 A, the rising rate of discharge frequency first increases and then slows down, and the decreasing rate for the average single discharge energy first increases and then slows down. At 80 A, when the interface temperature is at room temperature, the contact spot temperature reaches the carbon oxidation temperature, and when the interface temperature rises to 180 °C, the contact spots enter the intensive oxidation state. A large amount of CO2 is generated and effectively improves the breakdown field strength of the gas near the C-Cu contact area. Therefore, as shown in Figure 6 the discharge frequency at 80 A increases first and then decreases, and the average single discharge energy decreases first and then increases. Secondly, the surface temperature of the contact spots at 80 A and 300 °C reaches the reaction temperature (about 700–800 °C), at which carbon reacts with copper oxide to generate copper. The reduction reaction inhibits the generation of copper oxide. Therefore, the content of copper oxide on the carbon surface at 80–300 °C in Table 3 and Table 4 is only slightly higher than that at 80 A and room temperature. In other words, the velamen resistance has a weak influence on ECR under high current conditions.

3.5. Influence of the Interface Temperature on the Surface Morphology of the Carbon Slider under Different Currents

Figure 12 shows the 3D morphologies and surface roughness of the carbon slider at different interface temperatures. It was found that the valleys in 3D morphologies are mainly caused by discharge erosion. Compared with 10 A, the difference between peak and valley at 80 A is more significant, indicating that the intensified discharge leads to a rougher contact surface. By observing surface roughness, Ra, it was found that, with the rise in interface temperature, there are two opposite trends under the currents of 10 A and 80 A. The surface roughness, Ra, increases from 0.2572 μm to 0.3058 μm with the rise in interface temperature at 10 A, increasing by 18.9%, and it decreased from 0.6159 μm to 0.4662 μm, decreasing by 24.4% at 80 A. According to the 3D morphologies, with the rise in interface temperature at 10 A, the area of the individual valley decreases, but the number of valleys increased significantly. The total area of the valleys in the observed area does not change significantly, indicating that the increase in roughness is mainly caused by the increase in the number of discharge erosion pits. In the sliding electrical contact process, higher roughness corresponds to less actual contact area, so the increase in roughness at 10 A is another reason for the increase in the ECR. At 80 A, the total area of the valleys decreases obviously with the rise in the interface temperature, and the surface roughness decreases accordingly, which leads to a lower ECR at 80 A and 300 °C.

4. Conclusions

In this work, the variation in the ECR and discharge at the C-Cu interface with interface temperature was studied. According to the quantitative analysis of the interface components and the temperature distribution of the C-Cu contact spots, the essential reasons for the change in ECR and discharge with interface temperature were explored. The relevant conclusions are as follows:
(1)
When the current is ≤20 A, the AECR shows an upward trend with the rise in interface temperature; the DECR fluctuates around 75 mΩ, and the amplitude of the DECR increases. High temperature promotes the increase in copper oxide at the interface, but the temperature at the contact spots does not reach the softening temperature of the copper material. The increase in the velamen resistance is the main reason for the increase in the ECR;
(2)
When the current is ≥60 A, the AECR decreases with the rise in interface temperature; the DECR shifts downward, and the amplitude decreases. The temperature at the contact spots exceeds the softening temperature of the copper material. The contact spots soften, and the contraction resistance decreases. However, the rate of formation and spalling of the oxide film increases synchronously, and the velamen resistance remains constant with the rise in interface temperature. Therefore, the ECR is mainly determined by the contraction resistance;
(3)
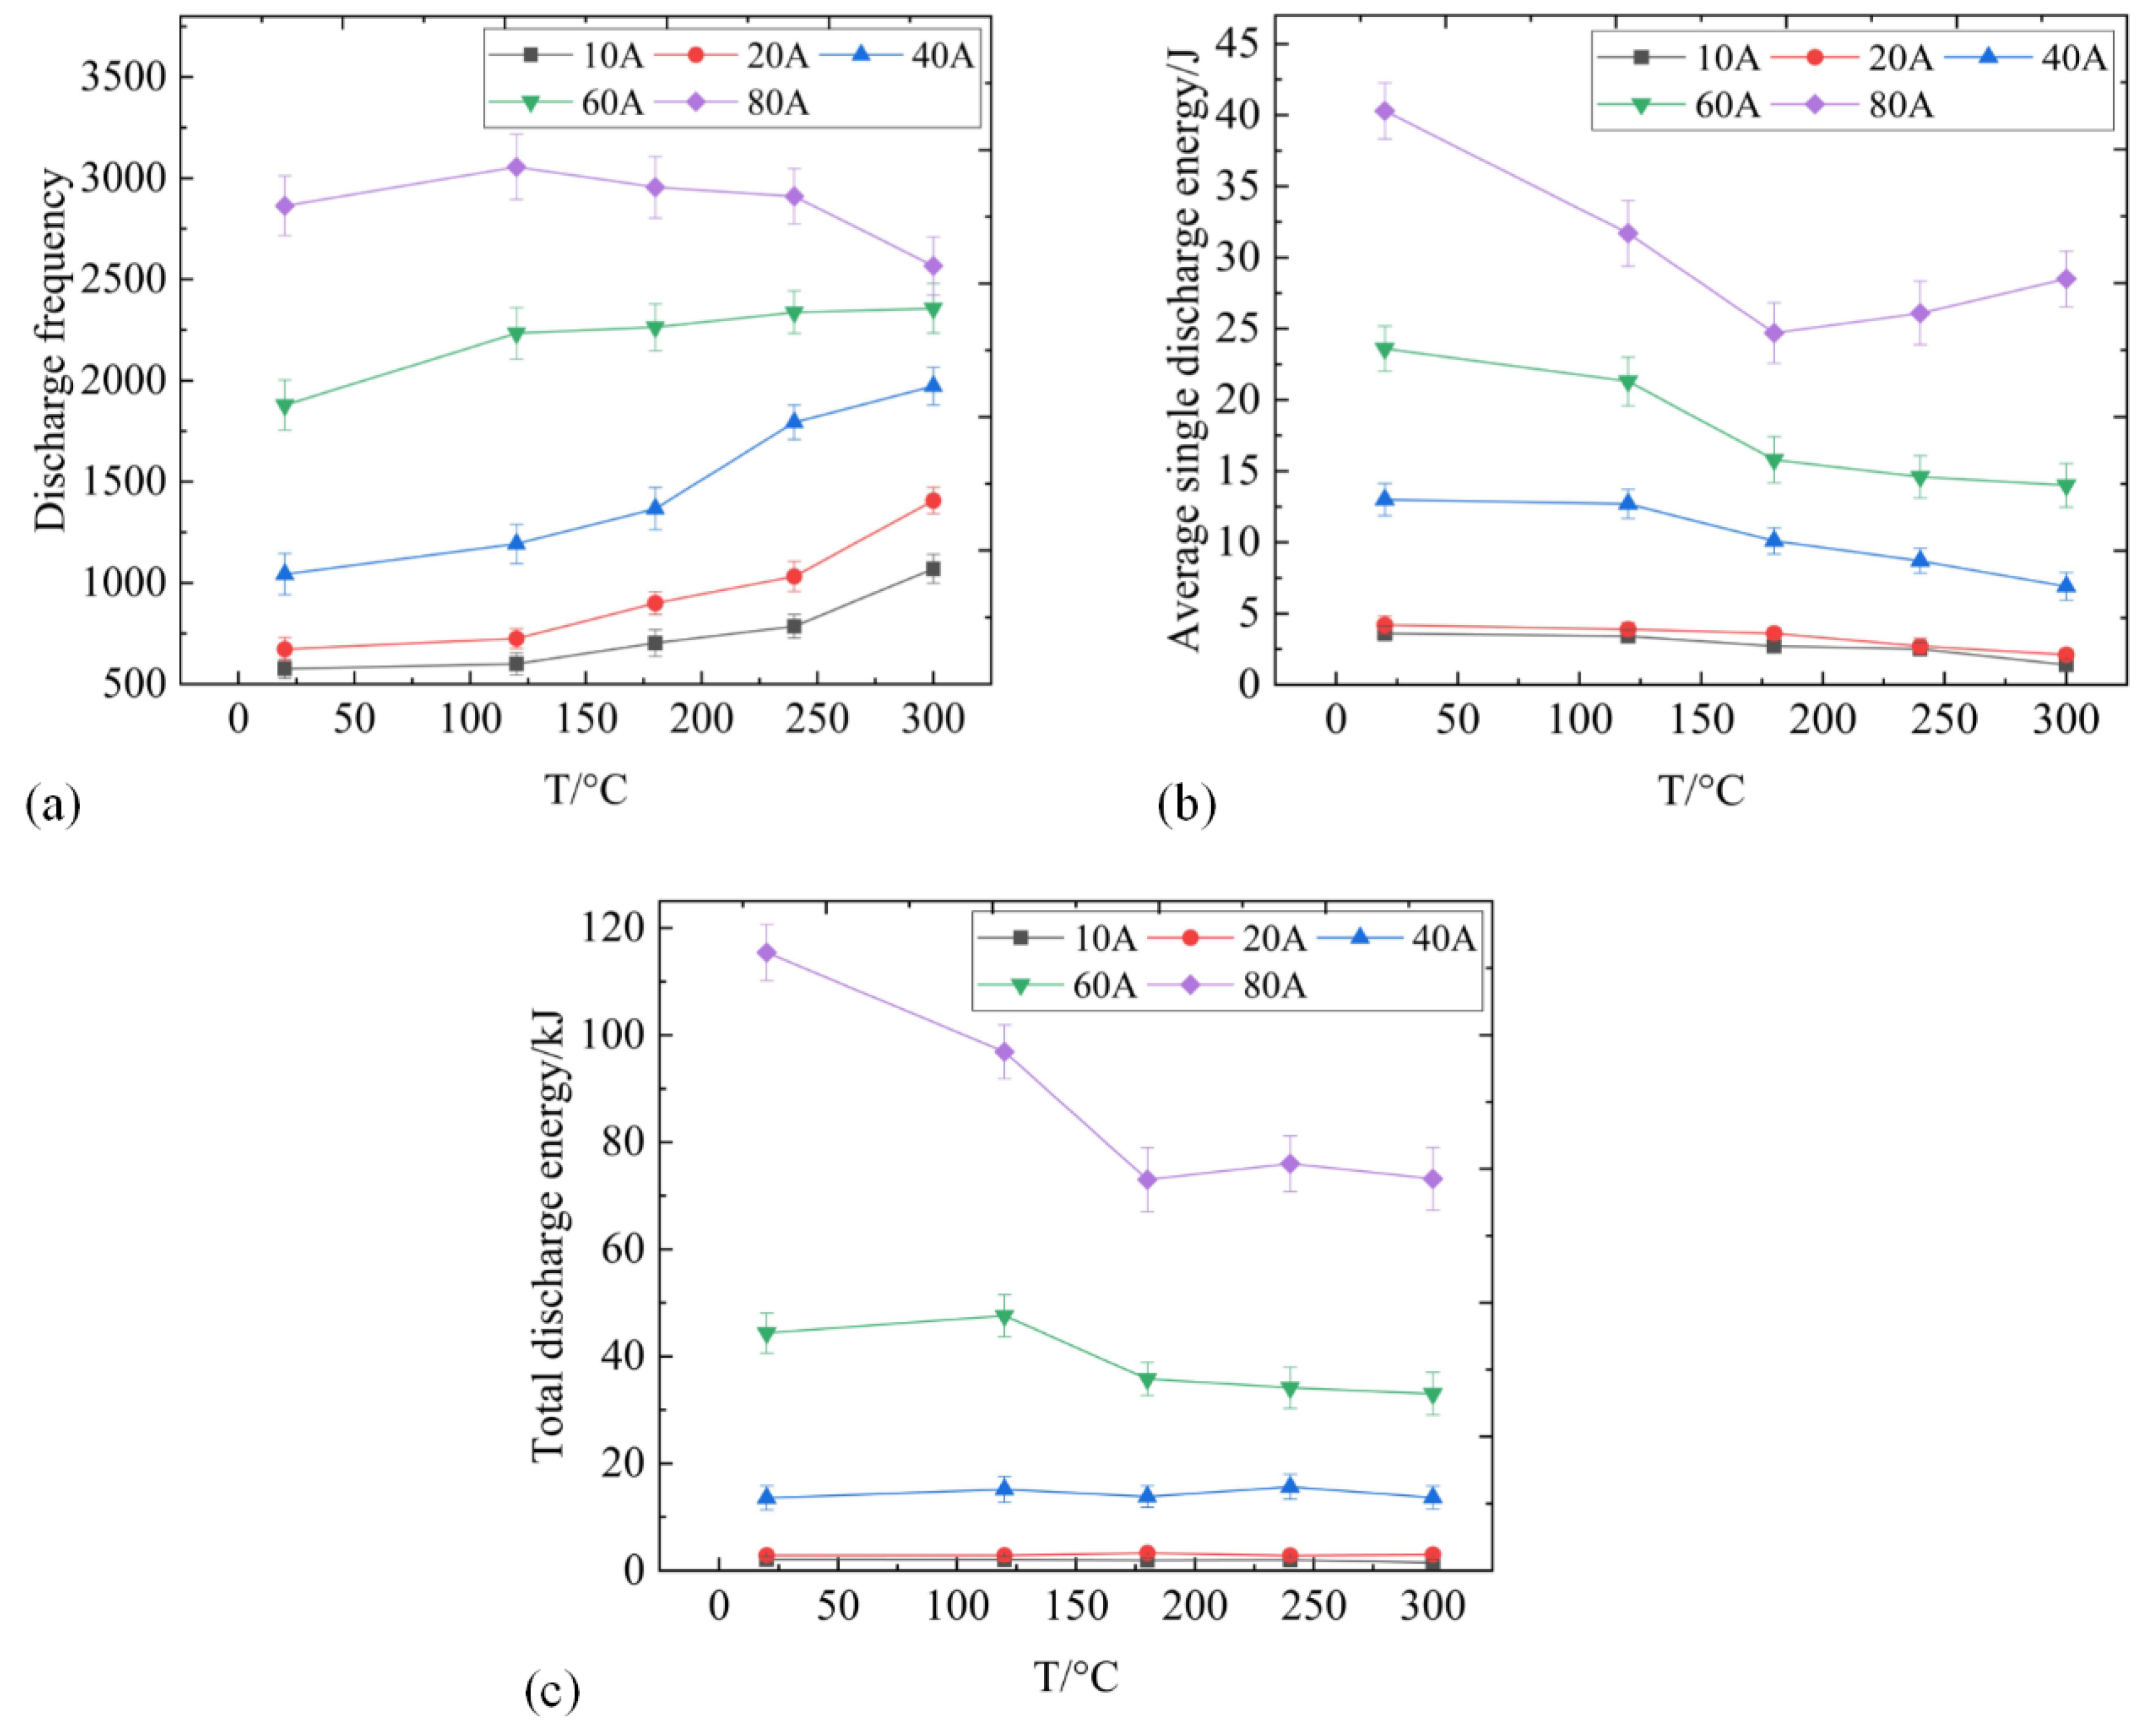
When the current is ≤60 A, the single discharge energy decreases, and the discharge frequency increases with the rise in interface temperature. The reason is that the interface temperature is transmitted to the surrounding air; the thermal movement of gas molecules is intensified, and the breakdown voltage drops;
(4)
When the current reaches 80 A, the single discharge energy presents a V-shaped distribution with interface temperature, and the minimum point appears at 180 °C. A large amount of CO2 generated by the carbon material’s intense oxidation increases the breakdown field strength of the air around the contact interface, which is the main reason for the increase in the single discharge energy after 180 °C;
(5)
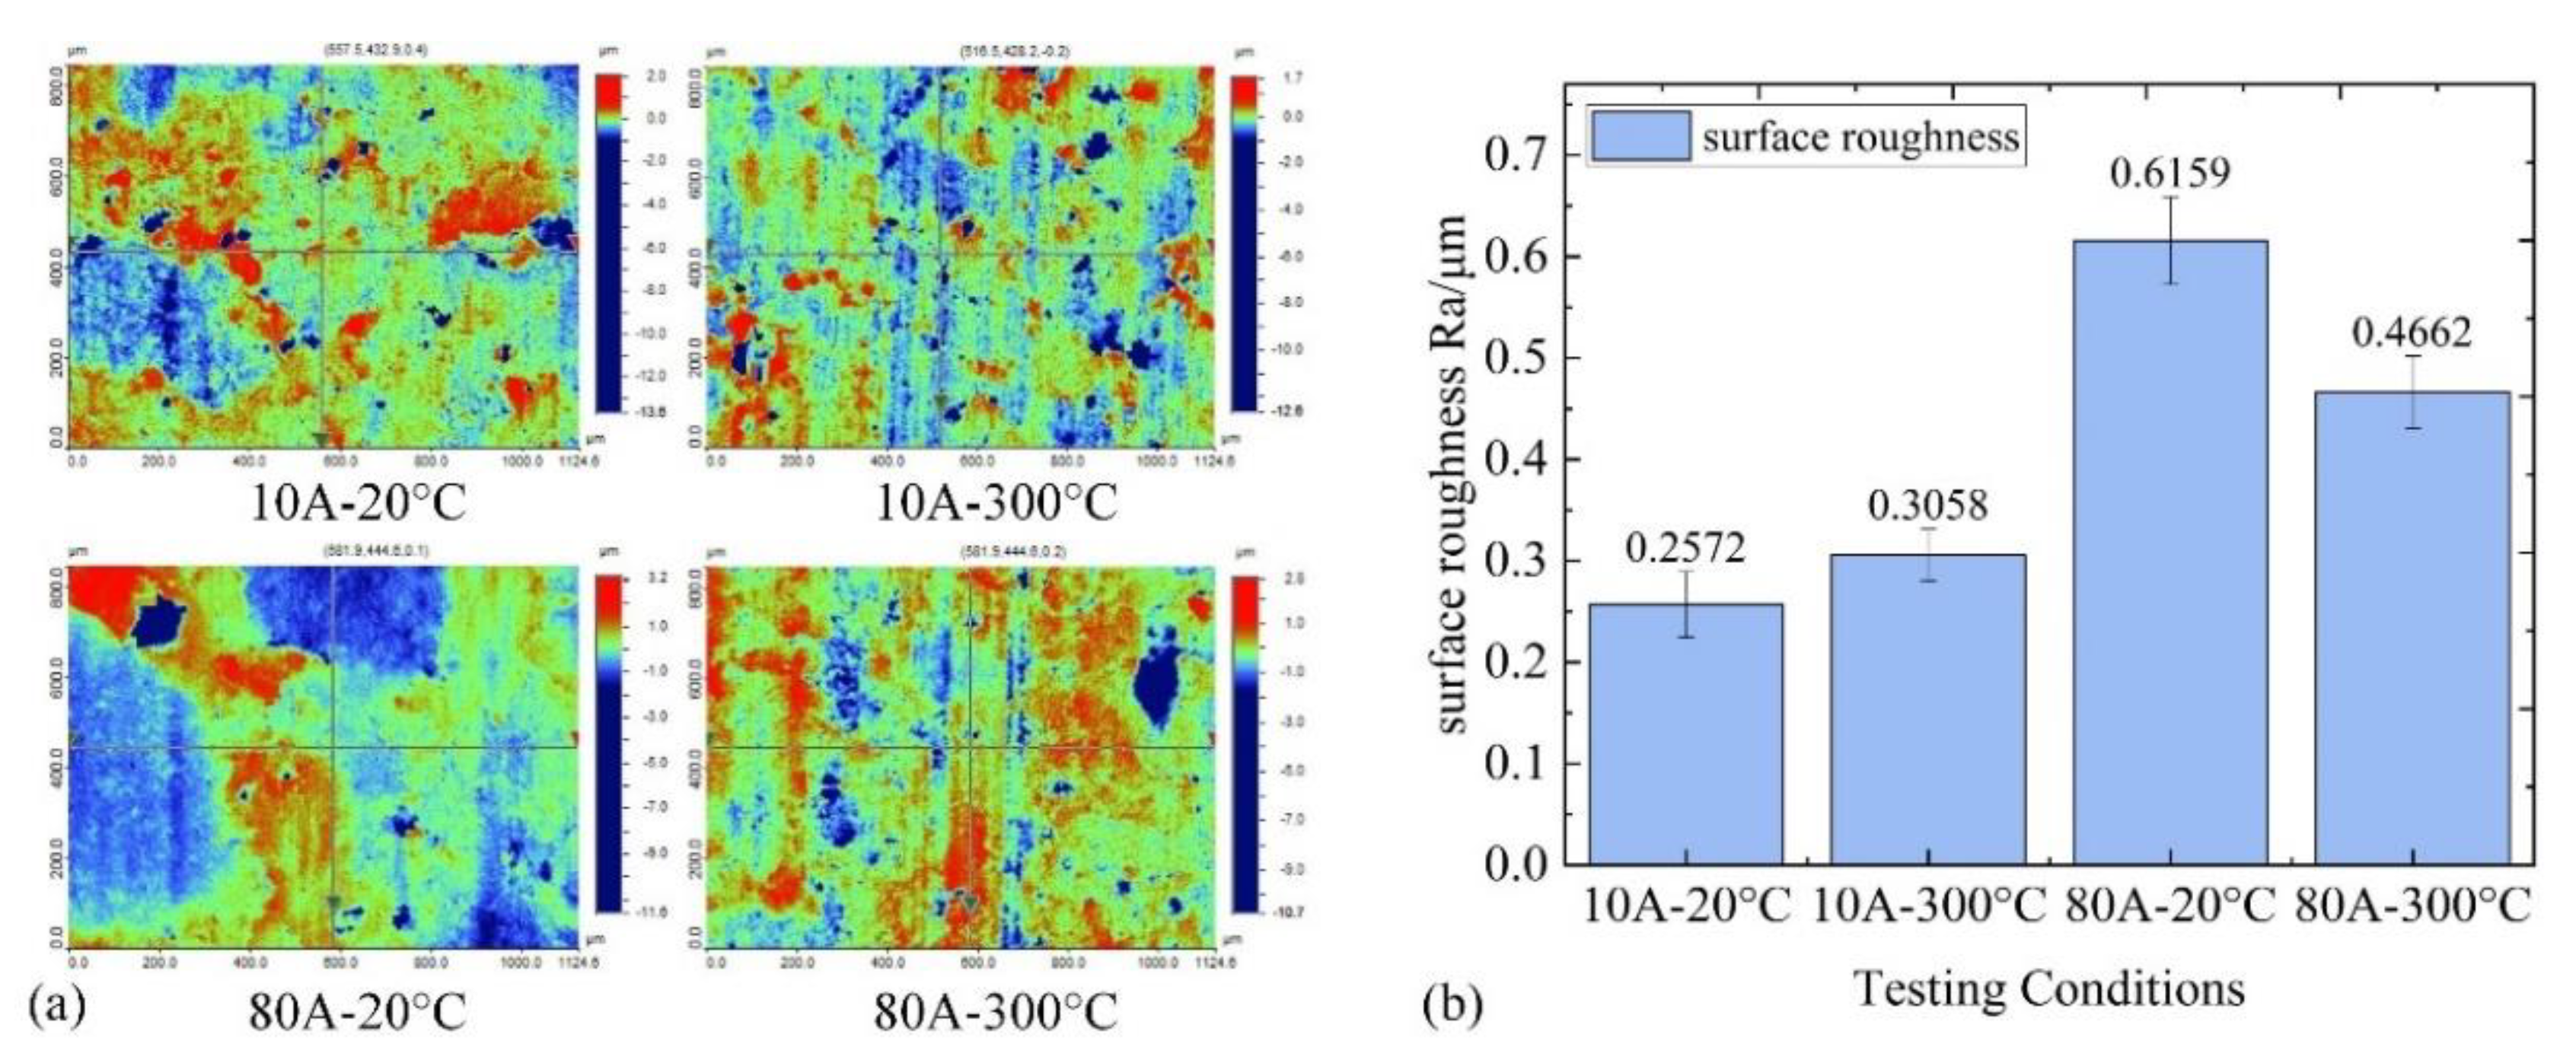
When the current is 10 A with rising interface temperature, the size of the discharge erosion pits decreases, the number of erosion pits increases on the carbon surface, and the surface roughness, Ra, increases by 18.9%. When the current is 80 A, the size of the erosion pits decreases significantly with the rise in interface temperature, and the surface roughness, Ra, decreases by 24.4%.

Author Contributions

Conceptualization, H.W., G.G., Q.W. and G.W.; Data curation, H.W., Y.M. and K.D.; Formal analysis, H.W., D.L., Q.W. and Y.X.; Funding acquisition, G.G.; Investigation, H.W., D.L., Q.W., S.X., Z.X., Y.M. and Q.C.; Methodology, H.W., G.G., D.L., Z.X. and G.W.; Project administration, H.W., D.L., S.X. and K.D.; Resources, H.W.; Software, H.W., S.X., Y.X. and Q.C.; Supervision, H.W.; Validation, H.W., Q.W. and Y.X.; Visualization, H.W., D.L. and Q.W.; Writing—original draft, H.W.; Writing—review & editing, D.L. All authors have read and agreed to the published version of the manuscript.

Funding

This project is supported by the National Natural Science Foundation of China (No. 51922090, 51837009, and U19A20105), the Smart Grid Joint Fund and the National Natural Science Foundation of China (U1966602), and the Technology Project of Headquarter of SGCC (5500-202158104A-0-0-00).

Institutional Review Board Statement

Not applicable.

Informed Consent Statement

Not applicable.

Data Availability Statement

The data presented in this study are available on request from the corresponding author.

Conflicts of Interest

The authors declare no conflict of interest.

References

  1. Xu, Z.; Gao, G.; Wei, W.; Yang, Z.; Xie, W.; Dong, K.; Ma, Y.; Yang, Y.; Wu, G. Characteristics of pantograph-catenary arc under low air pressure and strong airflow. High Volt. 2021, 7, 369–381. [Google Scholar] [CrossRef]
  2. Chen, Q.C.; Yang, Z.F.; Lin, J.H.; Wei, W.; Li, H.; Yin, G.; Liu, Y.; Li, P.; Tu, C. Scalable, low-cost, and environment-friendly preparation of high strength car-bon-matrix composites with tree-root-like structured reinforcements. Compos. Commun. 2022, 32, 101149. [Google Scholar] [CrossRef]
  3. Li, S.; Yang, X.; Kang, Y.; Li, Z.; Li, H. Progress on Current-Carry Friction and Wear: An Overview from Measurements to Mechanism. Coatings 2022, 12, 1345. [Google Scholar] [CrossRef]
  4. Gao, G.; Hao, J.; Wei, W.; Hu, H.; Zhu, G.; Wu, G. Dynamics of Pantograph–Catenary Arc During the Pantograph Lowering Process. IEEE Trans. Plasma Sci. 2016, 44, 2715–2723. [Google Scholar] [CrossRef]
  5. Bouchoucha, A.; Chekroud, S.; Paulmier, D. Influence of the electrical sliding speed on friction and wear processes in an electrical contact copper–stainless steel. Appl. Surf. Sci. 2004, 223, 330–342. [Google Scholar] [CrossRef]
  6. Yang, X.-Z.; Li, S.-B.; Cui, Y.; Kang, Y.-Q.; Li, Z.-Y.; Li, H.-W.; Dong, H. Measurement and Interpretation of the Effect of Electrical Sliding Speed on Contact Characteristics of On-Load Tap Changers. Coatings 2022, 12, 1436. [Google Scholar] [CrossRef]
  7. Liu, X.-L.; Li, Z.-H.; Hu, M.-J.; Zhou, C.-W.; Xiao, Q.; Yang, W.-B.; Chen, D.-Y. Research on the wear properties of carbon strips and contact wires at frigid temperatures. Wear 2021, 486–487, 204122. [Google Scholar] [CrossRef]
  8. Shangguan, B.; Zhang, Y.; Xing, J.; Sun, L.; Chen, Y. Comparative Study on Wear Behaviors of Metal-Impregnated Carbon Material and C/C Composite under Electrical Sliding. Tribol. Trans. 2010, 53, 933–938. [Google Scholar] [CrossRef]
  9. Yang, H.; Chen, G.; Gao, G.; Wu, G.; Zhang, W. Experimental research on the friction and wear properties of a contact strip of a pantograph–catenary system at the sliding speed of 350 km/h with electric current. Wear 2014, 332–333, 949–955. [Google Scholar] [CrossRef]
  10. Li, L.; Tian, H.; Yun, Q.; Chu, W. Study on temperature rise distribution of contact surface under cyclic load. Proc. Inst. Mech. Eng. Part J J. Eng. Tribol. 2020, 235, 138–148. [Google Scholar] [CrossRef]
  11. Qin, W.; Jin, X.; Kirk, A.; Shipway, P.; Sun, W. Effects of surface roughness on local friction and temperature distributions in a steel-on-steel fretting contact. Tribol. Int. 2018, 120, 350–357. [Google Scholar] [CrossRef]
  12. Costica, N. Thermal analysis of electrical contacts from pantograph–catenary system for power supply of electric vehicles. Electr. Power Syst. Res. 2013, 96, 211–217. [Google Scholar]
  13. Vogler, M.; Sheppard, S. Electrical contact resistance under high hoards and elevated temperatures. Weld. J. 1993, 72, 231–298. [Google Scholar]
  14. Geslain, E.; Rogeon, P.; Pierre, T.; Pouvreau, C.; Cretteur, L. Coating effects on contact conditions in resistance spot weldability. J. Mater. Process. Technol. 2018, 253, 160–167. [Google Scholar] [CrossRef]
  15. Biele, L.; Schaaf, P.; Schmid, F. Specific Electrical Contact Resistance of Copper in Resistance Welding. Phys. Status Solidi A-Appl. Mater. Sci. 2021, 218, 2100224. [Google Scholar] [CrossRef]
  16. Chen, G.X.; Hu, Y.; Dong, B.J.; Yang, H.J.; Gao, G.Q.; Wu, G.N.; Zhang, W.H.; Zhou, Z.R. Experimental study on the temperature of the contact strip in sliding electric contact. Proc. Inst. Mech. Eng. Part J-J. Eng. Tribol. 2017, 231, 1268–1275. [Google Scholar] [CrossRef]
  17. Wang, H.; Gao, G.; Wei, W.; Yang, Z.; Yin, G.; Xie, W.; He, Z.; Ni, Z.; Yang, Y.; Wu, G. Influence of the interface temperature on the damage morphology and material transfer of C–Cu sliding contact under different current amplitudes. J. Mater. Sci. 2022, 57, 5006–5021. [Google Scholar] [CrossRef]
  18. Chen, G.; Yang, H.; Zhang, W.; Wang, X.; Zhang, S.; Zhou, Z. Experimental study on arc ablation occurring in a contact strip rubbing against a contact wire with electrical current. Tribol. Int. 2013, 61, 88–94. [Google Scholar] [CrossRef]
  19. Kaars, J.; Mayr, P.; Koppe, K. Generalized dynamic transition resistance in spot welding of aluminized 22MnB5. Mater. Des. 2016, 106, 139–145. [Google Scholar] [CrossRef]
  20. Le Gloannec, B.; Doyen, O.; Pouvreau, C.; Doghri, A.; Poulon-Quintin, A. Numerical simulation of resistance upset welding in rod to tube configuration with contact resistance determination. J. Mater. Process. Technol. 2016, 238, 409–422. [Google Scholar] [CrossRef]
  21. Biele, L.; Schaaf, P.; Schmid, F. Method for contact resistance determination of copper during fast temperature changes. J. Mater. Sci. 2020, 56, 3827–3845. [Google Scholar] [CrossRef]
  22. Bucca, G.; Collina, A. Electromechanical interaction between carbon-based pantograph strip and copper contact wire: A heuristic wear model. Tribol. Int. 2015, 92, 47–56. [Google Scholar] [CrossRef] [Green Version]
  23. Xie, W.; Wu, G.; Yang, Z.; She, P.; Wang, H.; Zuo, H.; Wei, W.; Gao, G.; Tu, C. Study on the erosion characteristics of copper-carbon electrode pairs by DC air arc. High Volt. 2021, 6, 674–683. [Google Scholar] [CrossRef]
  24. Dong, L.; Li, C.-X.; Chen, G.-X.; Zhong, W.; Liu, X.-Y. Simulation study on coupling temperature field under pantograph-catenary friction with electrical current. China Railw. Sci. 2014, 35, 102–106. [Google Scholar]
  25. Dai, L.M.; Lin, J.Z.; Ding, X.H. Effect of transient temperature rise in contact area on wear properties. China Railw. Sci. 2002, 23, 111–117. [Google Scholar]
  26. Young, W.; Budynas, R.; Sadegh, A. Roak’s Formulas for Stress and Strain, 8th ed.; McGraw-Hill Education Press: New York, NY, USA, 2012; pp. 93–108. [Google Scholar]
  27. Holm, R. Electric contact Theory and Applications, 1st ed.; Spinger Press: Berlin/Heidelberg, Germany, 1967; pp. 9–21. [Google Scholar]
  28. Matsumura, T.; Morooka, I.; Yokomizu, Y.; Suzuki, M. Arc Parameters in CO2-blast quenching chamber with high-pressure storage tank of different pressures. Vacuum 2006, 80, 1305–1310. [Google Scholar] [CrossRef]
  29. Kong, L.-R.; Zhang, S.-Y. Theoretical Explanation of the Special Temperature Dependence of Rate Constant for Oxidation of Carbon. Daxue Huaxue 2016, 31, 84–88. [Google Scholar] [CrossRef]
Figure 1. Schematic diagram of the high-speed current-carrying friction and wear tester.
Coatings 12 01713 g001
Figure 2. Schematic diagram of data acquisition and temperature control system.
Coatings 12 01713 g002
Figure 3. Effect of temperature on the AECR of the C-Cu contacts: (a) under different current and (b) under different temperature.
Coatings 12 01713 g003
Figure 4. Effect of temperature on the DECR of the C-Cu contacts: (a) at 10 A and (b) at 80 A.
Coatings 12 01713 g004
Figure 5. Effect of temperature on the arc discharge of the C-Cu contacts: (a) discharge frequency; (b) average single discharge energy; and (c) total discharge energy.
Coatings 12 01713 g005
Figure 6. XRD patterns of the carbon surface with different temperature and current.
Coatings 12 01713 g006
Figure 7. XPS spectrum of the carbon surface with different temperature and current: (a) XPS survey-scan spectrum and (b) the corresponding Cu 2p peak.
Coatings 12 01713 g007
Figure 9. The maximum temperature of the C-Cu contact spots varies with interface temperature under different currents.
Coatings 12 01713 g009
Figure 10. The radial temperature distribution on the surface of the C-Cu contact spots varies with interface temperature: (a) I = 40 A; (b) I = 60 A, and (c) I = 80 A.
Coatings 12 01713 g010
Figure 11. The axial depth of the contact spot reaches the softening temperature of copper at different interface temperatures.
Coatings 12 01713 g011
Figure 12. 3D morphologies and surface roughness of the carbon slider at different interface temperatures and currents: (a) 3D morphologies and (b) surface roughness.
Coatings 12 01713 g012
Table 1. Parameters of the test.
ItemsConditions
Temperature/°CRoom temperature, 120, 180, 240, 300
Sliding speed/km·h−180
Normal load/N80
Current/A10, 20, 40, 60, 80
Sliding distance/km80
Table 2. Major element and physical properties of the test material.
Materials and PropertiesCarbon SliderContact Wire
Element content/wt%99.19% C, 0.73% S, 0.08% O99.50% Cu, 0.50% O
Density/103 kg·m−31.678.9
Resistivity/10−6 Ω·m250.018
Specific heat/J·kg−1·K−1769380
Thermal conductivity/W·m−1·K−13380
Hardness/107 N·m−27082.6
Elastic modulus/ GPa11.7132
Poisson’s ratios0.4270.323
Softening temperature/°C350
Table 3. XPS quantitative analysis of constitutions on the carbon surface under different interface temperatures.
Current LevelsTemperatureChemical Compositions (wt%)
CCuO
10 ARoom temperature90.613.645.75
300 °C85.776.027.95
80 ARoom temperature88.444.436.23
300 °C86.325.747.14
Table 4. XPS quantitative analysis of the percentage of copper with a different valence on the carbon surface under different interface temperatures.
Current LevelsTemperatureChemical Compositions (wt%)
Cu0Cu+Cu2+
10 ARoom temperature28.6735.9635.38
300 °C21.6548.3829.97
80 ARoom temperature22.947.3229.79
300 °C34.1342.9722.9
Publisher’s Note: MDPI stays neutral with regard to jurisdictional claims in published maps and institutional affiliations.

