Article

Design and Fabrication of a Thermopile-Based Thin Film Heat Flux Sensor, Using a Lead—Substrate Integration Method

1
School of Mechanical Engineering, Dalian Jiaotong University, Dalian 116028, China
2
School of Materials Science and Engineering, Dalian Jiaotong University, Dalian 116028, China
*
Author to whom correspondence should be addressed.
Coatings 2022, 12(11), 1670; https://doi.org/10.3390/coatings12111670
Submission received: 4 October 2022 / Revised: 25 October 2022 / Accepted: 2 November 2022 / Published: 3 November 2022

Abstract

:
An accurate and continuous measurement of heat flux is needed in many long-term operation facilities in order to monitor and improve the life of its machinery. A thin film heat flux sensor is usually fabricated via sputtering, according to different spatial arrangements of thermocouple junctions. A novel thin film heat flux sensor was designed, fabricated, and calibrated, but the connection between the thin film and the leads could not be fixed quickly and steadily. For this purpose, in this paper a method to seamlessly integrate the leads and the thin film has been proposed to improve the sensor output signal. The sensor is capable of simultaneously measuring surface heat flux and temperature magnitude, to address the current situation of the single design of heat flux sensors. The novel thin film heat flux sensor is structured as follows: Thirty pairs of NiCr-NiSi thermocouple junctions are deposited in an annular pattern on a well-designed ceramic substrate. Over the annular thermopile, a 2000 nm-thick thermal insulator layer is deposited to create a temperature gradient across the layers. In addition, in this study a new calibration method was used to evaluate the static and dynamic properties of this novel thin film heat flux sensor. The analysis and experimental results show that the heat flux calculated from the sensor output was in good agreement with the value obtained from the pre-calibrated standard sensor. The sensitivity and response time of the novel sensor were measured at 0.06 mV/(kW/m2) and 475 ms, respectively. The heat flux measurements made with the sensor presented good repeatability. The heat-transfer coefficient of the Al2O3 thin film was 4.477 w/(m∙k) for the novel thin film heat flux sensor described in this paper.

1. Introduction

During the operation of an aircraft, the high friction between the aircraft and the air causes instantaneous heat flux on the surface. Excessive heat flux will cause a huge thermal load for the structure and material to bear, thus reducing the strength limit and bearing capacity. This threatens the safety of the aircraft and its important components and reduces its service life [1]. Therefore, it is very important to accurately measure instantaneous heat flux on an aircraft’s surface. The data captured by the heat flux sensor can help to avoid design flaws before production and enhance aircraft performance. However, real-time effective monitoring of transient surface heat flux has long been a technical challenge, which prevents aircraft development [2]. Therefore, it is necessary to design a thin film heat flux sensor with practical value. In recent years, thin film heat flux sensors have been chosen because of their short response time, little interference with the test environment, high measurement accuracy, and good adaptability to test models of different shapes [3].
The connection between the film and the signal lead has a great influence on the reliability of the signal output of the heat flux sensor [4]. Narasimha [5] designed and developed a thin film heat flux sensor, in which the lead wire was pasted on with conductive silver paste to draw out the signal. Andrew [6] used type-K thermocouple materials in a durable welded thermopile arrangement, which was contained within a surface-mountable high-temperature housing. The sensor extracted the signal through the applied conductive silver glue. The design performance of a prototype sensor was validated using both conduction and convection heat transfer calibration at low temperature. In a study by Zhang [7], 18 pairs of Pt-PtRh13 thermopiles were deposited on an alumina substrate and silicon oxide was used as the thermal resistance layer, which can measure temperature up to 1000 °C. The lead out was through a conductive silver adhesive bonding lead, the sensor sensitivity was 4.37267 × 10⁻⁵ mV/(W/m2), and the response time was 10 s. Jadhav [8] designed a heat flux sensor using Macor and quartz rods—with a 6 mm diameter and a 10 mm depth—as the substrate material, and platinum and MWCNTs as the sensing materials. Thin silver film is considered to establish electrical connections between the thin sensing film and the connecting wires. The above studies showed that in the process of preparing a thin film heat flux sensor, materials such as conductive silver glue and silver paste and methods such as welding are often used for the connection between the lead and the film [9].
The measurement accuracy of thin film heat flux sensors is affected by many factors [10,11], one of which is the method of calibrating the sensor [12]. Benjamin [13] combined micro-machining, based on lithography-based microfabrication, and micro end milling to manufacture micro-scale heat flux sensors, which were then calibrated. A fiber laser with a wavelength of 1064 nm was used to provide incident laser radiation to calibrate the heat flux sensor. At the same time, a coating of black paint was applied to the surface of the sensor to increase its surface absorptivity to approximately 1.0. The sensor response was recorded at 10 kHz. Zrib [14] performed calibration tests on a prepared thin film heat flux sensor. The test bench was made of a polyamide cylinder, one side of which was heated, while the other side was in contact with the surrounding air. The heating element consisted of two electric heating pads that were sandwiched between two copper plates to ensure surface heat uniformity. The sensor was in contact with the air and the polyamide cylinder. Jadhav [8] also performed calibration tests on a prepared thin film heat flux sensor. The static calibration device was composed of a beaker that was partially filled with pure silicone oil and placed on a plate heater. In a small beaker filled with air, a calibrated mercury glass thermometer and a thin film heat flux sensor were fixed at the same height, so that they could detect the same temperature. The silicone oil was heated by the heater plate, then the thin film heat flux sensor was connected to a data acquisition system to acquire the data. However, none of the above thin film flux sensor calibration tests were performed in a closed environment.
This paper reports the design of a new substrate structure that uses ceramic sintering technology, which combines the lead wire with the sensor substrate. The nanometer level of the NiC-NiSi functional film, the Al2O3 thermal insulator layer, the SiO2 protective layer, and the NiCr-NiSi thin film thermocouple were deposited on an Al2O3 ceramic substrate by magnetron sputtering technology. The morphology of the film was analyzed by scanning electron microscopy (SEM) and energy-dispersive X-ray spectroscopy (EDS, JEM-2100F, Japan Electronics Co., Ltd, Tokyo, Japan). A new calibration method is proposed to evaluate the sensitivity, response time, and repeatability characteristics of the novel thin film heat flux sensor. The calibration of this sensor was performed in a closed environment—provided by a Fluke 9118 A-C-256 horizontal metering furnace (Fluke, Everett, WA, USA)—and by using a high-temperature ceramic heater. The standard heat flux sensor and the novel thin film heat flux sensor were fixed on both sides of the high-temperature ceramic heater for calibration. The results suggest that the novel thin film heat sensor has high sensitivity, a fast response time, and excellent repeatability, which can meet the needs of transient surface heat flux measurement.

2. Preparation of Thin Film Heat Flux Sensor

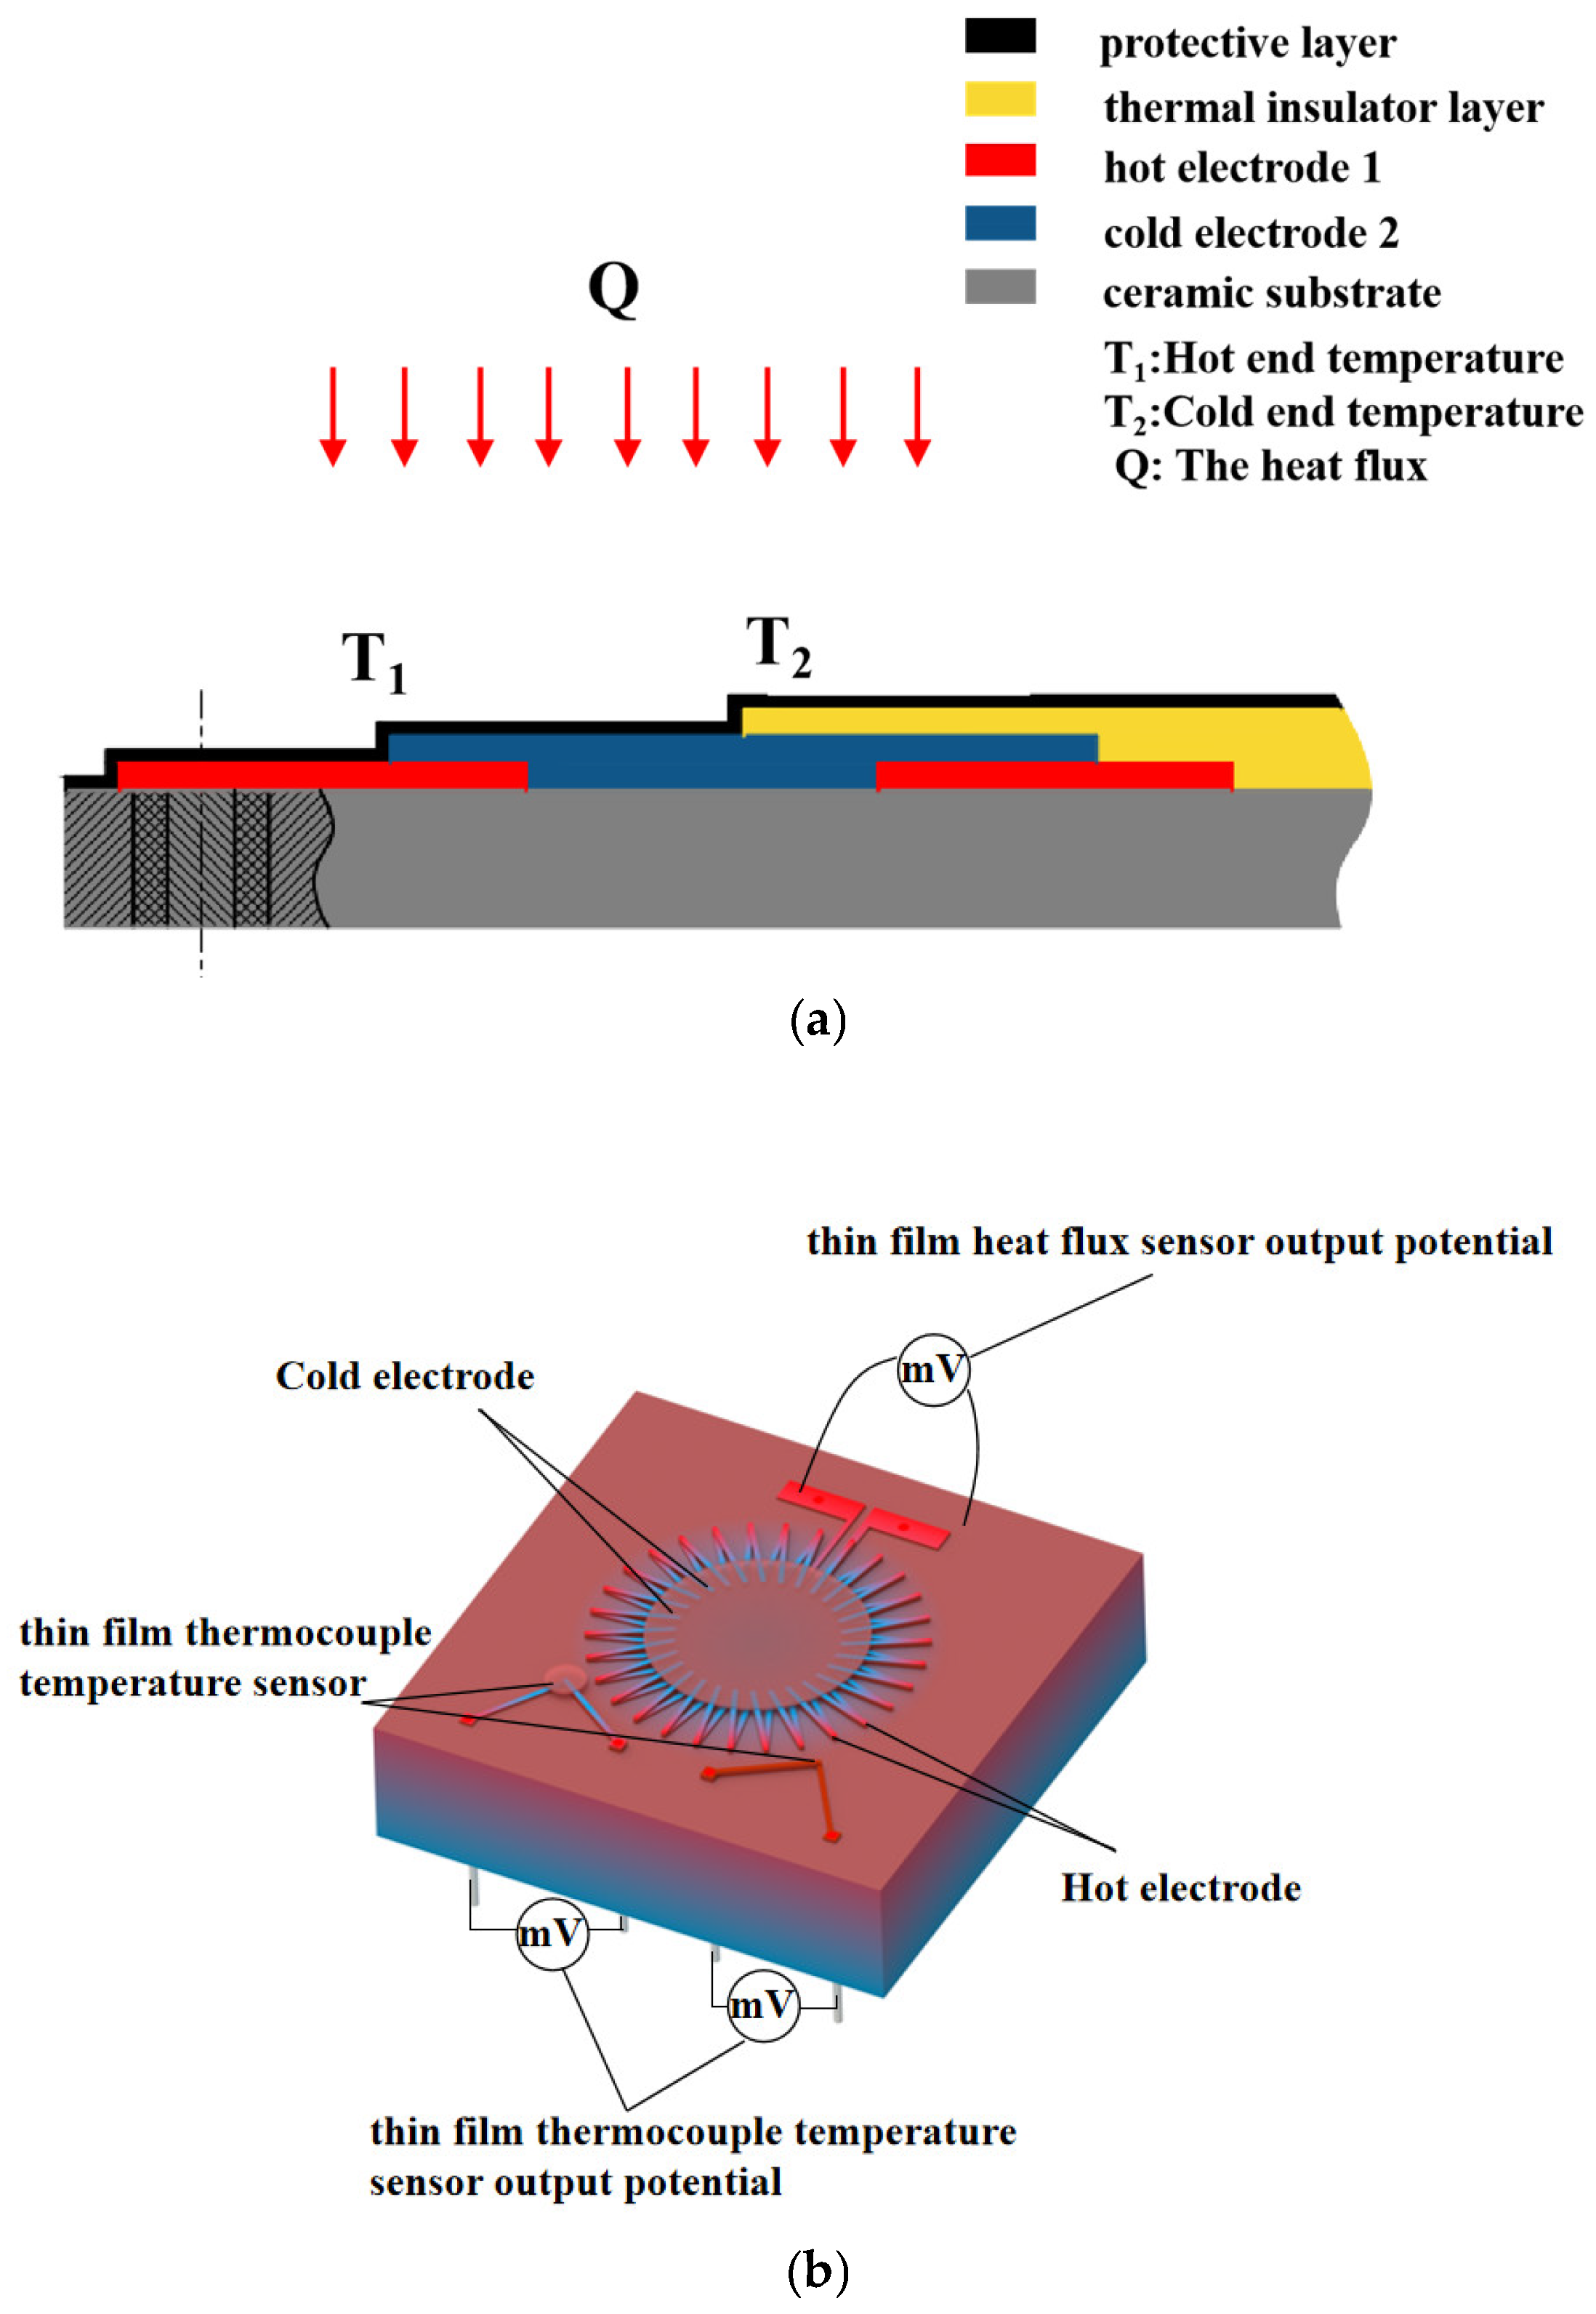
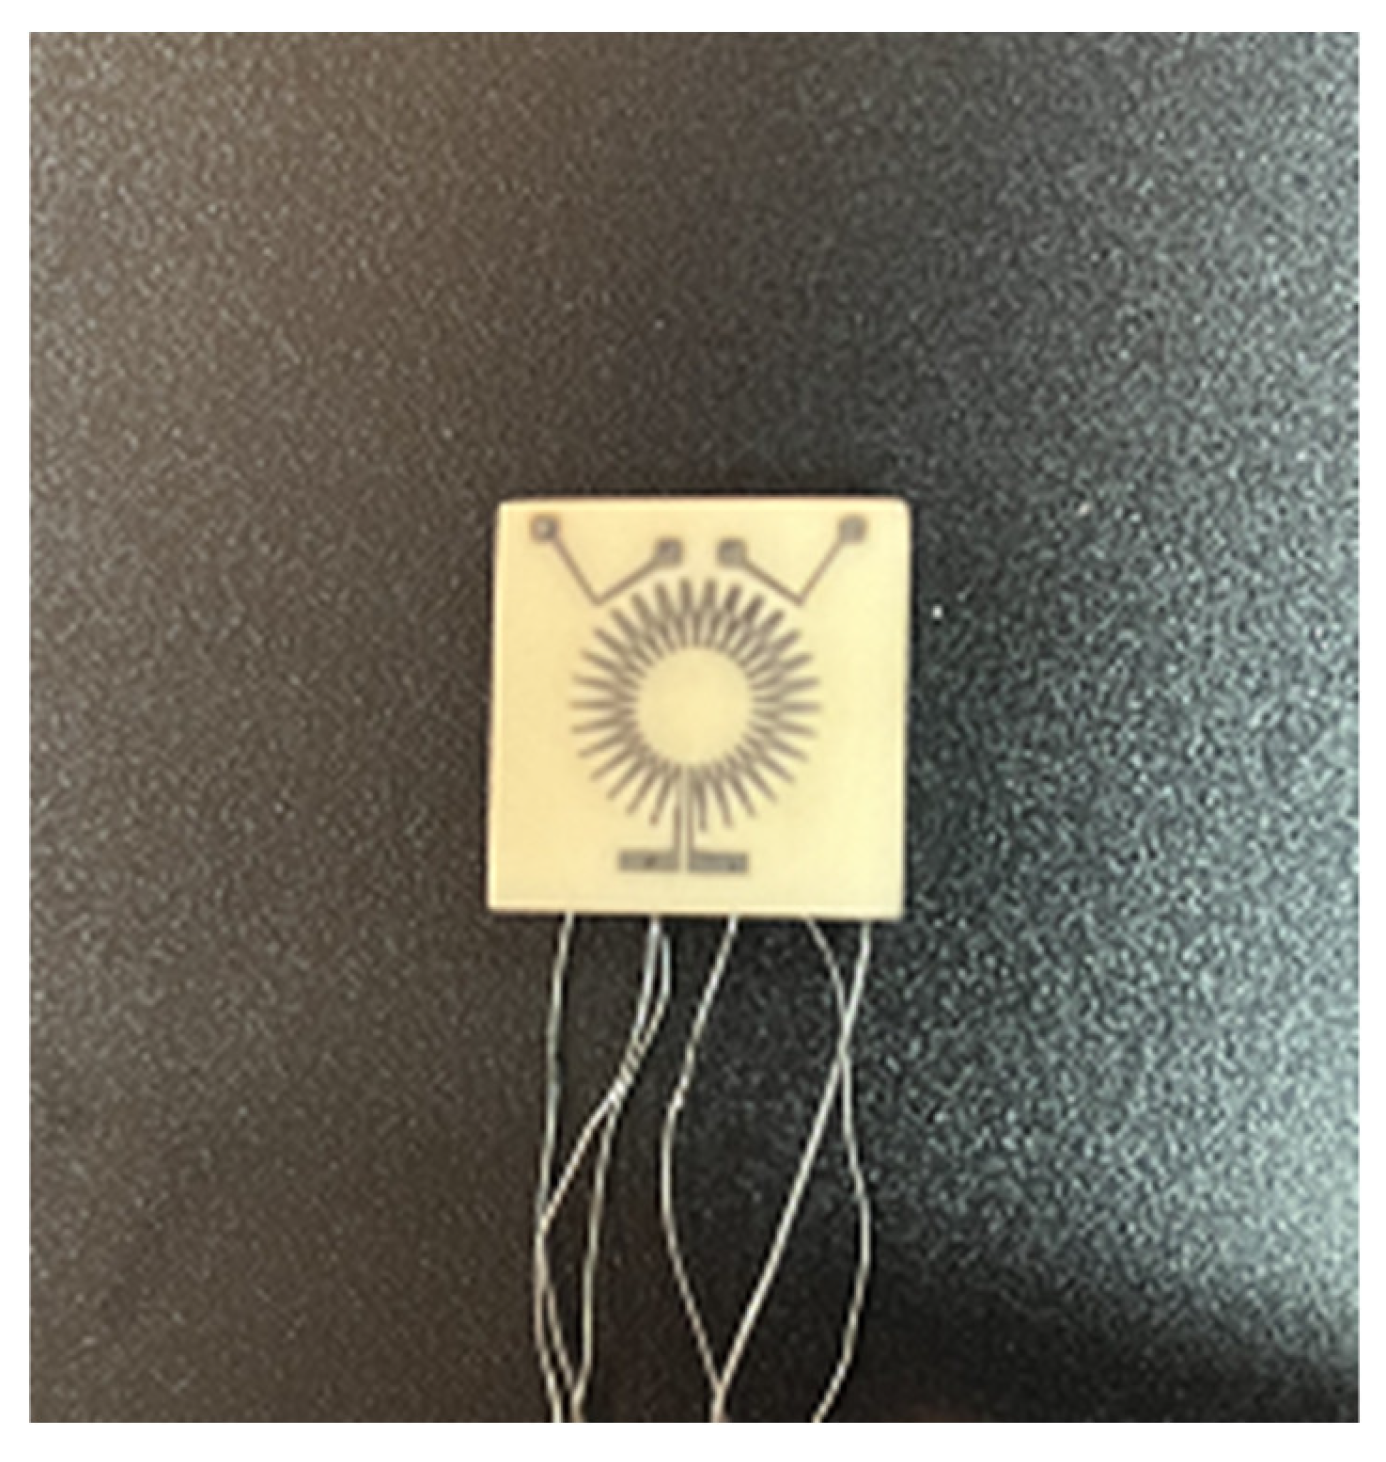
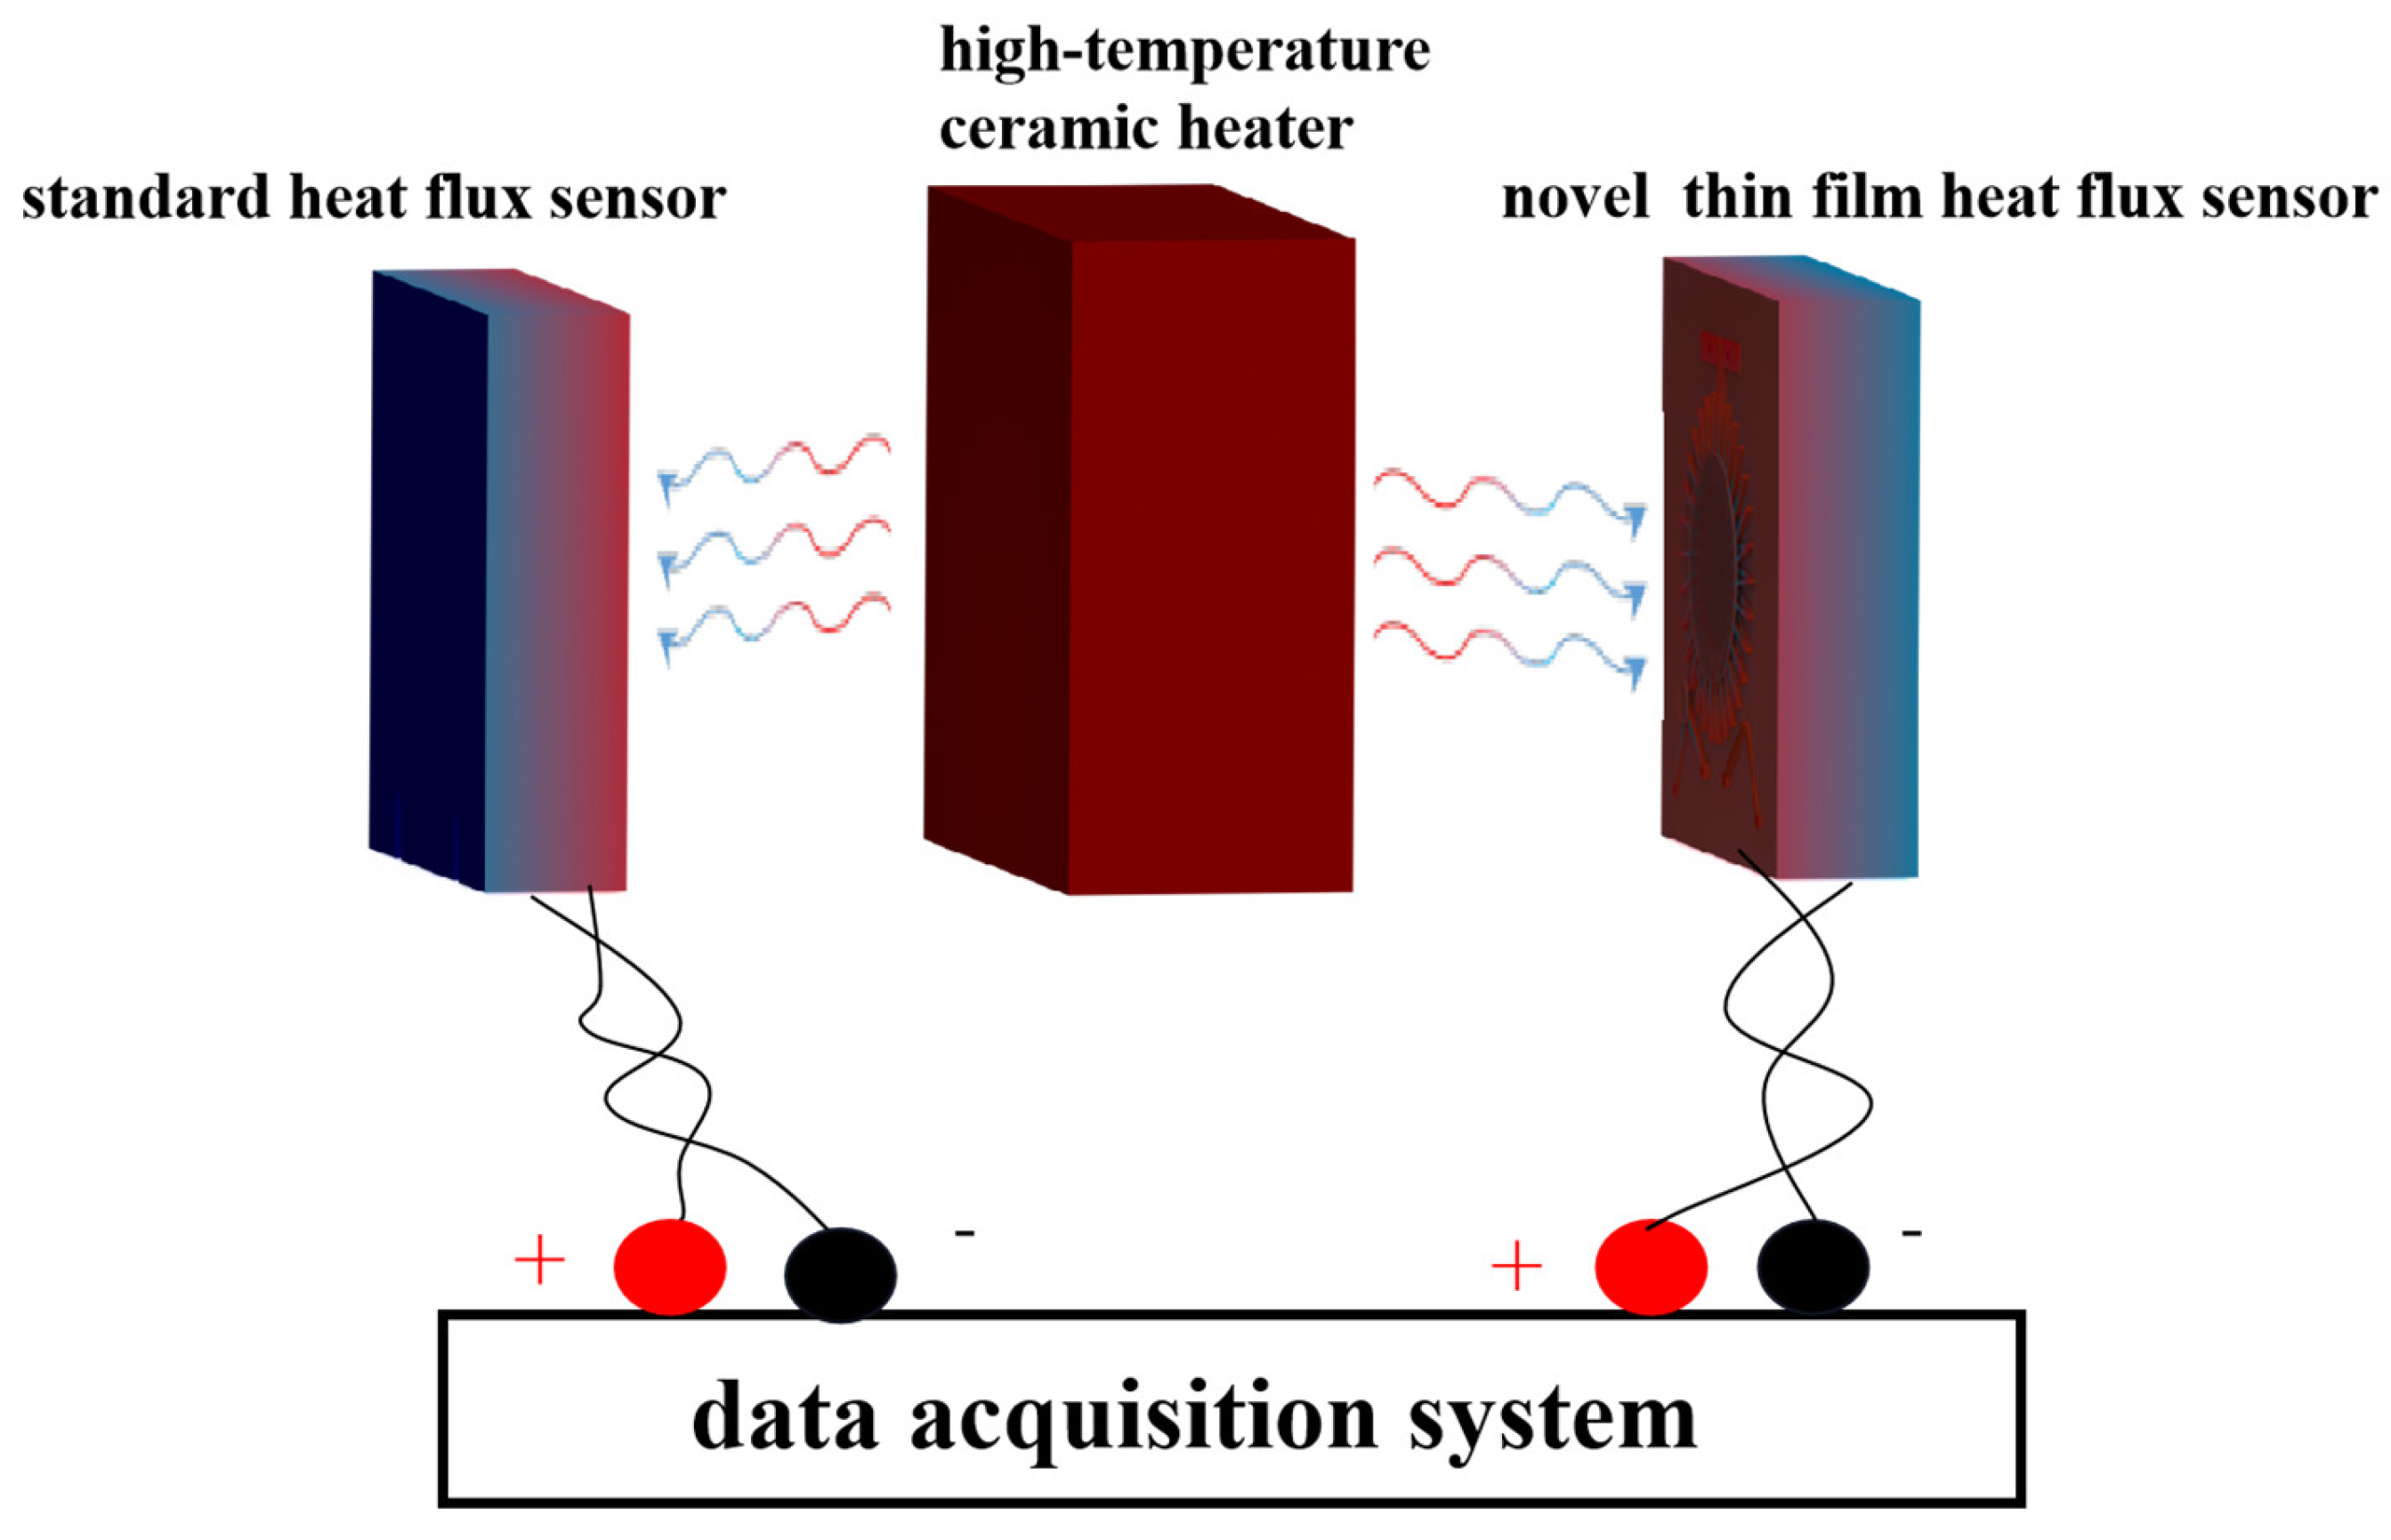
2.1. Working Principle and Structure

The novel thin film heat flux sensor contains a thermopile as a sensing element, which is a series of electrically connected thermocouples. The Seebeck effect occurs in a closed circuit, composed of two homogeneous conductors or semiconductors, A and B, of different materials. Because the node temperature of the two semiconductors differs, there is a temperature difference. According to the Seebeck effect, thermoelectric potential is generated when there is a temperature difference between the hot and cold junction. As shown in Figure 1a, the thin film flux sensor consisted of a ceramic substrate with high thermal conductivity, a hot and cold electrode, a thermal insulator with low thermal conductivity, and a protective layer on the thermopile.
In the whole closed loop, the relationship between thermoelectric potential, Ep, output by the thermopile, and thermoelectric potential, Et, output by a single thermocouple is as follows:
E p = E 1 + E 2 + E 3 + + E n = i = 1 n E t
It can be seen that the thermopile can amplify the thermoelectric output. The absolute error generated by the group I thermocouples is expressed by Ei, where I = 1, 2, 3, 4, n, and the total absolute error of the thermopile composed of group N thermocouples is as follows:
Δ E p = Δ E 1 2 + Δ E 2 2 + + Δ E n 2
Under the same environmental conditions, if the absolute error of the thermocouple measurement is ∆E1 = ∆E2 = ∆En = ∆E, then Formula (2) becomes the following:
Δ E p = n Δ E
Then, the relative error of the thermopile is as follows:
Δ E P E P = n Δ E n E = 1 n Δ E E
It can be seen from Formula (4) that the output thermoelectric potential of a thermopile composed of n thermocouples of the same material in series is n times that of a single thermocouple, but the relative measurement error of a single thermocouple is n times that of a thermopile composed of n groups of thermocouples in series. This shows that a thermopile composed of n groups of thermocouples in series has higher measurement accuracy than a single thermocouple.
When heat flux is normally applied to the heat flux sensor, a temperature difference arises between the hot and cold junction due to the difference in thermal conductivity between the thermal insulator and the substrate.
The heat flux can be written as follows:
Q = λ Δ T Δ d = λ T 1 T 2 Δ d
where Q is the incident heat flux; the minus sign (−) indicates the orientation of heat transfer, which is opposite to the temperature rise; λ is the thermal conductivity of the thermal insulator layer; ∆T is the temperature difference between the cold and hot junction; and ∆d is the thickness of the thermal insulator.
According to the Seebeck effect, output voltage, E, of a thermopile with N thermocouples can be described as follows:
E = N × S × Δ T
Q = K E
where, E is the output voltage of a pair of thermocouples. As shown in Figure 1b, the designed sensor structure consisted of 30 pairs of thermocouples. Detecting the heat flux that was detected by the thin film heat flux sensor was achieved through the thermoelectric potential output from the hot–cold electrode. The temperature of the heat flux sensor surface was detected through the output potential by using the thin film thermocouple temperature sensor.
K = λ N × S × Δ d
If K or sensitivity is obtained according to the output thermoelectric potential of the novel thin film heat flux sensor, the heat flux can be known.

2.2. Material Selection

The service life of a thin film heat flux sensor can be greatly extended due to the high- wear insulation, low thermal expansion coefficient, and small heat capacity of the alumina ceramic substrate [15]. The alumina ceramic substrate has high-temperature and high- pressure characteristics, which allows it to withstand temperatures above 1600 °C, and it has excellent crack insulation. It also has high thermal conductivity and reacts quickly to changes in heat flux [16]. Consequently, alumina ceramic was selected as the substrate for the novel thin film heat flux sensor.
The Seebeck coefficient of NiCr-NiSi, NiCr-CuNi, and Fe-CuNi thermocouples is significantly higher than that of PtRh10-Pt and PtRh30-PtRh6 thermocouples. Among them, the temperature measuring range of the NiCr-NiSi thermocouple is the widest. The NiCr-NiSi thermocouple material—with strong oxidation insulation, low material cost, and high Seebeck coefficient—is preferred as the electrode material for the novel thin film heat flux sensor thermopile.
Polyimide, SiO2, and Al2O3 are common thermal insulator layer materials. Table 1 summarizes their attribute parameters. The thermal expansion coefficient of polyimide film is large, and the thermal conductivity is limited, making sensor functional film shedding easy. The thermal conductivity of SiO2 is obviously affected by temperature. In this study, an Al2O3 thin film with low temperature conductivity, good insulation, and thermal stability was used as the material for the thermal insulator layer.
In high temperatures, humidity, oxidation, and other environments, the NiCr-NiSi thermoelectrode film will oxidize. Therefore, an SiO2 protective film must be deposited on its surface to isolate air and prevent oxidation [17].

2.3. Fabrication

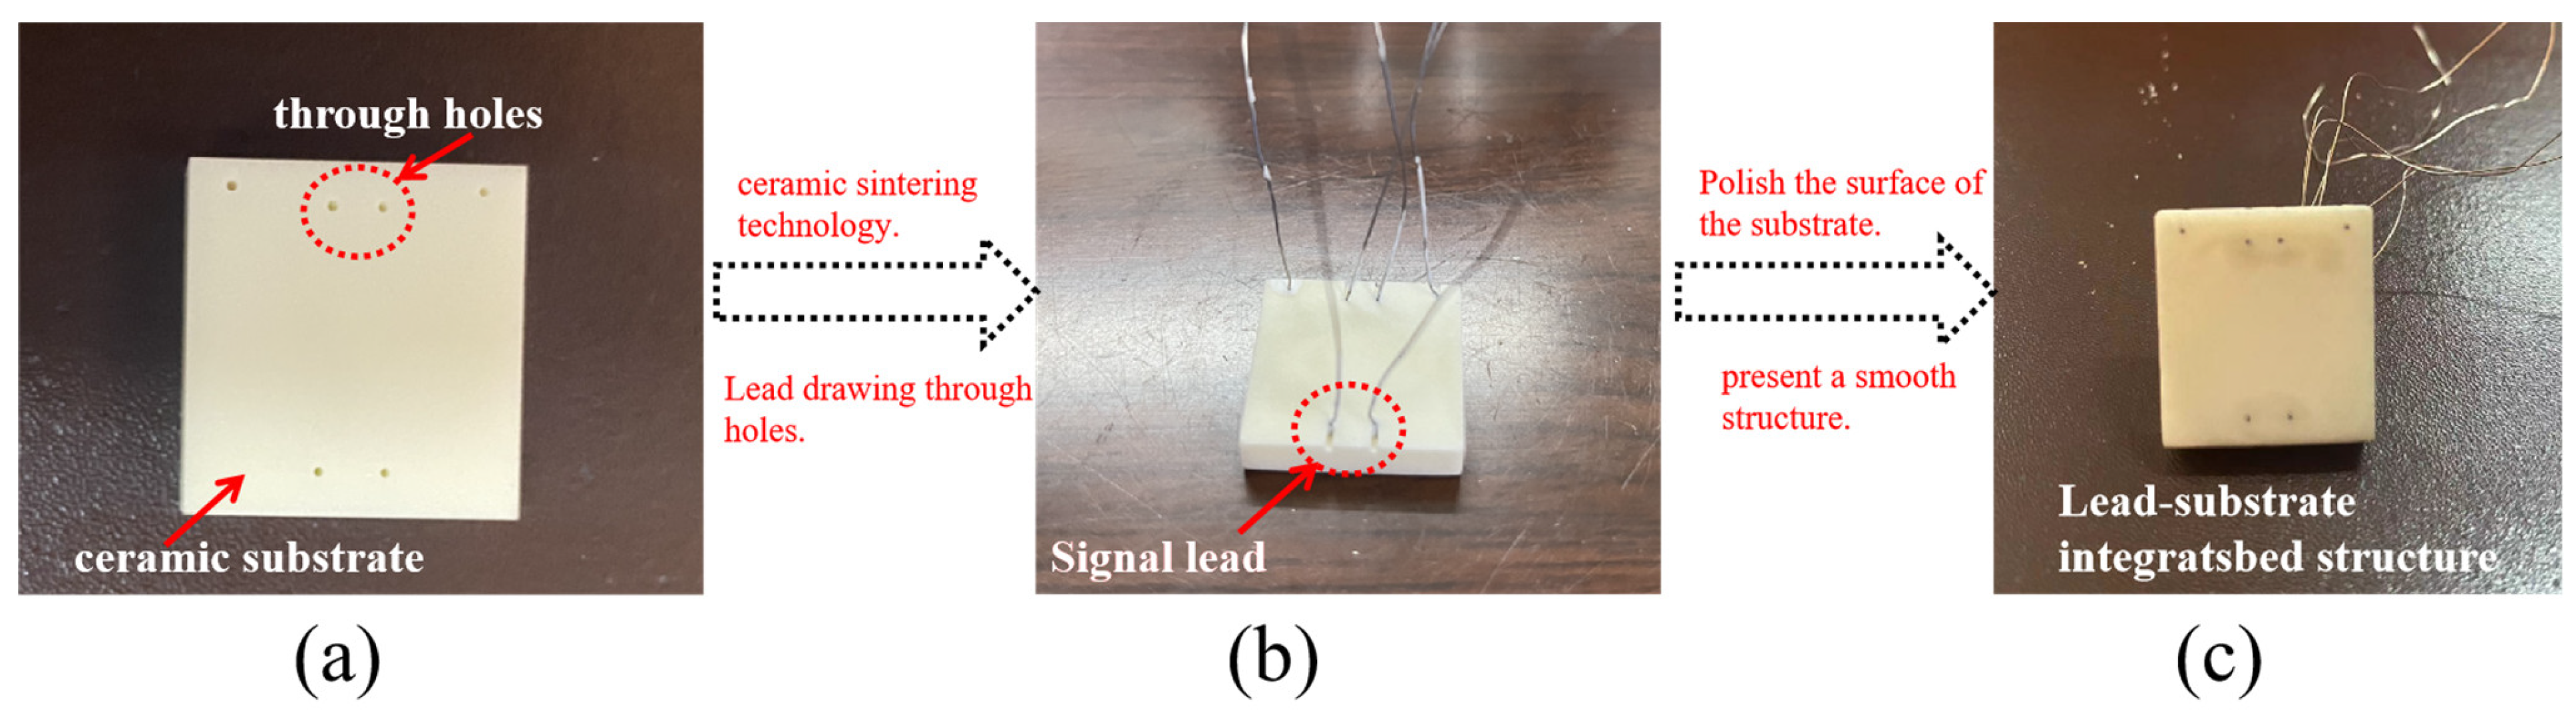
2.3.1. Fabrication of Al2O3 Ceramic Substrate Embedded with Leads

In order to strengthen the connection between the lead and the film and improve the signal output capability of the sensor, a new sensor substrate structure was designed, with the leads directly combined with the sensor substrate by ceramic sintering technology. The substrate is made of high-purity alumina ceramic material. The surface of the substrate consists of 6 sets of through holes, with a diameter of 0.5 mm, as shown in Figure 2a. The positions of the through holes correspond to the functional thin film nodes in a one-to-one relationship. First, 99% pure alumina ceramic substrate and 0.3 mm diameter NiCr and NiSi leads were ultrasonically cleaned in acetone, ethanol, and deionized water for 15 min, and then dried with N2 gas [18]. Then high-temperature glue was filled in evenly in the 0.5 mm lead through holes. The NiCr and NiSi leads passed through 6 through holes and protruded from the coating plane. Using high-temperature inorganic bonding, overnight insulation, ceramic sintering, and other processes, the leads were embedded in the lead posts of the ceramic substrate to achieve lead-based integration, as shown in Figure 2b. Figure 2c shows the integrated structure of the prepared leads and substrate.
SEM was used to observe the surface morphology of the junction between electrode leads and Al2O3 ceramic substrate. The junction between the NiCr/NiSi electrode lead and the Al2O3 ceramic substrate was tight, with hardly any holes (Figure 3), and met the requirements of subsequent film preparation.

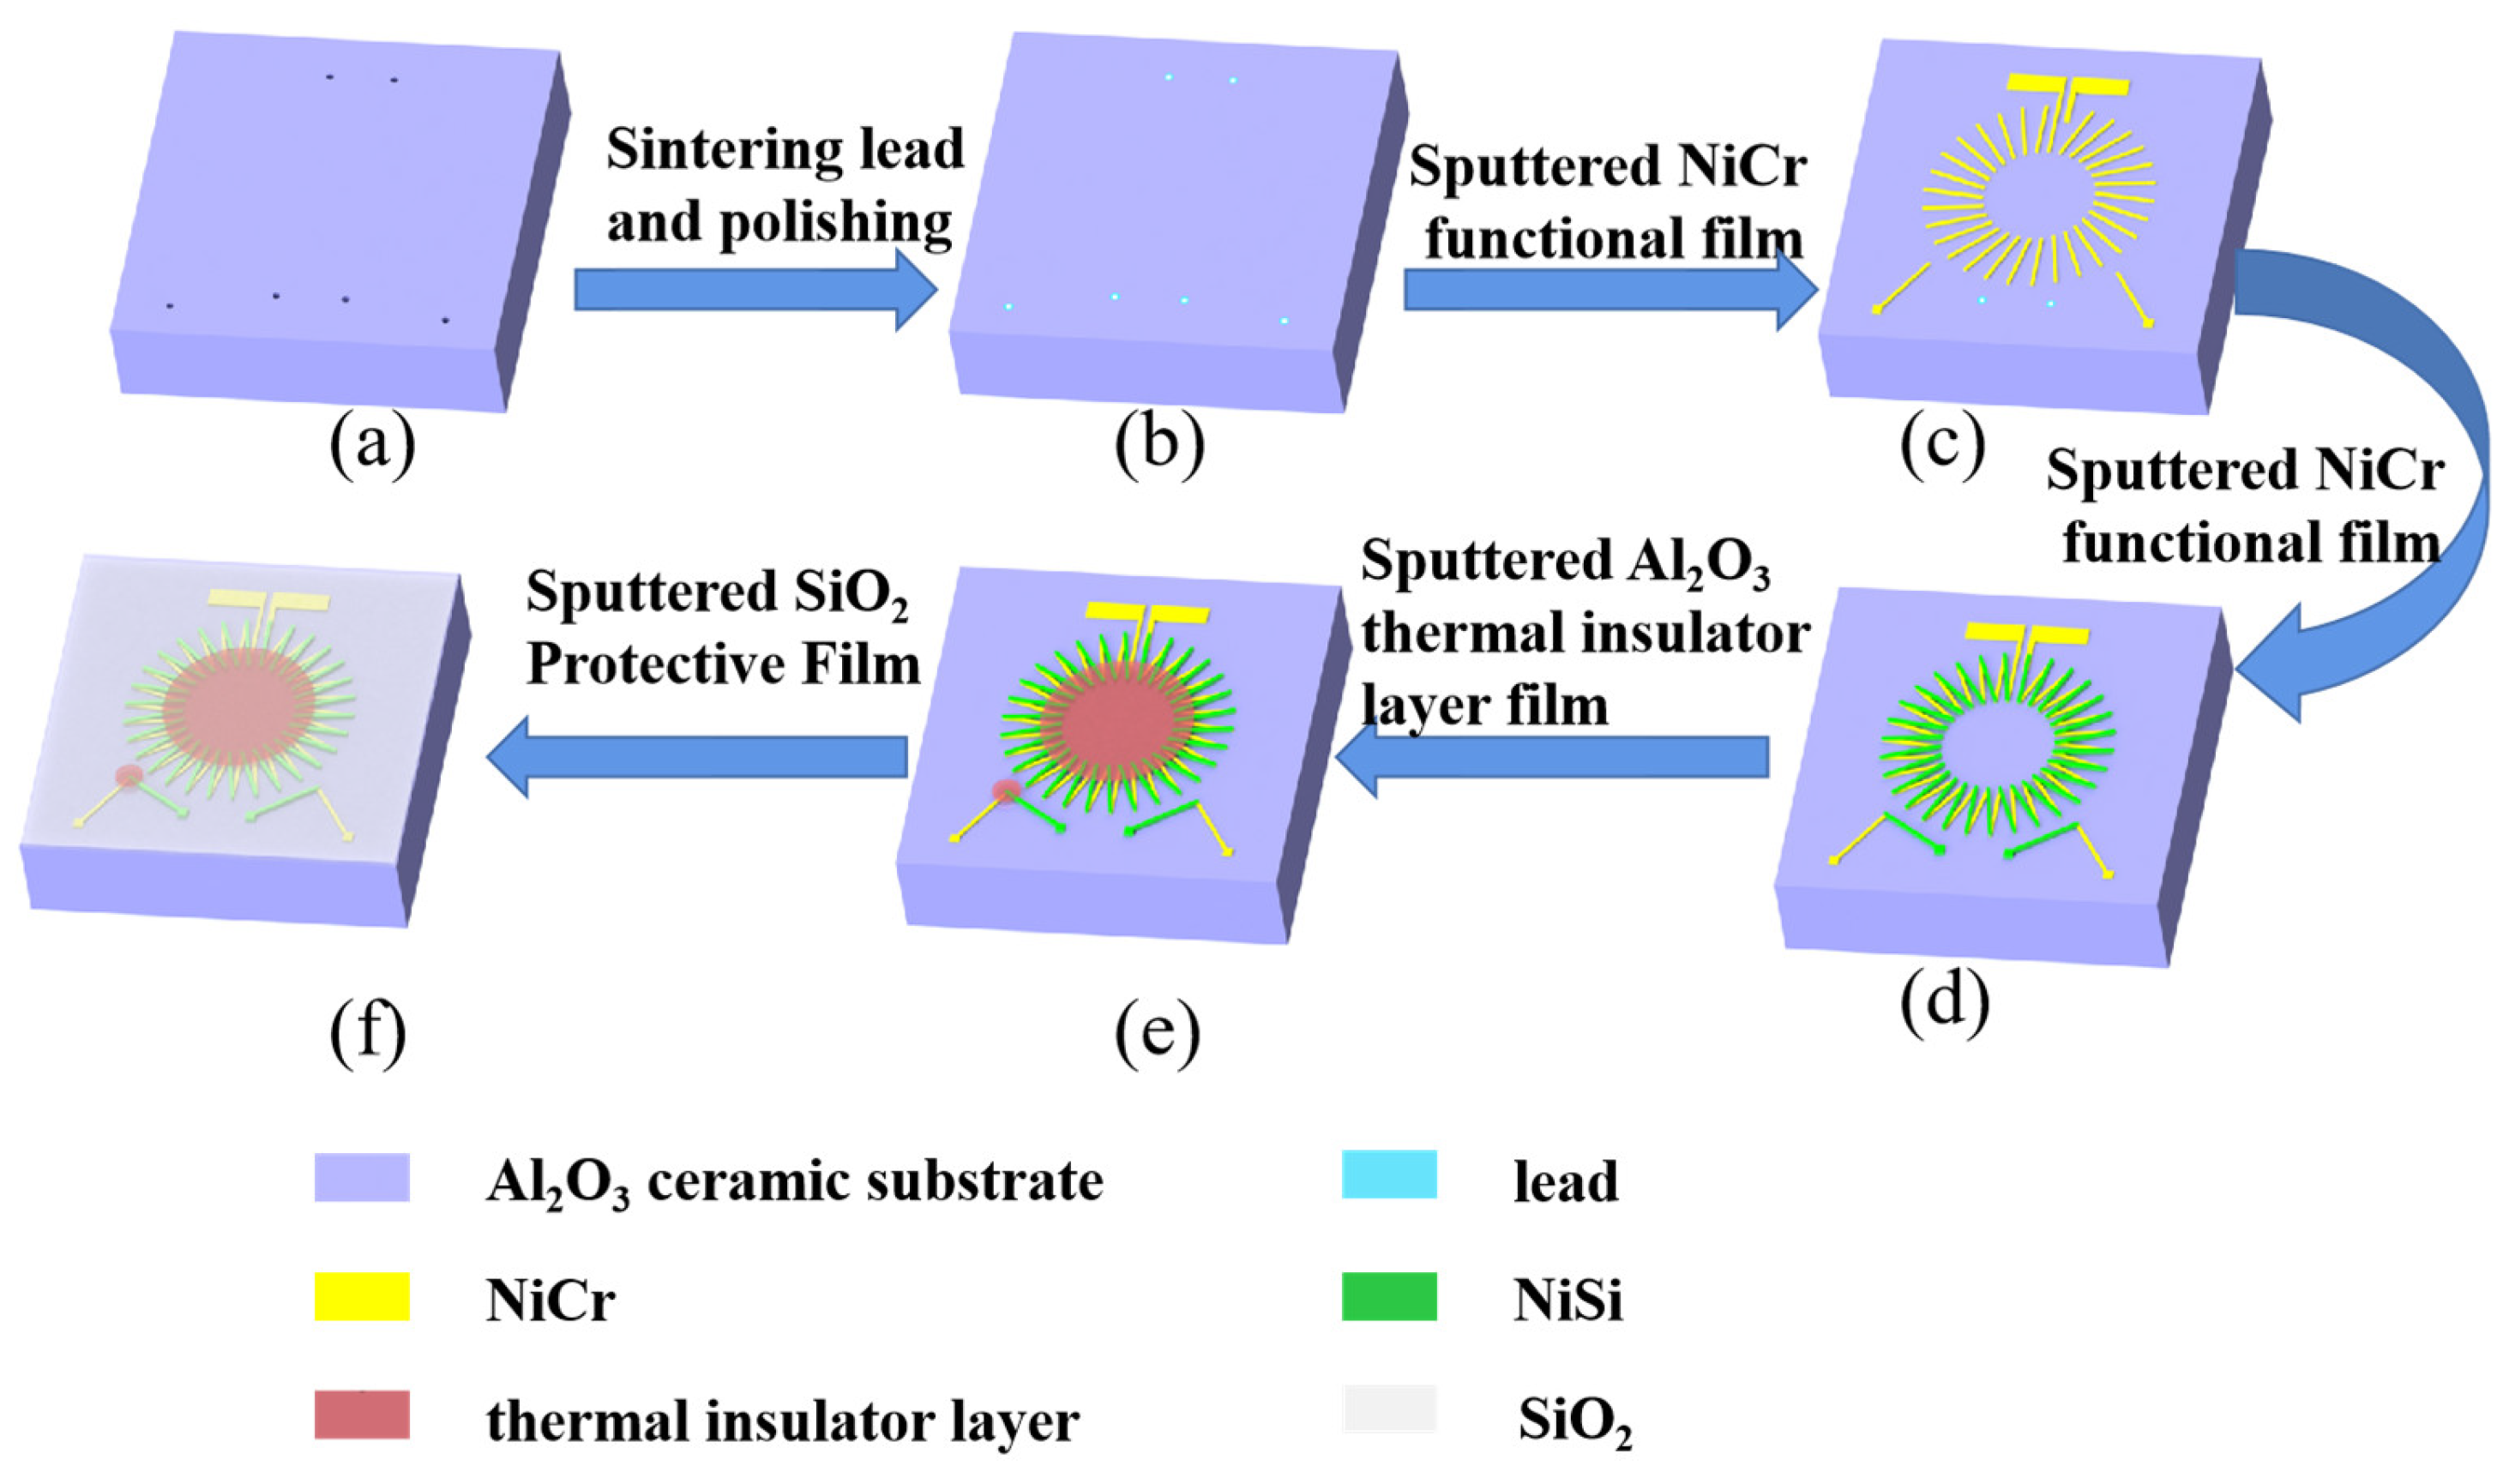
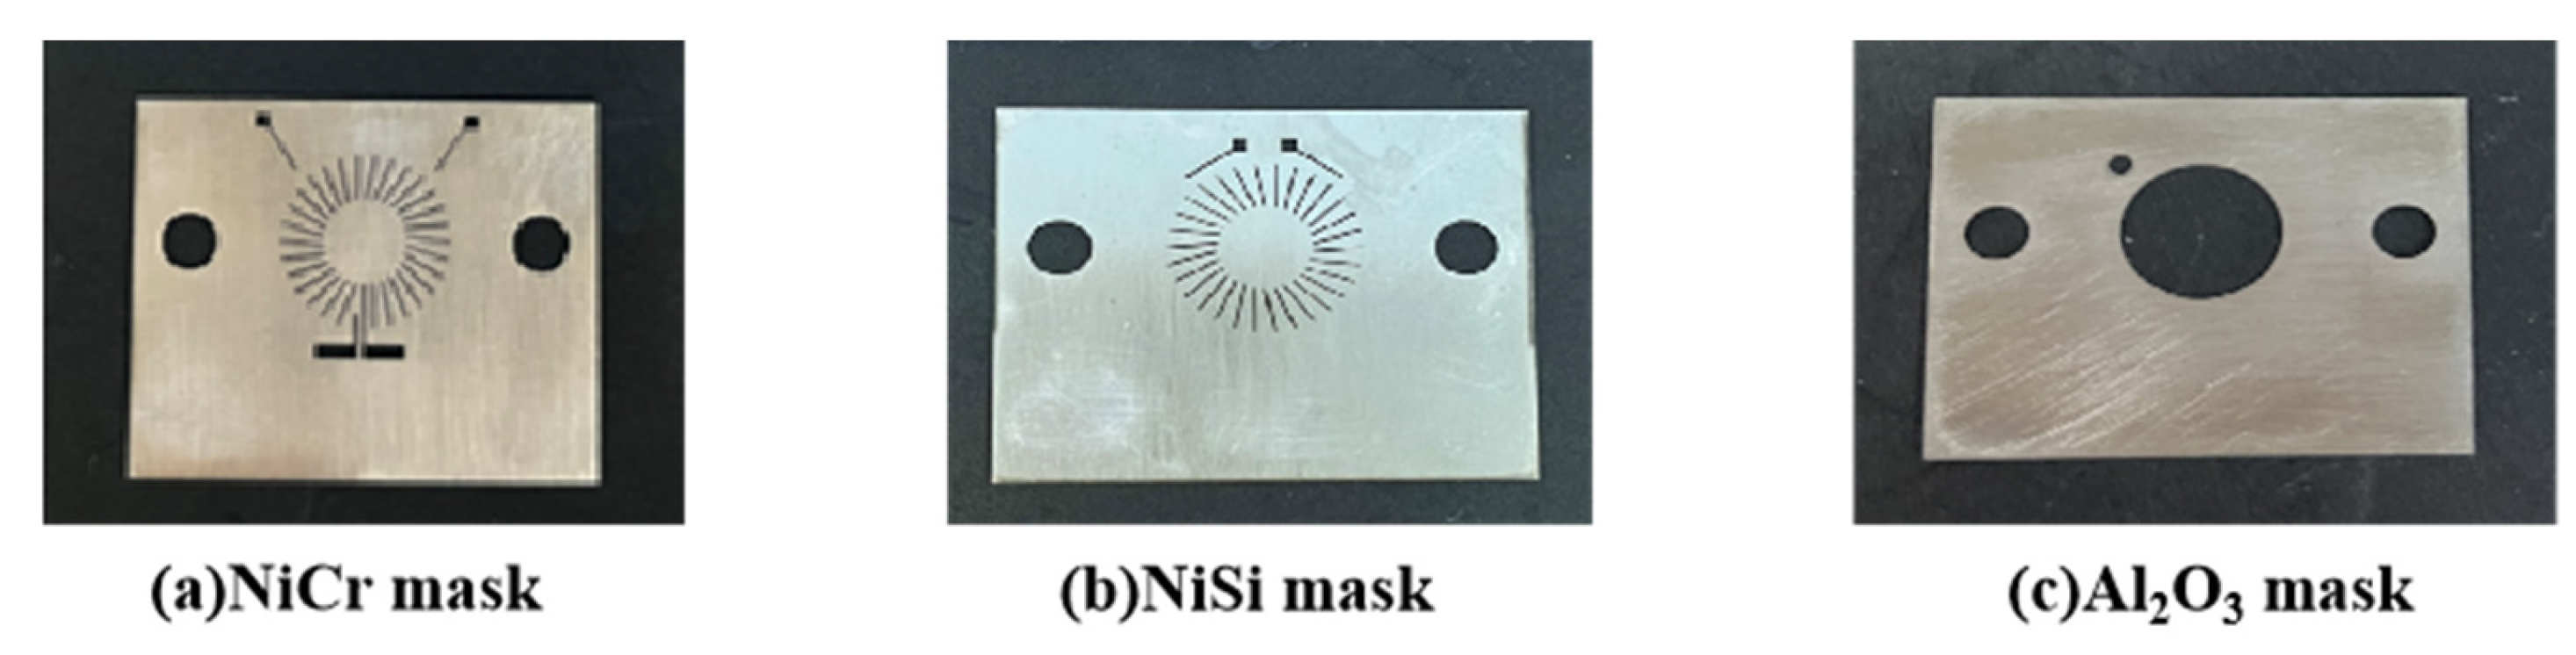
2.3.2. Preparation of Multilayer Composite Nanofilms

The prepared lead wire and substrate structure were placed on the stage of a high-vacuum multifunctional composite coating machine for coating. The developed novel thin film heat flux sensor mainly included NiCr functional film, NiSi functional film, Al2O3 thermal insulator film, and SiO2 protection film. A diagram of preparation flowchart for preparing the thin film heat flux sensor is shown in Figure 4.
Due to the experimental requirements, masks were used for deposition in this paper, and the schematic diagram is shown in Figure 5. The mask types included NiCr, NiSi, and Al2O3 masks. Different films were sputtered with different masks.
The process of preparing the novel thin film heat flux sensor was as follows:
First, the vacuum chamber was loaded with pre-cleaned Al2O3 ceramic substrate. According to the position of the positioning hole on the Al2O3 ceramic substrate, the NiCr mask covered the substrate, and was then mechanically fixed with bolts. The NiCr pattern was then deposited onto the Al2O3 ceramic substrate, using the NiCr sputtering parameters in Table 2. Following deposition, the Al2O3 ceramic substrate with NiCr pattern and NiCr mask (Figure 5a) were removed from the vacuum chamber.
Second, in the vacuum chamber, the Al2O3 ceramic substrate with NiCr pattern covered by the stainless-steel mask was fixed onto the substrate holder. The NiSi plate was used to replace the NiCr plate. According to the position of the positioning hole on the Al2O3 ceramic substrate, the NiSi mask covered the substrate, and was then mechanically fixed with bolts. The NiSi pattern was then deposited onto the Al2O3 ceramic substrate with the NiCr pattern, using the sputtering parameters in Table 2. Following deposition, the Al2O3 ceramic substrate with NiSi pattern and NiSi mask (Figure 5b) were removed from the vacuum chamber.
Third, as shown in Figure 5c, the Al2O3 ceramic substrate with NiSi pattern and covered by the stainless-steel mask was assembled on the substrate holder in the vacuum chamber. Al2O3 plate was used to replace the NiSi plate. According to the position of the positioning hole on the Al2O3 ceramic substrate, the Al2O3 mask covered the substrate, and then was mechanically fixed with bolts. Next, using the Al2O3 sputtering parameters in Table 2, an Al2O3 pattern with a NiSi pattern was deposited on the Al2O3 ceramic substrate. Following deposition, the ceramic substrate with Al2O3 pattern and Al2O3 mask (Figure 5c) were removed from the vacuum chamber.
Finally, in the vacuum chamber, the Al2O3 ceramic substrate with Al2O3 pattern and covered by the stainless-steel mask was fixed to the substrate holder and the Al2O3 mask was removed. The SiO2 pattern was then deposited onto the Al2O3 ceramic substrate, using the SiO2 sputtering parameters in Table 2. Following deposition, the Al2O3 ceramic substrate with SiO2 pattern was disconnected from the vacuum chamber.

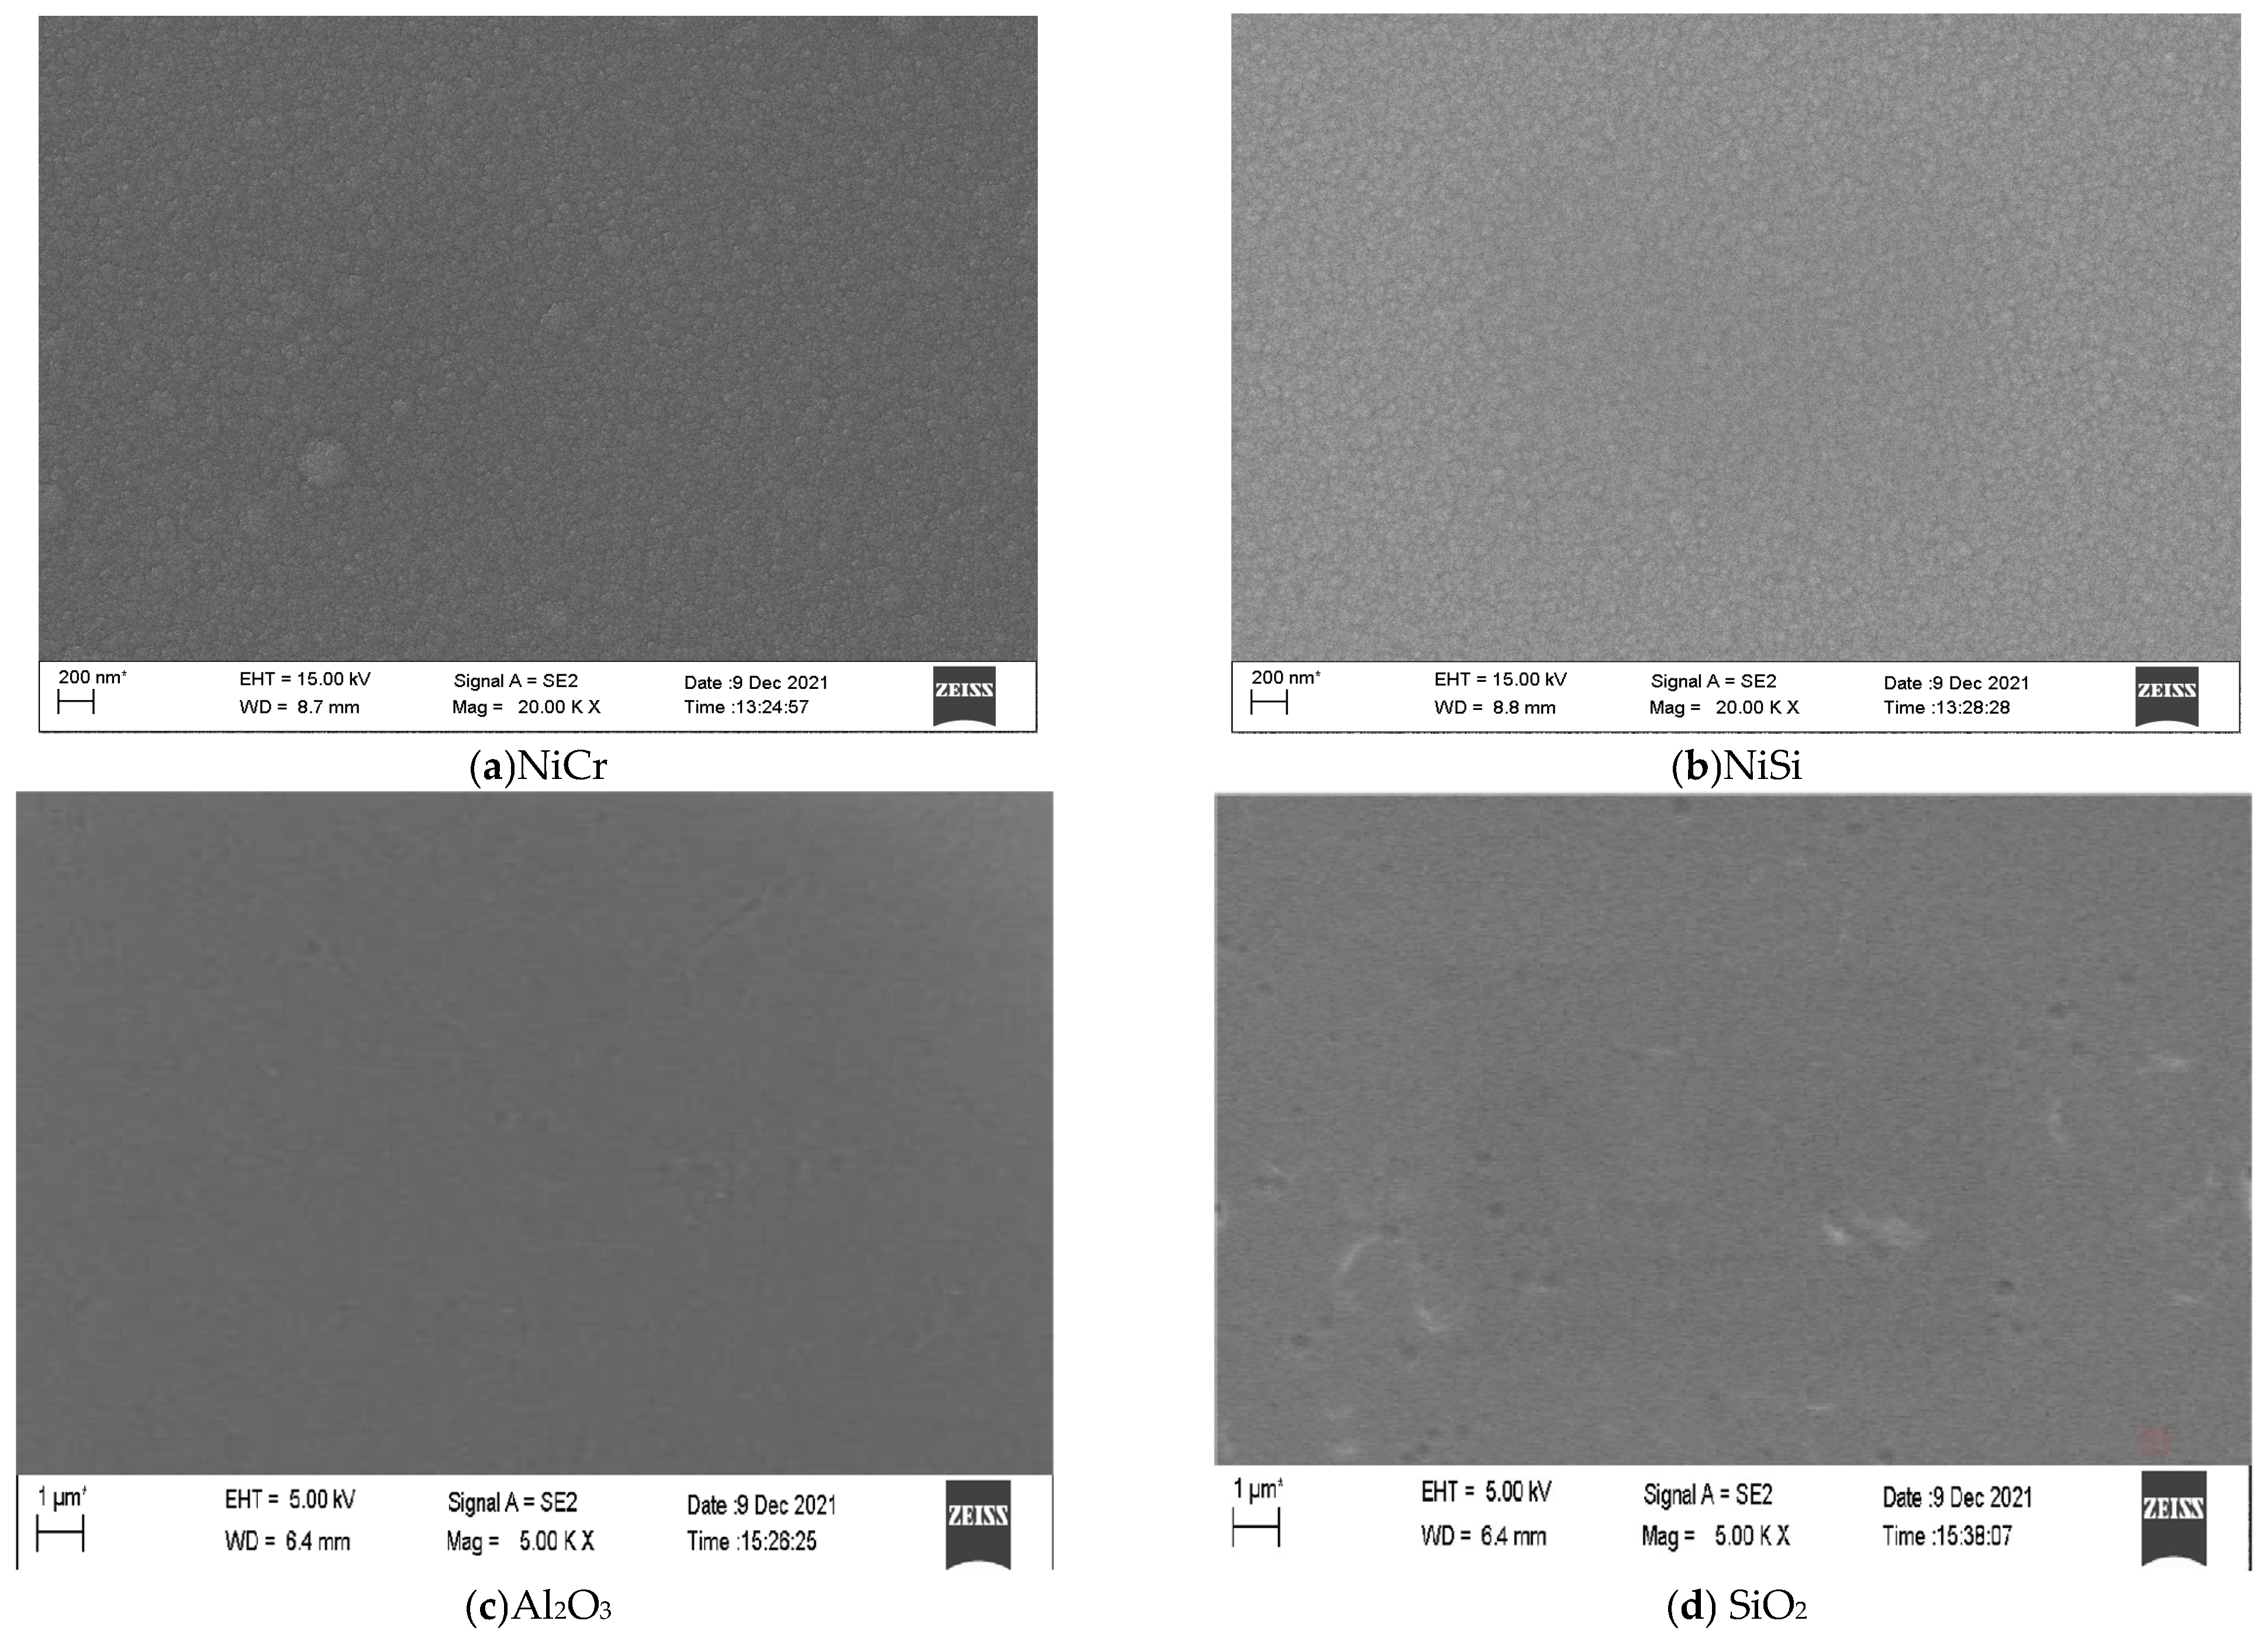
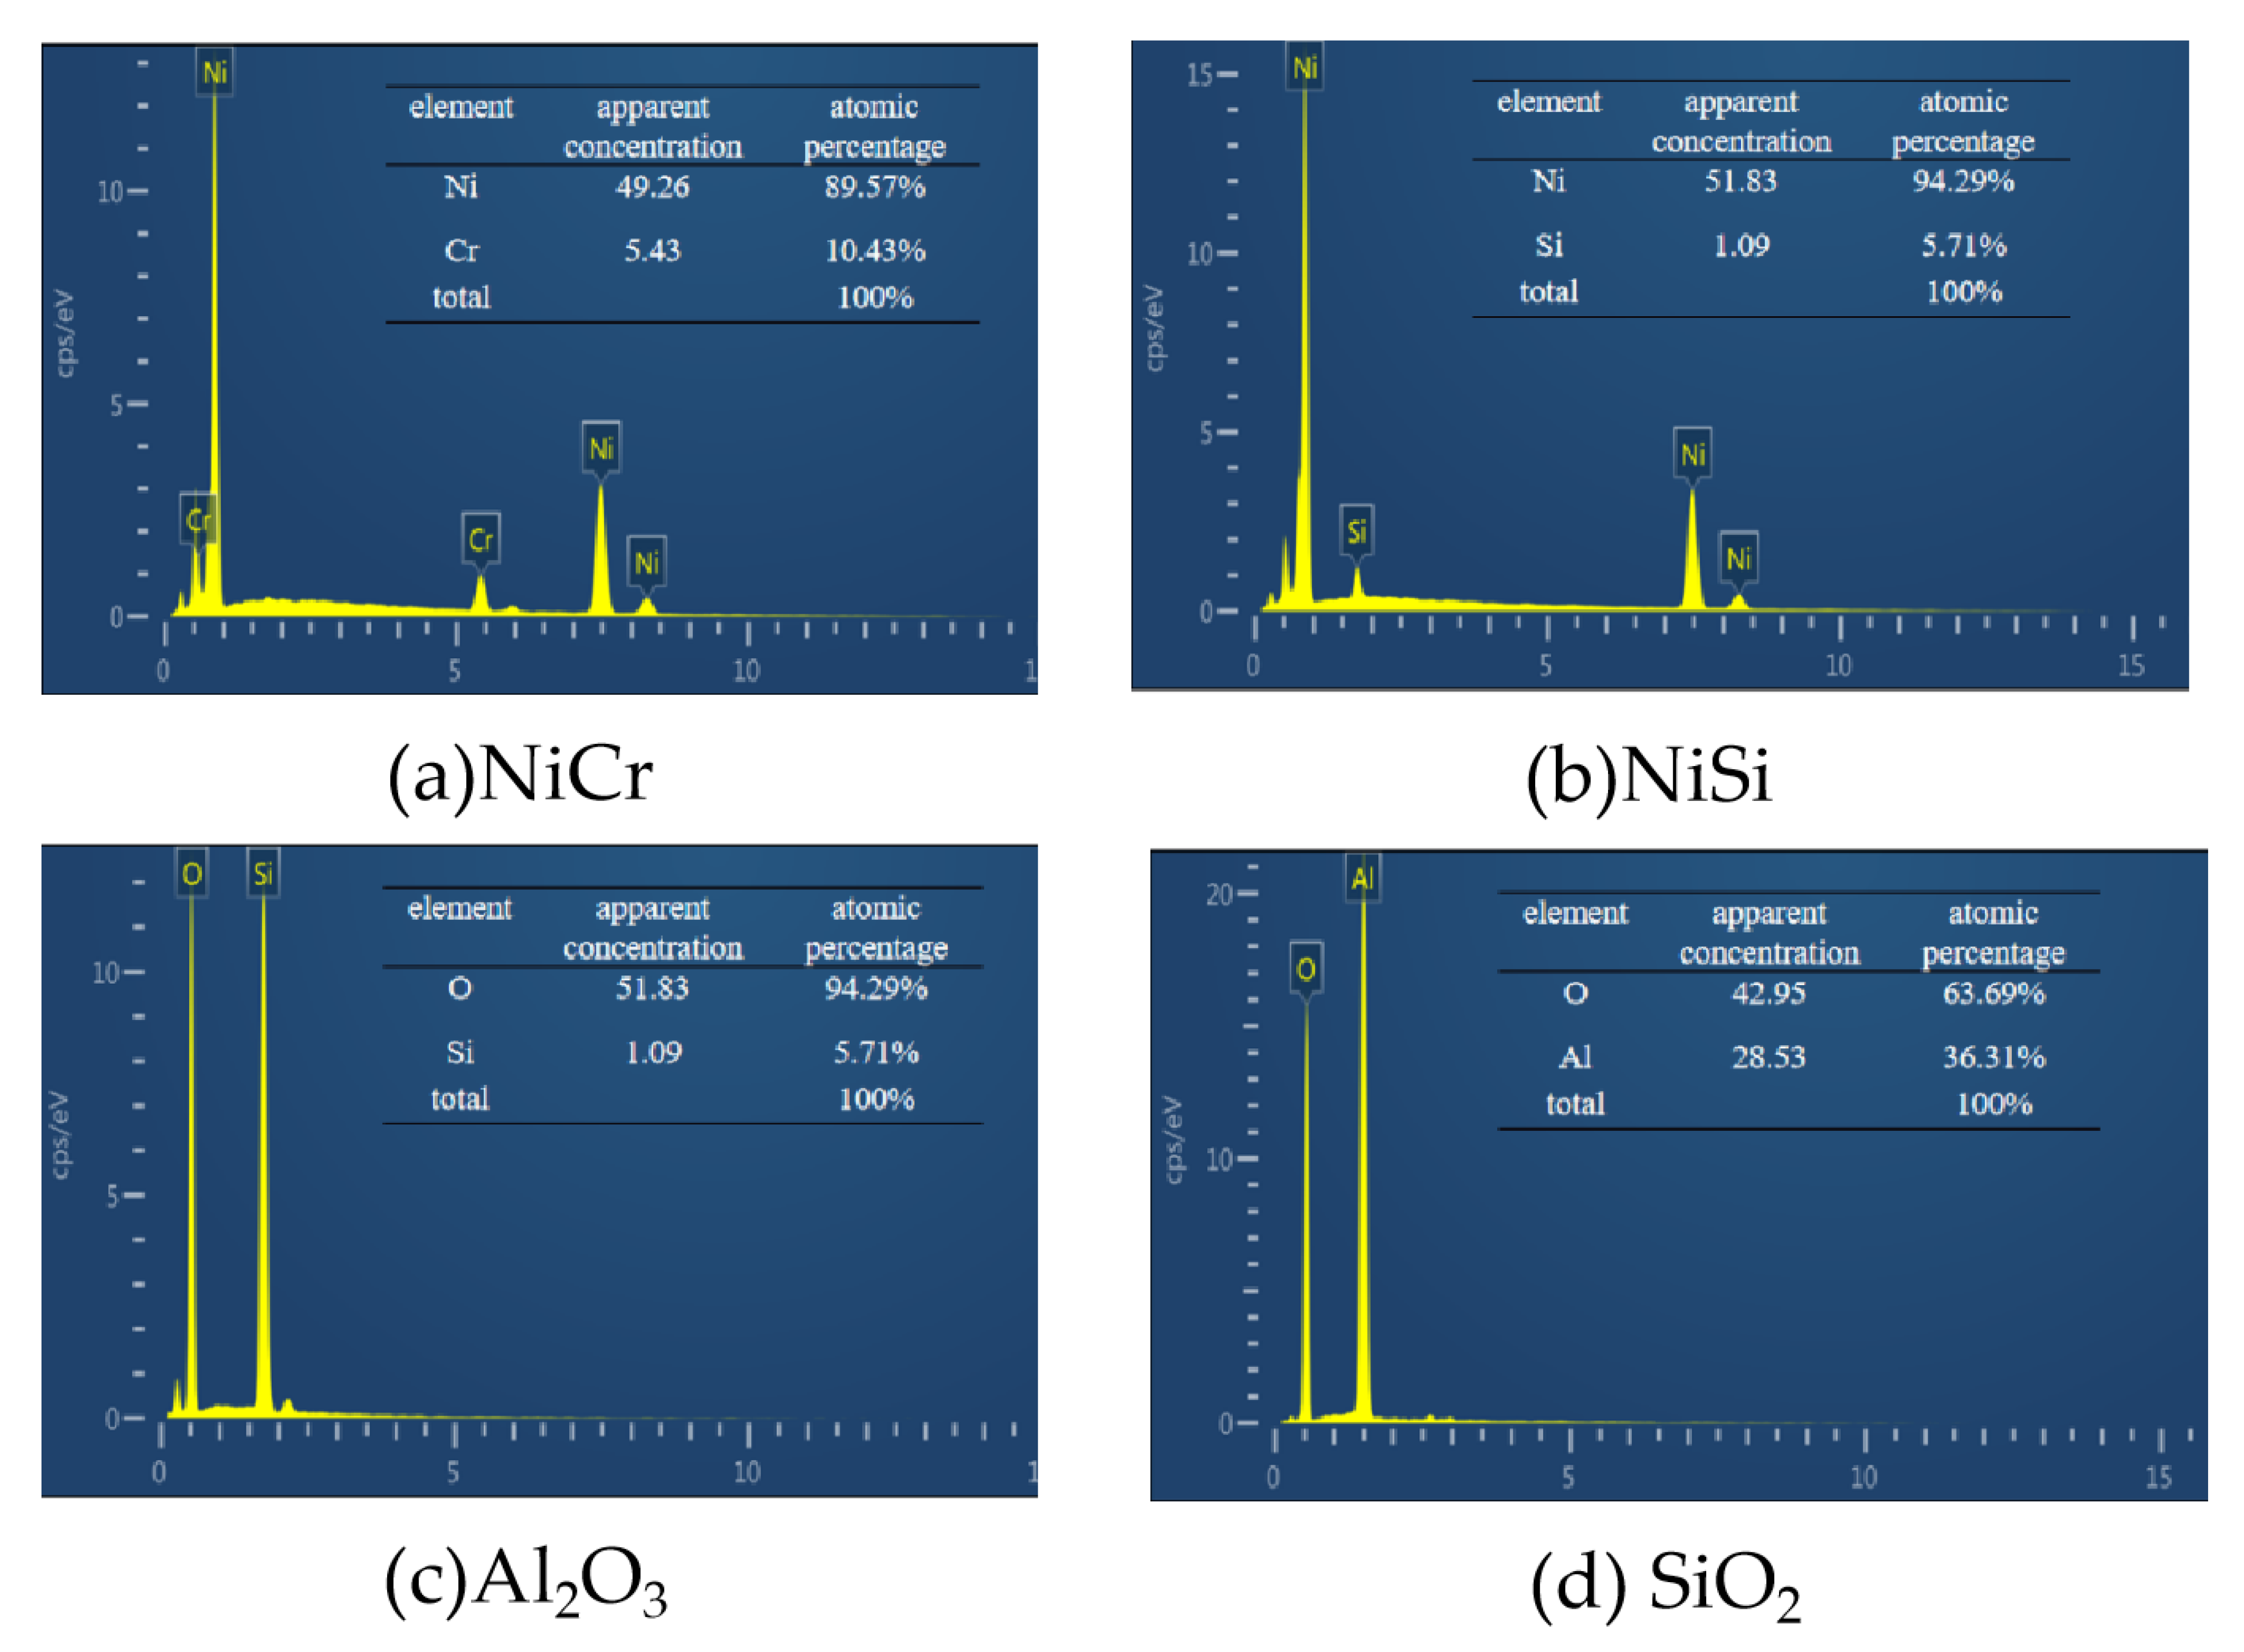
2.3.3. Characterization of Thin Films

Figure 6 shows SEM images of the surface morphology of the NiCr, NiSi, Al2O3, and SiO2 thin films. The films present dense, smooth structures, free of microcracks or holes. The compact and crack-free microstructure ensures good thermoelectric properties of the thermocouple films.
EDS was performed on the produced NiCr, NiSi, Al2O3, and SiO2 thin films for energy spectrum analysis. The findings are shown in Figure 7. As can be seen in Figure 7a, the mass fraction ratio of Ni/Cr in the NiCr thin film was 89.6:10.4, which is close to the target composition’s atomic ratio of 90:10. As can be seen in Figure 7b, the mass fraction ratio of Ni/Si of NiSi thin film was 94.3:5.7, which is close to the intended composition’s atomic ratio of 94:6. As can be seen in Figure 7c, the mass fraction ratio of Al2O3 thin film was 36.3:63.7, which is close to the target composition’s atomic ratio of 2:3. The mass fraction ratio of Si/O and of SiO2 thin film was 27.3:72.7, which is close to the atomic ratio of the target composition of 1:2, as illustrated in Figure 7d. The energy spectrum analysis of the thin film shows that the atomic proportion of the coating material was close to the atomic composition of the target material, which met the experiment’s expected requirements. The fabricated novel thin film heat flux sensor is shown in Figure 8.

3. Calibration and Application of the Novel Thin Film Heat Flux Sensor

The heat flux sensor is a nonstandard temperature measuring component. After the sensor is manufactured, it is necessary to calibrate its parameters and performance so as to determine its basic characteristics and accurately measure the heat flux [19]. In order to characterize the performance of the novel thin film heat flux sensor, a number of parameters should be measured, including sensitivity, response time, and repeatability.

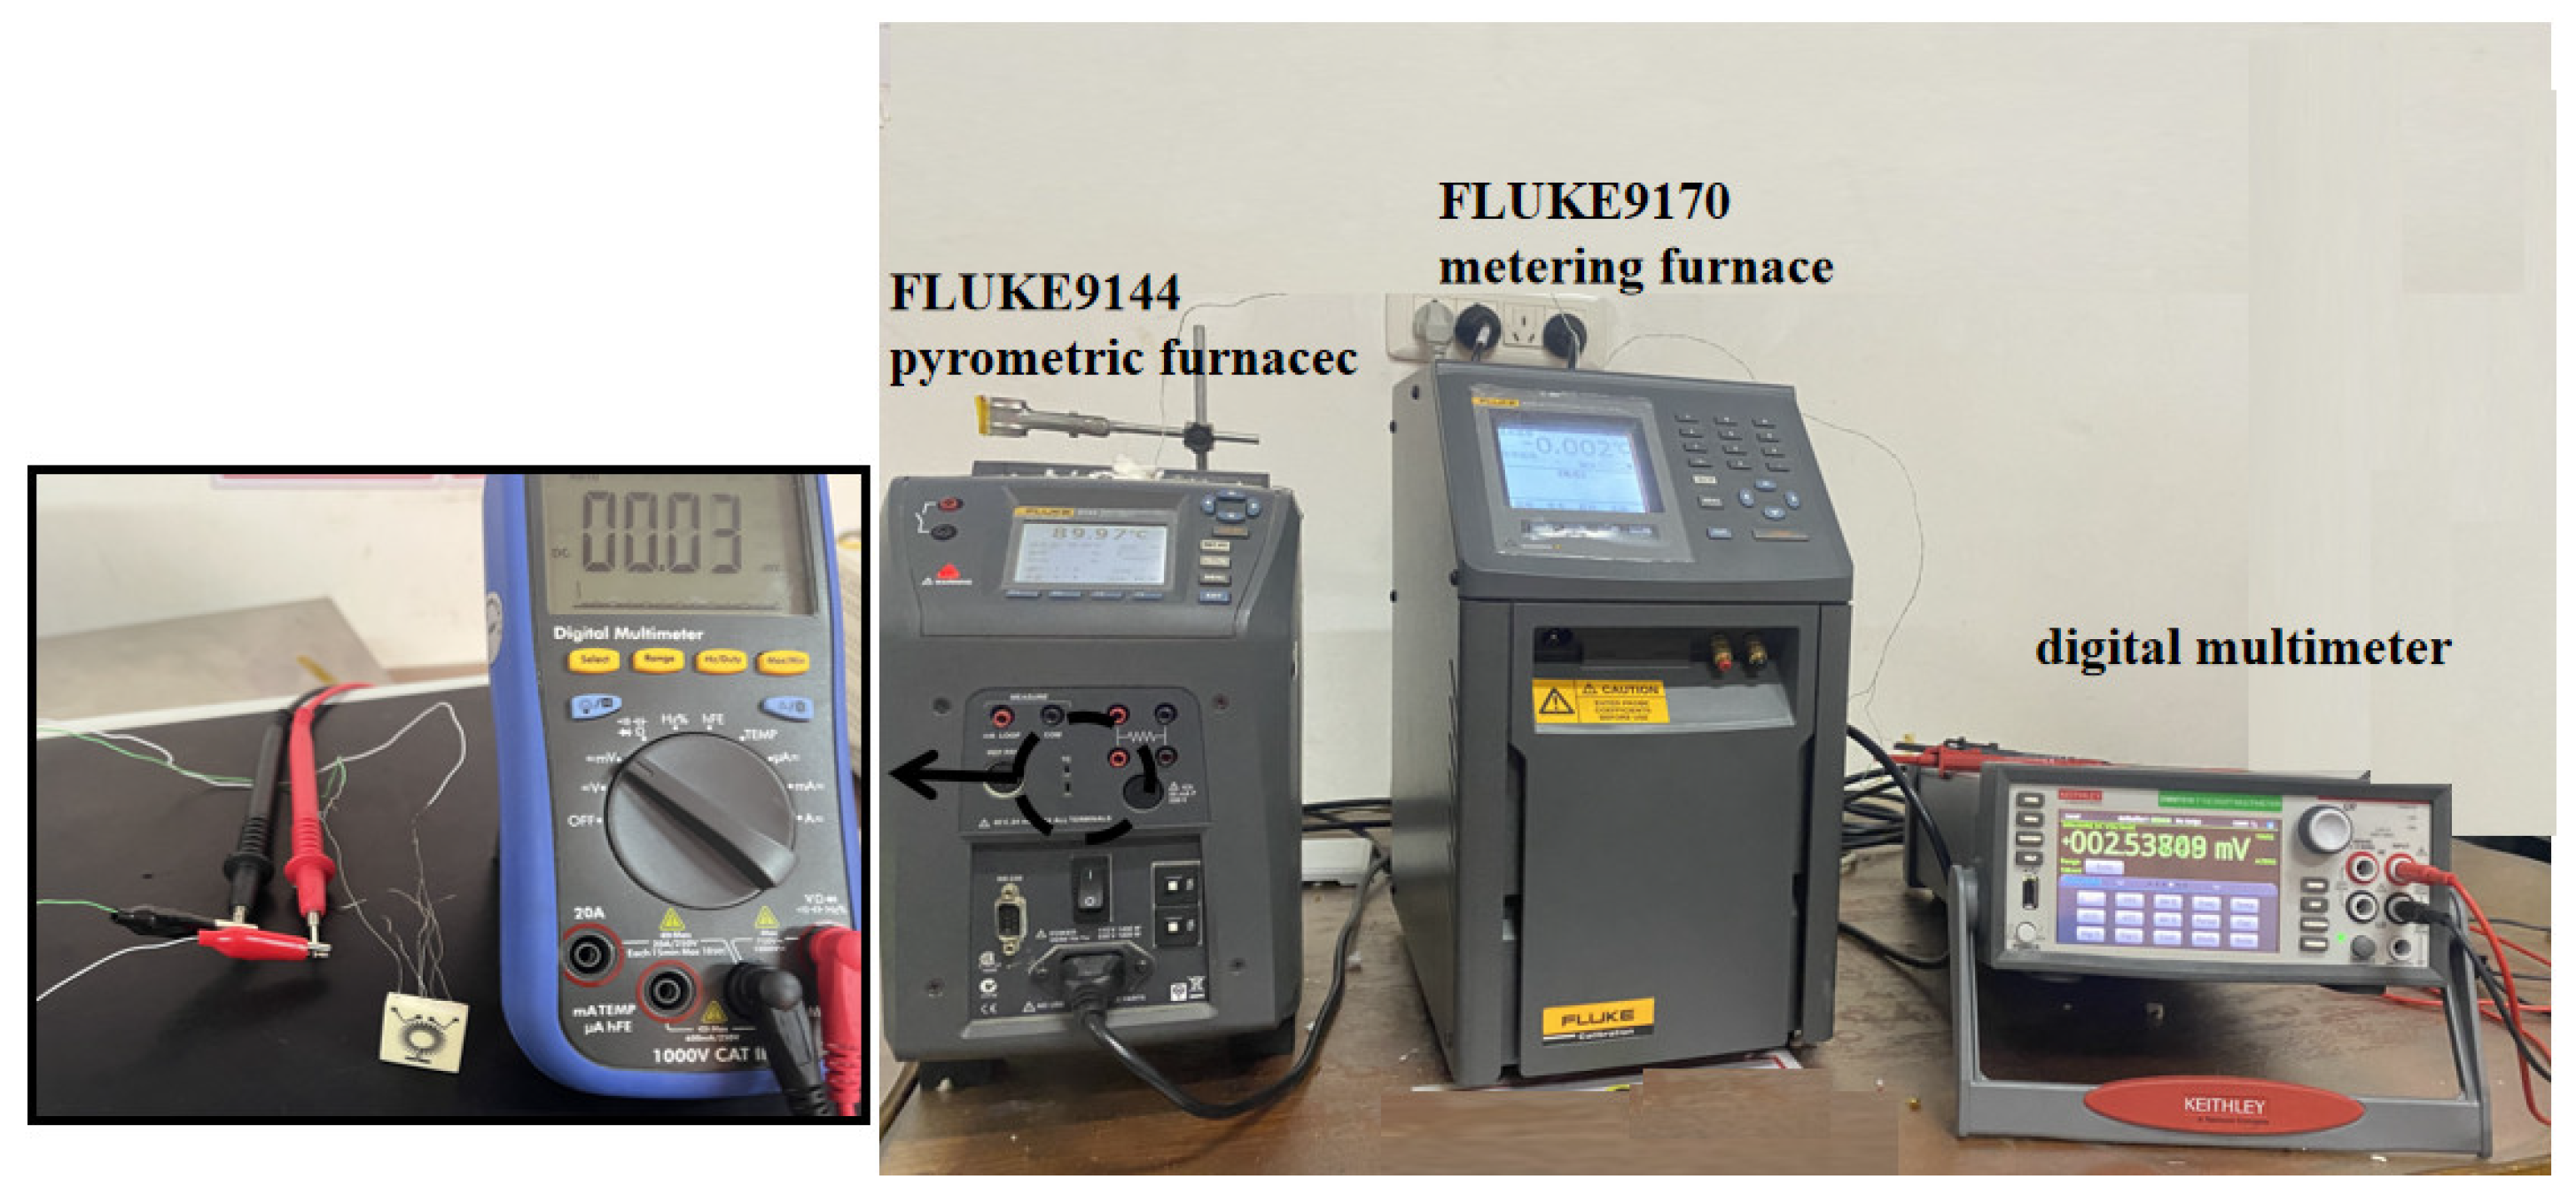
3.1. Sensitivity Calibration Experiment

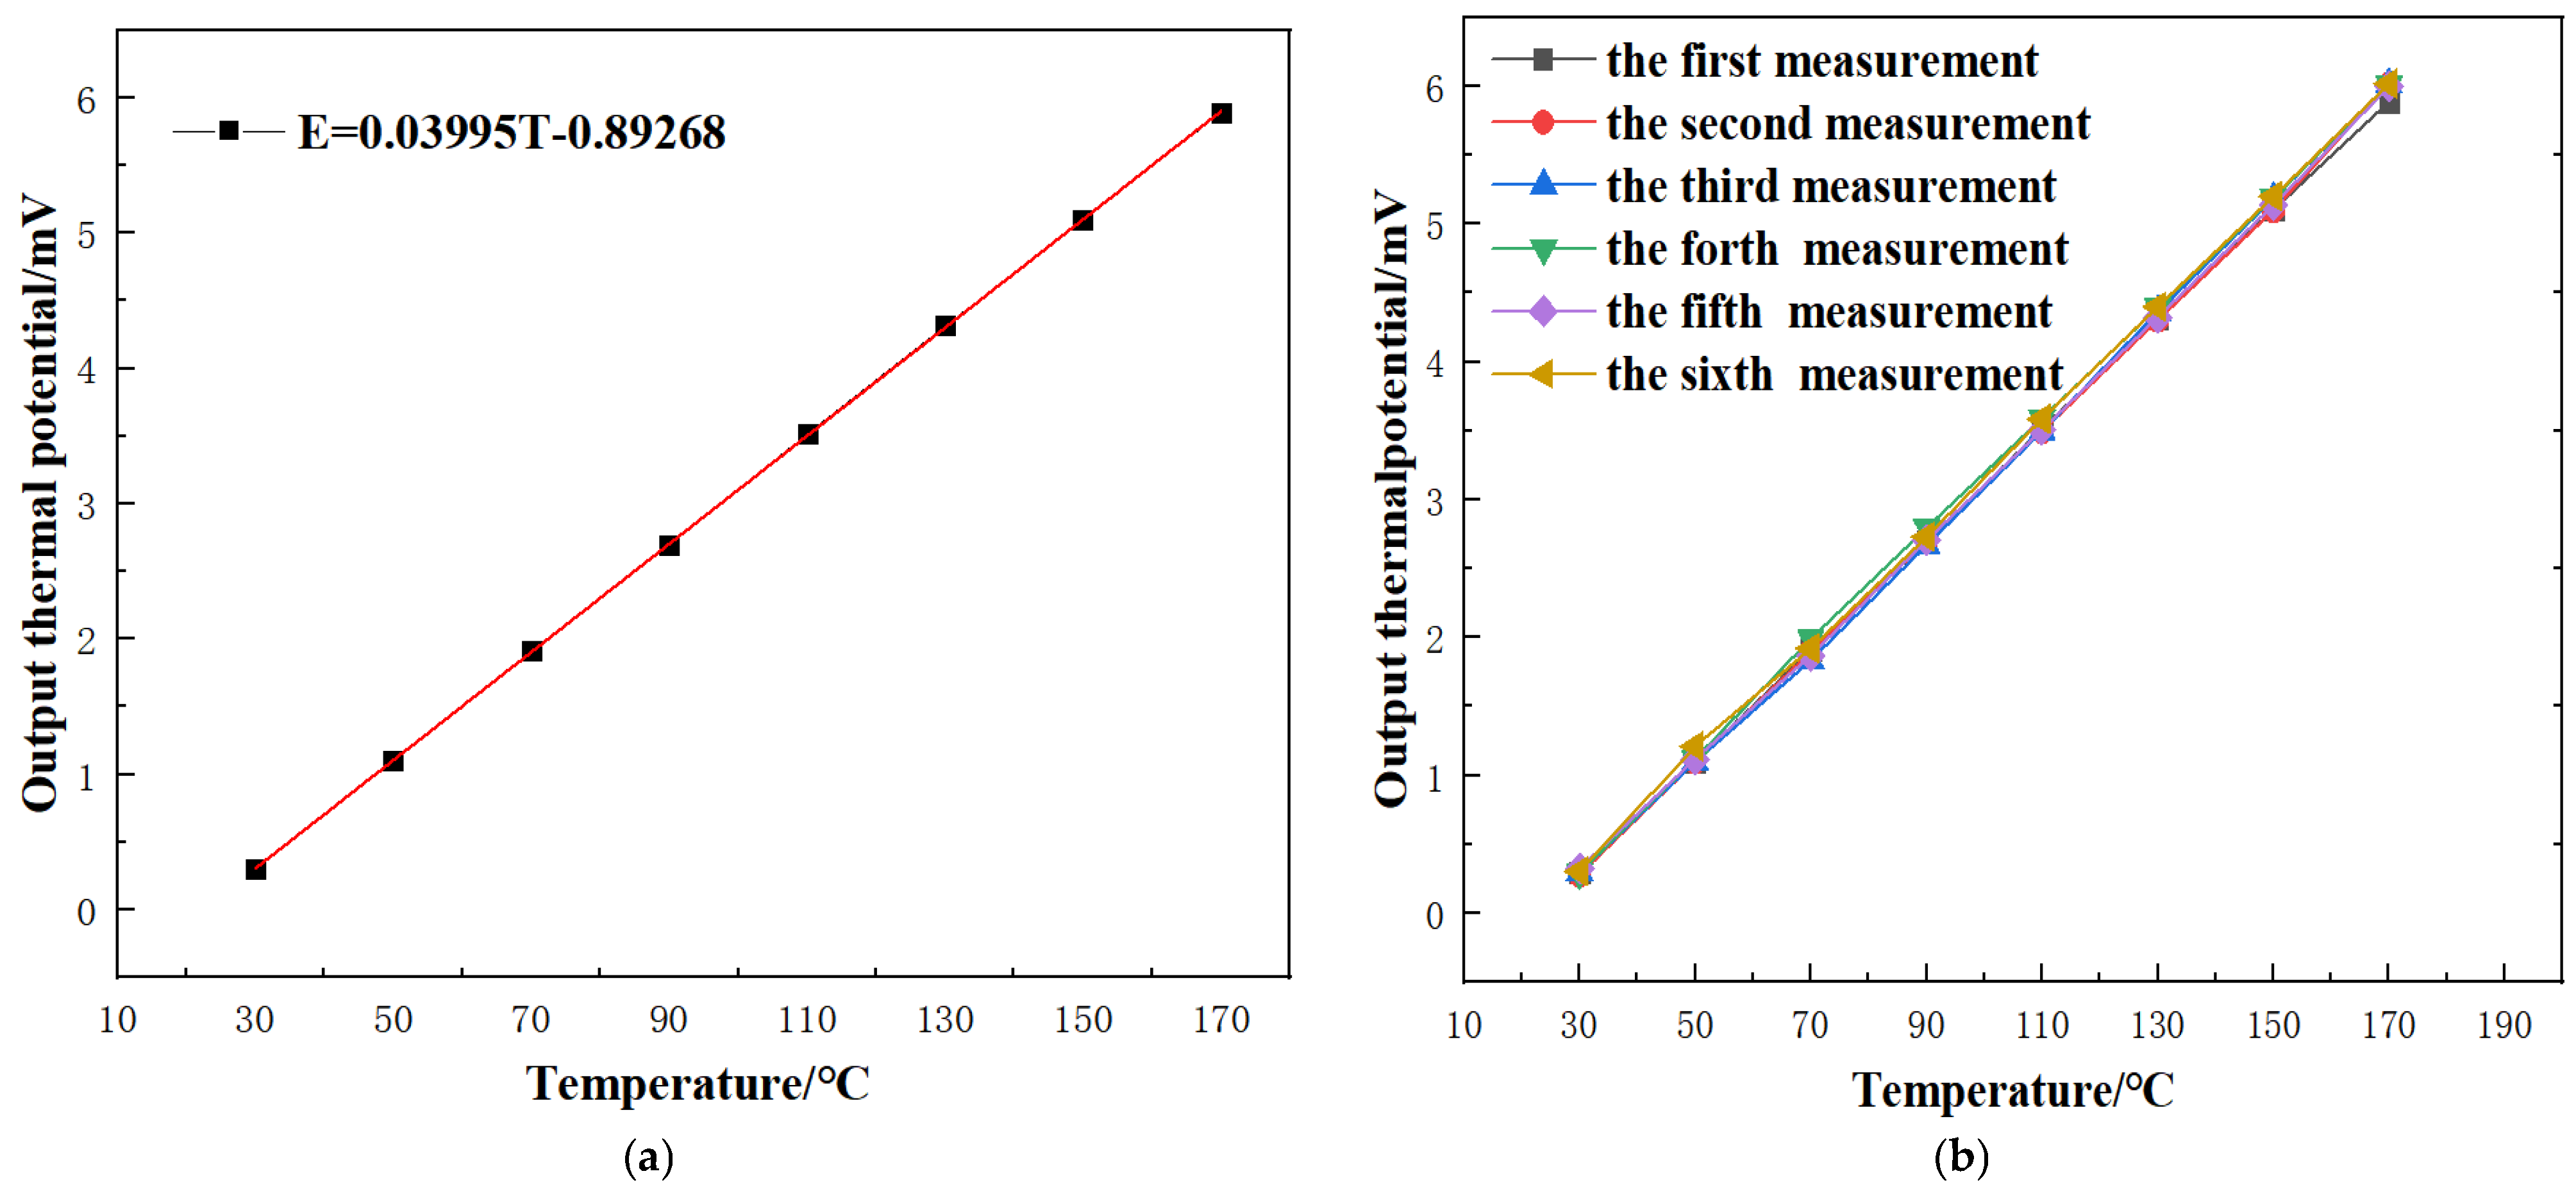
3.1.1. Sensitivity Calibration Experiment of Thin Film Thermocouple Temperature Sensor

The sensitivity calibration experiment of the thin film thermocouple temperature sensor was performed in a temperature-controlled metering furnace. The sensitivity calibration system consisted of a Fluke 9144 pyrometric furnace, a digital multimeter, and a Fluke 9170 metrology furnace, as shown in Figure 9.
The thin film thermocouple temperature sensor was placed in the middle section of the pyrometric furnace, and the other end of the leads were connected to the metering furnace, as the cold end of the sensor. The temperature of the cold end of the metering furnace was controlled at 0 °C, thus creating a temperature difference. The leads extended from the cold end of the metering furnace and were connected to the digital multimeter to collect data. The temperature sensor was placed in the high-temperature metering furnace, which was set between 30 and 170 °C, at 20 °C intervals, for calibration. Once the temperature reached the set point it was automatically held for 5 min, as shown in Table 3. The thin film thermocouple temperature sensor recorded a total of eight temperature points corresponding to the thermal potential, and the least squares method was used to fit the experimental data. The calibration curve is shown in Figure 10a.
The least squares method was employed to fit the static calibration data linearly. It can be seen from the experimental curve that the sensitivity of the thin film thermocouple temperature sensor was 39.95 μV/°C, which is close to the Seebeck coefficient of standard K-type thermocouples. It can be seen from the correlation coefficient (R2) of the fitting result that the fitting curve was highly consistent with the original function, with all R2 values above 0.99. It can be seen that R2 was relatively stable, with values close to one, indicating that the sensor had a strongly linear relationship with the measured heat flux. In addition, in order to ensure its authenticity, six sensitivity experiments were carried out on the thin film thermocouple temperature sensor. The results are shown in Figure 10b. The output potential of the six sensors showed little difference at various temperatures, which proves the stability of the sensor. The six curves obtained from the data were highly consistent, and the maximum error was 4.36%, which ensured the stability of the follow-up experiments.

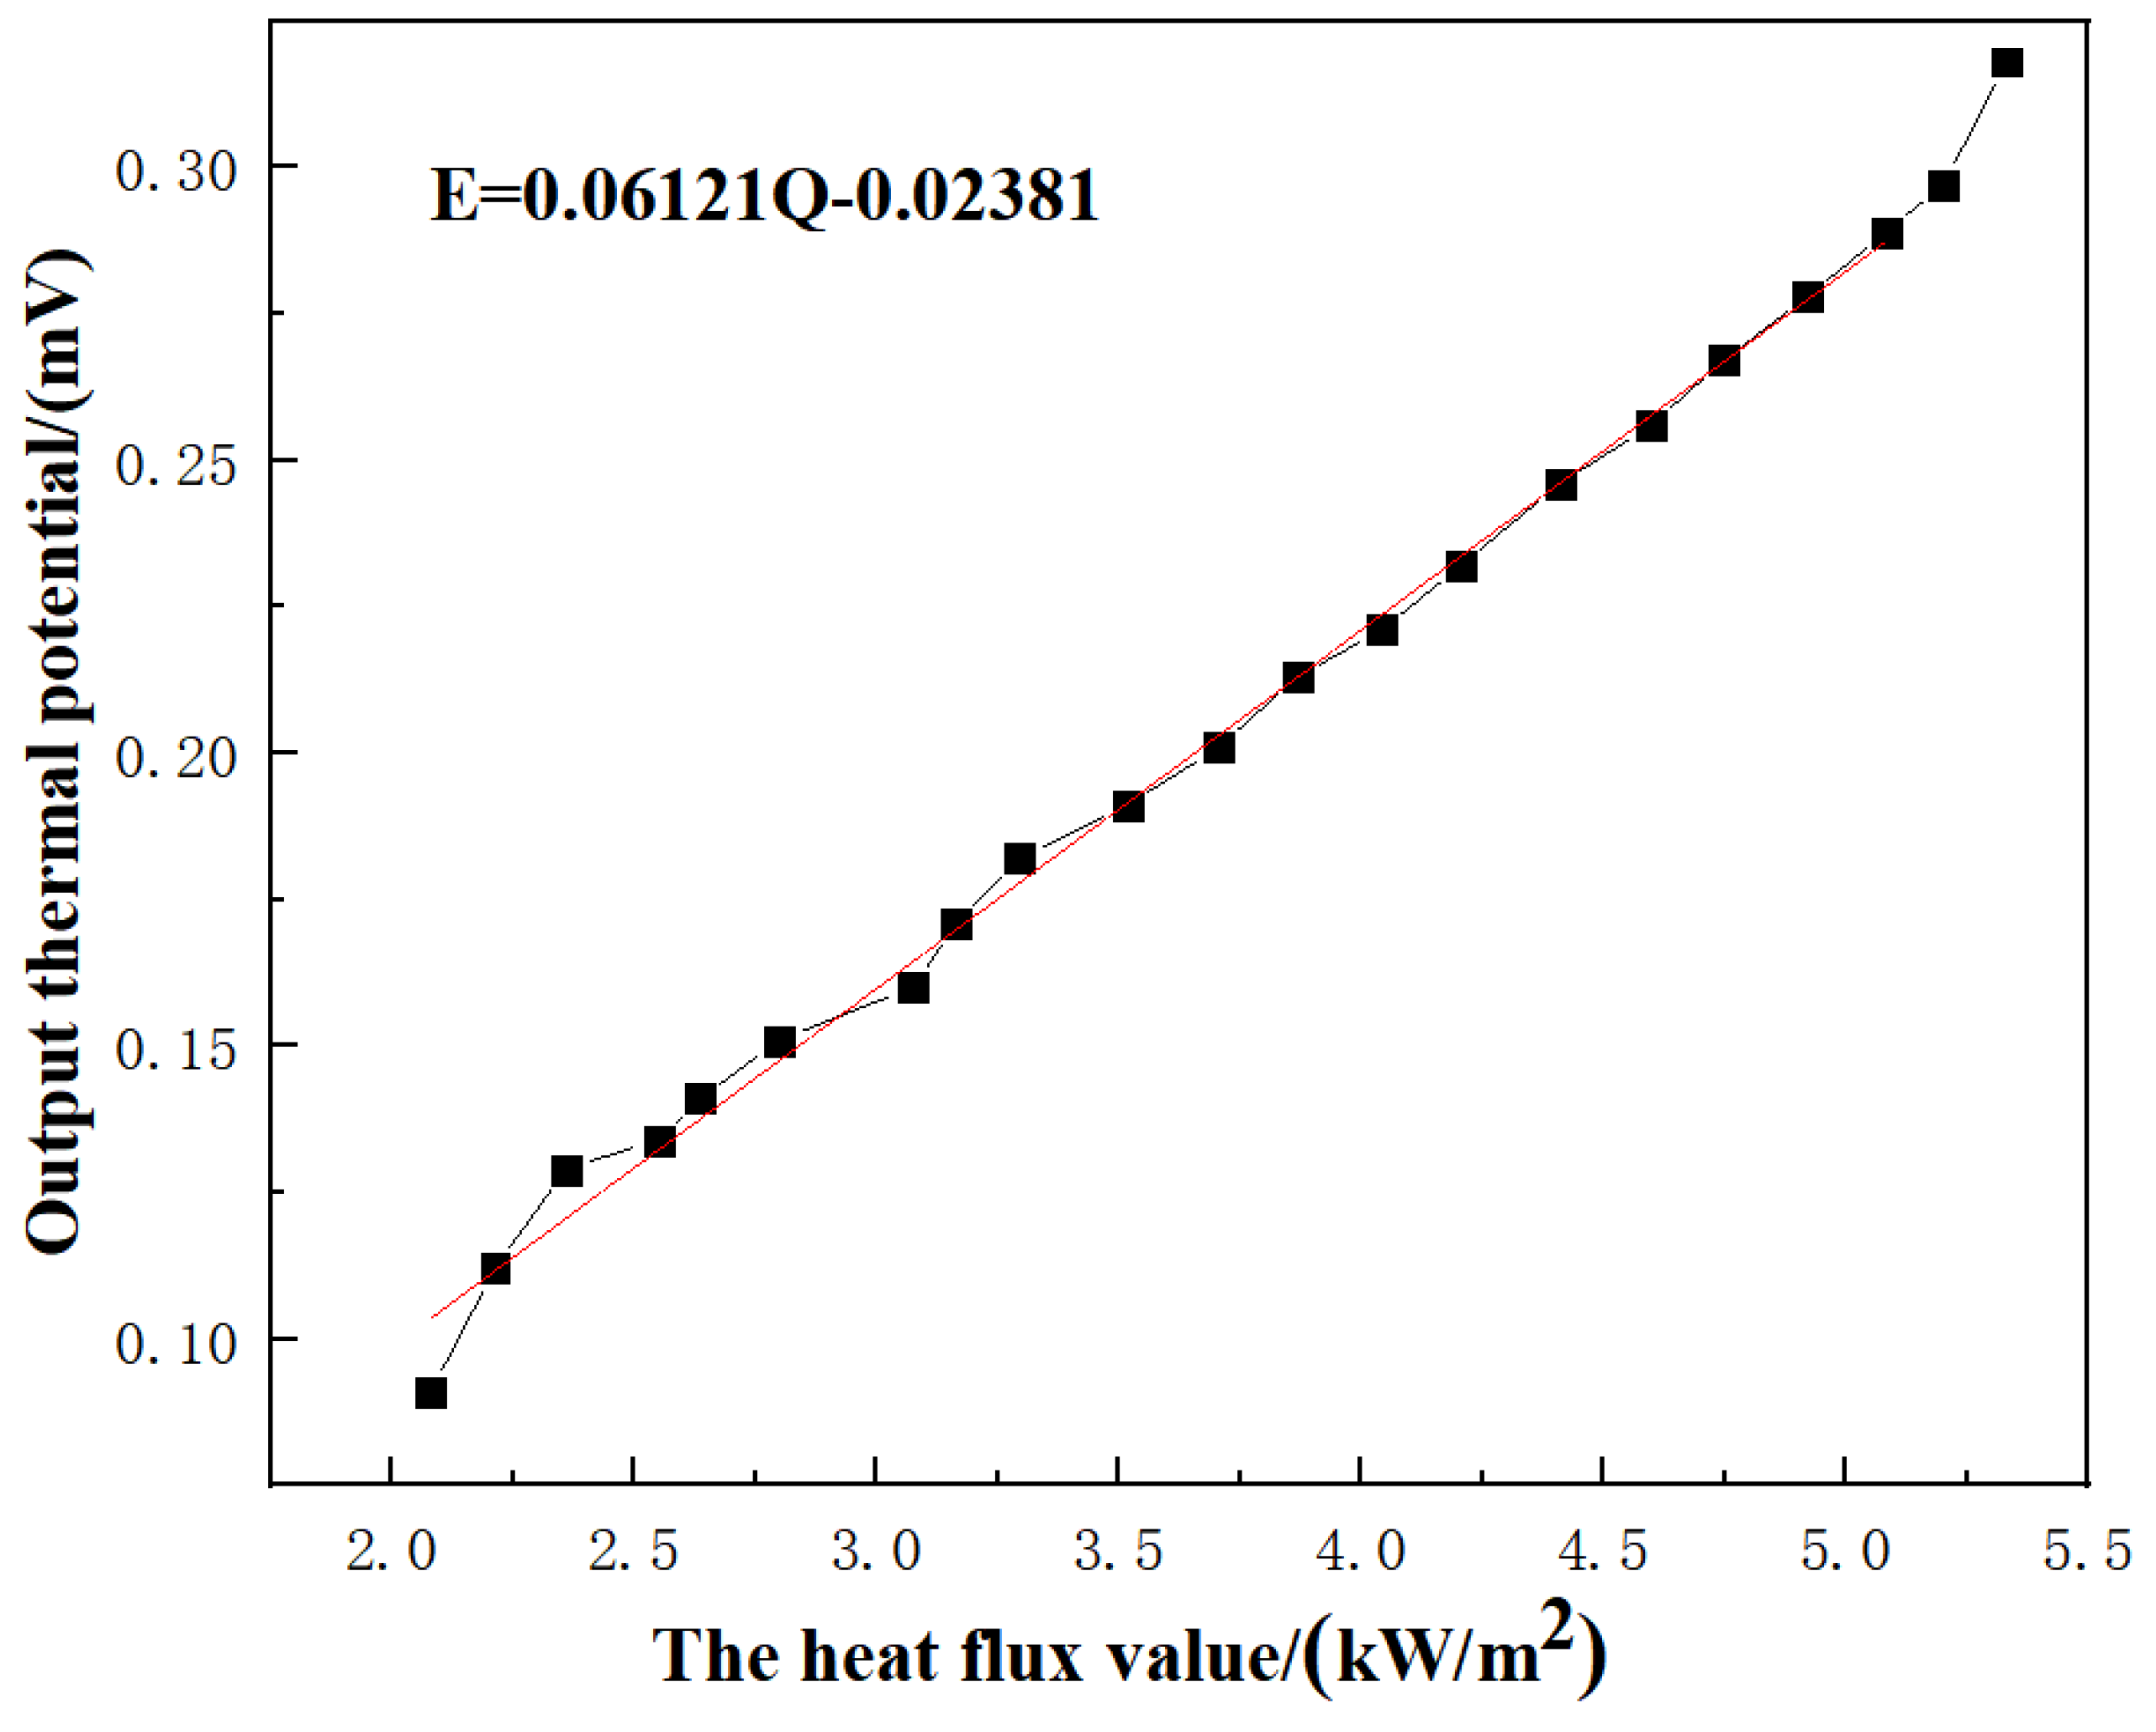
3.1.2. Sensitivity Calibration Experiment of the Novel Thin Film Heat Flux Sensor

A new calibration method has been presented in this paper. The novel thin film heat flux sensor sensitivity calibration system consisted of a Fluke 9118 A-C-256 horizontal metering furnace (which provided a closed environment); an adjustable DC-regulated power supply; a high-temperature ceramic heater data acquisition system; a standard heat flux sensor (a heat flux sensor with serial number M3022-01, produced by Shanghai Anyi Technology Co., Ltd.); and the novel thin film heat flux sensor, as shown in Figure 11. In this experiment, the horizontal metering furnace provided a closed environment. The high-temperature ceramic heater was heated at different heat flux rates by regulating the adjustable DC-regulated power supply, to obtain a range of levels to calibrate the novel thin film heat flux sensor. The output voltage data of the two sensors was recorded using a digital multimeter.
To avoid the calibration error caused by the heat loss of the high-temperature ceramic heater, the standard heat flux sensor and the novel thin film heat flux sensor were fixed with high-temperature cotton on both sides of the high-temperature ceramic heater, to achieve the purpose of uniform heat measurement, as shown in Figure 12. Next, the assembled sensor calibration device was placed in the Fluke 9118A-C-256 horizontal metering furnace. Next, the sensitivity calibration experiment of the novel thin film heat flux sensor was started.
The new method of calibrating the novel thin film heat flux sensor is to apply a reference heat flux to both the heat flux sensor to be calibrated and a standard heat flux sensor. The reference heat flux is provided by a high-temperature ceramic heater, and the standard heat flux sensor can accurately measure the reference heat flux. The sensitivity of the novel thin film heat flux sensor is obtained by dividing its voltage output by the heat flux measured and by the standard sensor. In this study, the heat flux values varied in the range of 2.08 to 4.16 kW/m2, and 16 values were used to calibrate the novel thin film heat flux sensor, as shown in Table 4.
The least squares method was employed to fit the sensitivity calibration data linearly. The following expression can be seen from the experimental curve between the heat flux and the output thermoelectric potential on the graph—E = 0.06121Q − 0.02381, as shown in Figure 13. The novel thin film heat flux sensor had strong sensitivity above 0.06 mV/(kW/m2) and a linear fitting correlation coefficient (R2) that was considerably above 0.99. It can be observed that R2 was relatively stable, with a value close to one, which indicates a strongly linear relationship between the sensor and the measured heat flux. The experimental results show that the novel heat flux sensor has high sensitivity and linearity. During the calibration of sensitivity below 3.52 kW/m2, the novel thin film heat flux sensor was somewhat unstable, which was inconsistent with the fitting curve. However, the sensor was between 3.52 and 4.60 kW/m2, which is highly coincident with the fitting curve, indicating that the sensor performance was more stable in this range and the measurement of the heat flux was more accurate.

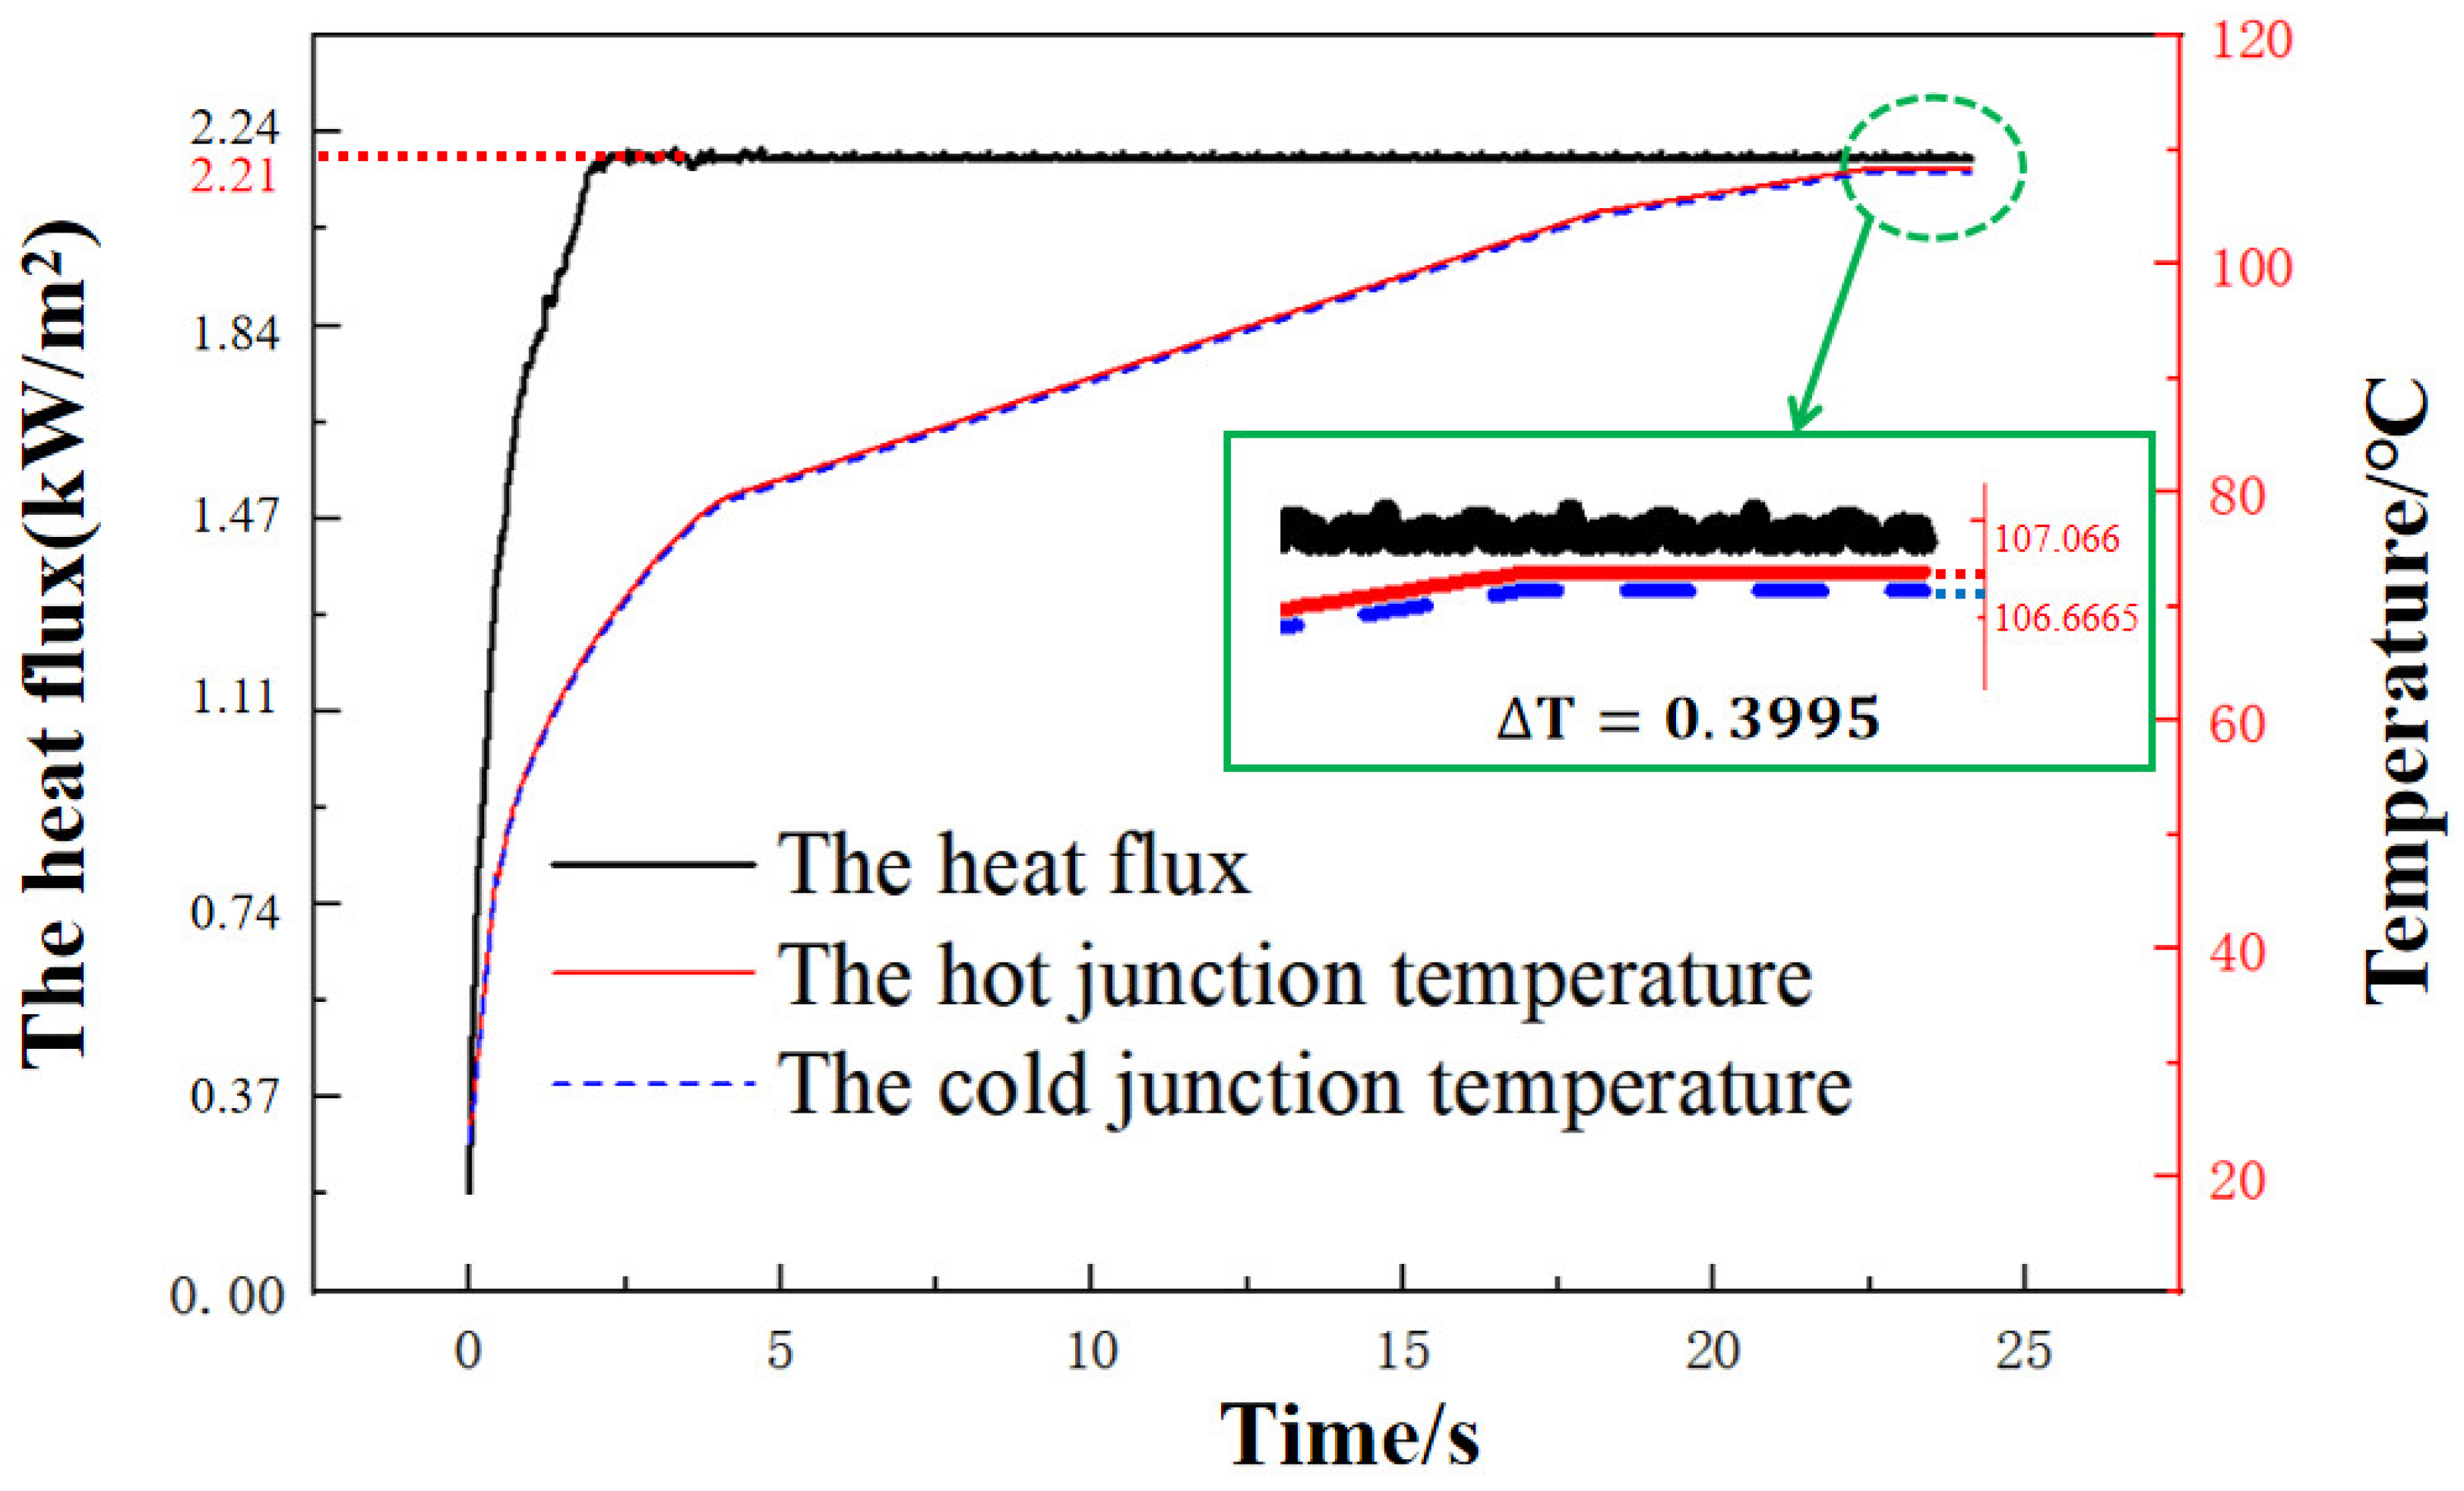
3.2. Response Time Calibration Experiment

In the fields of aeronautics and astronautics, it is necessary to know the response time of a thin film heat flux sensor when measuring high-frequency thermal disturbances [20]. In this paper, the step response method was used to test the dynamic response time of the novel thin film heat flux sensor. The sensor was mounted in the Fluke 9118 A-C-256 horizontal metering furnace, which provided a constant temperature zone for dynamic calibration. In order to guarantee that the temperature field in the furnace would be constant and the heat output and heat dissipation of the high-temperature ceramic heater reached a steady state, the adjustable DC-regulated power supply working parameters were set at a voltage of 10 V, an electrical current of 0.58 A, and a heating time of 20 min. Figure 14 shows the change in the output voltage of the novel thin film heat flux sensor with time. When a heat flux of 2.21 kW/m2 was applied, the output voltage increased rapidly with time. According to the curve, the time required for the novel thin film heat flux sensor to output 63.2% of the thermoelectric potential when it reached the steady state value was calculated, giving a time constant, τ , of 475 ms. At first, the heat flux sensor increased with an increased heat flux. When the heat flux reached 2.21 kW/m2, the output thermoelectric potential of the heat flux sensor tended to be stable. Finally, when the output thermoelectric potential was 0.12 mV, it was stable. Scholars, both domestically and abroad, have also tested the response time of thin film heat flux sensors, and the results are shown in Table 5.
Using the above experimental method, the novel thin film heat flux sensor was evaluated for multiple dynamic responses, under multiple heat flux rates. The dynamic experiment results are shown in Figure 15. Under the conditions of 2.21, 2.80, 3.16, and 3.71 kW/m2, the response time was constant, τ , at 475, 477, 471, and 480 ms, respectively. The response time of the novel thin film heat flux sensor was tested under different heat flux conditions. It was found that the output thermoelectric potential of the sensor increased at first and then tended to be stable. Finally, the new version was more stable, and the response time was similar. It could also be seen that the response time of the heat flux sensor was independent of the heat flux.

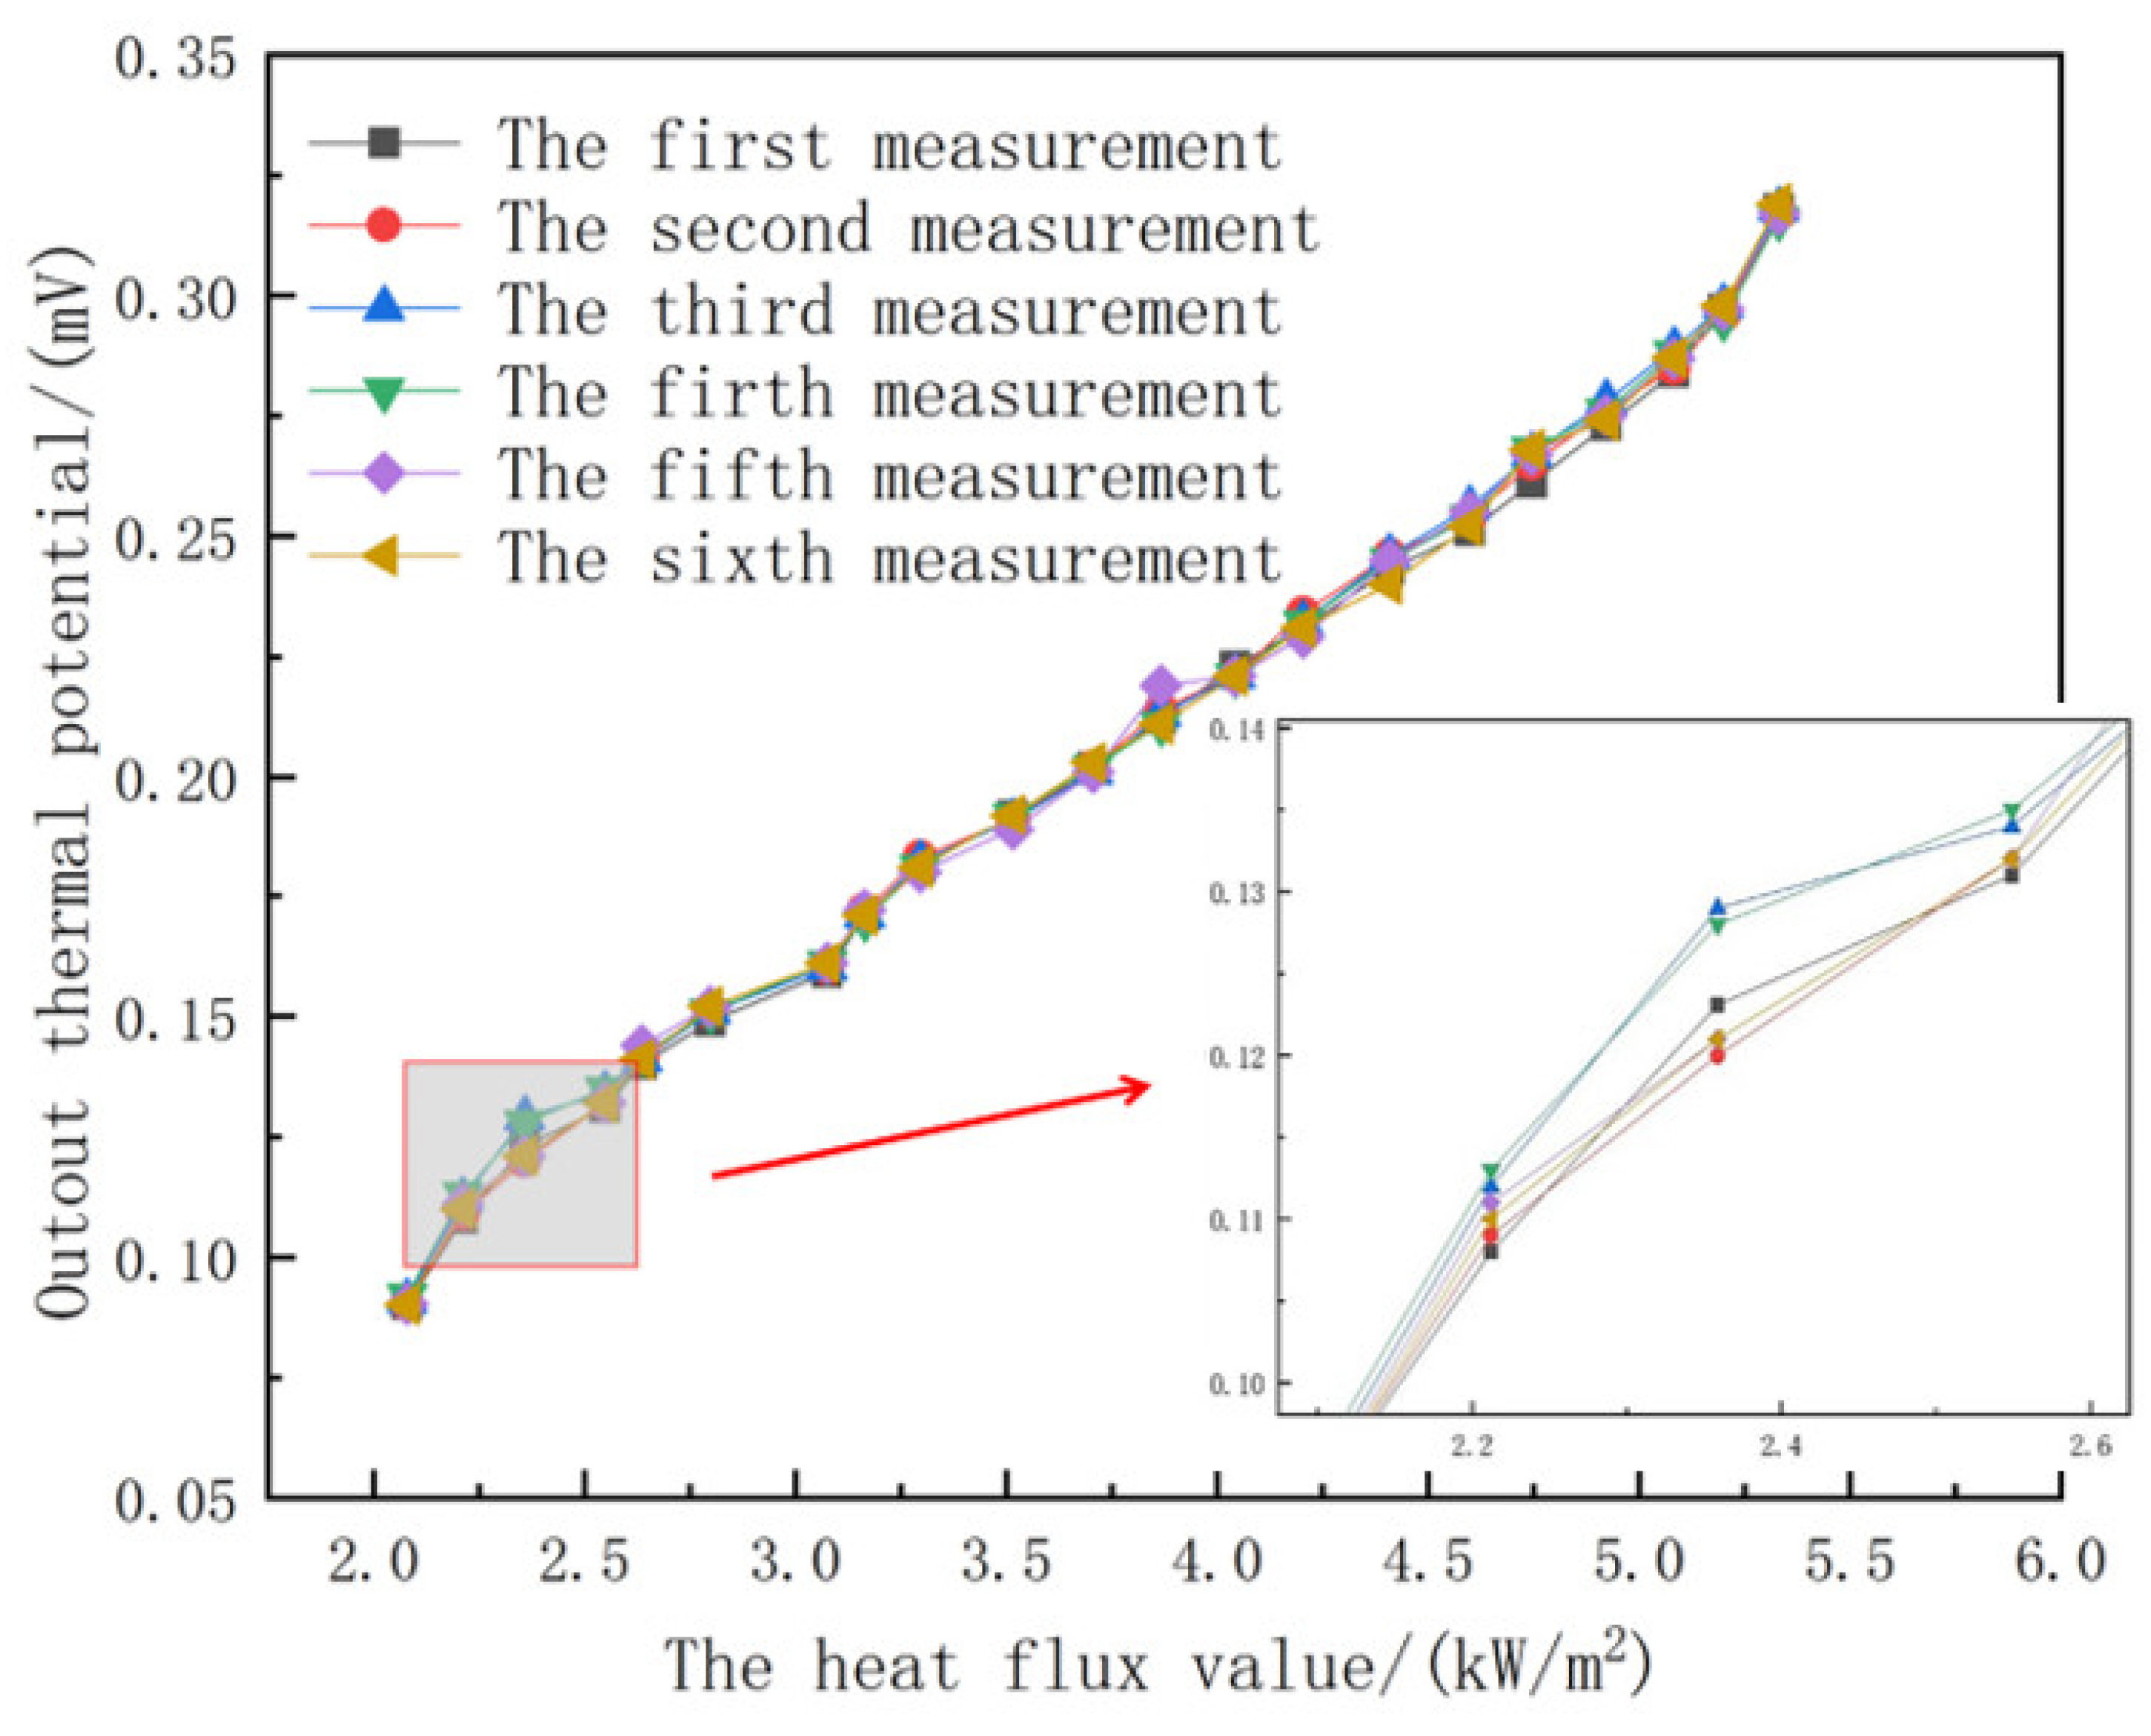
3.3. Repeatability Experiment
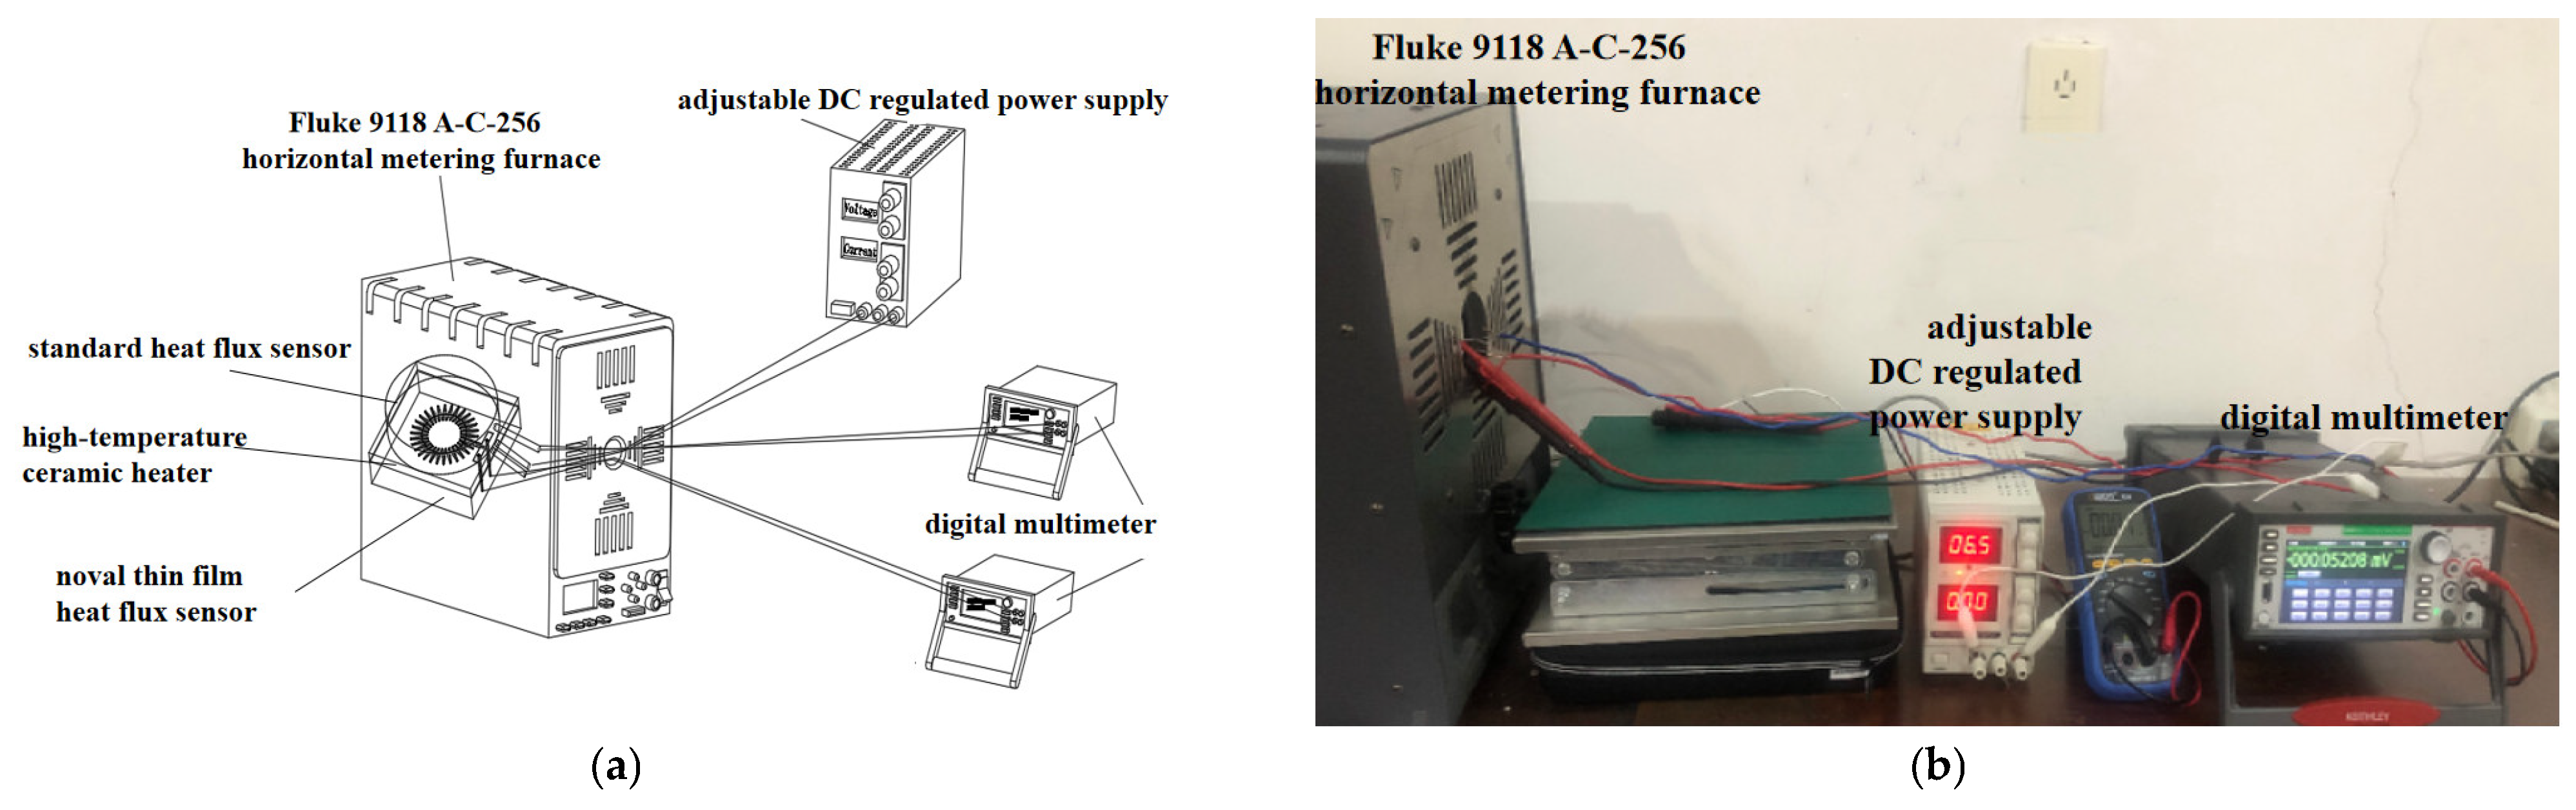
Repeatability is another key factor in novel thin film heat flux sensor performance [23]. In order to characterize the repeatability, a heat flux of 2.21 kW/m2 was applied to the surface of the novel thin film heat flux sensor and the output voltage curves were recorded. The six sets of experimental data are shown in Table 6. The table also explains how repeatability was assessed using an equation. The experimental data were analyzed, as shown in Figure 16. It can be observed that the novel thin film heat flux sensor had excellent repeatability in six sets, at a heat flux of 2.21 kW/m2, and there was only a slight change in the peak voltage (from 0.316 to 0.319 V), which indicates that the repeatability performance of the sensor is very stable.
As can be seen from the figure, the six sets of measurements of the novel thin film heat flux sensors coincide well, overall, but there are still minor differences. A repeatability error analysis was performed on the six groups of data, as follows:
σ = X i X 2 n     1
where, n is the actual number of measurement methods, Xi is the result of each measurement, X is the average of several measured values, and it is the deviation from the standard.
The repeatability error is as follows:
δ = σ x × 100 %
The experimental data were analyzed using the error formula, Formula (10). When the heat flux was 2.0803 kW/m2, the sensor repeatability error was the largest, at 1.55%, according to the experimental results. With an increased heat flux, the repeatability error was relatively small, always varying from 0.17 to 0.81%. According to the results of the above experiments, the novel thin film heat flux sensor has excellent repeatability and can achieve multiple accurate measurements.

3.4. Application

Heat transfer plays an important role in workpiece-forming processes, where the behavior of both the workpiece and the tool is strongly affected by the temperature fields. Heat flux is commonly assumed to be governed by the interface of the heat-transfer coefficient in the heat transfer [24]. The common method is to use the experimentally established time–temperature relationship to estimate the temperature difference of the cold–hot junction. The heat-transfer coefficient is defined as the ratio of the heat flux and the temperature difference of the surface [25]. The novel thin film heat flux sensor was designed with this in mind, to study the temperature difference and the heat transfer coefficient directly.
Figure 17 shows a plot of the surface of the cold and hot junction temperatures and the corresponding heat flux, when a heat flux of up to 2.21 kW/m2 was applied. The voltage output of the surface temperature of the junctions was monitored by a digital multimeter during the response time calibration experiment in real time. The surface temperature of the hot junction was 107.066 °C, and that of the cold junction was 106.6665 °C, with a difference of 0.3995 °C. Table 7 lists some studies on the measurement of the heat transfer coefficient of thin films in the literature.
Therefore, after determining the heat flux value, the thin film insulation thickness, and the temperature difference between the cold and hot junctions, we can measure the thermal conductivity of the thermal resistance film, using the novel thin film heat flux sensor. The thermal conductivity can be measured on a sensor, which is simpler than the traditional method for measuring thin films.

4. Conclusions

This paper has presented the design, fabrication, and calibration of the novel thin film heat flux sensor. The main conclusions are as follows:
A new sensor substrate structure was designed, and the lead wire was directly combined with the sensor substrate by ceramic sintering technology, to improve the signal output capability of the sensor.
A new calibration method has been presented to calibrate the novel thin film heat flux sensor. Using a Fluke 9118 A-C-256 horizontal metering furnace provided a closed environment, which effectively solved the problem of heat dissipation in the calibration process. This provided a better environment for the novel thin film heat flux sensor’s calibration.
The calibration results showed that the novel thin film heat flux sensor had a nearly linear response to the incident heat flux, with a sensitivity of 0.06 mV/(kW/m2), and a response time of 475 ms. The sensor showed good repeatability, the maximum repeatability error of the novel thin film heat flux sensor was 1.55%. The sensitivity of the thin film thermocouple temperature sensor was 39.95 μV/°C.
On the novel thin film heat flux sensor, the surface temperature of the hot junction was 0.3995 °C higher than the temperature of the cold junction.
The heat-transfer coefficient of Al2O3 thin film was 4.477 (w/(m∙k)). It was feasible to simplify the experimental device for measuring the heat-transfer coefficient by using the novel thin film heat flux sensor that was designed in this study.
We are still trying to solve the problem of the quick response of the heating plate. We are doing this by breaking through the materials with a higher temperature, and by making the application range of the heat flux sensor more extensive. In addition, efforts are also being made to standardize the sensor package testing and to improve repeatability.

Author Contributions

H.L., methodology, software, validation, formal analysis, investigation, and data curation; H.W., validation; S.G., software and validation; M.E., data curation and validation; Y.C., conceptualization, resources, writing—original draft, supervision, project administration, and funding acquisition; W.D., resources; J.Y., conceptualization and funding acquisition. All authors have read and agreed to the published version of the manuscript.

Funding

This work was supported by the National Natural Science Foundation of China (No.s: 52175379, 51905071, 52275407, and 52072056); the project of the Department of Education for Liaoning Province, China (No.s: LJKZ0483 and LJKZ0473); the Doctoral Research Foundation of Liaoning Province (2019-BS-043); the Key Laboratory of Precision and Special Processing of the Ministry of Education; and the Dalian University of Technology (JMTZ201902).

Institutional Review Board Statement

Not applicable.

Informed Consent Statement

Not applicable.

Data Availability Statement

Not applicable.

Conflicts of Interest

The authors declare that they have no known competing financial interests or personal relationships that could have appeared to influence the work reported in this paper.

References

  1. Siroka, S.; Berdanier, R.A.; Thole, K.A.; Chana, K.; Haldeman, C.W.; Anthony, R.J. Comparison of thin film heat flux gauge technologies emphasizing continuous-duration operation. J. Turbomach. 2020, 142, 091001. [Google Scholar] [CrossRef]
  2. Belcastro, C.M.; Foster, J.V.; Shah, G.H.; Gregory, I.M.; Cox, D.E.; Crider, D.A.; Groff, L.; Newman, R.L.; Klyde, D.H. Aircraft loss of control problem analysis and research toward a holistic solution. J. Guid. Control. Dyn. 2017, 40, 733–775. [Google Scholar] [CrossRef]
  3. Muhammad, H.M.; Krawczuk, M.; Shahzad, H. An overview of heat transfer enhancement based upon nanoparticles influenced by induced magnetic field with slip condition via finite element strategy. Acta Mech. Autom. 2022, 16, 200–206. [Google Scholar]
  4. Wu, J.; Wu, Z.; Ding, H.; Wei, Y.; Yang, X.; Li, Z.; Yang, B.R.; Liu, C.; Qiu, L.; Wang, X. Multifunctional and high-sensitive sensor capable of detecting humidity, temperature, and flow stimuli using an integrated microheater. ACS Appl. Mater. Interfaces 2019, 11, 43383–43392. [Google Scholar] [CrossRef]
  5. Nagaiah, N.R.; Geiger, C.D. Evolutionary numerical simulation approach for design optimization of gas turbine blade cooling channels. Int. J. Simul. Multidiscip. Des. Optim. 2014, 5, 22. [Google Scholar] [CrossRef]
  6. Gifford, A.R.; Hubble, D.O.; Pullins, C.A.; Diller, T.E.; Huxtable, S.T. Durable heat flux sensor for extreme temperature and heat flux environments. J. Thermophys. Heat Transf. 2010, 24, 69–76. [Google Scholar] [CrossRef]
  7. Zhang, C.; Huang, J.; Li, J.; Yang, S.; Ding, G.; Dong, W. Design, fabrication and characterization of high temperature thin film heat flux sensors. Microelectron. Eng. 2019, 217, 111128. [Google Scholar] [CrossRef]
  8. Jadhav, A.; Peetala, R.; Kulkarni, V. Multi-walled carbon nano-tubes for performance enhancement of thin film heat flux sensors. Heat Mass Transf. 2020, 56, 1537–1549. [Google Scholar] [CrossRef]
  9. Mohammad-Rezaei, R.; Massoumi, B.; Abbasian, M.; Rezaei, A.; Samadian, H.; Jaymand, M. Conducting polymer-based electrically conductive adhesive materials: Design, fabrication, properties, and applications. J. Mater. Sci. Mater. Electron. 2020, 31, 10947–10961. [Google Scholar]
  10. Said, Z.; Ghodbaned, M.; Sundar, S.; Kumar Tiwari, A.; Sheikholeslami, M.; Boumeddane, B. Heat transfer, entropy generation, economic and envirnmental analyses of linear Fresnel reflector using novel rGO-Co3O4 hybrid nanofluids. Renew. Energy 2021, 165, 420–437. [Google Scholar] [CrossRef]
  11. Hilgert, C.; Howar, F.; Röger, M. Flow through calorimeter to measure fluid heat capacity in CSP applications. Sol. Energy 2019, 194, 804–814. [Google Scholar] [CrossRef]
  12. Li, Z.; Yin, J.; Wang, G.; Liang, H.; Zhang, C.; Huang, M.; Liu, Y.; Zhang, J. Dynamic Calibration of a Thin-Film Heat-Flux Sensor in Time and Frequency Domains. Sensors 2022, 22, 5294. [Google Scholar] [CrossRef]
  13. Jasperson, B.A.; Schmale, J.; Qu, W.; Pfefferkorn, F.E.; Turner, K.T. Thin film heat flux sensors fabricated on copper substrates for thermal measurements in microfluidic environments. J. Micromech. Microeng. 2014, 24, 125018. [Google Scholar] [CrossRef] [Green Version]
  14. Zribia, A.; Barthèsa, M.; Bégota, S.; Lanzettaa, F.; Rauchb, J.Y.; Moutarlierc, V. Design, fabrication and characterization of thin film resistances for heat flux sensing application. Sens. Actuators A Phys. 2016, 245, 26–39. [Google Scholar] [CrossRef]
  15. Schwentenwein, M.; Homa, J. Additive manufacturing of dense alumina ceramics. Int. J. Appl. Ceram. Technol. 2015, 12, 1–7. [Google Scholar] [CrossRef]
  16. Fu, L.; Huang, A.; Gu, H.; Ni, H. Properties and microstructures of lightweight alumina containing different types of nano-alumina. Ceram. Int. 2018, 44, 17885–17894. [Google Scholar] [CrossRef]
  17. Karthikeyan, B.; Hariharana Ary, S.; Gayathri, S.V.; Arun, T.; Akbari-Fakhrabadib, A.; Madhumitha, C. Optical, vibrational and fluorescence recombination pathway properties of nano SiO2-PVA composite films. Opt. Mater. 2019, 90, 139–144. [Google Scholar] [CrossRef]
  18. Liu, Y.; Liu, H.; Zhang, Y.; Zhao, S.; Li, Y.; Wang, Z.; Li, G.; Wang, H.; Jiang, W.; Liu, C.; et al. A simple way to investigate the temperature of film growth surface during sputtering process. Mod. Phys. Lett. B 2019, 33, 1950359. [Google Scholar] [CrossRef]
  19. Keltner, N.R. Heat Flux Measurements: Theory and Applications. In Thermal Measurements in Electronic Cooling; CRC Press: Boca Raton, FL, USA, 2020; pp. 273–320. [Google Scholar]
  20. Pullins, C.A.; Diller, T.E. In situ high temperature heat flux sensor calibration. Int. J. Heat Mass Transf. 2010, 53, 3429–3438. [Google Scholar] [CrossRef]
  21. Li, L.; Wang Fan, X. Development of integrated high temperature sensor for simultaneous measurement of wall heat flux and temperature. Rev. Sci. Instrum. 2012, 83, 074901. [Google Scholar] [CrossRef] [Green Version]
  22. Wang, D.H.; Wang, M.Z.; Peng, Y.H.; Zhang, Y. Printed circuit board process based thermopile-type heat flux sensor used for monitoring chips. Appl. Therm. Eng. 2022, 205, 117860. [Google Scholar] [CrossRef]
  23. Tian, W.; Wang, Y.; Zhou, H.; Wang, Y.; Li, T. Micromachined thermopile based high heat flux sensor. J. Microelectromechanical Syst. 2019, 29, 36–42. [Google Scholar] [CrossRef]
  24. Mercado, M.; Wong, N.; Hartwig, J. Assessment of two-phase heat transfer coefficient and critical heat flux correlations for cryogenic flow boiling in pipe heating experiments. Int. J. Heat Mass Transf. 2019, 133, 295–315. [Google Scholar] [CrossRef]
  25. Hafeez, M.B.; Krawczuk, M.; Nisar, K.S.; Shahzad, H. A finite element analysis of thermal energy inclination based on ternary hybrid nanoparticles influenced by induced magnetic field. Int. Commun. Heat Mass Transf. 2022, 135, 106074. [Google Scholar] [CrossRef]
  26. Su-Yuan, B.; Zhen-An, T.; Zheng-Xing, H.; Huang, Z.-X. Thermal conductivity measurement of submicron-thick aluminium oxide thin films by a transient thermo-reflectance technique. Chin. Phys. Lett. 2008, 25, 593. [Google Scholar] [CrossRef]
  27. Kato, R.; Maesono, A.; Tye, R.P. Thermal conductivity measurement of submicron-thick films deposited on substrates by modified ac calorimetry (laser-heating Ångstrom method). Int. J. Thermophys. 2001, 22, 617–629. [Google Scholar] [CrossRef]
  28. Behkam, B.; Yang, Y.; Asheghi, M. Thermal property measurement of thin aluminum oxide layers for giant magnetoresistive (GMR) head applications. Int. J. Heat Mass Transf. 2005, 48, 2023–2031. [Google Scholar] [CrossRef]
Figure 1. (a) Cross-section of sensor showing substrate, thermal insulator, hot-cold electrode, and protective layer. (b) Schematic diagram of working principle over all the thin film flux sensor.
Coatings 12 01670 g001
Figure 2. (a) Six through holes set up on the ceramic substrate. (b) Back view of lead in substrate. (c) Structure of lead and substrate integration.
Coatings 12 01670 g002
Figure 3. Micro topography of the bonding between the lead and the ceramic hole at the lead hole: (a) the bonding between the lead and the hole under the electronic magnifying glass and (b) SEM of wire–hole bonding.
Coatings 12 01670 g003
Figure 4. Diagram of preparation flowchart of thin film heat flux sensor. (a) the electrode wire passes through the ceramic substrate; (b) ceramic powder fills the gap for sintering and polishing; (c) sputtering NiCr functional film; (d) sputtering NiSi functional film; (e) sputtering Al2O3 thermal resistance layer film; (f) sputtering SiO2 protective film.
Coatings 12 01670 g004
Figure 5. Physical picture of masks.
Coatings 12 01670 g005
Figure 6. (a) SEM image of NiCr thin film, (b) SEM image of NiSi thin film, (c) SEM image of Al2O3 thin film, and (d) SEM image of SiO2 thin film.
Coatings 12 01670 g006
Figure 7. The Energy spectrum analysis of the thin film (a) NiCr electrode film, (b) NiSi piezoelectric thin film, (c) Al2O3 insulating film, (d) SiO2 insulating film.
Coatings 12 01670 g007
Figure 8. The fabricated novel thin film heat flux sensor.
Coatings 12 01670 g008
Figure 9. Sensitivity calibration experiment site diagram.
Coatings 12 01670 g009
Figure 10. (a) Sensitivity calibration experiment curve of the thin film thermocouple temperature sensor. (b) Six sensitivity experiments were carried out on the thin film thermocouple temperature sensor.
Coatings 12 01670 g010
Figure 11. (a) Sensitivity calibration method of steady-state calibration experiment. (b) The scene of sensitivity calibration experiment.
Coatings 12 01670 g011
Figure 12. Avoid heat dissipation—measurement schematic diagram.
Coatings 12 01670 g012
Figure 13. Sensitivity calibration experiment curve of the novel thin film heat flux sensor.
Coatings 12 01670 g013
Figure 14. Dynamic response time calibration curve of the novel thin film heat flux sensor.
Coatings 12 01670 g014
Figure 15. Response of the novel thin film heat flux sensor under the different heat flux loads.
Coatings 12 01670 g015
Figure 16. The repeatability fitting curve of the novel thin film heat flux sensor.
Coatings 12 01670 g016
Figure 17. Curve of relationship between cold- and hot-junction temperature and heat flux.
Coatings 12 01670 g017
Table 1. Summary of common thermal insulator layer materials’ attribute parameters.
MaterialsThermal Conductivity λ (w/m × k)Thermal Expansion
Coefficient
Long-Term Service
Temperature °C
Polyimide0.21600300
SiO20.6318001200
Al2O31.715001400
Table 2. The sputtering parameters of the thin film.
Coating
Material
Vacuum Degree/paWorking GasWorking Pressure/paFlow/SccmSputtering Power/wSputtering Time/min
NiCr6.0 × 10−3Ar0.62015018
NiSi6.0 × 10−3Ar0.62015024
Al2O36.0 × 10−3Ar/O20.620/8400330
SiO26.0 × 10−3Ar/O20.620/820060
Table 3. Corresponding relationship between the thermoelectric potential, E, and the temperature, T.
Temperature/°C30507090110130150170
Output thermal potential0.3011.1011.9112.6923.5154.3135.1015.885
Table 4. Corresponding relationship between the thermoelectric potential, E, and the heat flux, Q.
Standard Heat Flux Value of the Sensor/(kW/m2)2.082.22.362.552.642.803.083.16
Thermoelectric potential of novel heat flux sensor to be calibrated/mV0.0910.1120.1290.1340.1410.1510.1600.171
Standard heat flux value of
sensor/(kW/m2)
3.303.523.713.874.044.204.414.60
Thermoelectric potential of novel heat flux sensor to be calibrated/mV0.1820.1910.2010.2130.2210.2320.2460.256
Table 5. Response time of thin film heat flux sensor by researchers, domestically and abroad.
ResearcherResponse Time
In this paper475 ms
Congchun Zhang [7]10 s
Xuejun Fan [21]6 s
DH Wang [22]5 s
Table 6. Repeatability experiment data of six groups.
Heat Flux kW/m2The First Test/mVThe Second Test/mVThe Third Test/mVThe Fourth Test/mVThe Fifth Test/mVThe Sixth Test/mVRepeatability Error
2.08030.09010.09020.0910.0920.09030.09011.55%
2.212150.1080.1090.1120.1130.1110.110.84%
2.358650.12310.120.1290.1280.1210.1210.81%
2.54910.1310.1320.1340.1350.1320.1320.59%
2.6370.140.1410.1410.1420.1440.1410.67%
2.798150.1490.1510.1510.1510.1520.1520.61%
3.07650.1590.160.160.1610.1610.1610.59%
3.16440.1710.1720.1710.170.1720.1710.51%
3.296250.1810.1830.1820.1810.180.1810.54%
3.5160.1920.1910.1910.1920.1890.1920.56%
3.706450.2020.2020.2010.2020.2010.2030.42%
3.86760.2120.2140.2130.2110.2190.2110.42%
4.04340.2230.2210.2210.2210.2210.2210.40%
4.204550.2310.2340.2320.2320.2290.2310.37%
4.409650.2430.2460.2460.2450.2450.240.28%
4.60010.2510.2540.2560.2540.2550.2520.53%
4.74660.2610.2650.2670.2680.2670.2680.36%
4.92240.2730.2760.2780.2760.2750.2740.41%
5.083550.2840.2850.2890.2880.2870.2870.17%
5.200750.2970.2960.2980.2950.2970.2981.55%
5.33260.3180.3170.3180.3160.3170.3190.84%
Table 7. Some measurement results for the heat-transfer coefficient of Al2O3 thin film in the literature.
Method of Film
Preparation
Film Thickness (nm)Measurement Results of Thermal Conductivity of Al2O3 Thin Film w/(m∙k)Researcher
Magnetron sputtering20004.477In this paper
Magnetron sputtering10003.3Suyuan Bai [26]
Magnetron sputtering10001.3Kato [27]
Magnetron sputtering10–100<1Behkan [28]
Publisher’s Note: MDPI stays neutral with regard to jurisdictional claims in published maps and institutional affiliations.

