Article

Mitigating CMAS Attack in Model YAlO3 Environmental Barrier Coatings: Effect of YAlO3 Crystal Orientation on Apatite Nucleation

by
Amanda Velázquez Plaza
and
Amanda R. Krause
*,†
Department of Materials Science and Engineering, University of Florida, Gainesville, FL 32611, USA
*
Author to whom correspondence should be addressed.
Current address: Department of Materials Science and Engineering, Carnegie Mellon University, Pittsburgh, PA 15213, USA.
Coatings 2022, 12(10), 1604; https://doi.org/10.3390/coatings12101604
Submission received: 22 September 2022 / Revised: 17 October 2022 / Accepted: 18 October 2022 / Published: 21 October 2022
(This article belongs to the Special Issue Advances in Environmental Barrier Coatings/Ceramic Matrix Composites)

Abstract

:
Environmental barrier coatings (EBCs) are used to protect ceramic-matrix composites from undesirable reactions with steam and calcia–magnesia–alumina–silicate (CMAS) particulates found in gas-turbine engine environments. Effective EBCs contain yttria or rare earth ions that will react with molten CMAS to form a protective apatite layer that prevents further attack. Methods to improve the EBCs’ CMAS mitigation capabilities focus on improving the apatite yield but neglect optimizing the apatite formation behavior. This study investigates the effect of apatite nucleation behavior on CMAS penetration by comparing the CMAS attack at 1350 °C of four different single crystal orientations of yttria aluminate perovskite (YAP), a promising EBC candidate. The EBC/CMAS interfacial energy and, thus, reaction behavior varies with YAP orientation. In regions with low CMAS loading, rapid apatite growth is seen on YAP substrates with orientations associated with high EBC/CMAS interfacial energy. However, CMAS penetration is most significant in these samples because the apatite growth is facilitated by recession of the YAP substrate nearby. Such behavior is not observed in regions with high CMAS loading where small apatite crystals form on top of an yttrium aluminate garnet (Y3Al5O12, YAG) phase. This study shows that strategies that control the nucleation and growth of apatite will provide better protection against CMAS.

1. Introduction

Oxide-oxide ceramic matrix composites (CMCs) are materials of interest for replacing metals in some high temperature components in gas-turbine engines for aeronautics and land-based power generation [1]. The implementation of these CMCs is challenging because combustion environment conditions lead to their erosion and corrosion. In particular, environmental barrier coatings (EBCs) are necessary to prevent these CMCs from reacting with steam and volatilizing in gas-turbine engine atmospheres [2,3]. A wide variety of viable EBC candidates have been identified for SiC-based composites, which have been the primary focus of CMC development [4]. However, those EBC candidates are not compatible with alumina-based CMCs because of differences in the coefficient of thermal expansion (CTE) and chemical stability between the CMC materials. YAlO3, also known as YAP (yttrium aluminate perovskite), has been proposed for this purpose due to its low water vapor recession rate [5] and excellent CTE match to alumina [6,7], which prolongs the number of thermal cycles to failure. Additionally, Gatzen et al. demonstrated the feasibility of depositing YAP on an alumina CMC via very-low pressure plasma spraying with no pre- or post-processing steps [7]. This manufacturability is desirable for the longevity of the coatings and is in contrast to other coating/composite pairs that must undergo surface alterations or heat treatments for adequate adhesion [8].
Similar to other EBC systems [9,10,11,12], Gatzen found that interactions of a YAP coating with molten airborne calcia-magnesia aluminosilicate (CMAS) deposits led to accelerated degradation. Molten CMAS attack can include (1) grain boundary infiltration of the coating, (2) dissolution of the EBC or underlying component, (3) crystalline reaction products formed from the CMAS and coating constituents, and (4) devitrification of CMAS due to temperature fluctuations during application [13,14]. It is the combined effect of these that determines the number of thermal cycles to failure and the mode of failure. The CMAS infiltration and CMAS/EBC reactivity commonly have an inverse relationship, because the interaction can induce (1) solidification of the molten glass and (2) nucleation of certain reaction products, like rare-earth (RE) apatites, that can block CMAS infiltration pathways [15]. EBC research targets crystallization of rare-earth silicate oxyapatites (commonly Ca2RE8(SiO4)6O2), which often nucleate quickly to efficiently slow down CMAS infiltration [9,16]. Different RE cations have been explored to optimize the volume of the reaction products and their nucleation rate to minimize the CMAS penetration depth [17,18,19]. The thermodynamic phase equilibrium of different RE-based EBC-CMAS reaction products has been studied extensively through model experiments (typically involving pressed pellets comprised of 1:1 EBC:CMAS by weight), finding that indeed the apatite phase emerges as thermodynamically stable [20]. Additionally, these studies find that the apatite phase stability and compositional range increases with RE cation size. However, there are conflicting reports about which RE-based EBC is most effective at mitigating CMAS when comparing CMAS penetration rates in porous, polycrystalline coatings. These tests show that the kinetics, particularly the nucleation and growth rate of apatite, play an important role in the coatings’ CMAS-mitigation capabilities. Yet, little is known about the apatite nucleation mechanism or how to control it.
The purpose of this work was to gain insight into the nucleation and growth mechanism of apatite to assess the CMAS-mitigation capabilities of YAP EBCs. To achieve this, we applied CMAS monoliths to YAP single crystals to minimize the complexity of the system and isolate the anisotropic effects. Specifically, the interfacial energy of the CMAS/YAP interface was varied by altering the orientation and surface termination of the YAP single crystal to explore how this interface changes the wettability, EBC dissolution rate, and apatite nucleation rate. Anisotropy in the interfacial energy between CMAS and different YAP termination planes was anticipated based on a computational study of a thermal barrier coating, yttria-stabilized zirconia (YSZ), by Li et al. [21]. YAP has an orthorhombic (Pnma) structure, which is less symmetric than YSZ, making this a reasonable assumption. Additionally, single crystals are ideal for this study because they do not have grain boundaries or pores that complicate measurements for penetration rates. Our study shows that YAP orientation changes the nature of the CMAS attack, including wettability, the morphology of the apatite layer, and, ultimately, the effectiveness of the physical barrier formed. These findings suggest that the apatite morphology—in addition to the amount of apatite—is a key factor for CMAS-mitigation.

2. Materials and Methods

2.1. CMAS Synthesis

A four-component CMAS glass was synthesized by mixing silica, calcium carbonate, alumina and magnesia with ethanol and zirconia milling media in a rolling mill. The mixture was dried, heated in a Pt crucible at 1550 °C for 4 h (CM 1700-BL box furnace, Bloomfield, IL, USA) and then quenched in air. The composition was selected to be rich in calcia to simulate more corrosive conditions [22,23]. The target composition has been commonly employed in other studies in the literature [24,25], including one by Kumar et al. to compare 4- and 9-component CMAS attack on TBC materials under the same conditions [26]. Table 1 reports the resulting glass composition as determined by X-ray fluorescence (XRF; measured by Eurofins EAG Materials Science, Sunnyvale, CA, USA). The glass was cut into 10 mg cubes with a high-speed diamond-blade saw.

2.2. CMAS-YAP Reaction Studies

Isothermal CMAS-YAP reaction studies were completed on four different orientations of single crystal YAP substrates: (001), (100), (101), and (110), procured from MTI Corporation. (Note that the exact plane termination may vary slightly due to the cut by the manufacturer.) The single side polished single crystals were 5 mm long by 5 mm wide and 500 ± 10 µm thick. The use of YAP single crystals provides observation of the effect of the YAP termination plane on the nucleation and growth of reaction products at the CMAS-YAP interface.
In this study, solid CMAS-glass cubes (1.25 mm side length) were bonded with the YAP single crystals to collect CMAS/YAP contact angles for different substrate orientations. The mass of the CMAS cubes (10 mg) was chosen so that gravitational forces on the droplet upon melting would be negligible and a sessile contact angle could be measured. The CMAS cubes were first bonded to the polished side of each substrate with a heat treatment at 915 °C for 15 min. This pre-attachment process prevented the glass from shifting with the platform vibration of the bottom-loading furnace used for the CMAS/YAP interaction studies. The bonding conditions were tested to ensure no crystallization or melting of the CMAS occurred. After the pre-bonding step, CMAS-YAP samples of each substrate orientation were reacted in air at 1350 °C for dwell durations of 1, 10, 30 and 60 min (CM 1700-BL box furnace) for a total of 16 samples. Samples were inserted when the furnace was at temperature and then air quenched. Based on preliminary data, it was established that 1350 °C was the highest temperature to practically observe the contact angle before reaction products modified the YAP-CMAS interface. Contact angles were measured from the 1-min dwell samples using ImageJ on micrographs collected as described below.
Cross-sections of the reaction regions were prepared for characterization by mounting in epoxy and polishing down to the center of the reaction region to a 250 nm finish using standard metallographical practices. The polished samples were coated with ~1 nm Ir for electron microscopy.

2.3. Characterization by Electron Microscopy and X-ray Diffraction

Secondary electron (SE) images and energy dispersive spectroscopy (EDS) data of all reaction regions were acquired with a Tescan MIRA3 (Kohoutovice, Czech Republic) scanning electron microscope (SEM; 20–30 kV). ImageJ (version 1.51, 2015, National Institutes of Health, Bethesda, MD, USA) was used for extracting metrics from the SEM micrographs. Reaction product amounts were estimated from the 30 and 60 min images by computing the corresponding phase’s average cross-sectional areas and layer thicknesses. Data was collected within a 200 µm radius from the center of the interaction region to exclude edge effects; edges were treated separately, so the measurement does not represent total amount of product formed. Eight images, each with a field of view of 50 µm, were analyzed per sample. Five thickness measurements and one area measurement were recorded per product phase from each image for a total of 40 thickness measurements and 5 area measurements for all reaction products and samples reported. The thickness of YAP dissolved was determined from the images in a similar fashion and by subtracting the original YAP thickness.
Selected area electron diffraction (SAED) patterns, EDS data and high-angle annular dark field (HAADF) images of the reaction products were acquired with Talos F200i S/TEM (FEI, Hillsboro, OR, USA) and Themis Z S/TEM (FEI, Hillsboro, OR, USA) transmission electron microscopes (TEM). The TEM lamellae analyzed were extracted from the 30-min (101) sample interaction region by the in situ lift out technique using a focused ion beam (NanoLab 600 and G4, FEI, Hillsboro, OR, USA).
The 10-min (001) sample was scanned in Bragg–Brentano geometry with an X’Pert MPD diffractometer (Malvern Panalytical, Malvern, UK) to identify potentially crystalline phases within the bulk of CMAS droplets. A thin layer of the modeling clay used for mounting onto the bulk holder was extended over the YAP single crystal to protect the detector from potential burnout. The clay was scanned separately to identify its contribution to the diffraction pattern.

3. Results

3.1. CMAS Wetting and Devitrification

Figure 1 shows representative cross-sections of the CMAS/YAP system after 1, 10 and 30 min. During heating, the shape of the CMAS cube became spherical due to interfacial tension. The CMAS/YAP contact angle reflects the relative interfacial energies of the different YAP orientations according to Young’s equation, in which the energy increases with increasing angle. After 1 min at 1350 °C, all substrate orientations exhibited non-wetting behavior of the molten CMAS. Table 2 reports the measured sessile drop contact angles, θ , which were all at least 150°, with θ 101 > θ 110 > θ 001 > θ 100 . With longer attack times the reaction between the CMAS and the YAP substrates began modifying the interface and promoting CMAS wettability. At 30 and 60 min, the CMAS completely wetted the YAP single crystals, covering the entire surface and extending over the edges. CMAS wetting was observed in the 10-min dwell samples, which was the time at which secondary phases were observed to form at the CMAS-YAP interface as discussed below.
After 10 min at 1350 °C, the CMAS comprised two phases as seen by the phase contrast in Figure 2. Figure 3 shows the XRD signal collected from the surface of the CMAS drop for the (001)-oriented YAP substrate. Wollastonite (CaSiO3) was identified as the only crystalline phase formed in the glass. (All other XRD peaks were identified as YAP or from the modeling clay used for mounting.) EDS maps in Figure 2 show that Al and Mg were rejected from the wollastonite phase. Wollastonite was not observed in the samples exposed to CMAS for 30 or 60 min at 1350 °C, when the CMAS had wetted the surface and had a higher surface area to volume ratio. Therefore, the devitrification most likely occurred during cooling due to insufficient quenching rates within the CMAS droplet, which implies that wollastonite did not influence the CMAS-YAP interaction at 1350 °C.

3.2. CMAS Attack of YAP Substrate at 1350 °C: Center of Reaction Region

As seen in previous EBC studies, the YAP dissolves during CMAS attack. The remaining YAP thickness, y, as a function of time provides a rough estimate of substrate dissolution (Figure 4). It was revealed that YAP (100) dissolved the least into CMAS with a thickness change of 30 µm, whereas (101) exhibited the most YAP dissolution with y = 63 µm.
During CMAS attack, the dissolution of YAP induces the formation of two phases, apatite and yttrium–aluminum garnet (Y3Al5O12, YAG), as described below. Note that yttrium–aluminum monoclinic, (YAM, Y4Al2O9) was not found by either SEM or TEM, agreeing with previous CMAS/YAP studies [7,25] and the yttria–alumina–silica ternary phase diagram [27]. Figure 5 shows representative micrographs collected near the center of the CMAS–YAP attack front for all four YAP substrates at different attack durations (10 min, 30 min, and 60 min) at 1350 °C. The interaction regions of 1-min samples are not displayed as they show no discernible reaction.
After 10 min at 1350 °C, a 1 µm-thick layer of apatite (identified by EDS as discussed below) was found on the surface of all substrates. No obvious size or morphological differences were found between the interfacial features in the four YAP orientations at the centers of the interaction region. EDS mapping revealed that this layer was high in Si, Ca and Y and low in Al in agreement with the apatite composition. The SEM EDS RGB (red–green–blue) composite map in Figure 6a shows the apatite layer (cyan) between the YAP below (magenta) and the CMAS above (green).
Figure 5, however, does show qualitative differences in the CMAS attack behavior of the four YAP orientations at 30 and 60 min. In particular, the (101)-terminated YAP substrate grew a thicker layer of apatite than the other YAP orientations. Table 2 lists the measured reaction product layer thicknesses and cross-sectional areas to compare the different YAP single crystals at 30 and 60 min. After 30 min at 1350 °C, the (100) and (101) samples produced the least and most amount of apatite (within the same interaction area), respectively. The (001) and (110) samples both exhibited about 136 µm2 of apatite area, twice the amount in the (100) sample but less than half of the (101) sample for the same interaction area. The density of the apatite layers was estimated by dividing the area by the thickness, and Table 2 reveals that the apatite layer on the (100) sample was most dense and the (101) sample the least dense. The (100) 30-min sample was unique not only because of the apatite density but also the apatite crystal morphology, with less apparent growth perpendicular to the interface. After 60 min at 1350 °C, the apatite layer grew significantly for all substrate orientations. The apatite layer on the (101) 60-min sample was the thickest and comprised small crystals with gaps of CMAS in between. After 60 min, there was no significant difference between the reaction layers on the (001), (100), and (110) substrates.
Another secondary phase was observed in the samples exposed to CMAS for 30 and 60 min at 1350 °C: the dark contrast layer in the secondary electron images between the apatite layer and the YAP substrate in Figure 5. The EDS RGB maps in Figure 6b,c revealed this phase as more alumina-rich than YAP, consistent with previously reported Y3Al5O12 (YAG) formation in YAP–CMAS interactions. This YAG layer was ~2 µm thick after 30 min and remained the same after 60 min for all YAP orientations. In the 30- and 60-min samples, the SEM micrographs showed embedded particles in the apatite crystals (Figure 5). S/TEM and EDS of the cross-section of an apatite layer from the (101) 30-min sample exposed a core/shell structure with the core comprised of YAG with the expected 3:5 Y to Al atomic ratio (Figure 7).

3.3. CMAS–YAP Interaction on Periphery of CMAS Attack Region

More dramatic differences in the interaction regions of the differently orientated YAP substrates were observed along the edges of the CMAS/YAP interaction region. As discussed above, a major difference in the CMAS droplet shape occurred during the first 10 min, most noticeably along the edges (Figure 8). The CMAS began to wet and spread along the YAP surface where apatite had begun to nucleate. This wetting associated with the apatite phase suggests a lower relative interfacial energy for an apatite–CMAS interface than for YAP-CMAS. The wetting behavior was different between the YAP substrates and two groups emerged: (a) samples with (001) and (100) substrates (lower index), and (b) samples with (101) and (110) substrates (higher index). After 10 min, the higher index samples exhibited extended CMAS “tails” that stretched up to 2.7 times longer than those found on the low index substrates. Furthermore, these samples exhibited large apatite crystals well within the resolving power of the SEM, ranging in size from the submicron to ~200 µm. Unlike the center of the reaction region, these apatite crystals were mostly hexagonally faceted or slab-like in the SEM cross-sectional images, with a presumed long c-axis parallel to the interface [28,29]. In contrast, the low index YAP orientations lacked visible apatite crystals in these tails.
After 30 min of CMAS attack at 1350 °C, the edge of the reaction region (Figure 9) continued the same trend; high-index YAP substrates induced larger apatite particles and more overall apatite production than lower-index substrates. These apatite particles appeared hexagonal in cross-section and as large as 50 µm. Notably, as the glass wetted the sides of the substrates (planes perpendicular to the surface), the reaction changed. Due to the symmetry of the YAP crystal structure, the substrate sides had a different crystallographic termination plane than the top surface. Therefore, the difference in the apatite morphology between the top surface and the sides of the YAP single crystal provides additional evidence that the YAP crystallographic orientation at the interface affects the CMAS interactions. In general, coarse (>5 µm) apatite crystals found on the edges of high-index samples did not have the 2 µm YAG layer beneath them. Instead, apatite appeared to nucleate directly on the YAP and was surrounded by corrosion-like pits in the substrate. These pits appeared to contain YAG crystals based on the contrast in the electron image (inset of Figure 9b).

4. Discussion

4.1. Influence of CMAS/YAP Interfacial Energy on Reaction Behavior

The contact angles reported in 
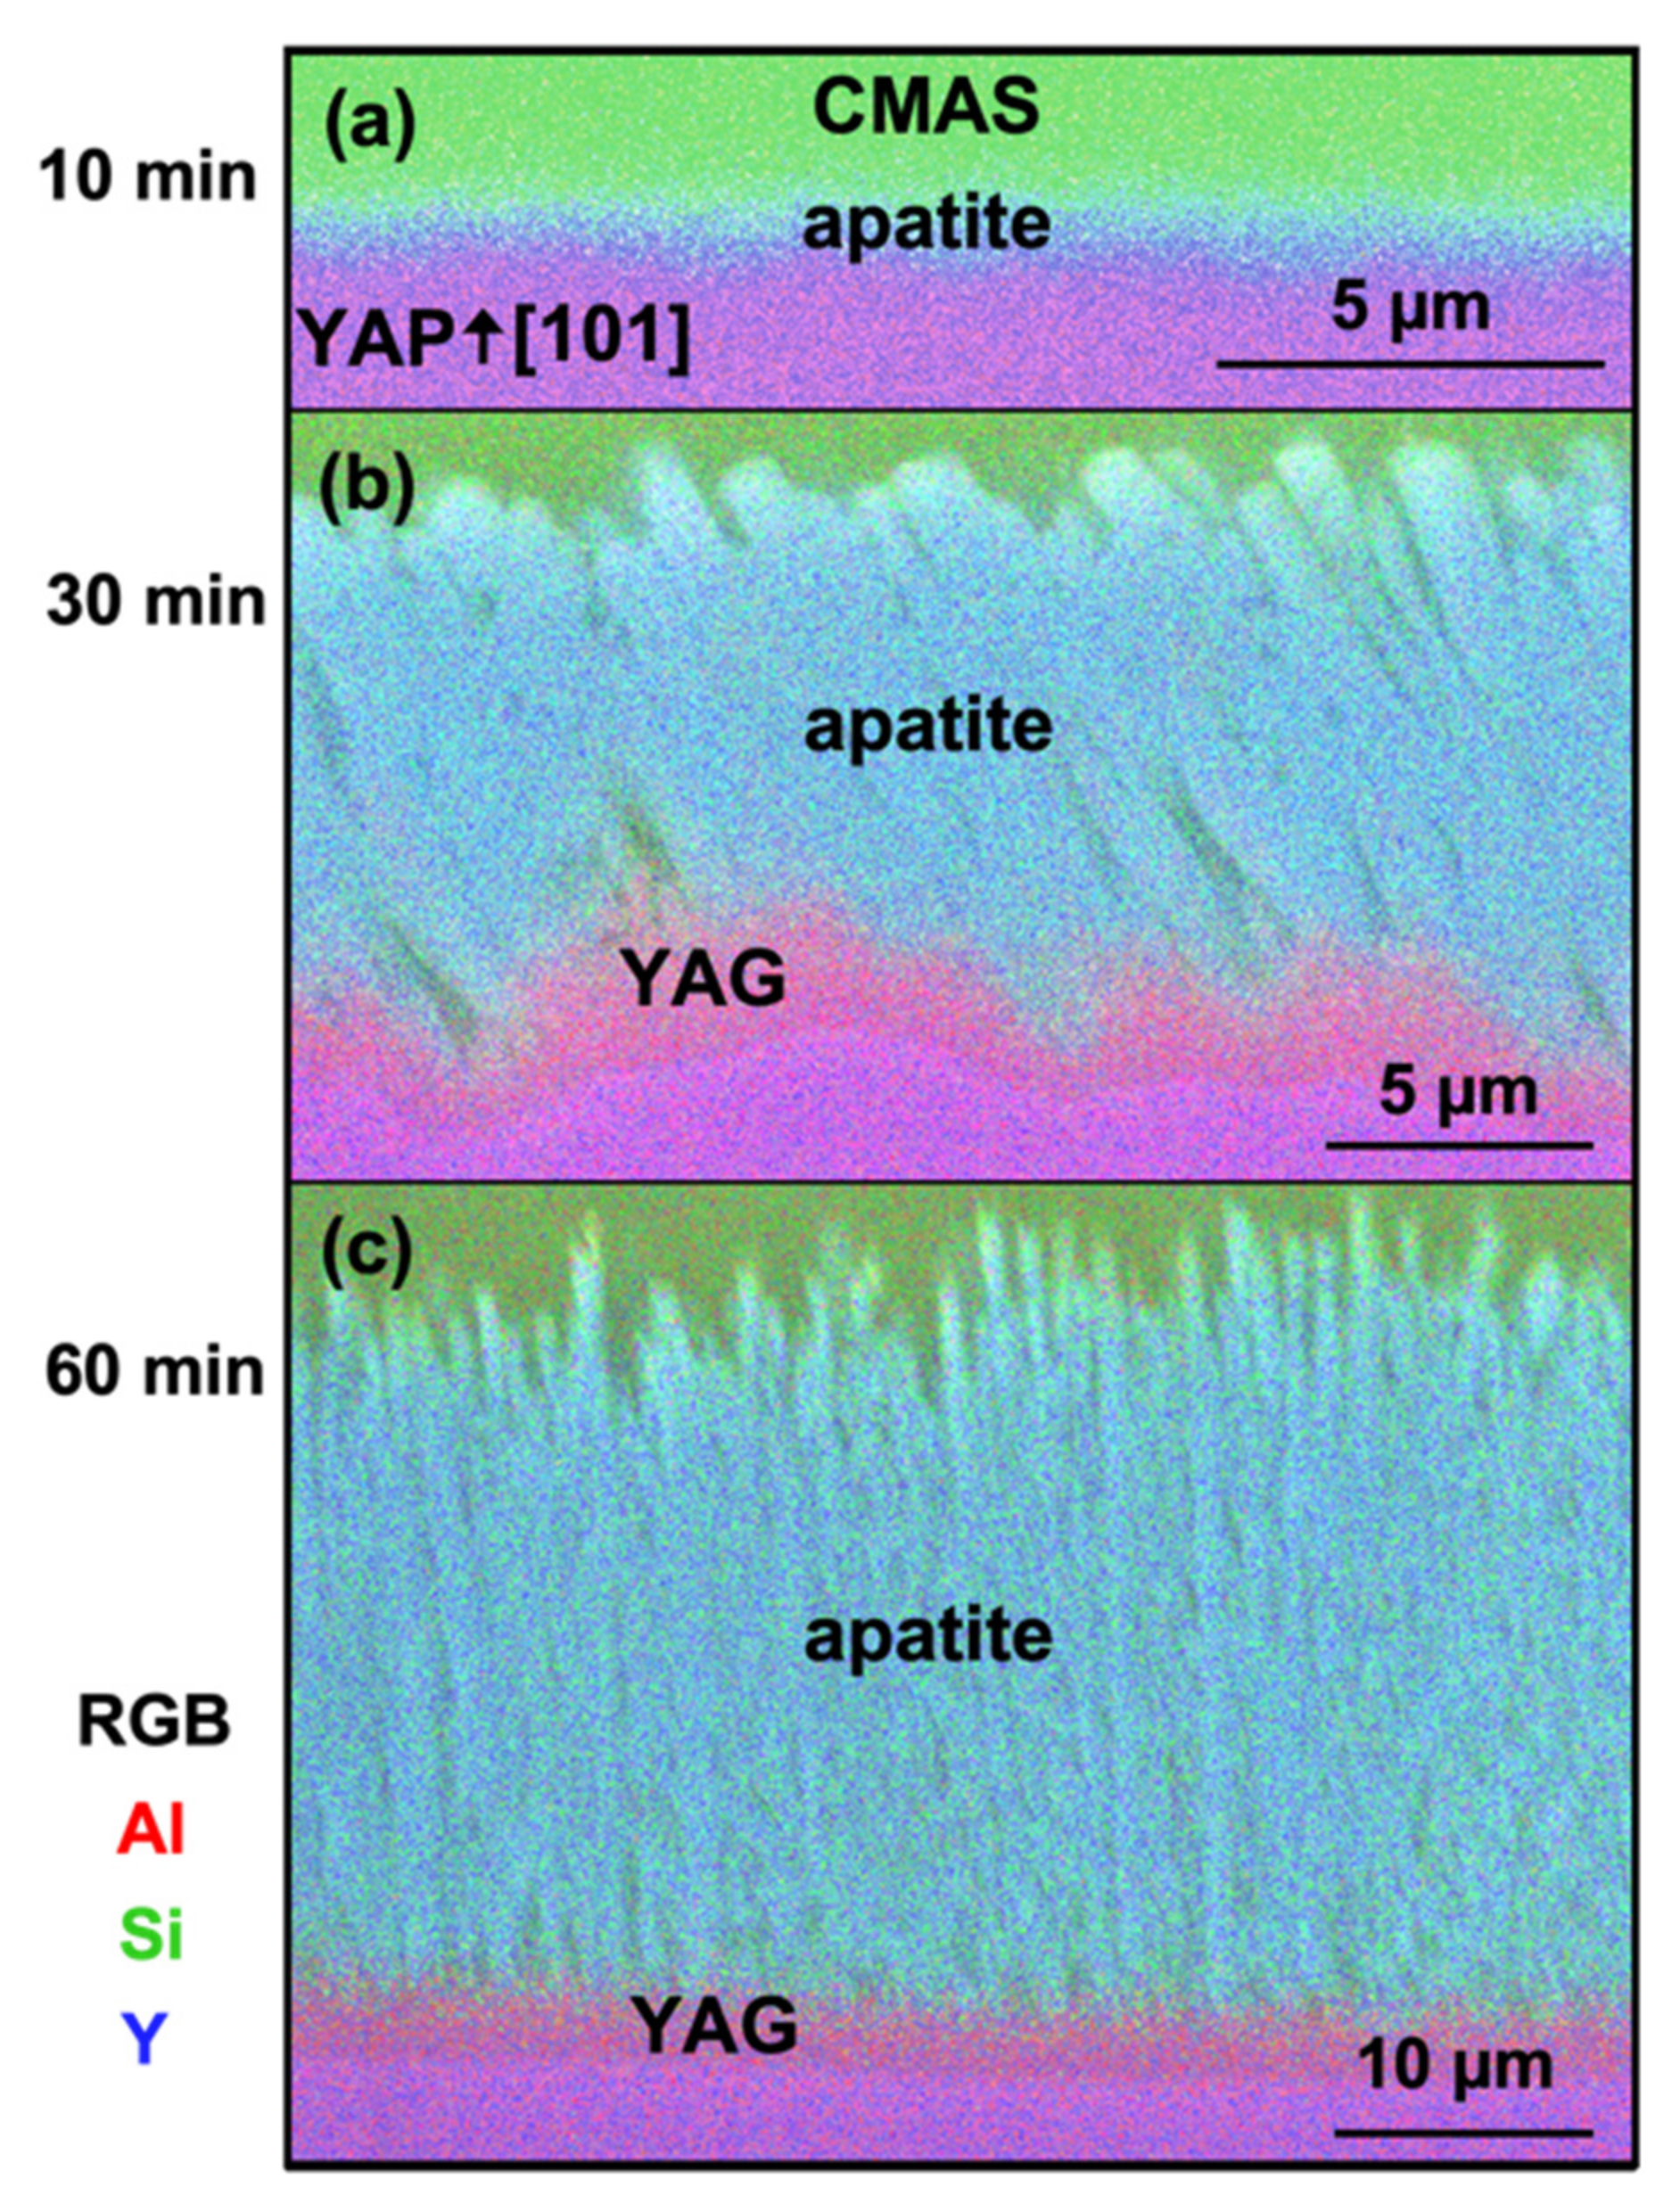
Table 2 indicate that the interfacial energy between CMAS and the YAP substrates decreased in the order: (101), (110), (001), (100). The initial formation of apatite after 10 min reflected these contact angles; apatite formed first on the substrates with the highest contact angle, (110) and (101), as seen in Figure 8. This apatite formation could imply that a higher interfacial energy (1) promotes dissolution or (2) lowers the activation energy barrier for preferable heterogeneous nucleation. The YAP thickness after CMAS attack also correlated with the contact angle, where substrates with larger contact angles dissolved more over time. This dissolution behavior suggests that YAP (100) consumption slows down between 30 and 60 min. After 60 min, differences in the apatite layer’s cross-sectional area were insignificant for all substrates except (101), which showed a less dense apatite structure and continual consumption of the YAP substrate. Thus, the apatite layer on YAP (101) was less effective at blocking CMAS than the other orientations despite forming readily in the interaction region.
The formation of YAG may limit the effect of the YAP orientation on the CMAS attack behavior after prolonged exposures. A 2 µm-thick YAG layer consistently formed at the CMAS attack front, effectively blocking the CMAS from direct contact with the YAP substrates. Such behavior made any original interfacial energy or orientation relationship of the YAP irrelevant as the reaction proceeds. The concurrent change in the CMAS wetting behavior (Figure 1) during apatite and YAG nucleation provided additional support that the YAP/CMAS interfacial energy did not significantly contribute to the reaction products in the center, where the CMAS loading was high.
Additionally, this finding has important implications regarding the approach to mitigate attack with CMAS-phobic coatings. Here, significant CMAS wetting of two common reaction products, apatite and YAG, eliminated any potential benefits of the non-wetting YAP. Thus, candidate CMAS-phobic coatings may also become ineffectual if they form similar reaction products.

4.2. Role of YAG in Apatite Growth

For all substrate orientations, YAG was present on the YAP surface, either beneath apatite (Figure 5) or nearby (
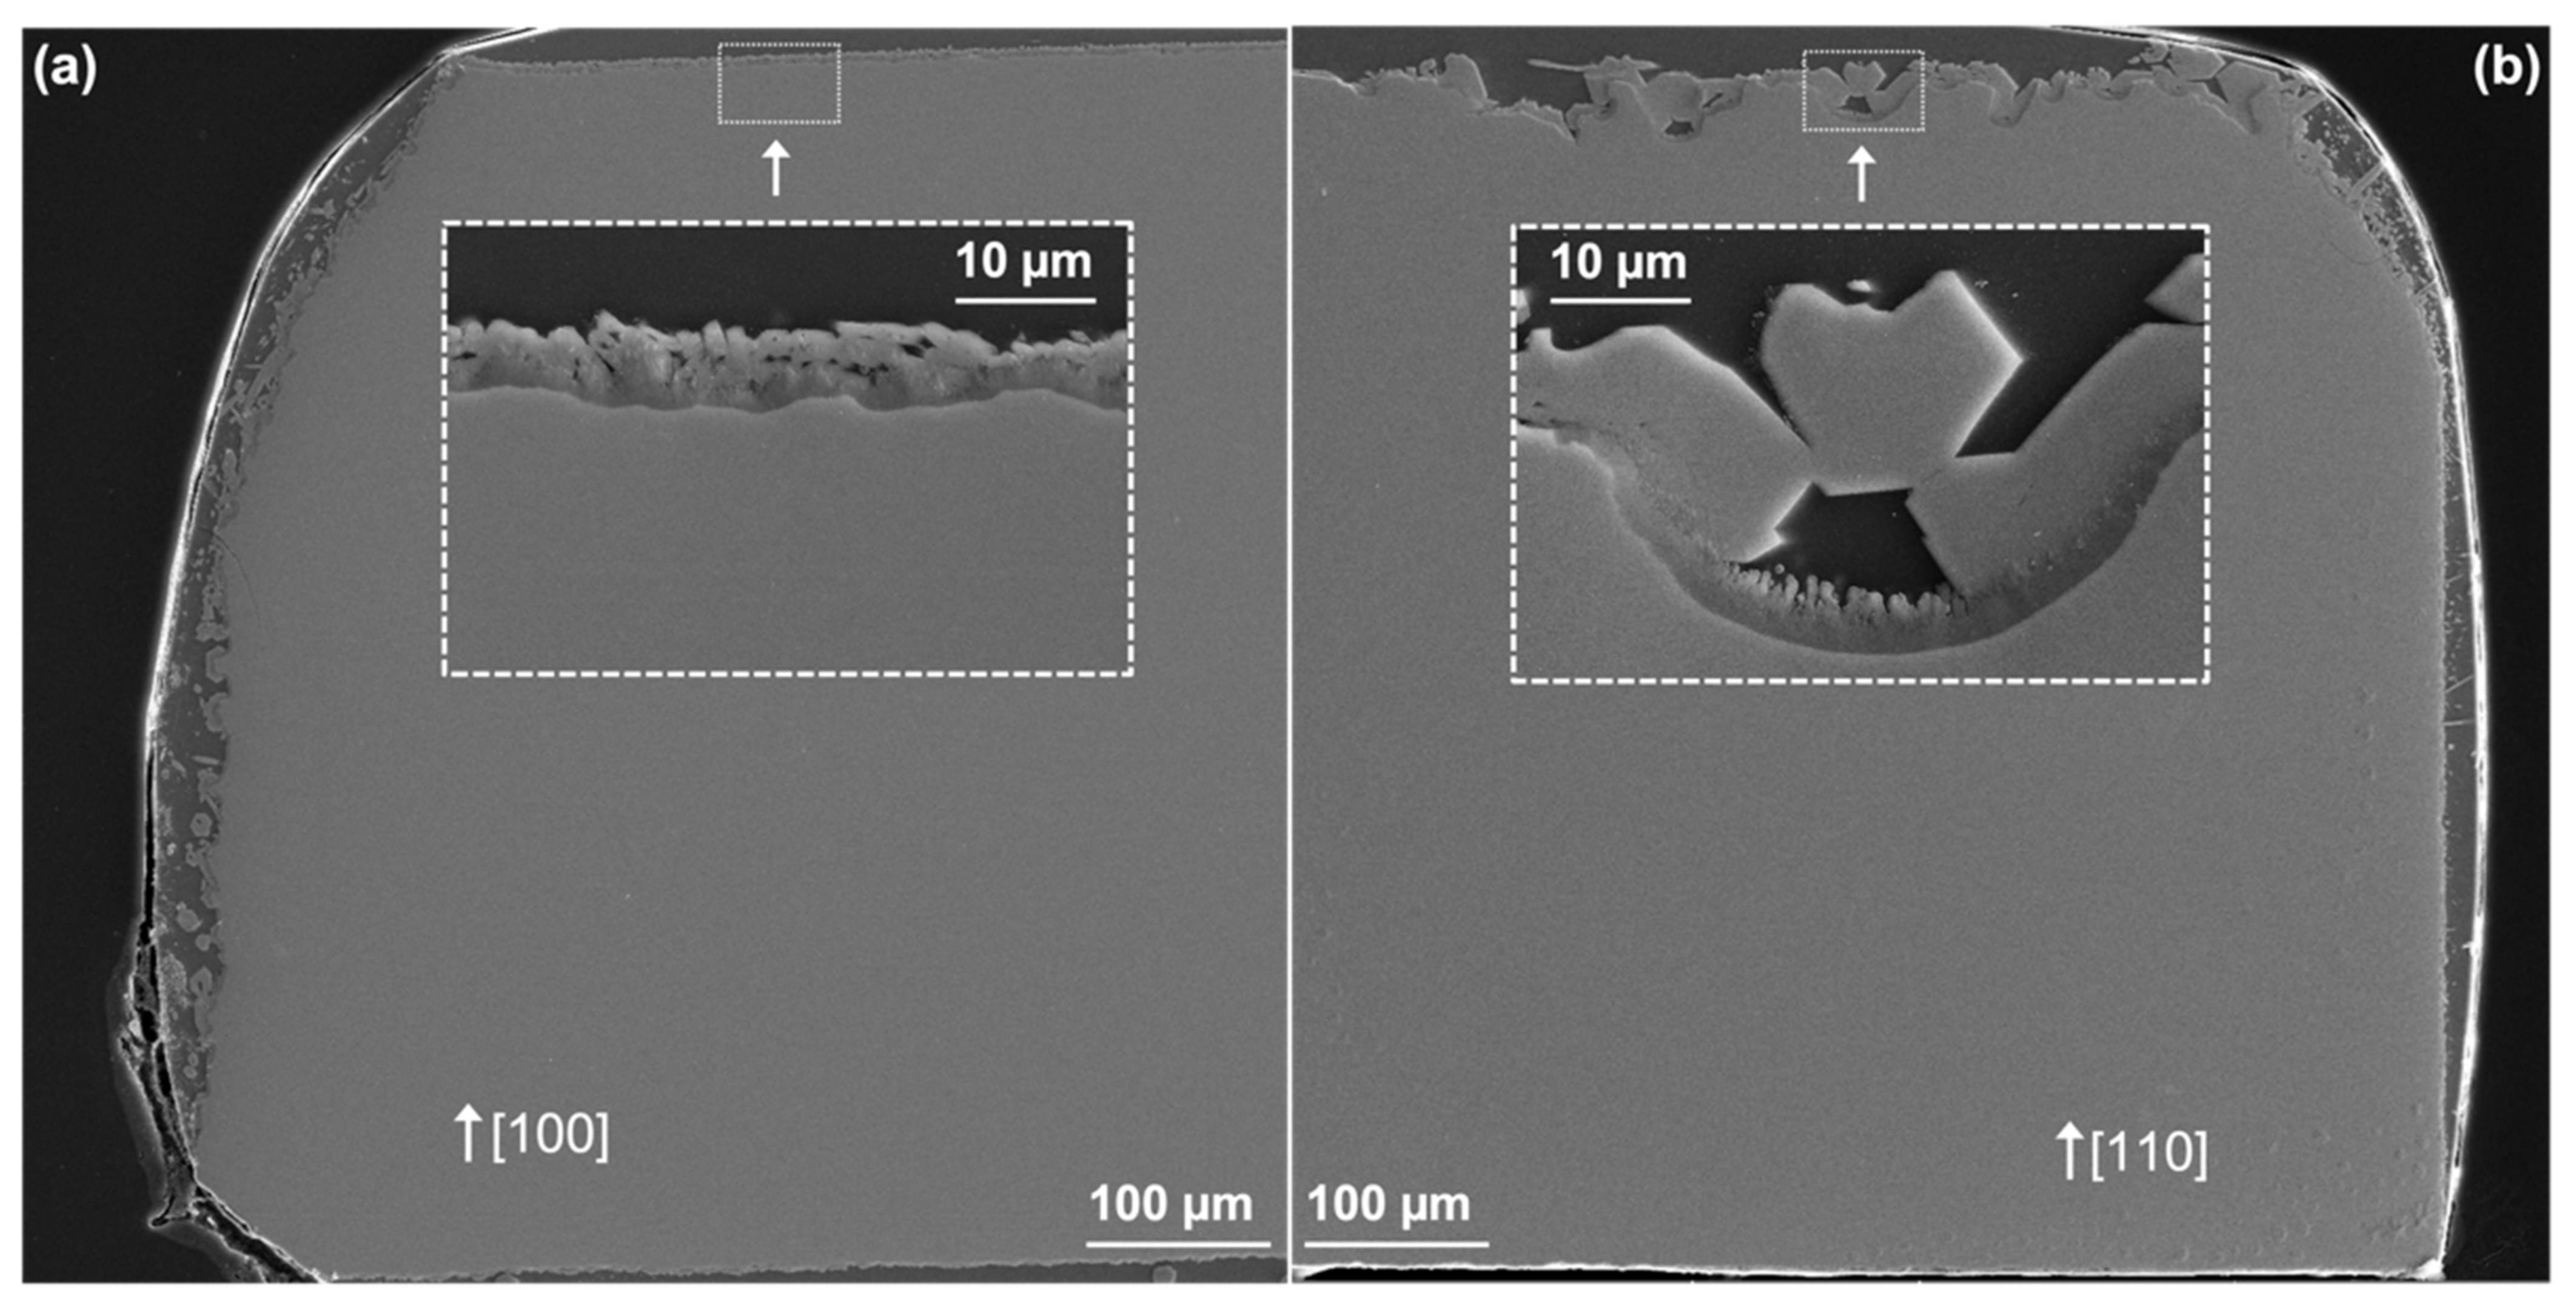
Figure 9b). However, it was not considered a barrier to CMAS because large YAP recession rates were observed when YAG was present without apatite (e.g., edge of (110) YAP shown in the inset of Figure 9b). Furthermore, YAG formation did not consume the CMAS constituents. This finding agrees with the observations by Eils et al., who found garnet (albeit a different composition) nucleation sluggish and, thus, less effective at mitigating further CMAS penetration compared to apatite [30].
It is unclear how apatite grows after the formation of the YAG layer; YAG’s columnar morphology may provide a direct diffusion pathway between CMAS and YAP to facilitate the reaction, or YAG may be forming and dissolving at a steady state rate to maintain equilibrium in the system. Regardless, YAP recession and apatite growth is not stymied by the formation of YAG. Yet, YAG appears to influence the growth rate and final morphology of the apatite grains and, thus, apatite’s effectiveness at mitigating CMAS.
The effect of YAG on apatite morphology was most obvious by comparing the center and edges of the interaction region for the (110) YAP after 30 min. In the center of the reaction region, small-diameter apatite rods were found on the surface of the YAG layer. The rods also contained embedded YAG particles (Figure 7), suggesting a heterogeneous nucleation relationship. In contrast, YAG was not found between the large apatite crystals and YAP substrate at the edges of the interaction region. There, apatite quickly formed directly on to the (110) YAP surface, and its growth was facilitated by rapid consumption of the YAP nearby. YAG then formed within depressions of the YAP substrate that were unprotected by apatite. These observations suggest that when the apatite layer forms on top of the YAG, it is a more effective barrier to CMAS than when apatite nucleates directly on to the YAP surface (discussed below). Similarly, Zhong et al. found that the formation of garnet in Yb–silicate EBCs benefitted the formation of a dense apatite layer [31]. Therefore, insight into the YAG/apatite orientation relationships will help determine if the YAG layer can be engineered to optimize the apatite morphology for blocking CMAS. The relationship between YAG and YAP is outside the scope of this paper but is part of ongoing work.

4.3. Effect of Apatite Nucleation and Growth on YAP Recession

The CMAS loading rate affected the composition, morphology, and nucleation rate of the reaction products as seen by comparing the edges and center of the CMAS attack region. Specifically, apatite nucleation was faster for particular YAP orientations near the edges. This effect provided an opportunity for direct observations of the apatite nucleation behavior without YAG present at the interface. Therefore, this region was used to evaluate the effect of apatite nucleation on CMAS mitigation. It is important to note that the CMAS exposure time was not known along the edges and was likely to be different between substrates because the CMAS spreading rate was uncontrolled.
The substrate orientation appeared to change the morphology and size of the apatite formed. For the (110) and (101), we observed large apatite crystals (up to 50 µm in diameter) at 10 min. These apatite crystals were significantly larger than any found in the center of the reaction region even at longer exposures. These apatite crystals were assumed to form their Wulff shape in the form of a hexagonal rod, agreeing with previous observations [28,29]. However, the growth of these crystals appeared faster than their nucleation rate, resulting in fast dissolution of nearby YAP (i.e., deeper CMAS penetration). Therefore, while apatite formed quickly and was effective for protecting the YAP directly below, no continuous apatite layer was formed to create an effective barrier for mitigating CMAS penetration on the (110)- and (101)-oriented substrates.
After 30 min in the low-index systems, small apatite crystals covered the surface effectively to create a CMAS barrier that, presumably, prevented their own growth. Although there were many crystals comprising this barrier, the lack of apatite in the early time steps, both in the center of the reaction region and on the edges, suggests that the nucleation rate was suppressed for these substrates. Additionally, the slow wetting behavior observed in Figure 8 also supports the suppression of reaction products in these samples because CMAS wetting is associated with apatite formation. This slow nucleation behavior may be due to an orientation relationship that facilitates apatite densification/coalescence or due to the lower CMAS/YAP interfacial energy for these substrate orientations (see Section 4.1). Regardless of the cause, the slow nucleation behavior of the (100) was the most beneficial for mitigating CMAS as it created an effective apatite barrier.
This finding is surprising in that it suggests that fast nucleation and growth of apatite may not always be beneficial for mitigating CMAS. Here, the nucleation of apatite was much slower than the growth rate, leading to fast consumption of the YAP substrate to facilitate apatite coarsening. This behavior demonstrates a kinetic approach to improve CMAS mitigation: increase the number of apatite nucleation sites to increase apatite density or suppress the apatite crystals’ growth rate. The preferred nucleation sites for apatite on YAP and YAG must be known to achieve this goal and is the focus of future work.

5. Conclusions

This model study evaluated the effects of apatite nucleation and growth behavior on the CMAS mitigation capabilities of the promising EBC candidate, YAP. Four YAP substrates with different crystallographic orientations were exposed to a four-component CMAS at 1350 °C for 1, 10, 30 and 60 min. The apatite and YAG formation behavior varied with CMAS loading. In the center of the reaction region, where the CMAS loading was highest, a thin YAG layer was found between the apatite layer and YAP substrate. The YAG layer appeared to nullify the impact of the YAP orientation on the apatite morphology. In regions with low CMAS loading (i.e., edge of reaction region), apatite formed rapidly on the YAP substrates with orientations found to have greater EBC/CMAS interfacial energy (e.g., (110) and (101)). These apatite crystals nucleated directly on to the YAP surface without any perceivable YAG layer. However, the growth of these rapidly formed apatite crystals was facilitated by dissolution of the nearby YAP substrate, resulting in deeper CMAS penetration compared with the other YAP substrate orientations. These observations suggest that CMAS mitigation is suppressed when the apatite growth rate is faster than the nucleation rate. Effective CMAS mitigation strategies may include increasing the number of nucleation sites and/or decreasing the apatite growth rate. Additionally, this study shows that secondary phases like YAG may be useful to control the nucleation and growth of apatite for better protection against CMAS.

Author Contributions

Conceptualization and supervision, A.R.K.; investigation and writing—original draft preparation, A.V.P. All authors have read and agreed to the published version of the manuscript.

Funding

This research received no external funding.

Institutional Review Board Statement

Not applicable.

Informed Consent Statement

Not applicable.

Data Availability Statement

The data presented in this study are available on request from the corresponding author.

Acknowledgments

The authors would like to thank the staff at the Research Service Centers at University of Florida for their guidance and maintenance of the characterization tools used in this work.

Conflicts of Interest

The authors declare no conflict of interest.

References

  1. Ohnabe, H.; Masaki, S.; Onozuka, M.; Miyahara, K.; Sasa, T. Potential Application of Ceramic Matrix Composites to Aero-Engine Components. Compos. Part A Appl. Sci. Manuf. 1999, 30, 489–496. [Google Scholar] [CrossRef]
  2. Smialek, J.L.; Robinson, R.C.; Opila, E.J.; Fox, D.S.; Jacobson, N.S. SiC and Si3N4 Recession Due to SiO2 Scale Volatility under Combustor Conditions. Adv. Compos. Mater. 1999, 8, 33–45. [Google Scholar] [CrossRef] [Green Version]
  3. Opila, E.J.; Myers, D.L. Alumina Volatility in Water Vapor at Elevated Temperatures. J. Am. Ceram. Soc. 2004, 87, 1701–1705. [Google Scholar] [CrossRef]
  4. Tejero-Martin, D.; Bennett, C.; Hussain, T. A Review on Environmental Barrier Coatings: History, Current State of the Art and Future Developments. J. Eur. Ceram. Soc. 2021, 41, 1747–1768. [Google Scholar] [CrossRef]
  5. Fritsch, M.; Klemm, H. The Water-Vapour Hot Gas Corrosion Behavior of Al2O3-Y2O3 Materials, Y2Si05 and Y3Al5O12-Coated Alumina in a Combustion Environment. Adv. Ceram. Coat. Interfaces Ceram. Eng. Sci. Proc. 2006, 27, 148–159. [Google Scholar] [CrossRef]
  6. Huang, Z.; Feng, J.; Pan, W. First-Principles Calculations of Mechanical and Thermodynamic Properties of YAlO3. Comput. Mater. Sci. 2011, 50, 3056–3062. [Google Scholar] [CrossRef]
  7. Gatzen, C.; Mack, D.E.; Guillon, O.; Vaßen, R. YAlO3—A Novel Environmental Barrier Coating for Al2O3/Al2O3–Ceramic Matrix Composites. Coatings 2019, 9, 609. [Google Scholar] [CrossRef] [Green Version]
  8. Gatzen, C.; Mack, D.E.; Guillon, O.; Vaßen, R. Improved Adhesion of Different Environmental Barrier Coatings on Al2O3/Al2O3-Ceramic Matrix Composites. Adv. Eng. Mater. 2020, 22, 2000087. [Google Scholar] [CrossRef] [Green Version]
  9. Grant, K.M.; Krämer, S.; Seward, G.G.; Levi, C.G. Calcium–Magnesium Alumino-silicate Interaction with Yttrium Monosilicate Environmental Barrier Coatings. J. Am. Ceram. Soc. 2010, 93, 3504–3511. [Google Scholar] [CrossRef]
  10. Zhao, H.; Richards, B.T.; Levi, C.G.; Wadley, H.N.G. Molten Silicate Reactions with Plasma Sprayed Ytterbium Silicate Coatings. Surf. Coat. Technol. 2016, 288, 151–162. [Google Scholar] [CrossRef]
  11. Poerschke, D.L.; Shaw, J.H.; Verma, N.; Zok, F.W.; Levi, C.G. Interaction of Yttrium Disilicate Environmental Barrier Coatings with Calcium-Magnesium-Iron Alumino-Silicate Melts. Acta Mater. 2018, 145, 451–461. [Google Scholar] [CrossRef]
  12. Wiesner, V.L.; Scales, D.; Johnson, N.S.; Harder, B.J.; Garg, A.; Bansal, N.P. Calcium–Magnesium Aluminosilicate (CMAS) Interactions with Ytterbium Silicate Environmental Barrier Coating Material at Elevated Temperatures. Ceram. Int. 2020, 46, 16733–16742. [Google Scholar] [CrossRef]
  13. Wiesner, V.L.; Bansal, N.P. Crystallization Kinetics of Calcium–Magnesium Aluminosilicate (CMAS) Glass. Surf. Coat. Technol. 2014, 259, 608–615. [Google Scholar] [CrossRef]
  14. Padture, N.P. Environmental Degradation of High-Temperature Protective Coatings for Ceramic-Matrix Composites in Gas-Turbine Engines. NPJ Mater. Degrad. 2019, 3, 11. [Google Scholar] [CrossRef] [Green Version]
  15. Krämer, S.; Yang, J.; Levi, C.G. Infiltration-Inhibiting Reaction of Gadolinium Zirconate Thermal Barrier Coatings with CMAS Melts. J. Am. Ceram. Soc. 2008, 91, 576–583. [Google Scholar] [CrossRef]
  16. Godbole, E.; von der Handt, A.; Poerschke, D. Apatite and Garnet Stability in the Al–Ca–Mg–Si–(Gd/Y/Yb)–O Systems and Implications for T/EBC: CMAS Reactions. J. Am. Ceram. Soc. 2022, 105, 1596–1609. [Google Scholar] [CrossRef]
  17. Perrudin, F.; Vidal-Setif, M.H.; Rio, C.; Petitjean, C.; Panteix, P.J.; Vilasi, M. Influence of Rare Earth Oxides on Kinetics and Reaction Mechanisms in CMAS Silicate Melts. J. Eur. Ceram. Soc. 2019, 39, 4223–4232. [Google Scholar] [CrossRef]
  18. Tian, Z.; Ren, X.; Lei, Y.; Zheng, L.; Geng, W.; Zhang, J.; Wang, J. Corrosion of RE2Si2O7 (RE = Y, Yb, and Lu) Environmental Barrier Coating Materials by Molten Calcium-Magnesium-Alumino-Silicate Glass at High Temperatures. J. Eur. Ceram. Soc. 2019, 39, 4245–4254. [Google Scholar] [CrossRef]
  19. Zhong, X.; Wang, Y.; Liu, P.; Huang, L.; Niu, Y.; Li, Q.; Zhang, L.; Zheng, X. Effects of Microstructure on Corrosion Behaviors for RE2SiO5 (RE = Gd, Y, Er) Environmental Barrier Coatings against Calcium-Magnesium-Alumino-Silicate Melts. Corros. Sci. 2022, 199, 110174. [Google Scholar] [CrossRef]
  20. Stokes, J.L.; Harder, B.J.; Wiesner, V.L.; Wolfe, D.E. Effects of Crystal Structure and Cation Size on Molten Silicate Reactivity with Environmental Barrier Coating Materials. J. Am. Ceram. Soc. 2020, 103, 622–634. [Google Scholar] [CrossRef]
  21. Li, B.; Chen, Z.; Zheng, H.; Li, G.; Li, H.; Peng, P. Wetting Mechanism of CMAS Melt on YSZ Surface at High Temperature: First-Principles Calculation. Appl. Surf. Sci. 2019, 483, 811–818. [Google Scholar] [CrossRef]
  22. Poerschke, D.L.; Barth, T.L.; Fabrichnaya, O.; Levi, C.G. Phase Equilibria and Crystal Chemistry in the Calcia–Silica–Yttria System. J. Eur. Ceram. Soc. 2016, 36, 1743–1754. [Google Scholar] [CrossRef]
  23. Kumar, R.; Rommel, S.; Jiang, C.; Jordan, E.H. Effect of CMAS Viscosity on the Infiltration Depth in Thermal Barrier Coatings of Different Microstructures. Surf. Coat. Technol. 2022, 432, 128039. [Google Scholar] [CrossRef]
  24. Krause, A.R.; Li, X.; Padture, N.P. Interaction between Ceramic Powder and Molten Calcia-Magnesia-Alumino-Silicate (CMAS) Glass, and Its Implication on CMAS-Resistant Thermal Barrier Coatings. Scr. Mater. 2016, 112, 118–122. [Google Scholar] [CrossRef] [Green Version]
  25. Turcer, L.R.; Krause, A.R.; Garces, H.F.; Zhang, L.; Padture, N.P. Environmental-Barrier Coating Ceramics for Resistance against Attack by Molten Calcia-Magnesia-Aluminosilicate (CMAS) Glass: Part I, YAlO3 and γ-Y2Si2O7. J. Eur. Ceram. Soc. 2018, 38, 3905–3913. [Google Scholar] [CrossRef]
  26. Kumar, R.; Jordan, E.; Gell, M.; Roth, J.; Jiang, C.; Wang, J.; Rommel, S. CMAS Behavior of Yttrium Aluminum Garnet (YAG) and Yttria-Stabilized Zirconia (YSZ) Thermal Barrier Coatings. Surf. Coat. Technol. 2017, 327, 126–138. [Google Scholar] [CrossRef]
  27. Aparicio, M.; Moreno, R.; Durán, A. Colloidal Stability and Sintering of Yttria–Silica and Yttria–Silica–Alumina Aqueous Suspensions. J. Eur. Ceram. Soc. 1999, 19, 1717–1724. [Google Scholar] [CrossRef]
  28. Xin, R.; Leng, Y.; Wang, N. Ultrastructure Study of Hydroxyapatite Precipitation on Ceramic Surfaces in Dog Model. Mater. Sci. Eng. C 2008, 28, 1255–1259. [Google Scholar] [CrossRef]
  29. Raju, G.S.R.; Ko, Y.H.; Pavitra, E.; Yu, J.S.; Park, J.Y.; Jung, H.C.; Moon, B.K. Formation of Ca2Gd8(SiO4)6O2 Nanorod Bundles Based on Crystal Splitting by Mixed Solvothermal and Hydrothermal Reaction Methods. Cryst. Growth Des. 2012, 12, 960–969. [Google Scholar] [CrossRef]
  30. Eils, N.K.; Mechnich, P.; Braue, W. Effect of CMAS Deposits on MOCVD Coatings in the System Y2O3–ZrO2: Phase Relationships. J. Am. Ceram. Soc. 2013, 96, 3333–3340. [Google Scholar] [CrossRef]
  31. Zhong, X.; Wang, Y.; Niu, Y.; Huang, L.; Li, Q.; Zheng, X. Corrosion Behaviors and Mechanisms of Ytterbium Silicate Environmental Barrier Coatings by Molten Calcium-Magnesium-Alumino-Silicate Melts. Corros. Sci. 2021, 191, 109718. [Google Scholar] [CrossRef]
Figure 1. Representative cross-sectional SE micrographs of the YAP/CMAS reaction at (a) 1 min, (b) 10 min and (c) 30 min at 1350 °C. The YAP substrate is the (101) orientation and is representative of all substrate orientations.
Coatings 12 01604 g001
Figure 2. (a) Cross-sectional SE micrograph of the edge of the (100) YAP/CMAS reaction region after 10 min at 1350 °C. Labels G and W indicate the CMAS-glass and wollastonite phase, respectively. Elemental EDS maps of (b) Ca, (c) Si, (d) Al, (e) Mg collected from within the CMAS drop in the same sample as (a).
Coatings 12 01604 g002
Figure 3. XRD pattern collected from the surface of the (100) YAP/CMAS reacted sample after 10 min at 1350 °C (same sample as shown in Figure 2). Diffraction peaks for YAlO3 and CaSiO3 were identified and labeled accordingly. All other remaining peaks matched those of the clay that was used for XRD mounting and had been scanned independently.
Coatings 12 01604 g003
Figure 4. The YAP substrate thicknesses measured after reacting with CMAS for various times at 1350 °C. Error bars indicate the standard deviation of the measurements collected using ImageJ.
Coatings 12 01604 g004
Figure 5. Micrographs that show the CMAS attack progression at the center of the reaction region for all four substrates at 1350 °C. Cross-section SE micrographs collected at the YAP/CMAS interface for (ac) (100), (df) (001), (gi) (110), and (jl) (101) substrates at (a,d,g,j) 10, (b,e,h,k) 30 and (c,f,i,l) 60 min. The contrast used to identify the CMAS glass (G), apatite (Ap), YAG, and YAP phases are indicated in (c). The scale bar is consistent for substrates with the same exposure time. Note that the scale for the 10-min samples is different from the 30- and 60-min samples as indicated. The dashed box in (k) indicates a region from where the TEM sample was extracted using the FIB.
Coatings 12 01604 g005
Figure 6. EDS maps showing the qualitative phase compositions at the (101) YAP/CMAS interface at (a) 10, (b) 30, and (c) 60 min exposure at 1350 °C. These maps combine the Al, Si, and Y EDS signals, represented in red (R), green (G), and blue (B), respectively.
Coatings 12 01604 g006
Figure 7. EDS map overlaid on HAADF image showing the phases in the reaction region of the (101) YAP sample exposed to CMAS for 30 min at 1350 °C. The TEM sample was extracted from a region similar to that indicated in Figure 5k. The EDS map combines the signals of Al, Si, and Y, represented in red, green, and blue, respectively; grayscale indicates HAADF contrast. The label G indicates the CMAS-glass.
Coatings 12 01604 g007
Figure 8. SE micrographs showing CMAS wetting and the edge of the reaction region after 10 min at 1350 °C. The (a) (100) YAP substrate is representative of what is seen in the (001) YAP substrate not shown. Similarly, the (110) YAP substrate in (b) is representative of that seen in the (101) YAP substrate not shown. Insets show higher magnification images at the YAP/CMAS interfaces indicated.
Coatings 12 01604 g008
Figure 9. SE micrographs showing CMAS wetting and the edge of the reaction region after 30 min at 1350 °C. The (a) (100) YAP substrate is representative of what is seen in the (001) YAP substrate not shown. Similarly, the (110) YAP substrate in (b) is representative of that seen in the (101) YAP substrate not shown. Insets show higher magnification images at the YAP/CMAS interfaces indicated.
Coatings 12 01604 g009
Table 1. Prepared CMAS composition measured by XRF.
OxideMole Fraction
SiO20.468
CaO0.445
MgO0.044
Al2O30.043
Table 2. Measurements of the YAP/CMAS contact angle and various attributes of the reaction phases for the four YAP orientations at different exposure times at 1350 °C.
YAP Substrate OrientationContact
Angle (°)
YAG Layer
Thickness (µm)
Apatite Layer
Thickness (µm)
Apatite Area
(µm2)
30 min60 min30 min60 min30 min60 min
(100)1452.2 ± 0.12.4 ± 0.51.0 ± 0.319 ± 0.667 ± 10783 ± 92
(001)1501.9 ± 0.31.9 ± 0.62.5 ± 0.416 ± 2.6136 ± 12653 ± 114
(110)1601.5 ± 0.32.4 ± 0.32.5 ± 0.517 ± 3.1137 ± 20747 ± 142
(101)1641.7 ± 0.32.4 ± 0.27.5 ± 1.627 ± 1.6307 ± 171070 ± 51
Publisher’s Note: MDPI stays neutral with regard to jurisdictional claims in published maps and institutional affiliations.

