Article

Cyclic Performance of Prefabricated Shear Wall Connected to Columns by Rectangular Concrete-Filled Steel Tube Keys

1
School of Civil Engineering, Shenyang Jianzhu University, Shenyang 110168, China
2
School of Construction Engineering, Tianjin University, Tianjin 300072, China
3
School of Civil Engineering, Shenyang Urban Construction University, Shenyang 110000, China
*
Authors to whom correspondence should be addressed.
Coatings 2022, 12(10), 1584; https://doi.org/10.3390/coatings12101584
Submission received: 14 September 2022 / Revised: 14 October 2022 / Accepted: 16 October 2022 / Published: 19 October 2022
(This article belongs to the Special Issue Current Research in Cement and Building Materials)

Abstract

:
A prefabricated frame–shear wall structure is a major structure in an assembled building. To find a method of connecting a shear wall and columns that can both reduce the amount of wet work required and maintain adequate stiffness, we propose connecting the shear wall to the vertical frame using rectangular concrete-filled steel tube keys (RCFSTKs). Static tests of a cast-in-place frame–shear wall structure without keys and a prefabricated structure with RCFSTKs were conducted to compare their seismic performance. The feasibility of the new method was analyzed. Finite element models were then set up to determine if plain concrete blocks between RCFSTKs could be removed and to identify the influence of different parameters on the cyclic performance of the assembled structure. The results show that the use of RCFSTK is practical. Compared with a dimensionally similar cast-in-place shear wall–column construction, a prefabricated shear wall connected to columns by RCFSTKs has a fuller hysteresis curve, better ductility, slightly higher energy dissipation, and slightly slower degradation of stiffness and bearing capacity. The removal of inter-key concrete blocks significantly reduces bearing capacity and initial stiffness. The cyclic performance of the assembled structure is primarily influenced by the number of RCFSTKs, the thickness of the steel tube key wall, and the axial compression ratio, with less effect from key unit height, steel strength, and concrete grade in RCFSTKs.

1. Introduction

Assembled concrete structures have the advantages of fast construction, high production efficiency and good engineering quality. They have been widely used in various buildings. A frame–shear wall structure is composed of frames and shear walls. Due to the combination effect [1], it has the advantages of flexible building layout, large spacing and good lateral resistance. An assembled frame–shear wall structure combines the advantages of the assembled concrete structure and the frame–shear wall structure, and it has been proved to have good cyclic performance [2,3]. This promotes their application in areas requiring seismic fortification.
Prefabricated shear walls, prefabricated frame beams and columns are the important components of a prefabricated frame–shear wall structure. How to connect them is the key technical problem of this structure. Two widely used assembly methods for such a structure exist in China. One is to prefabricate a shear wall, frame columns, and frame beams as a complete unit for subsequent assembly; this method is suitable when the wall, columns, and beams are small. Researchers [1,2,3,4,5] conducted a series of studies on this kind of structure and found that its cyclic performance was similar to that of a cast-in-place one. The second method is to prefabricate a wall, columns, and beams as independent units for subsequent assembly; this method is suitable when these components are larger. The feasibility of this method has been demonstrated by Zhao et al. [6]. There is less research into assembled frame–shear wall structures from other countries where the assembly method mainly used is to attach shear walls to the outside of the frame plane [7,8].
We study the second case. For the second method, it is necessary to study how to ensure a rigid connection between the shear wall and columns. Tong et al. [9] investigated a single-story structure of walls and columns connected with straight bars, U-shaped bars, straight U-shaped bars, and link bars using compression–shear tests and static tests. Gao et al. [10,11,12] examined the feasibility of connecting the shear wall and columns with U-bar in the graduate student apartment building of Shenyang Jianzhu University. Anion et al. [13] proposed setting keys on the surface of the wall and columns. The preceding studies all require pouring concrete or grout in or around the connection interface, which necessitates a relatively large amount of wet work. To reduce the amount of wet work and increase industrialization, Chinese researchers proposed using pure steel members to connect walls and columns. Gao et al. [14] investigated the mechanical properties of this type of structure using numerical models and found that its stiffness was very low and did not meet the level required to resist deformation. So, it becomes a topic of concern to find a method of connecting a shear wall and columns that can both reduce the amount of wet work required and maintain adequate stiffness.
Because the method using pure steel members to connect walls and columns can not meet the requirement of stiffness, we propose a method that uses rectangular concrete-filled steel tube keys (RCFSTKs). This paper investigates the cyclic performance of a prefabricated shear wall and column unit connected by RCFSTKs to determine the feasibility of using RCFSTKs in connecting prefabricated components in order to develop a wall and column connection method that facilitates more rapid assembly.

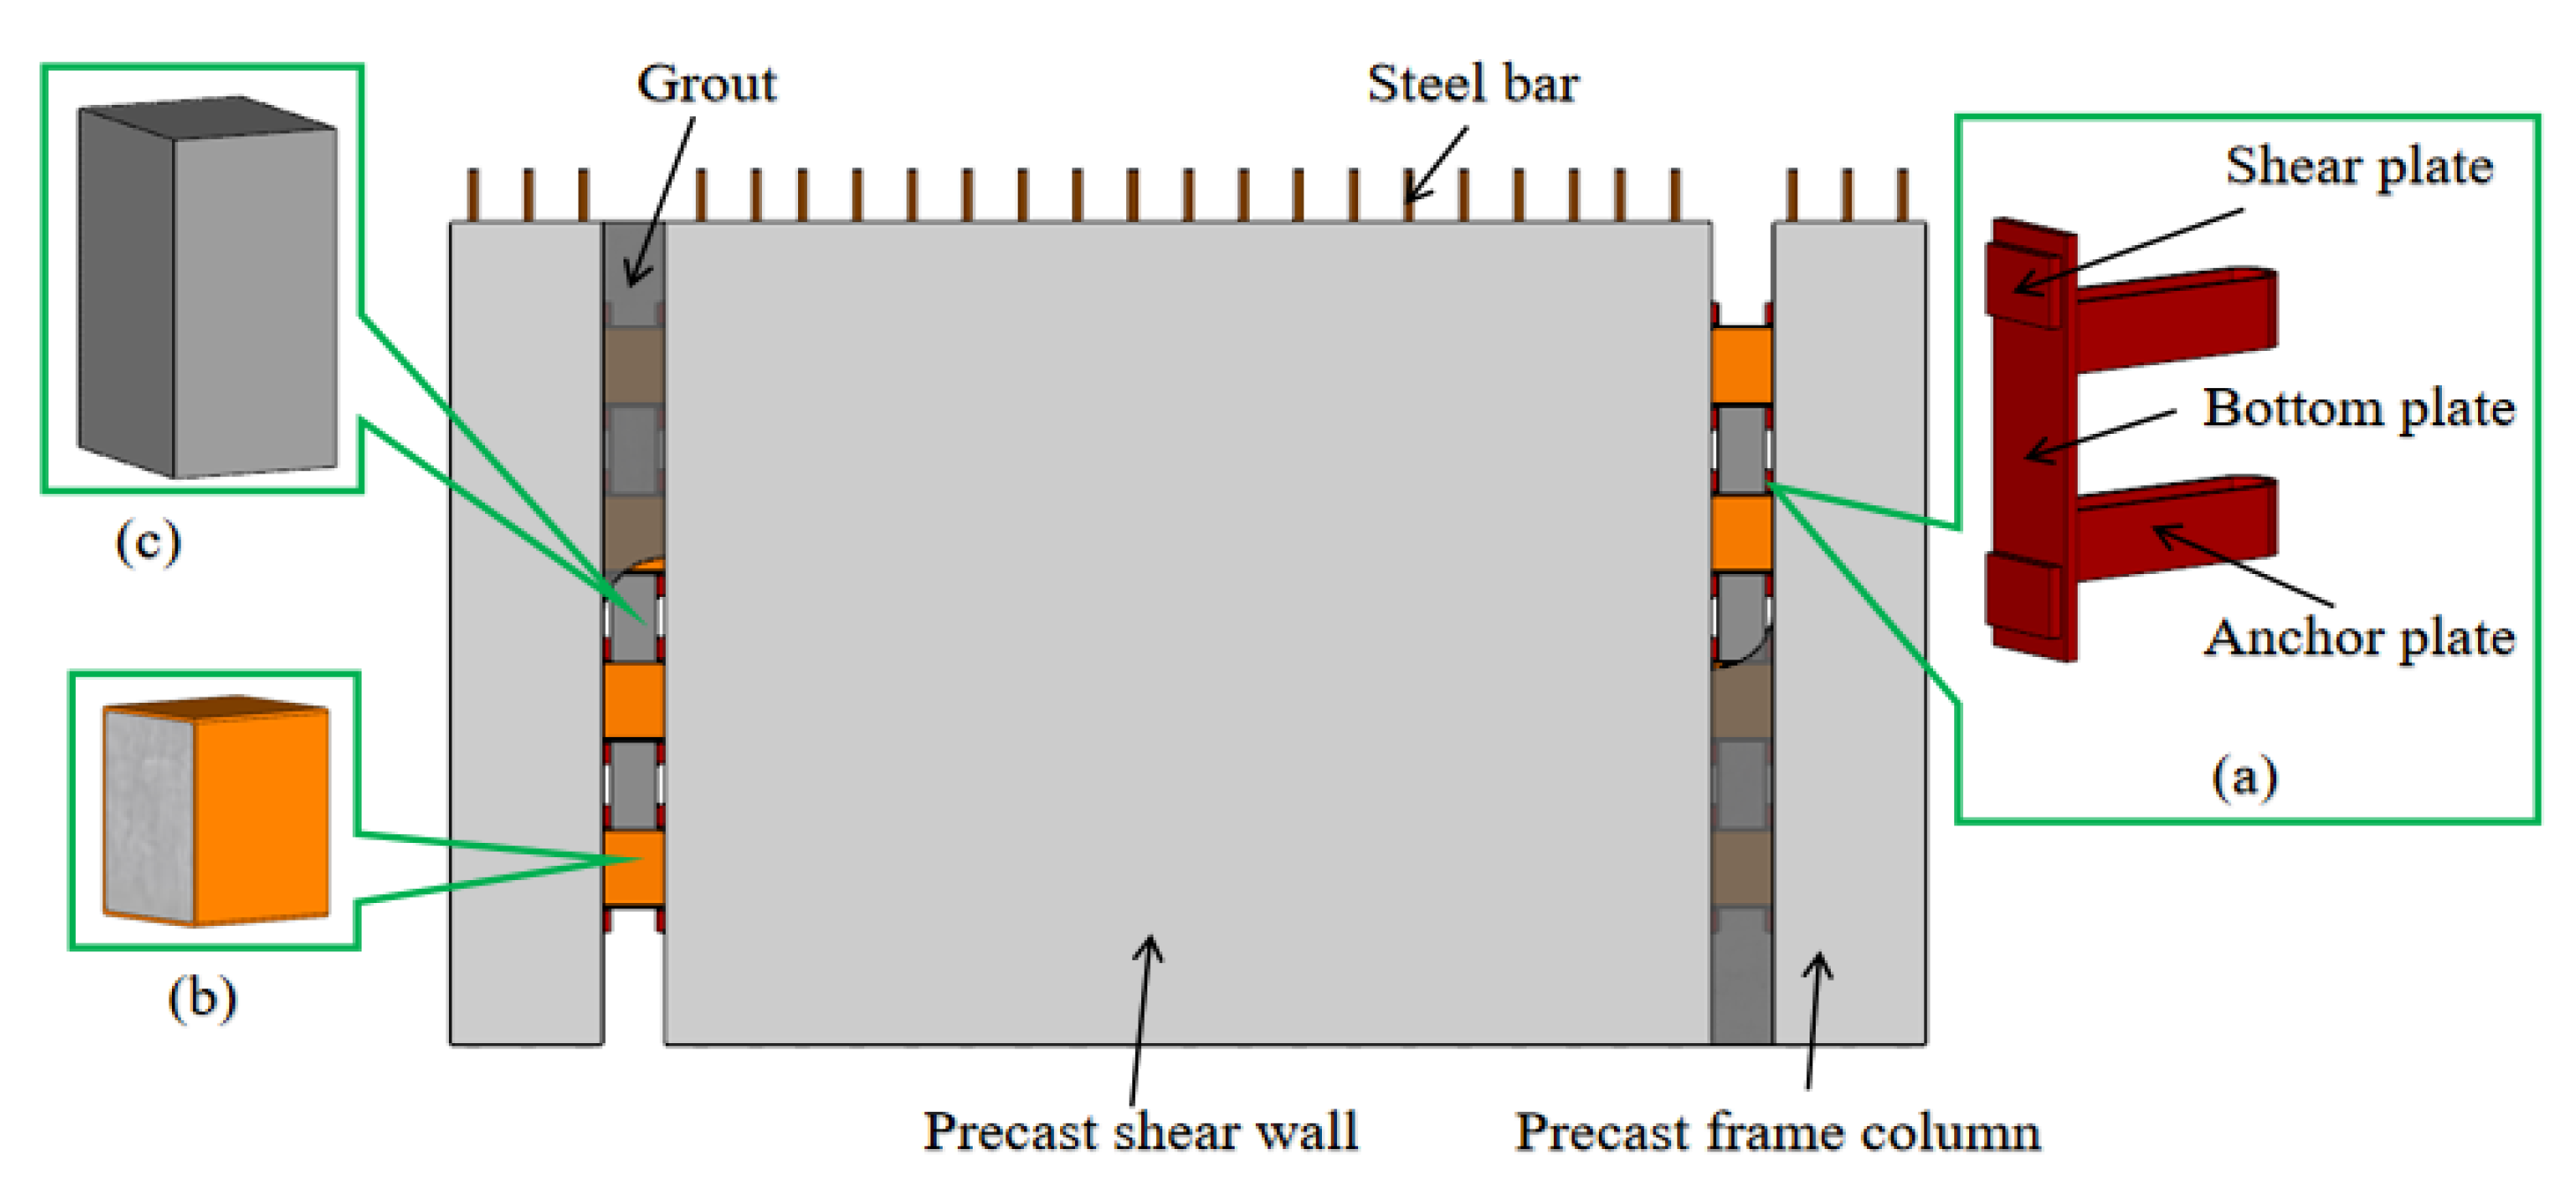
2. Structure of Wall and Columns Connected by RCFSTKs

Frame–shear wall structure showing the wall and columns connected by RCFSTKs is as Figure 1. The part embedded in the wall–column interface consists of a steel shear plate, a bottom steel plate, and an anchor steel plate welded together (Figure 1a). The RCFSTK is formed by filling the steel tube with concrete (Figure 1b). The plain concrete block inserted between the keys is shown in Figure 1c. If there are no RCFSTKs or plain concrete blocks, there will be gaps between the surface of the column and shear wall, which will reduce the bearing capacity and initial stiffness. The embedded parts are fixed at the sides of the wall and the columns. During assembly, the RCFSTKs are first welded between the steel shear plates, and then the plain concrete blocks are placed between the RCFSTKs, as shown in Figure 1; the joint gap is then filled with grout. This method can provide enough stiffness because the gap of column and shear wall are all filled with steel, concrete or grout. In addition, it can also reduce the wet work because the plain concrete blocks are prefabricated and only a small amount of wet gout is used. The internal force between the shear wall and the column includes shear, axial tension and compression force along the RCFSTKs and moment. The tension force is transferred by the steel of RCFSTKs, the moment is transferred by the RCFSTKs, and the other forces are transferred by the RCFSTKs, plain concrete blocks and grout.

3. Test Program

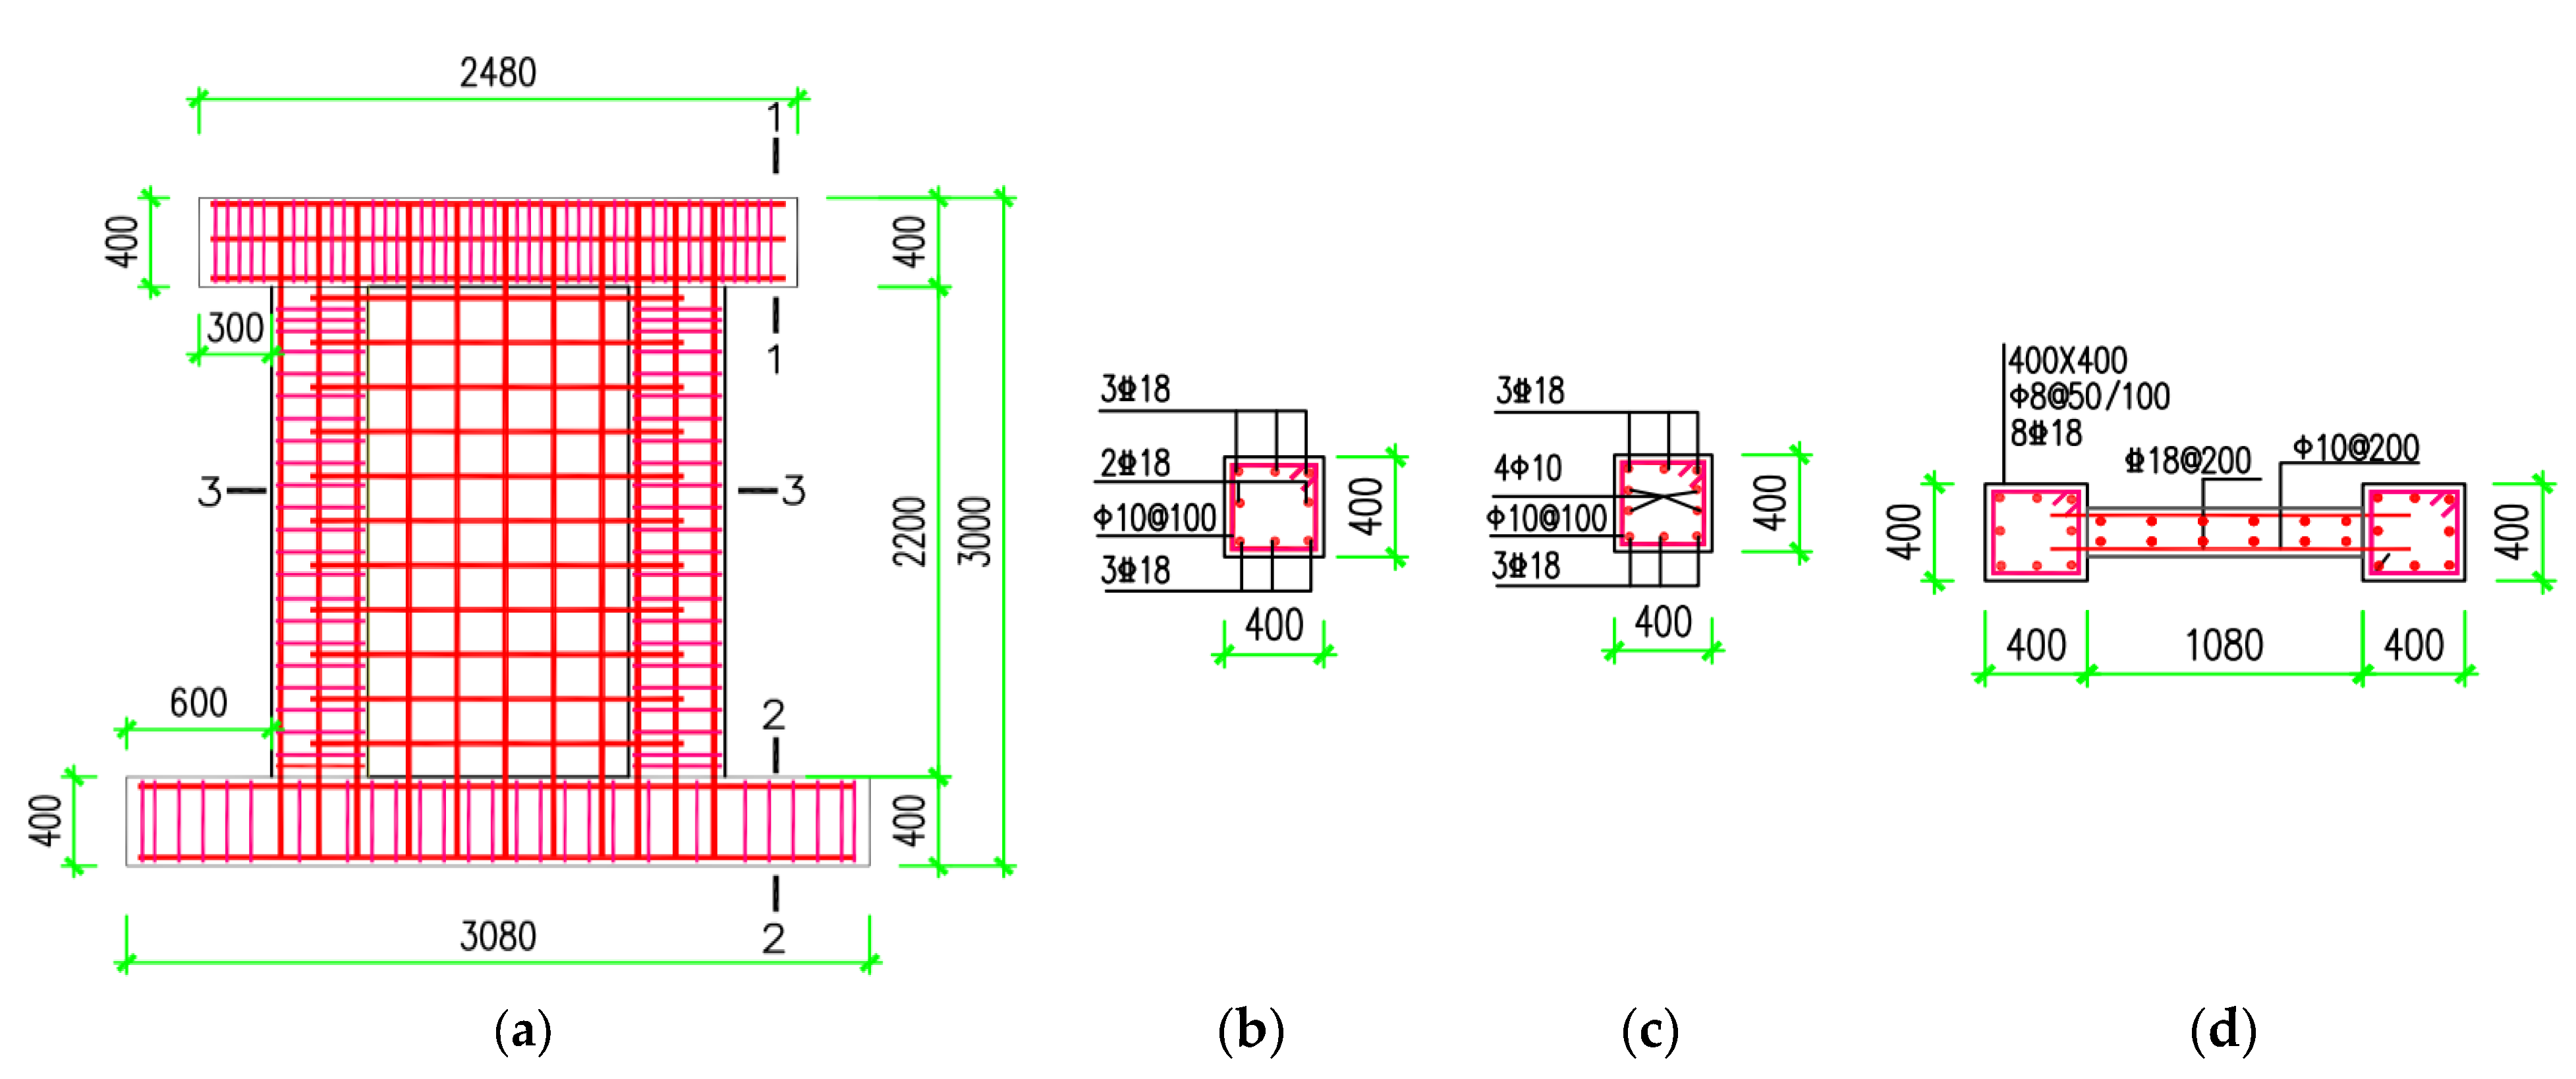
3.1. Test Specimen Design

A testing program was designed for specimens of two different single-story shear wall structures, XJ and ZP. Wall XJ was a single-story cast-in-place shear wall, while wall ZP was a prefabricated shear wall attached to the supporting columns with RCFSTKs. The dimensions are shown in Table 1.
The dimensions and reinforcement of the two specimens are shown in Figure 2 and Figure 3. The concrete grade was C40; the steel plates were 4 mm thick Q235; the stirrups were HPB300; the tension bars were HRB400.

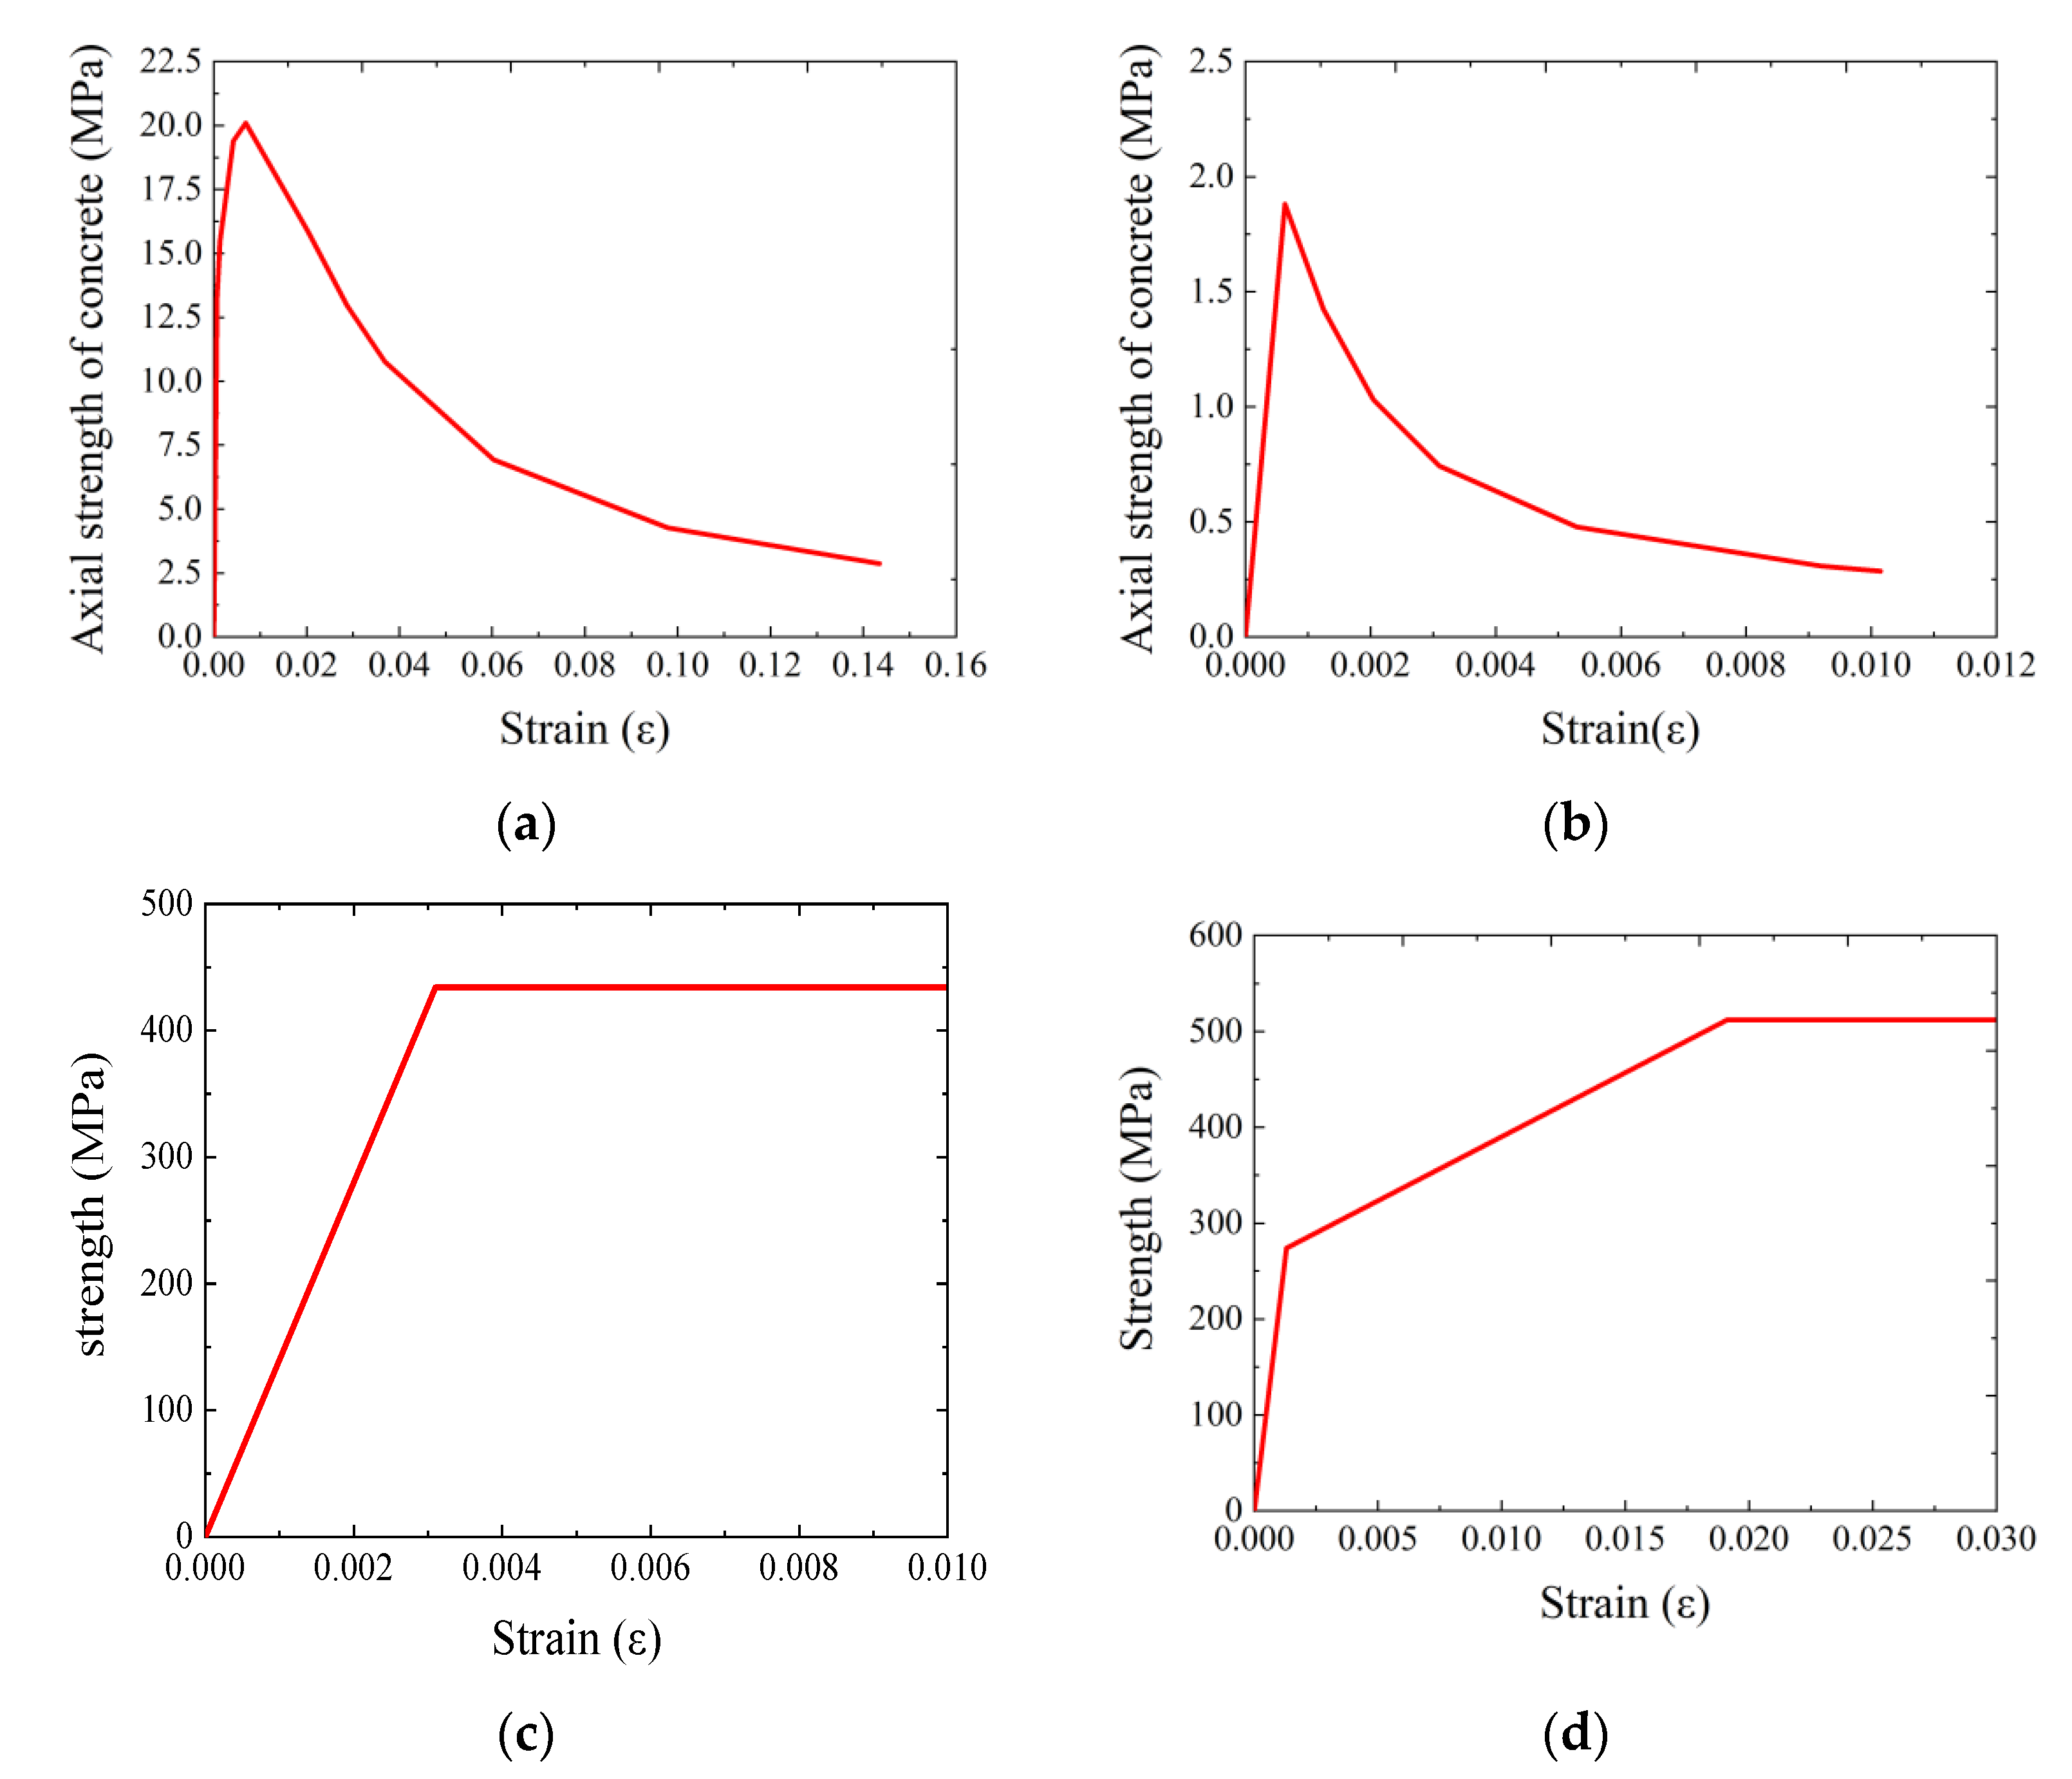
3.2. Mechanical Properties

The testing results of the mechanical properties are shown in Table 2.

3.3. Loading Program
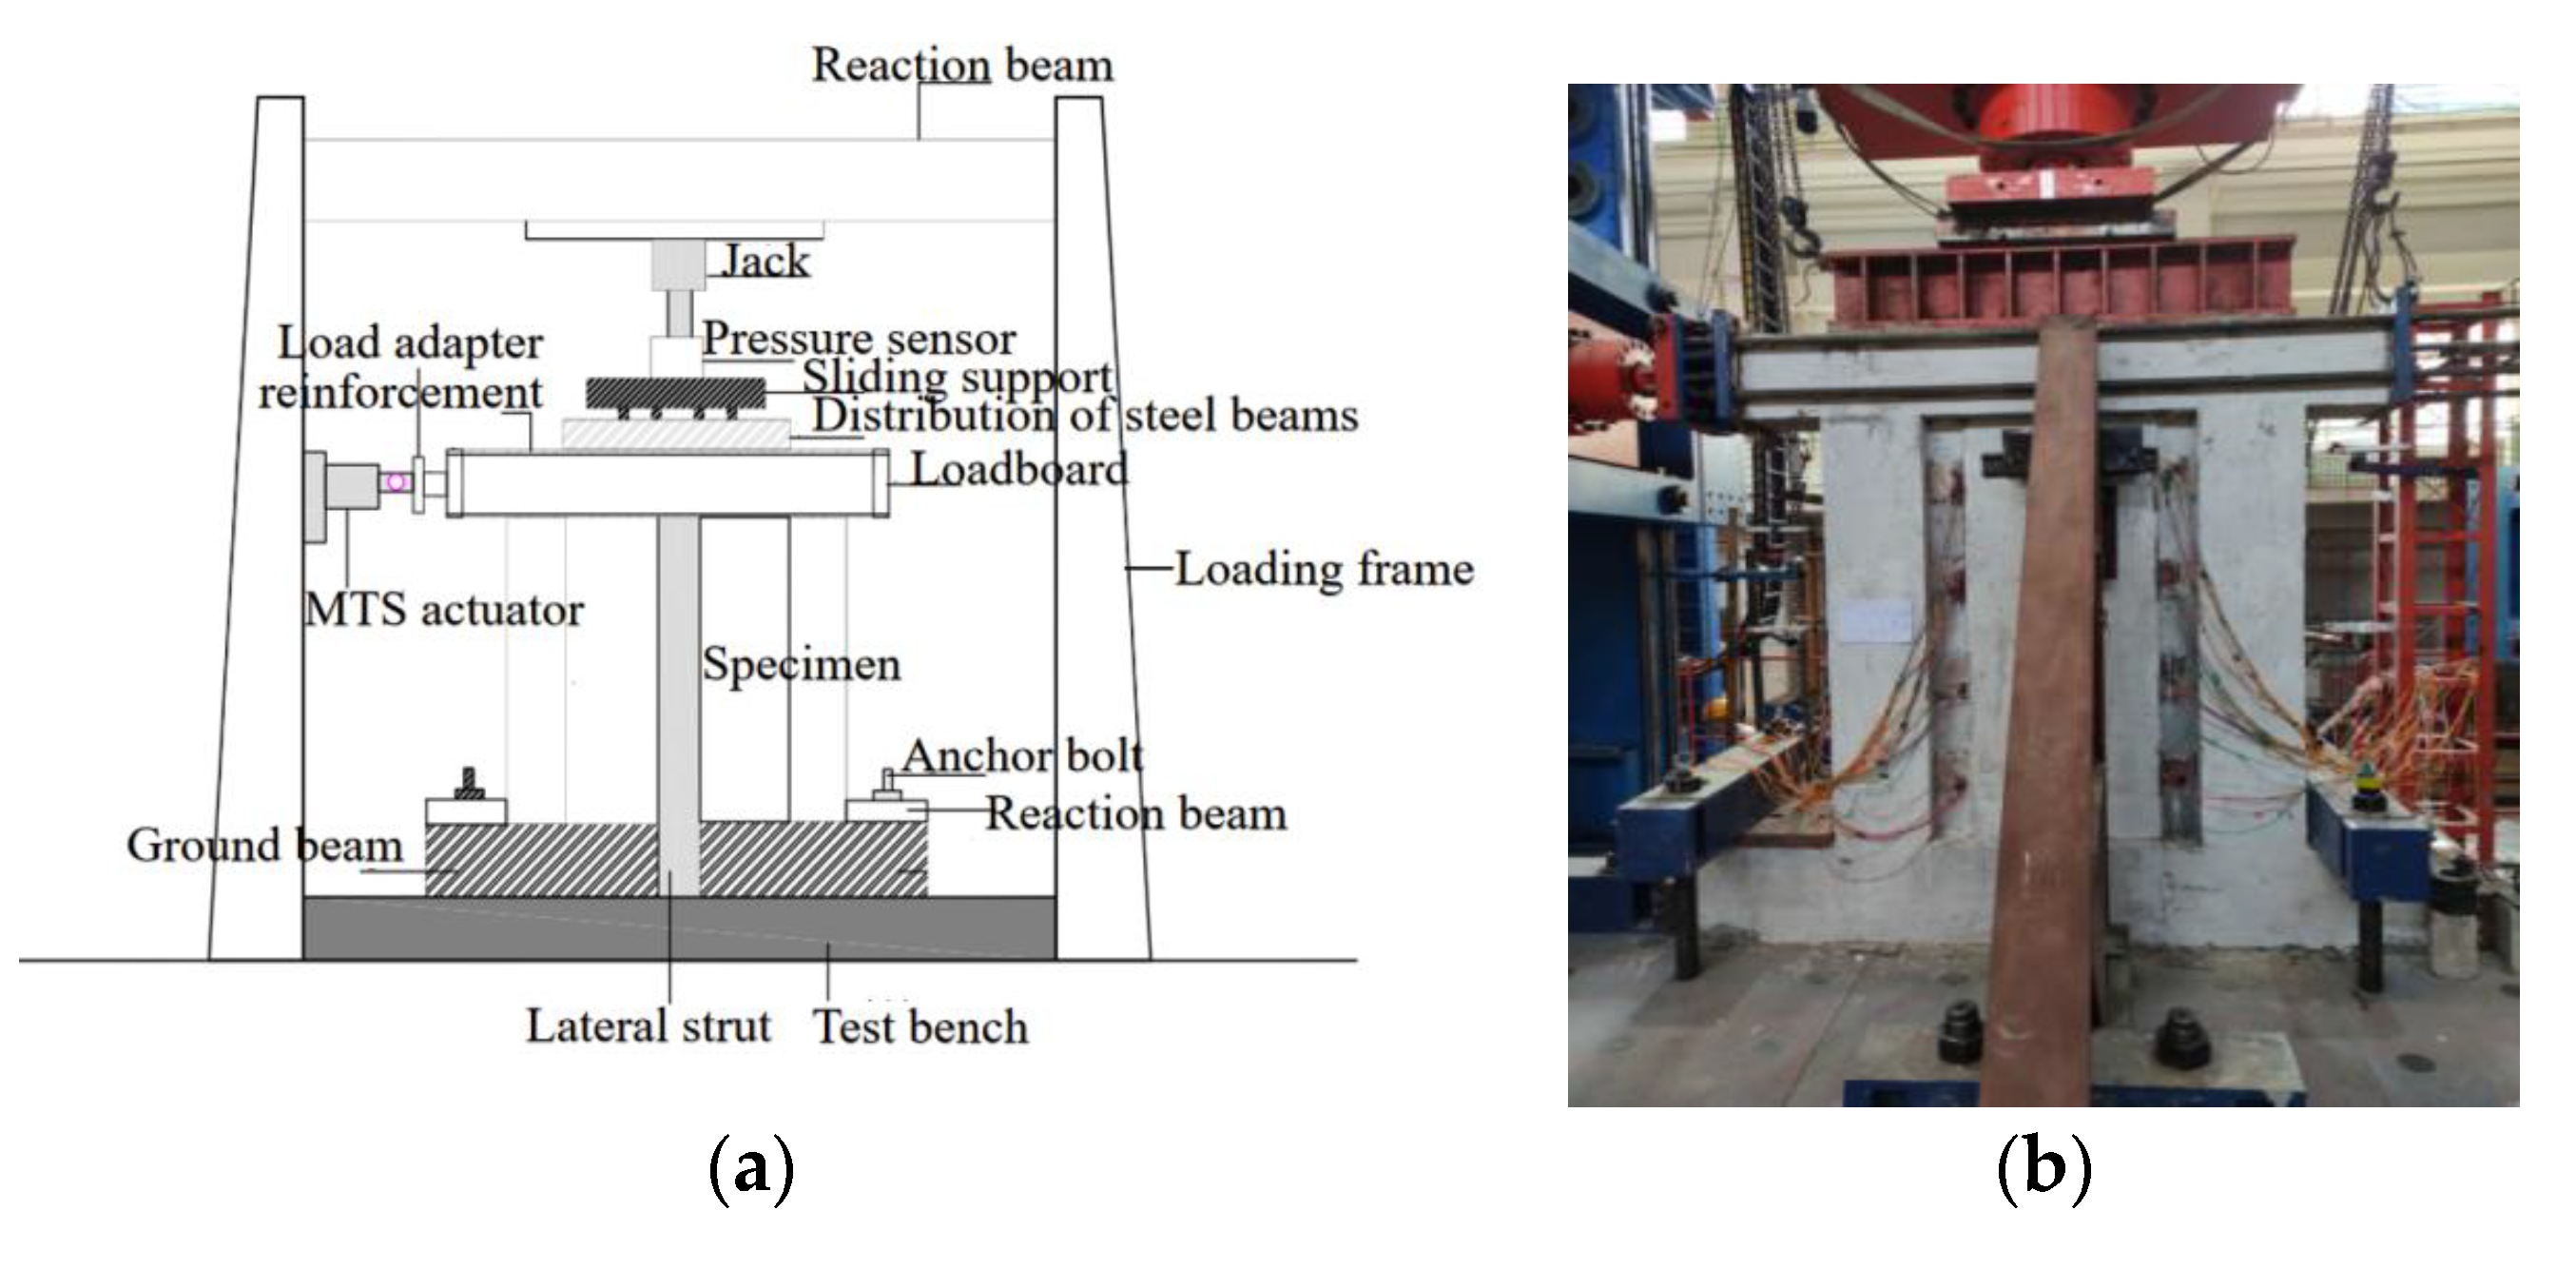
The test loading device is shown in Figure 4. The specimen was fixed to the test bench by lateral struts, ground beams, ground anchor bolts, and compression beams. The vertical load was applied through the reaction beam, jack, pressure sensor, steel distribution beam, and loading beam, and a sliding plate support was set between the pressure sensor and the steel distribution beam. The horizontal load was applied through the loading frame, an MTS system horizontal actuator, loading head, tension bar, and loading plate.

3.4. Loading System

The test loading system is shown in Figure 5. Before the test, a pre-load was applied to check the equipment for connection reliability and data measurement accuracy. In test loading, the predetermined vertical load was applied and remained constant, and then the horizontal load was applied. The controlled loads were 1000 kN vertical and 200 kN horizontal. The horizontal load was cycled once per stage, and the vertical load was calculated using an axial compression ratio of 0.4, totaling 4000 kN. Until the specimen yielded (at the horizontal load Fy), the loading was changed to cyclic displacement loading, with the grade difference of yield displacement Δ and cycling twice per stage. The test ended when the bearing capacity dropped to 85% of the peak load [15,16]. The push direction was positive, while the pull direction was negative.

3.5. Measurement Program

Figure 6 shows the arrangement of sensors for testing specimen ZP. Six displacement gauges measured the horizontal displacement of the loading beam (D1), the horizontal displacement of the shear wall (D2–D4), and the vertical and horizontal displacements of the ground beam (D5–D6). Eight reinforcement strain gauges were arranged to measure the strain of longitudinal bars at the outer corners of the column footings (S1–S2, S1’–S2’) and at the outer footings of the walls (S3–S4, S3’–S4’). Four strain gauges were arranged at the upper and lower ends of the steel plates of RCFSTK A. Four strain gauges (A1–A4) measured the strain generated by bending stress, and one strain flower (A5) was placed at the center of the side steel plate to measure the strain generated by shear stress. The other RCFSTKs (B–H) were arranged with the same strain gauge and flower patterns as RCFSTK A.

4. Specimen Damage and Comparative Analysis

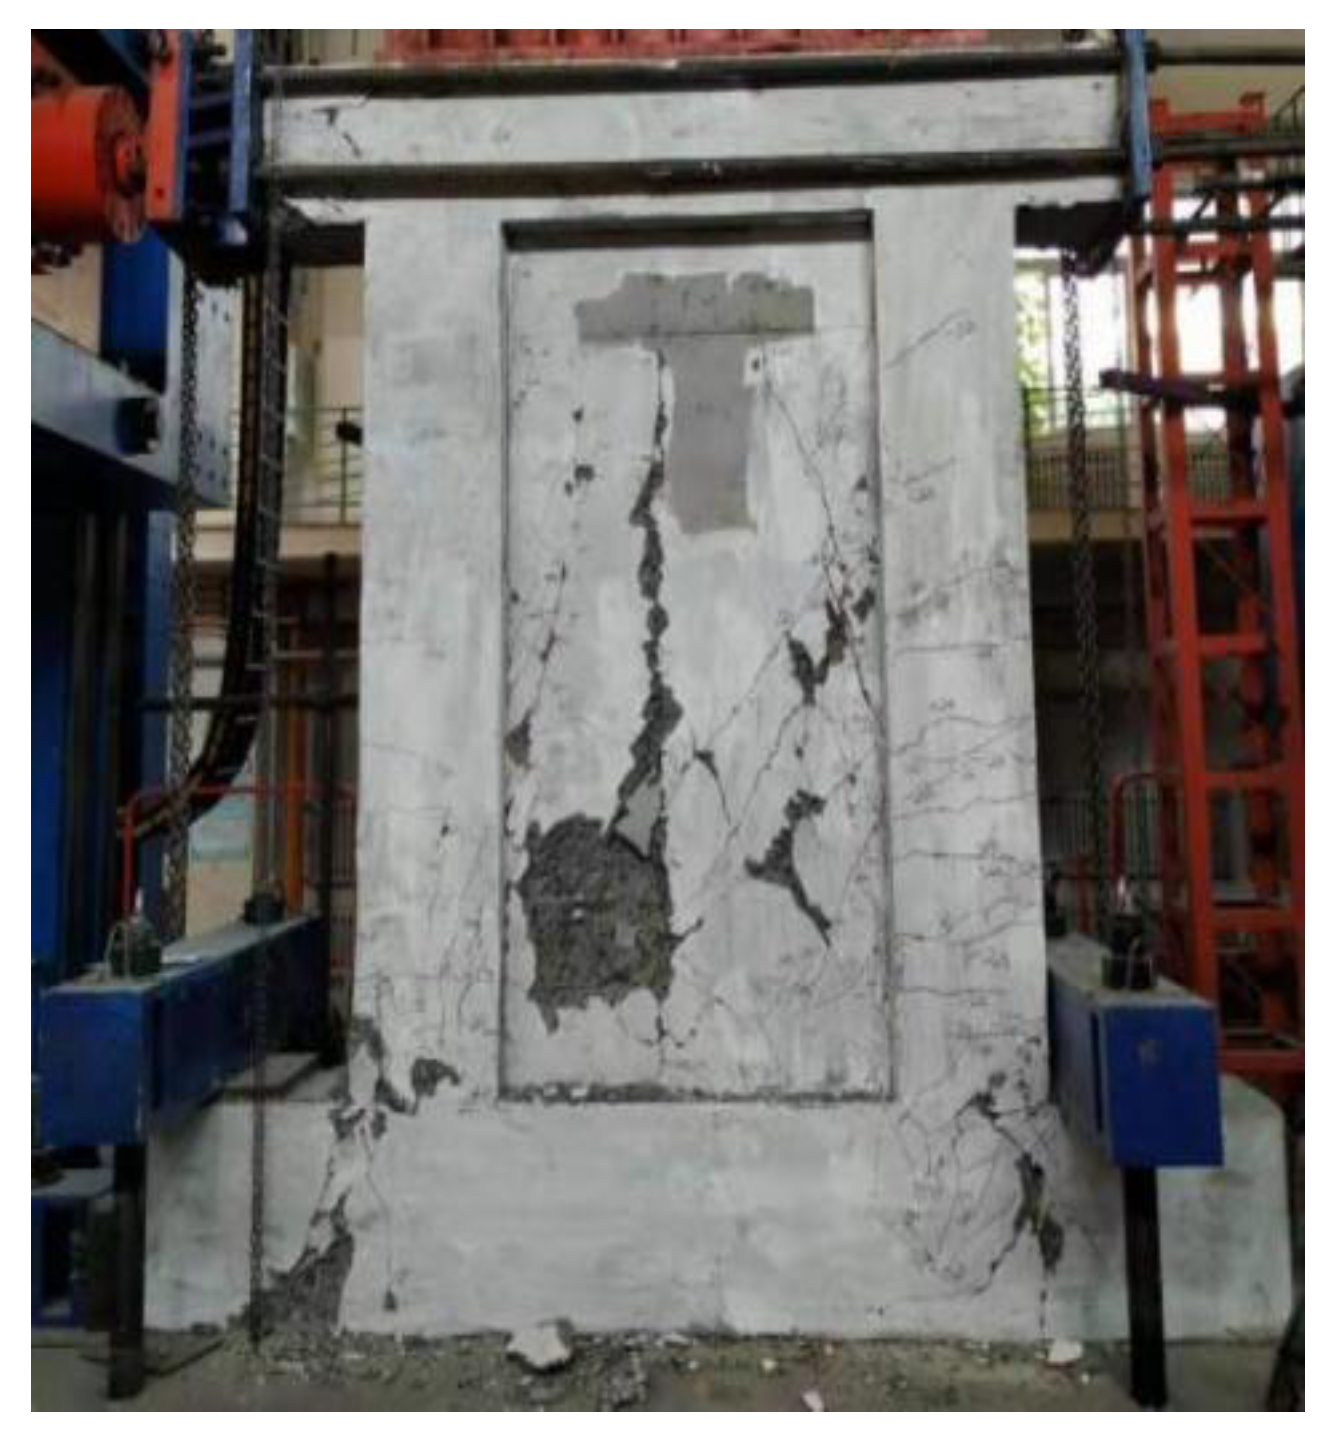
4.1. Specimen Damage

4.1.1. Specimen XJ

There was little sign of damage as loading commenced. When loaded to −750 kN, a slight diagonal crack appeared in the upper left corner of the shear wall. When loaded to 1200 kN, a diagonal crack appeared in the lower right corner of the shear wall. When loaded to −1200 kN, a vertical crack appeared in the middle left side of the shear wall. When loaded to 1600 kN, the specimen yielded, and the loading became displacement loading. When loaded to −1Δ, a longer diagonal crack appeared in the right side of the shear wall oblique cracks. When loaded to +2Δ, oblique cracks appeared at the foot of the right frame column, and as displacement increased, oblique cracks developed and extended to the left and right sides of the shear wall. When loaded to −2Δ, additional horizontal bending cracks appeared in the frame column, and the foot of the left column, the right side of the wall, and the right column were obviously damaged. When loaded to +3Δ, the foot of the column and the foot of the wall were seriously damaged, and the bearing capacity was <85% of the maximum. When the displacement returned to zero, the test ended. The final damage of the specimen XJ is shown in Figure 7.

4.1.2. Specimen ZP

There was also little sign of damage as loading started. When loaded to 600 kN, vertical cracks appeared in the center of the shear wall. When loaded to 1000 kN, vertical cracks appeared in the horizontal direction of the shear wall at about a quarter of the wall length. When loaded to 1200 kN, diagonal cracks appeared at the upper part of the foot of the frame column. When loaded to 1600 kN, the specimen yielded, and the loading became displacement loading. When loaded to −1Δ, horizontal cracks appeared in the lower left part of the shear wall, and diagonal cracks appeared at the lower end of the vertical cracks and reinforced concrete blocks in the middle of the shear wall. When loaded to +2Δ, more diagonal cracks appeared in the shear wall, and diagonal cracks appeared in the upper part of the right frame column. When loaded to −2Δ, more uniform damage occurred in both the shear wall and frame column. When loaded to +3Δ, cracks developed and extended rapidly in the specimen, and the damage was obvious. The bearing capacity was <85% of the maximum value. When the displacement returned to zero, the test was stopped. The final damage of the specimen ZP is shown in Figure 8.

4.2. Comparative Analysis of Damage

The damage to specimens XJ and ZP were compared. The locations of the first crack in the frame column were different. The first crack in XJ appeared at the foot of the frame column, while the first crack in ZP appeared at the upper part of the column foot and was more evenly distributed vertically along the column. The vertical distributions of cracks in the two types of shear walls were different: the cracks in ZP were more evenly distributed along the height of the wall, while the cracks in XJ were distributed mainly in the lower part of the wall. The reason for these differences is that when an RCFSTK transfers the internal forces between the frame column and the shear wall, it produces a concentrated force perpendicular to the frame column. This changes the location where the maximum bending moments of the frame columns and the shear wall appear so that both the columns and the wall of ZP are subjected to more uniform bending moments in the vertical direction than XJ. Therefore, the fabricated frame–shear wall structure using RCFSTKs to connect the wall and columns, ZP, withstands the applied force better than XJ.
The sequence of the occurrence of vertical and diagonal cracks in the shear wall differed between specimens XJ and ZP. In XJ, diagonal cracks appeared first and then vertical cracks; in ZP, that order was reversed. The corresponding horizontal loads were different for the appearance of vertical cracks, with the loads being 1200 kN for XJ and 600 kN for ZP. The load was greater for XJ than for ZP because the elastic modulus of the grout was less than that of the concrete, and there might also be gaps in the joint parts introduced during assembly, which together led to the uncoordinated vertical deformation of the assembly.

5. Analysis of Test Results

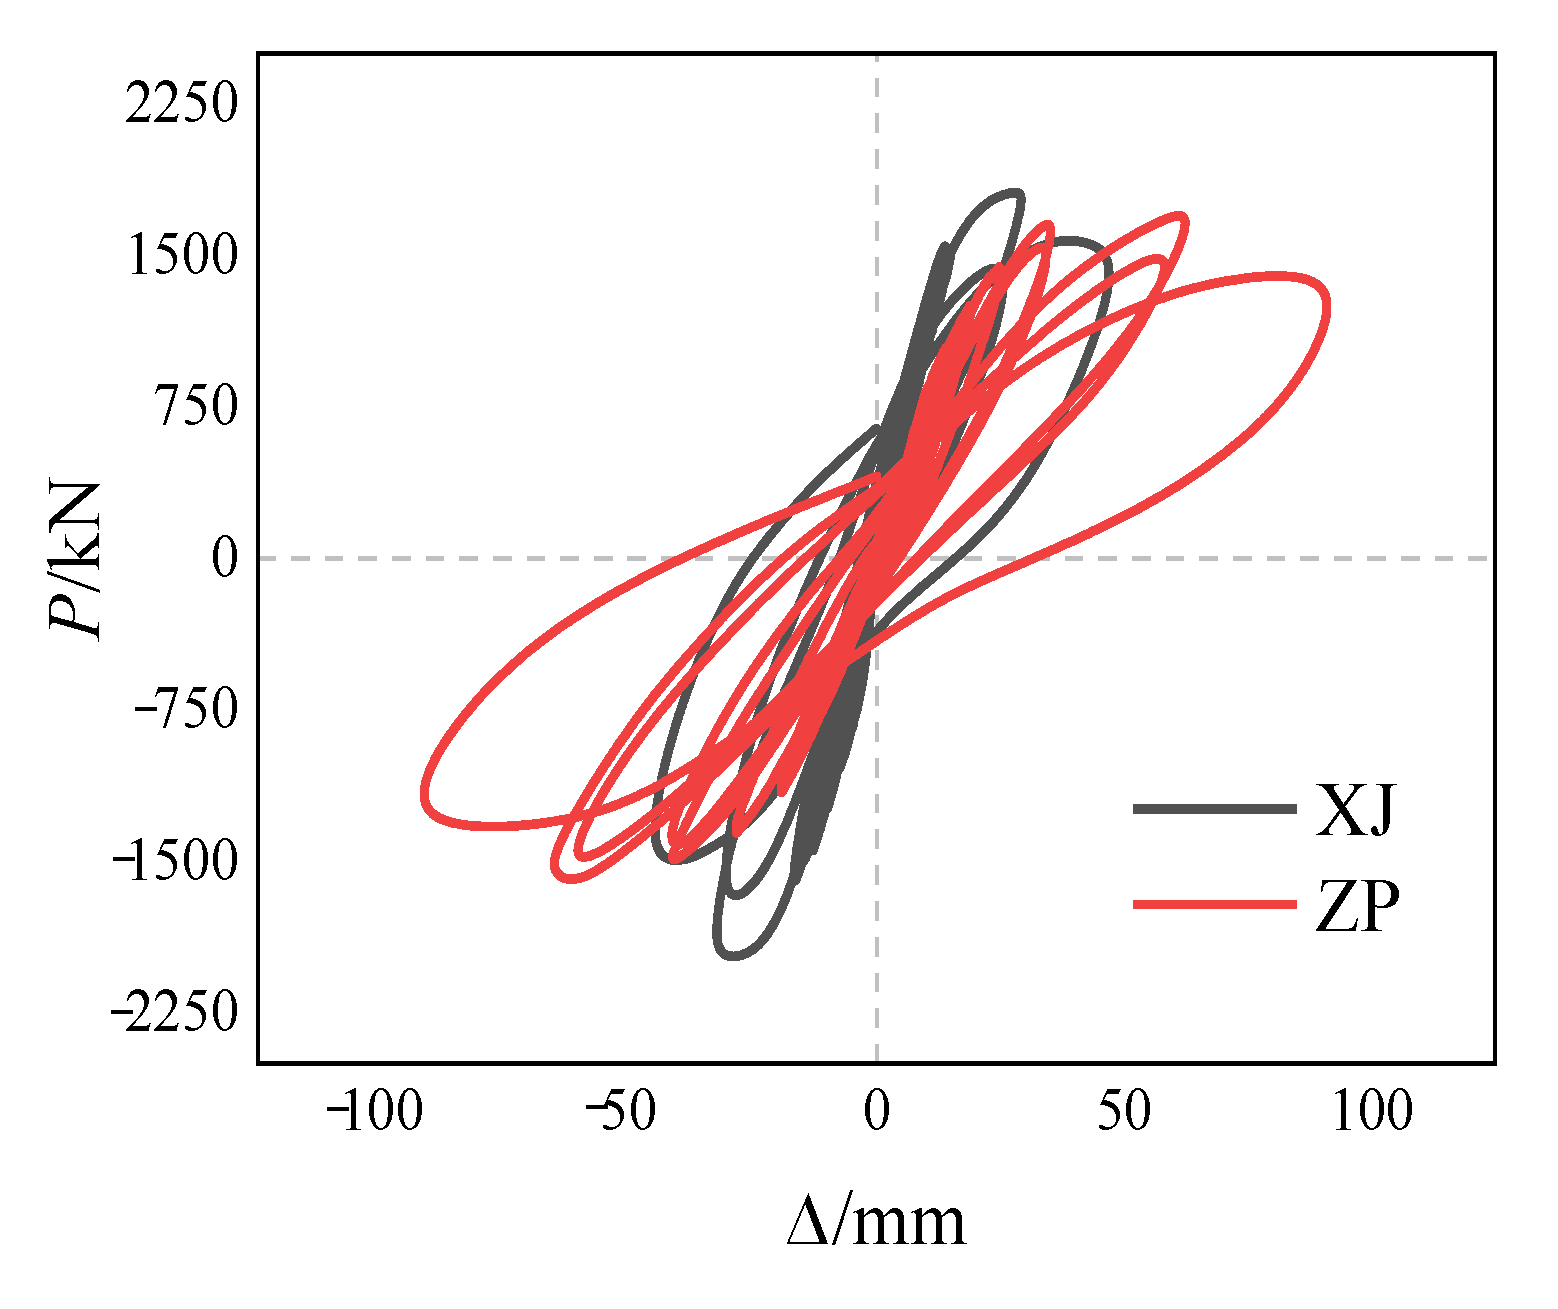
5.1. Load–Displacement Hysteresis Curve

The load–displacement hysteresis curves of specimens XJ and ZP are shown in Figure 9.

5.2. Skeleton Curve

Figure 10 shows the load–displacement skeleton curves of specimens XJ and ZP. Table 3 lists the corresponding characteristic index values. Characteristic index values were defined according to Reference [17]: peak load is the maximum load on the specimen; damage load is 85% of the peak load; yield load is calculated by the energy equivalence method; the ductility coefficient is the ratio of damage displacement to yield displacement; initial stiffness is the ratio of 20% of yield load to the corresponding displacement.
Figure 10 and Table 3 illustrate that: the load–displacement skeleton curves of each specimen have distinct elastic, elastoplastic, and decreasing sections. The skeleton curve of ZP was below that of XJ in both elastic and inelastic rising sections; yield load, ultimate load, failure load, and initial stiffness were 9%, 6%, 6%, and 23% less, respectively. However, the inelastic decreasing section of ZP was significantly above XJ and decreased slowly; the ductility ratio was 22% greater than that of XJ. This was due to the elastic modulus of the grout being less than that of the concrete. Voids might also have been introduced into the joint parts during assembly, which resulted in a lower initial stiffness of the fabricated structure and less bearing capacity than that of the cast-in-place structure, but the deformation capacity and ductility of the fabricated structure increased.
In summary, the initial stiffness of the fabricated frame shear wall using RCFSTKs to connect the wall and columns (ZP) was less than that of the cast-in-place structure (XJ). However, the difference in initial stiffness was not great, and decreasing the stiffness or adjusting factors that affect stiffness enable the design requirements to be met. The difference between the bearing capacity of ZP and that of XJ was small, while the ductility of ZP was significantly better than that of XJ.

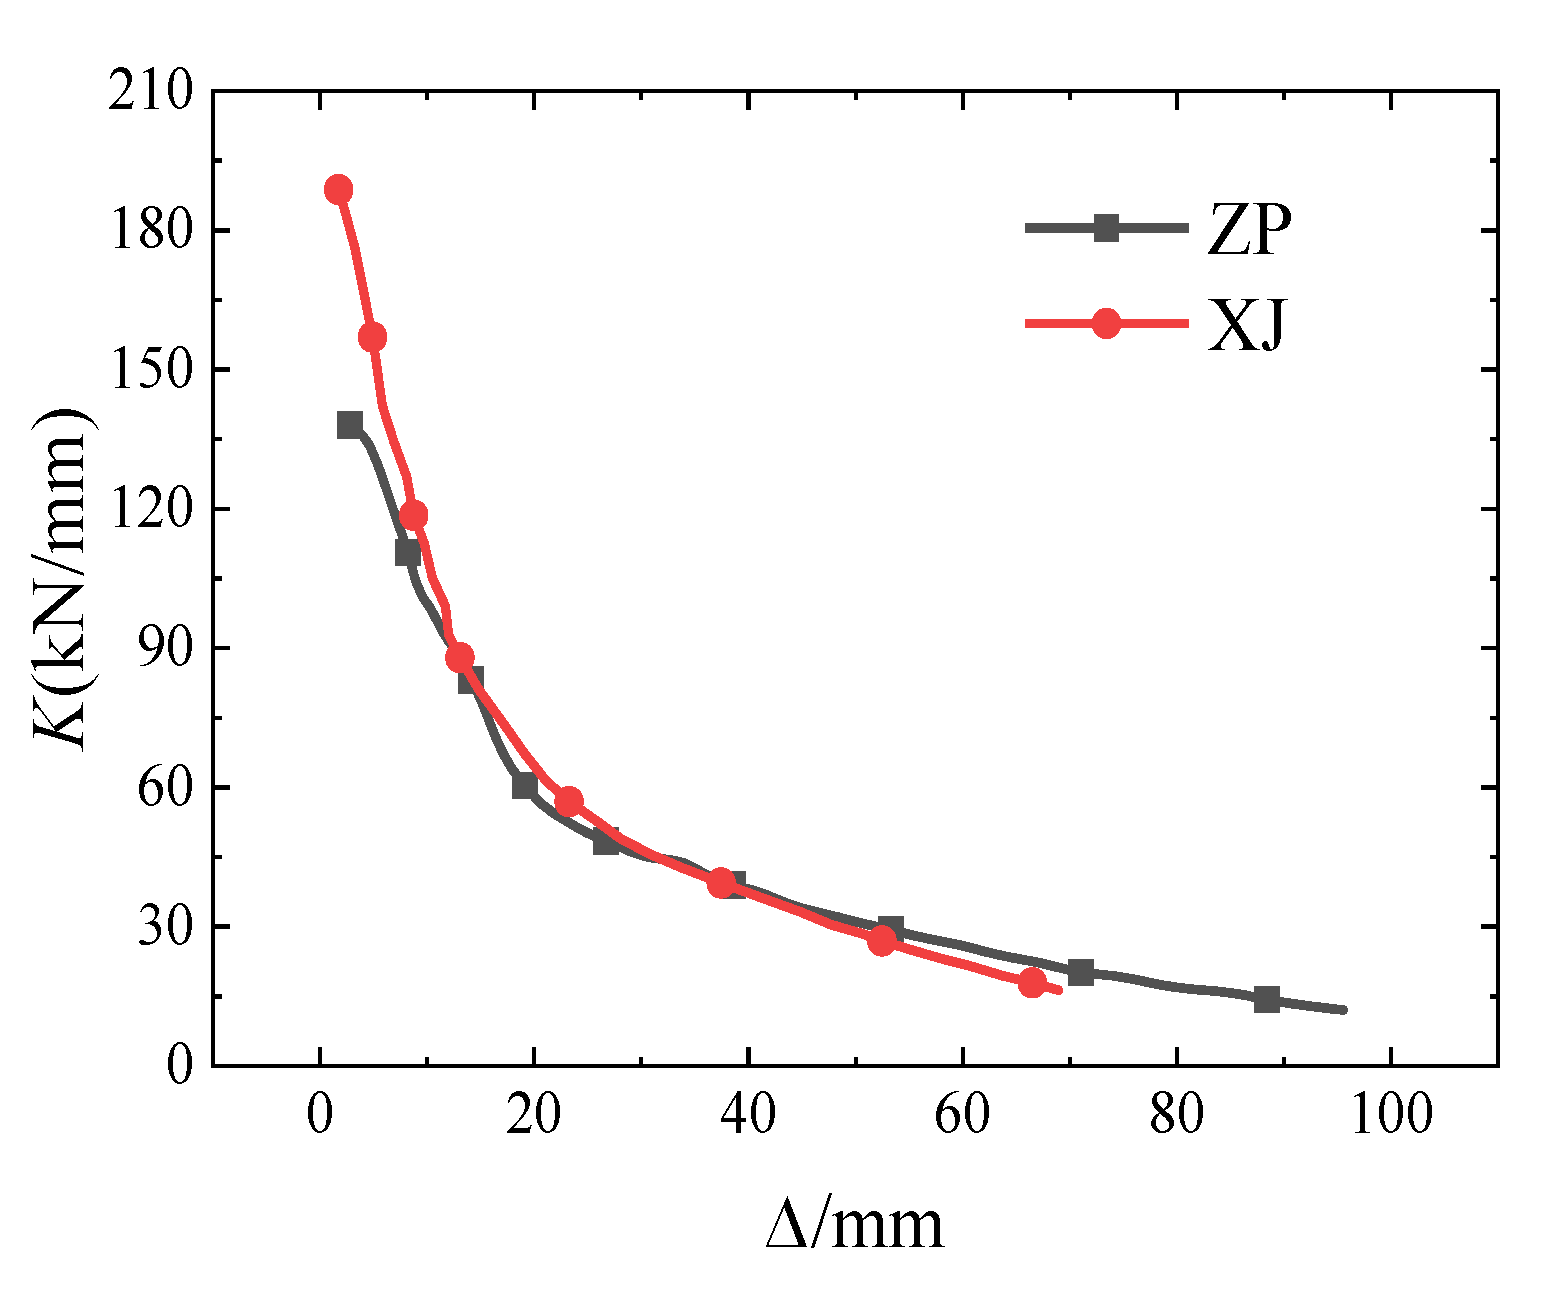
5.3. Stiffness Degradation

The stiffness degradation curves of specimens XJ and ZP are shown in Figure 11. The secant stiffness K (referred to simply as stiffness) indicates the stiffness degradation of the specimens; it is calculated by Equation (1) [18,19]:
K = P i + P i Δ i + Δ i
where Pi and −Pi are the forward and reverse ultimate cyclic loads in cycle i, and ∆i and −∆i are the displacements corresponding to these loads.
Figure 11 shows that at the beginning of loading, the slopes of the stiffness degradation curves of specimens XJ and ZP were steep, indicating that the stiffness of each specimen decreased rapidly. When the displacement was <5 mm, the stiffness of ZP decreased less rapidly than that of XJ. Halfway through loading, the slopes of the stiffness degradation curves of each specimen became less steep, indicating that the stiffness of each specimen decreased slowly; differences between XJ and ZP in stiffness were small. In the later stage of loading, the slopes of the stiffness degradation curves of each specimen further decreased, implying that stiffness degradation changed slowly for both specimens and tended to be the same.
In conclusion, the rate of stiffness degradation of ZP, with the wall attached to the frame columns using RCFSTKs, was slower than that of XJ at the early stage of loading, and the difference in stiffness degradation between XJ and ZP decreased as the load increased and finally converged. The reason for the difference in stiffness degradation at the early stage of loading is similar to that given in the Section Skeleton Curve; the eventual convergence of stiffness degradation is due to the pores in the joint part of ZP being gradually compacted under the horizontal reciprocating load. The difference in elastic modulus between grout and concrete has little effect on the stiffness of the overall structure in the inelastic phase.

5.4. Bearing Capacity Degradation

The bearing capacity degradation coefficients of specimens XJ and ZP are shown in Table 4. The bearing capacity degradation coefficient indicates the degree of continuous degradation in structural bearing capacity caused by plastic deformation of the structure during equal amplitude cyclic loading. It is defined as the ratio of the second to the first cyclic ultimate load [20,21].
It can be seen from Table 4 that in cycles +1∆ and −1∆, the bearing capacity degradation coefficients of specimens ZP and XJ were similar. The reason is that in the first cycle, specimen deformation was primarily elastic deformation. In cycles +2∆ and −2∆, the bearing capacity degradation coefficient of ZP was greater than that of XJ. The reason is that there were gaps between the RCFSTKs, the plain concrete blocks, and the wall and columns. The bearing capacity degradation of ZP is therefore greater than that of XJ.

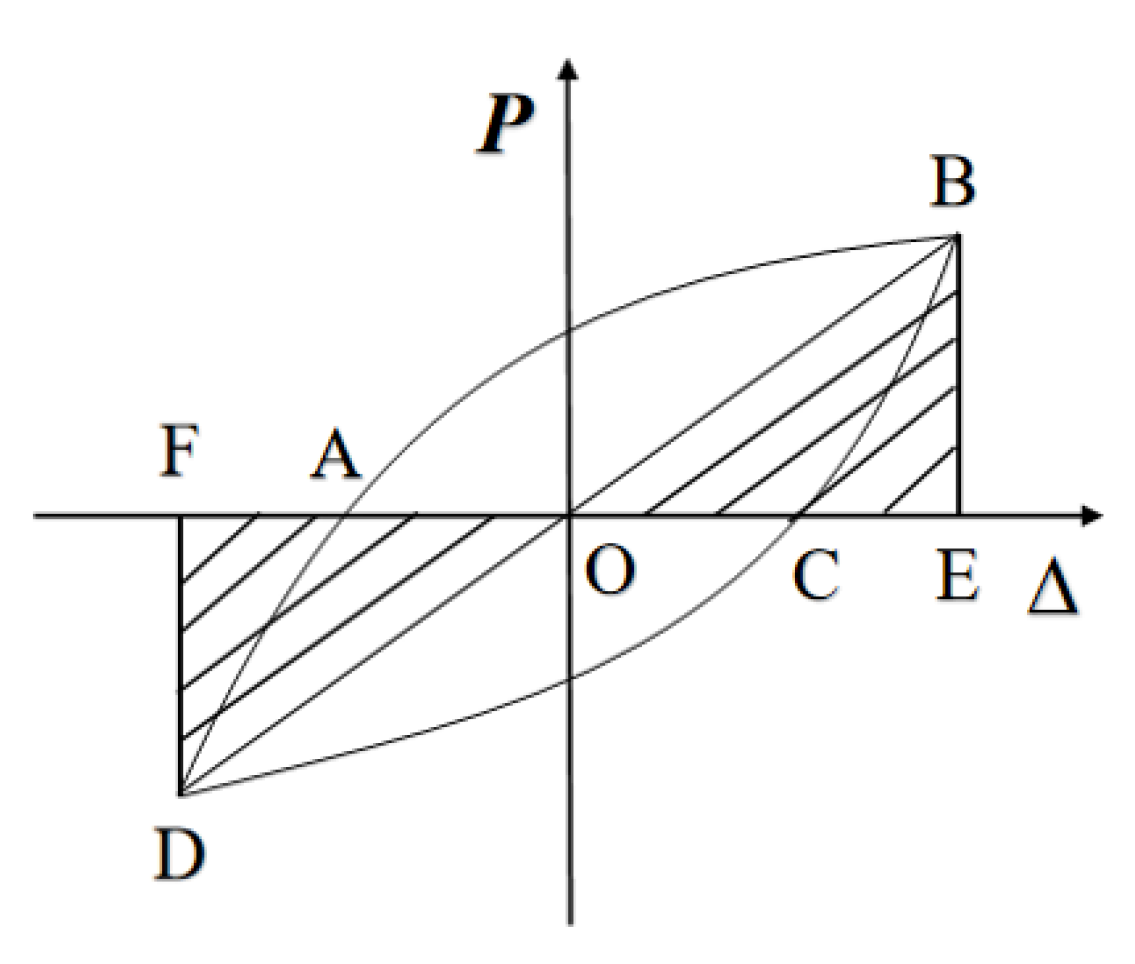
5.5. Energy Dissipation

The energy dissipation coefficients E of specimens XJ and ZP are shown in Table 5. E are calculated for the cycle of the first line in the table. They measured the energy dissipation capacity of the specimens [22,23]. E is the ratio of the total energy (S(ABC + CDA)) to the elastic energy (S(OBE + ODF)) of a hysteresis loop. A greater value of E indicates a greater energy dissipation capacity of the structure. The equation for E is shown as Equation (2), and a graph is shown in Figure 12.
E = S A B C   +   C D A S O B E   +   O D F
Table 5 shows that the energy dissipation capacity of specimen ZP was greater than that of XJ, but the overall difference was not significant with the maximum difference <10%. This is because the RCFSTK bonds in ZP affect structural energy dissipation, but the proportion of RCFSTK bonds in the overall structure is small, so the increase in energy dissipation capacity is insignificant.

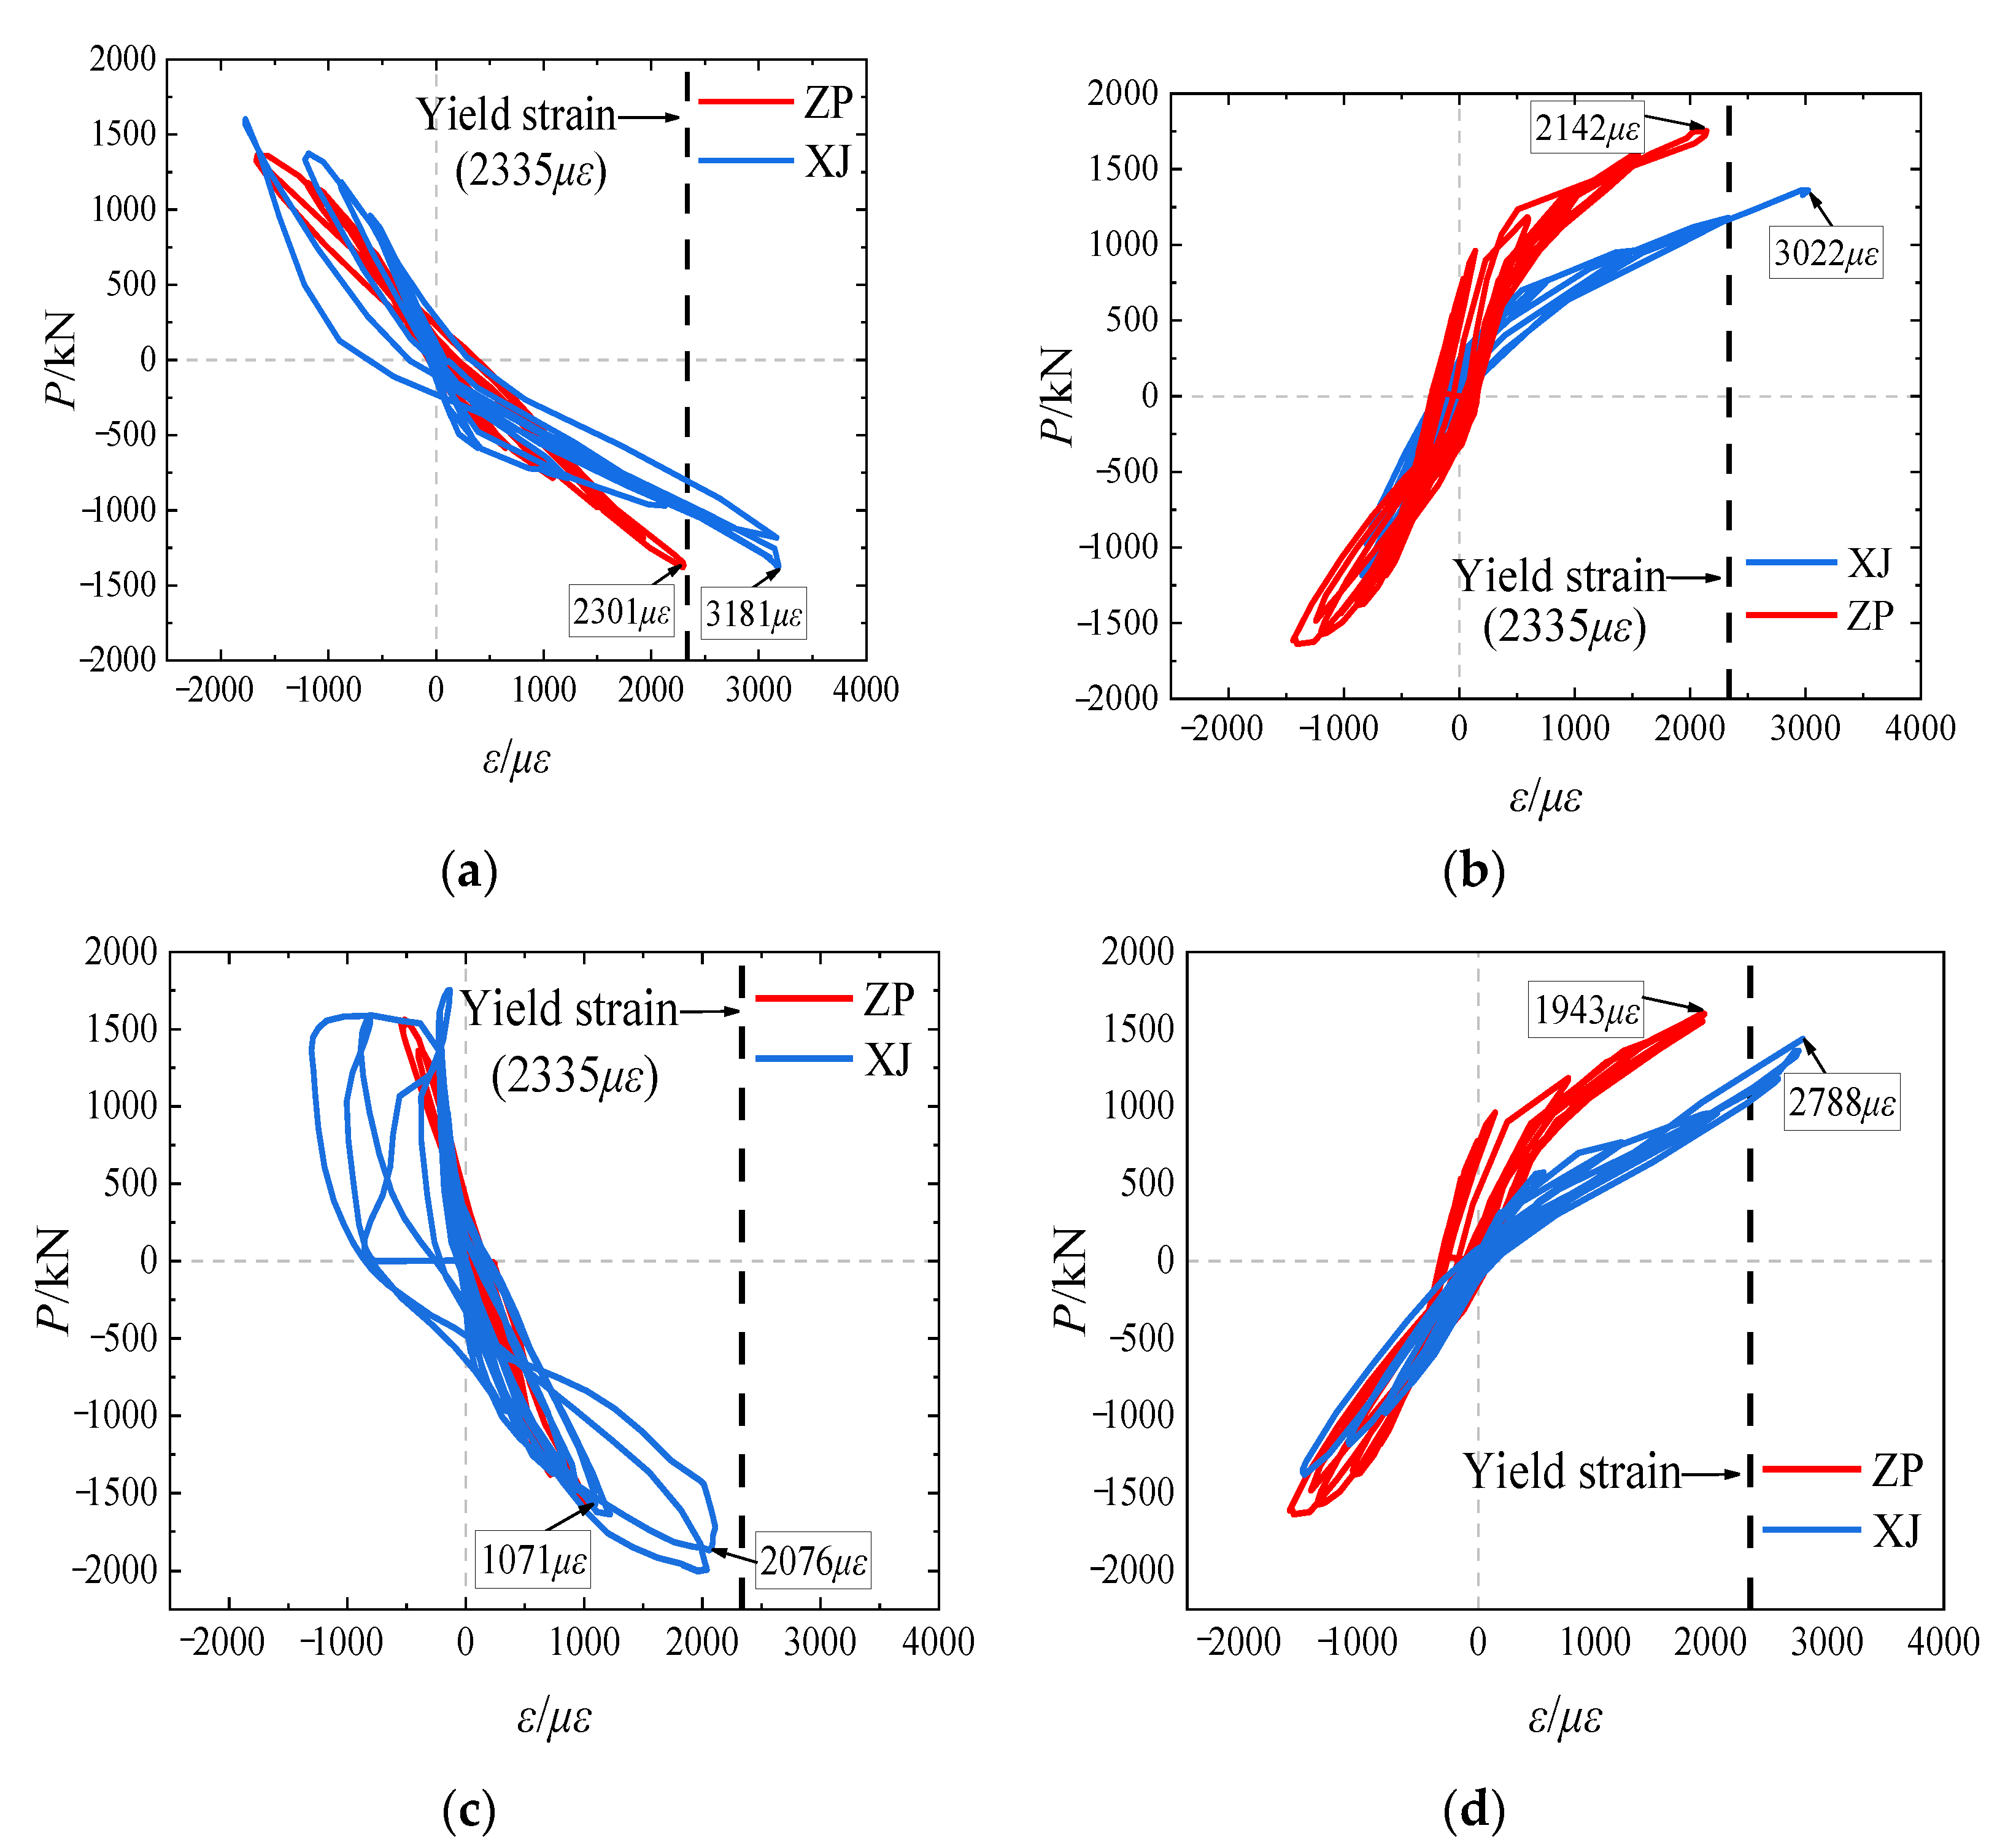
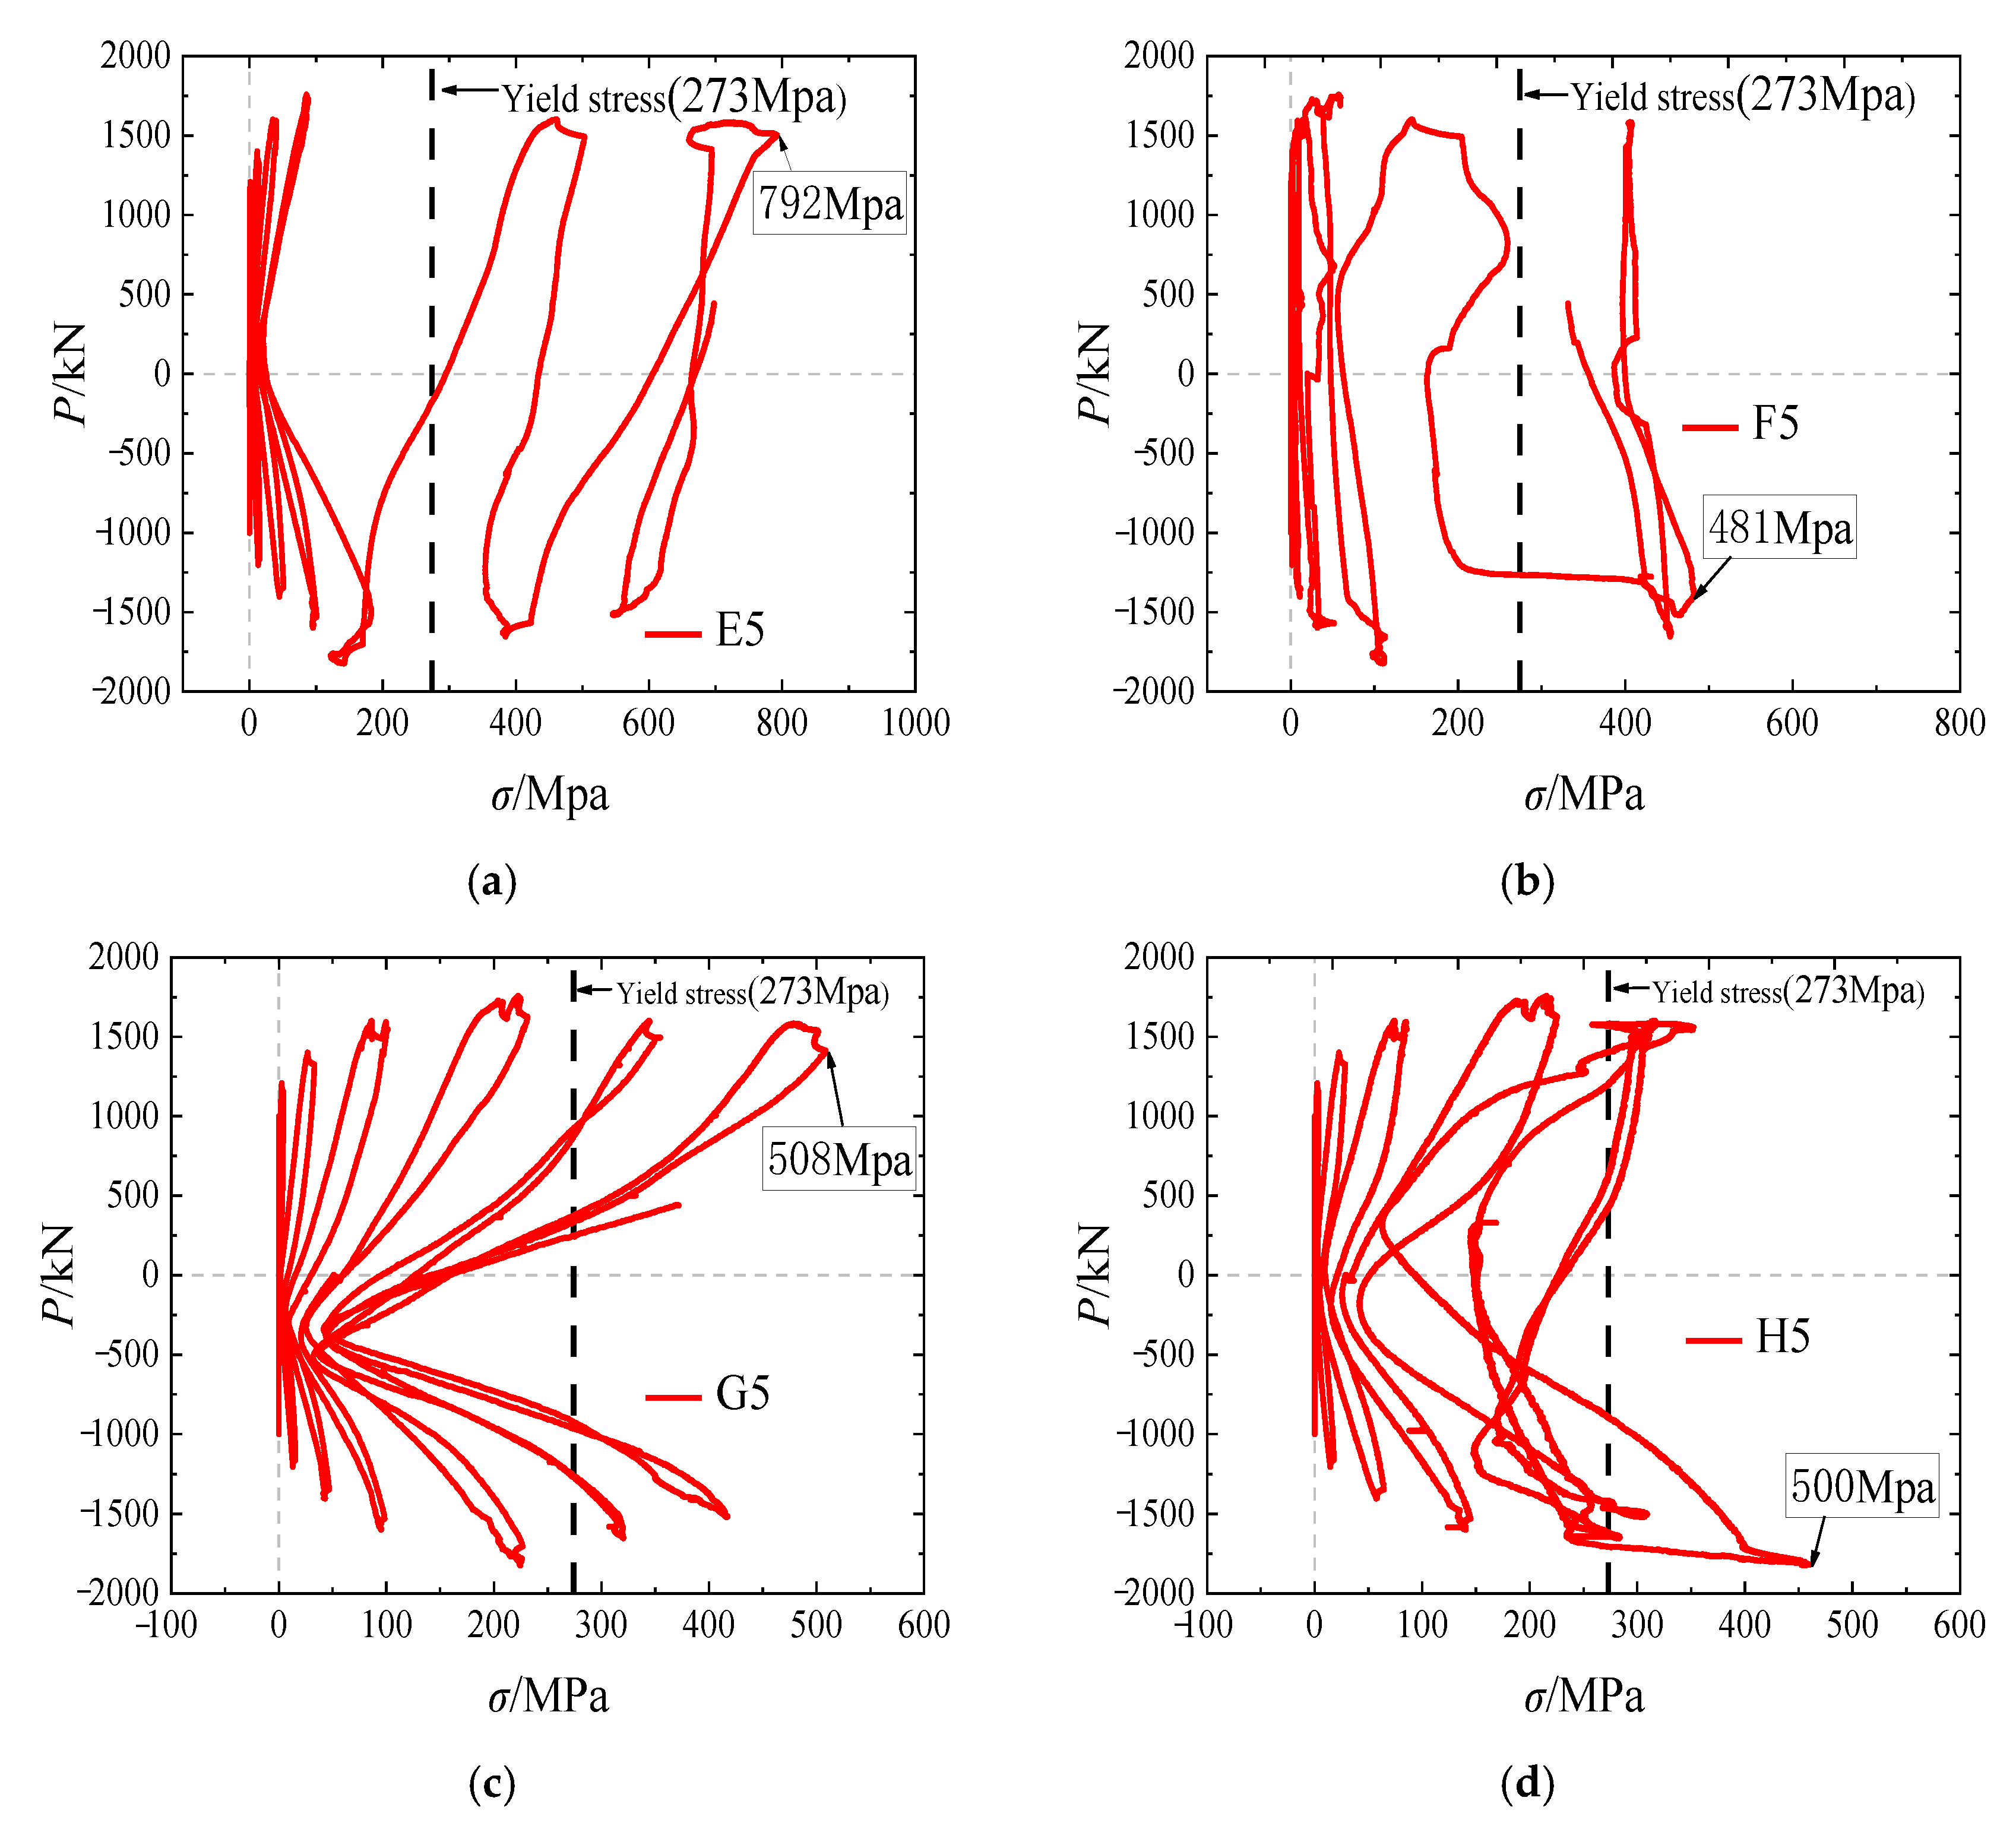
5.6. Steel Strain and Steel Tube Stress

To analyze stress conditions in the frame columns and shear walls during the loading of specimens XJ and ZP, the load–strain curves of the reinforcements of each specimen at S1–S2 (at the foot of the column, shown in Figure 6) and S3–S4 (at the foot of the wall) were obtained (Figure 13).
Figure 13 shows that the reinforcement in both the frame column and the shear wall of specimen XJ yielded or nearly yielded during loading, whereas the reinforcement at the same locations in ZP did not. This indicates that the overall force of the prefabricated frame–shear wall structure using RCFSTKs is uniform, and the force dissipation is better than that of the cast-in-place structure.
To analyze the stress conditions in the interface of the wall and the column for specimen ZP, the load–strain curves of the steel plates in RCFSTKs A1–D1 (upper and lower steel plate ends, shown in Figure 6) and the load–stress curves of the steel plates in E5–H5 (side steel plate centers) were plotted (the stresses were calculated from the strains measured by the strain gauge flowers) (Figure 14 and Figure 15).
Figure 14 shows that the maximum strain values at the top and bottom ends of the steel plates of the RCFSTK were much lower than the yield strain of the steel plates, so the plates did not yield. Figure 15 shows that the maximum stress values at the center of the side steel plates of RCFSTK were greater than the yield stress of the steel plates, so the side steel plates yielded. This means that RCFSTK failure is predominantly shear deformation and is capable of coordinating the shear deformation of the shear wall and columns.

6. Finite Element Parametric Analysis

6.1. Finite Element Modeling Methods and Verification

We set up several finite element models of the test specimen walls using Abaqus, as described in References [24,25,26,27]. The model boundary conditions were consistent with the test arrangement. The attributes of C3D8R were assigned to the concrete solid units, the linear steel units were T3D2, and the steel plate shell units were S4R. Concrete was used in the plastic damage model, steel in the bilinear model, and steel plate in the trilinear model [28]. The material behavior is shown as follows: Figure 16a is the concrete compression behavior; Figure 16b is the concrete tension behavior; Figure 16c is the reinforcement; Figure 16d is the steel plate. The material parameters in the nonlinear principal structure model were defined according to the measured material properties shown in Table 2. The steel bar, anchoring steel plate, and bottom steel plate were embedded in the concrete of the wall and columns using Embedded Region. The end of the steel tube and the bottom steel plate of the embedded elements were connected by binding (Tie). Friction contact with a friction coefficient of 0.6 was set for the interfaces between the steel tube and the concrete, between the concrete in the steel tube and the embedded elements, and between the plain concrete block and the steel tube.
The finite element simulation and physical test load–displacement hysteresis curves and skeleton curves are shown in Figure 17 and Figure 18, respectively, for comparison. The characteristic index values of the test and simulated load–displacement skeleton curves are shown in Table 6. The error of each index was generally ≤10%, and the maximum was <14.6%. These results show that the model is accurate and can be used for subsequent studies.

6.2. Necessity of Both RCFSTKs and Plain Concrete Blocks

Although using RCFSTKs and plain concrete blocks to connect the wall and columns can reduce the wet work, making the connection is not straightforward. To determine whether the RCFSTKs and plain concrete blocks must be installed together, as in the physical test, or whether, to simplify construction, the RCFSTKs could be installed without concrete blocks or concrete blocks could be installed without RCFSTKs, we set up an Abaqus model of ZP and three models with equivalent dimensions to simulate the effects of modifying the shear wall–column interface on skeleton curves and characteristic indexes. Details of the models are shown in Table 7.
The load–displacement skeleton curves of the four models are shown in Figure 19, and the characteristic index values of each model are shown in Table 8.
Figure 19 and Table 8 show that, in absolute terms, the model load–displacement skeleton curve of JJWK (without plain concrete blocks between RCFSTKs) was significantly lower than that of ZP. The yield load, ultimate load, failure load, and initial stiffness of JJWK were 26.7%, 21.5%, 21.5%, and 26.1% less than those of ZP. The load–displacement skeleton curve of QZWK (without RCFSTKs and without gaps between the wall and columns) was lower than that of ZP, and the yield load, ultimate load, failure load, and initial stiffness were all significantly less than those of ZP. The QZWK curve was higher than that of specimen QZYK (with gaps between the wall and column) but lower than the ZP curve, and its yield load, ultimate load, failure load, and initial stiffness were 35.8%, 32.3%, 32.3%, and 52.2% less than those of curve ZP. These results indicate that it is essential that the wall–column connection includes both RCFSTKs and plain concrete blocks; if not, the bearing capacity and initial stiffness of the wall and column connection will be significantly insufficient.
The corresponding plastic strain clouds of each model were obtained for the breaking points of the models (Figure 20) to determine the causes of the preceding results.
Figure 20 shows that the concrete damage mechanisms of models JJWK and ZP were similar. Both show the damage to the shear wall was distributed between the RCFSTKs, which indicates that the RCFSTKs coordinate the deformation between walls and columns. Because there were no plain concrete blocks between RCFSTKs in JJWK, the initial stiffness and bearing capacity were less than those of ZP. The damaged area of QZWK was concentrated at the foot of the column and showed prominent bending damage; the shear wall was less affected by the forces, so its load–displacement skeleton curve was higher than that of QZYK. In QZYK, there was a gap between the wall and the column, so the loaded beam and shear wall both show the damage caused by the action of axial force (i.e., the damaged area was distributed vertically), and its load–displacement skeleton curve was the lowest.

6.3. Analysis of Influencing Factors

We set up 20 models to study the effects of various factors on the cyclic performance of the shear wall using RCFSTKs. Parameters that were varied in the models were the number of RCFSTKs n, RCFSTK unit height h, RCFSTK steel tube wall thickness t, the axial compression ratio of ZP ζ, the reinforcing steel strength Q, and the concrete grade G. The values of the characteristic indexes of the load–displacement skeleton curves for each model are shown in Table 9. Only one parameter was varied in each model and the default parameter values were the settings for model ZP.

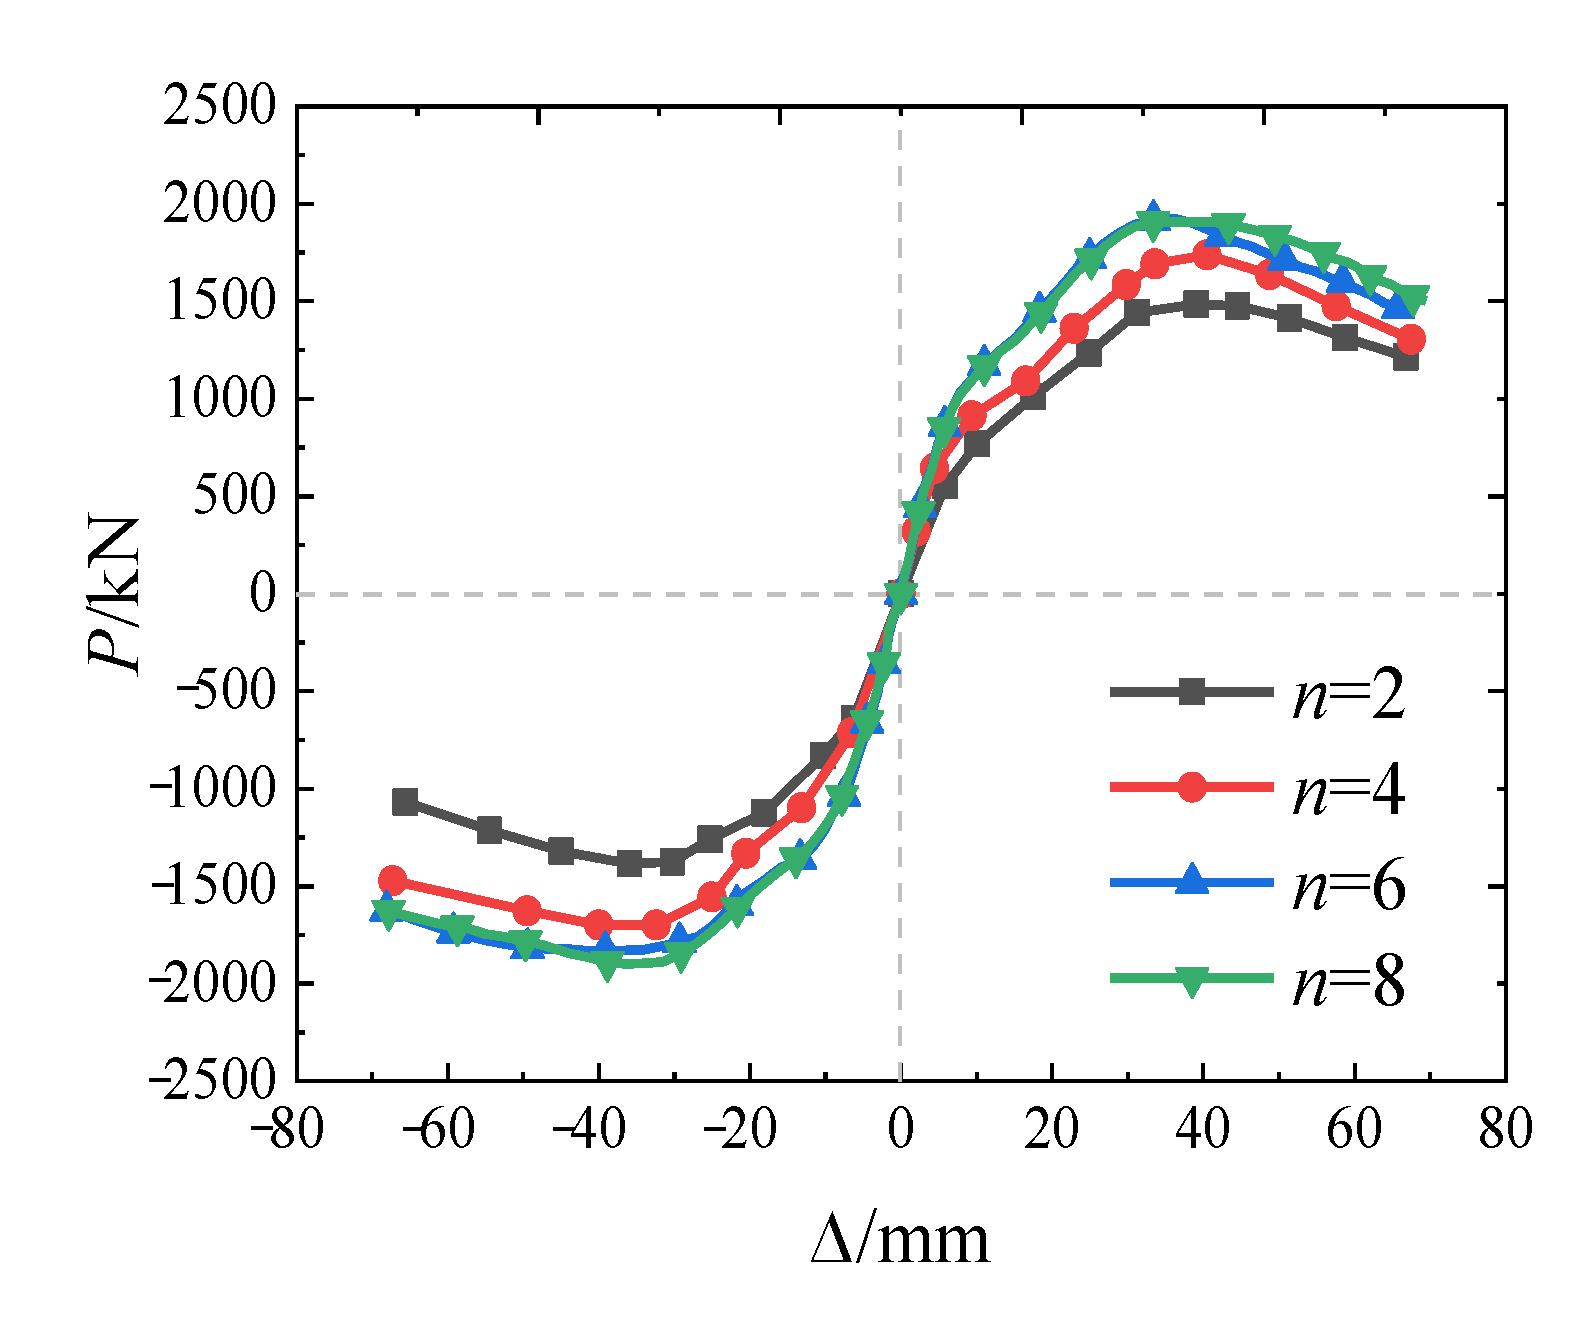
6.3.1. Influence of the Number of RCFSTKs

Figure 21 shows the load–displacement skeleton curves for each model with vertical and cyclic loading when the number of RCFSTKs (n) was 2, 4, 6, or 8.
Figure 21 and Table 9 show that bearing capacity increased as the number of RCFSTKs increased. When the number of RCFSTKs increased from 2 to 6, the values of all characteristic indexes of the specimen increased; the yield load, ultimate load, and failure load of the models increased by 15.4%, 26.9%, and 26.9%; the initial stiffness increased by 68.4%; and the ductility ratio and energy dissipation coefficient increased by 11.1% and 48.7%. When the number of RCFSTKs increased from 6 to 8, the energy dissipation coefficients increased by 15.5%, and the other characteristic index values increased by <5%. This is explained as follows. When the number of RCFSTKs is small, they cannot coordinate the deformation between walls and columns. The values of each characteristic index therefore increase as the number of RCFSTKs increases. When the number of RCFSTKs is sufficient to coordinate the deformation between walls and columns, further increasing the number becomes equivalent to increasing the steel content inside the structure that resists structural stress, and only the energy dissipation capacity and ductility of the structure increase.
In summary, an increase in the number of RCFSTKs significantly influenced the cyclic performance of the structure. An increase within a particular range will enhance various cyclic performance indexes of the structure. However, beyond this range, continuing to increase the number of RCFSTKs will only increase the ductility and energy dissipation capacity of the structure.

6.3.2. Influence of RCFSTK Unit Height

Figure 22 shows the load–displacement skeleton curves for the models in which the unit height of the RCFSTKs was varied (h = 15, 20, and 25 cm) under vertical load and cyclic loads with other parameters were unchanged.
Figure 22 and Table 9 show that there were no significant differences in the load–displacement skeleton curves of the models. When the unit height of the RCFSTK was increased from 15 to 25 cm, the yield load, ultimate load, and failure load of the specimen increased by 13.1%, 7.3%, and 7.3%, respectively. Since the RCFSTK deformation was primarily shear deformation, increasing its unit height improved its resistance to shear deformation, so the overall structural load carrying capacity was enhanced. The initial stiffness, ductility ratio, and energy dissipation coefficient of the models all increased and then decreased as the unit height increased. However, the overall change was small. When the RCFSTK unit height increased from 15 to 20 cm, the ductility ratio increased by 6.7%, but the other index values increased by <3%. When the RCFSTK unit height increased from 20 to 25 cm, the ductility ratio decreased by 12.5%, and the energy dissipation coefficient decreased by 7.3%; all other index values decreased by <4%. The main reason for this is that an increase in RCFSTK unit height is effectively an increase in steel content inside the structure, so the index values increase. However, when the unit height exceeds a particular value, deformation and damage of the steel plate are reduced. The damage is transferred to the concrete, so the index values decrease. In summary, the change in RCFSTK unit height has little effect on the cyclic performance of the structure in general; as the section height increases, the bearing capacity of the structure improves, and the ductility ratio and energy dissipation capacity first increase and then decrease; the initial stiffness is almost unchanged.

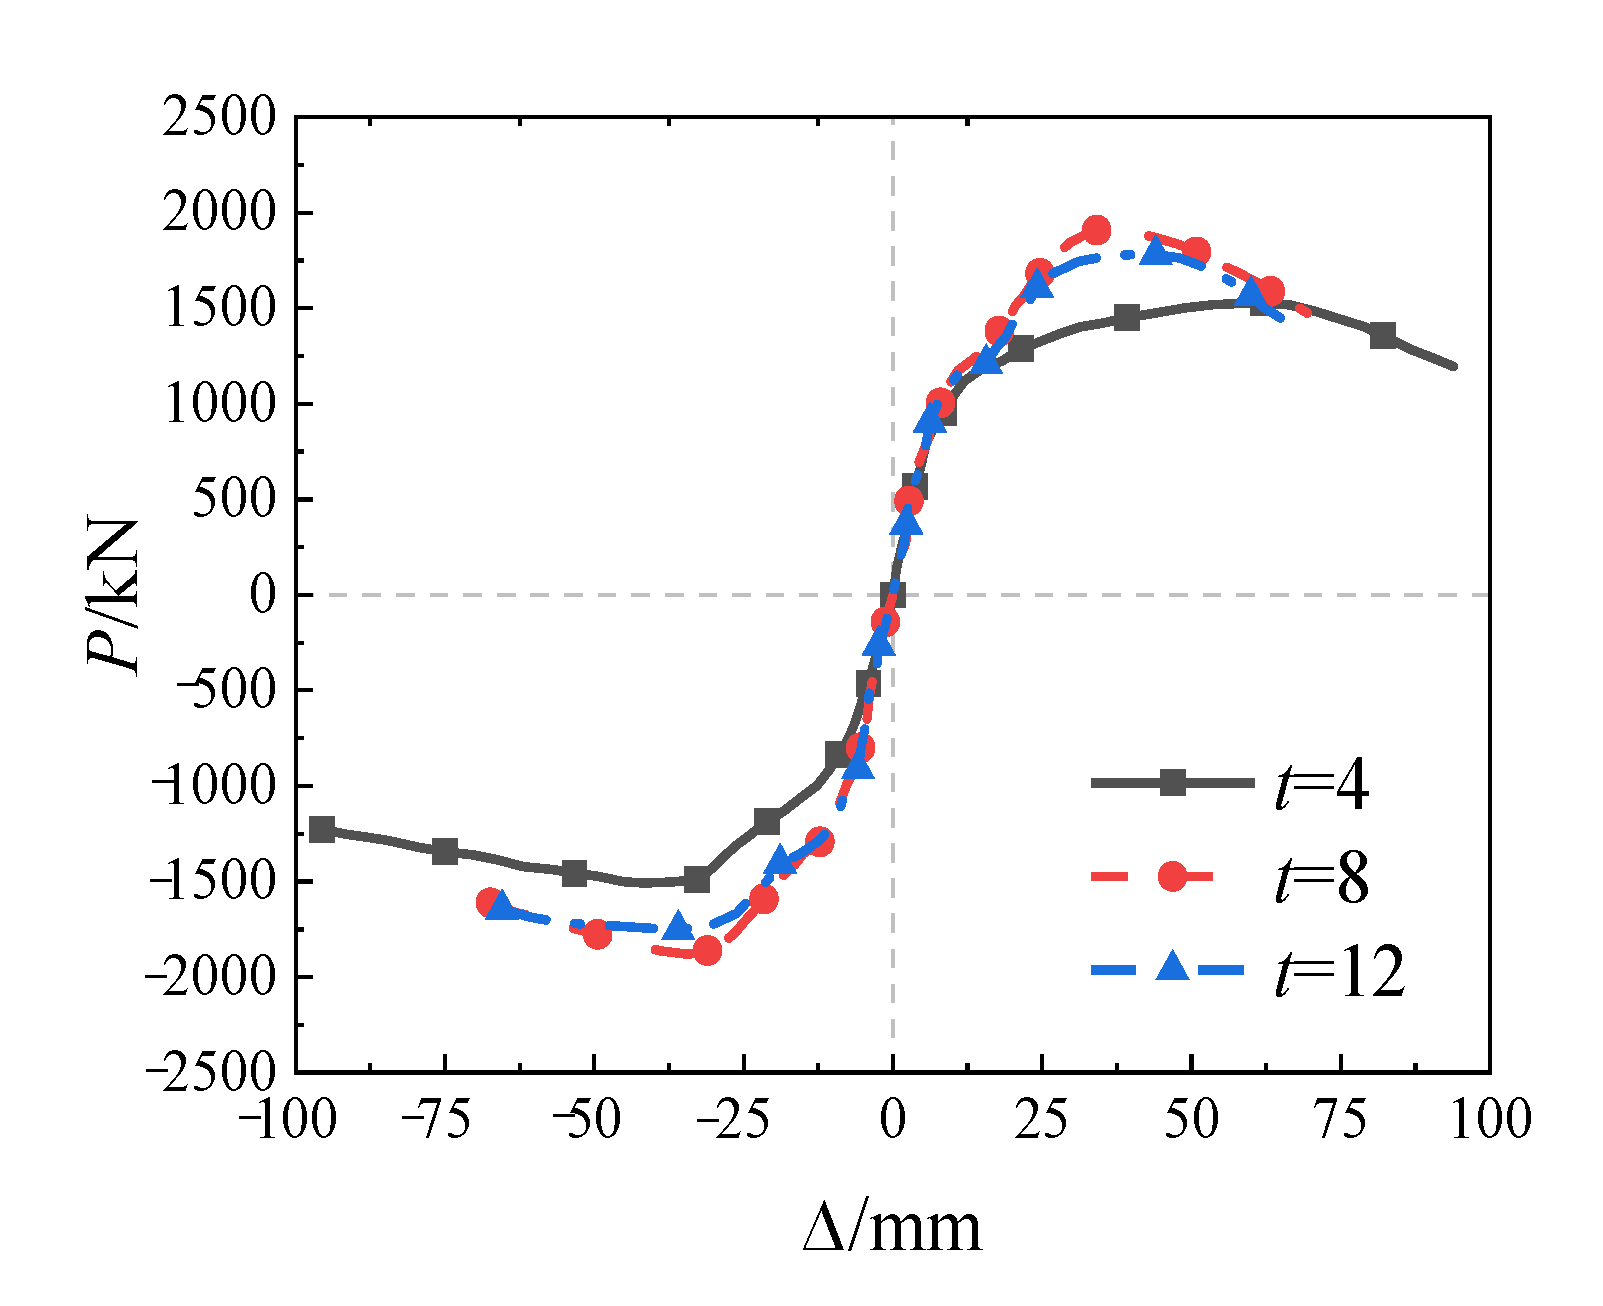
6.3.3. Influence of Wall Thickness of RCFSTKs

Figure 23 shows the load–displacement skeleton curves of the models in which the RCFSTK steel tube wall thickness t was 4, 8, and 12 mm under vertical load and cyclic loads with all other parameters unchanged.
Figure 23 and Table 9 show that the wall thickness of the steel tube has an obvious impact on the load–displacement skeleton curve. The yield load, ultimate load, and failure load of the models first increased and then decreased, and when the wall thickness of the steel tube increased from 4 to 8 and then to 12 mm, the values of the indicators first increased respectively by 11.0%, 24.4%, and 24.4% and then decreased by 13.6%, 7.1%, and 7.1%. The initial stiffness of the models consistently increased; when the wall thickness of the steel tube increased from 4 to 12 mm, initial stiffness increased by 15.2%. The ductility ratios of the models and the energy dissipation coefficients first decreased and then increased. When the wall thickness of the steel tube increased from 4 to 8 and then to 12 mm, these indicators first decreased respectively by 15.8% and 50% and then increased by 18.8% and 25.4%. The principal reason is that the RCFSTKs undergo shear deformation, and increasing the wall thickness of the steel plate improves the capability of the RCFSTK to resist shear deformation. However, as the wall thickness increases, the damage is transferred to the concrete, so the index value has a turning point.
In summary, these three models show that the change in steel tube wall thickness has a pronounced effect on the seismic performance of the structure. As the steel tube wall thickness increases, the bearing capacity of the structure first increases and then decreases, while the ductility and energy dissipation capacity first decrease and then increase, and the initial stiffness always increases.

6.3.4. Influence of Wall Thickness of RCFSTKs

Figure 24 shows the load–displacement skeleton curves of each model under vertical and cyclic loads with axial compression ratios (ζ) 0.2, 0.4, and 0.5, and other parameters unchanged.
Figure 24 and Table 9 show that the load–displacement skeleton curves of the models differed significantly with different axial pressure ratios. When the axial pressure ratio increased from 0.2 to 0.5, the yield load, ultimate load, and failure load of the models increased by 24.6%, 16.8%, and 16.8%, respectively, while the ductility ratio and energy dissipation factor decreased by 22.2% and 20.6%, respectively, with no change in initial stiffness. The reasons for these changes are similar to those for the changes in the cast-in-place structure caused by different axial pressure ratios. Change in axial pressure ratio has a pronounced effect on the cyclic performance of the structure. As the axial pressure ratio increases, the bearing capacity of the structure increases, while the ductility and energy dissipation capacity decrease, and the initial stiffness remains unchanged.

6.3.5. Influence of RCFSTK Steel Strength

Figure 25 shows the load–displacement skeleton curves of each model with RCFSTK steel strengths (Q) of Q235, Q390, and Q420 under vertical load and cyclic load and all other parameters remained unchanged.
Figure 25 and Table 9 show that the load–displacement skeleton curves of the specimens differed slightly. When the RCFSTK steel strength increased from Q235 to Q420, the yield load, ultimate load, failure load, and initial stiffness of the models increased by 12.1%, 8.4%, 8.4%, and 4.1%, respectively. The displacement ductility ratio and energy dissipation coefficients decreased by 12.5% and 9.0%. The principal reason for these changes is that the RCFSTKs are mainly subjected to shear deformation and increasing steel strength can increase RCFSTK resistance to shear stress and thus decrease deformation. Overall, the change in the steel strength of the RCFSTKs has little effect on the cyclic performance of the structure. As steel strength increases, bearing capacity and initial stiffness of the structure increase, while the ductility ratio and energy dissipation capacity decrease.

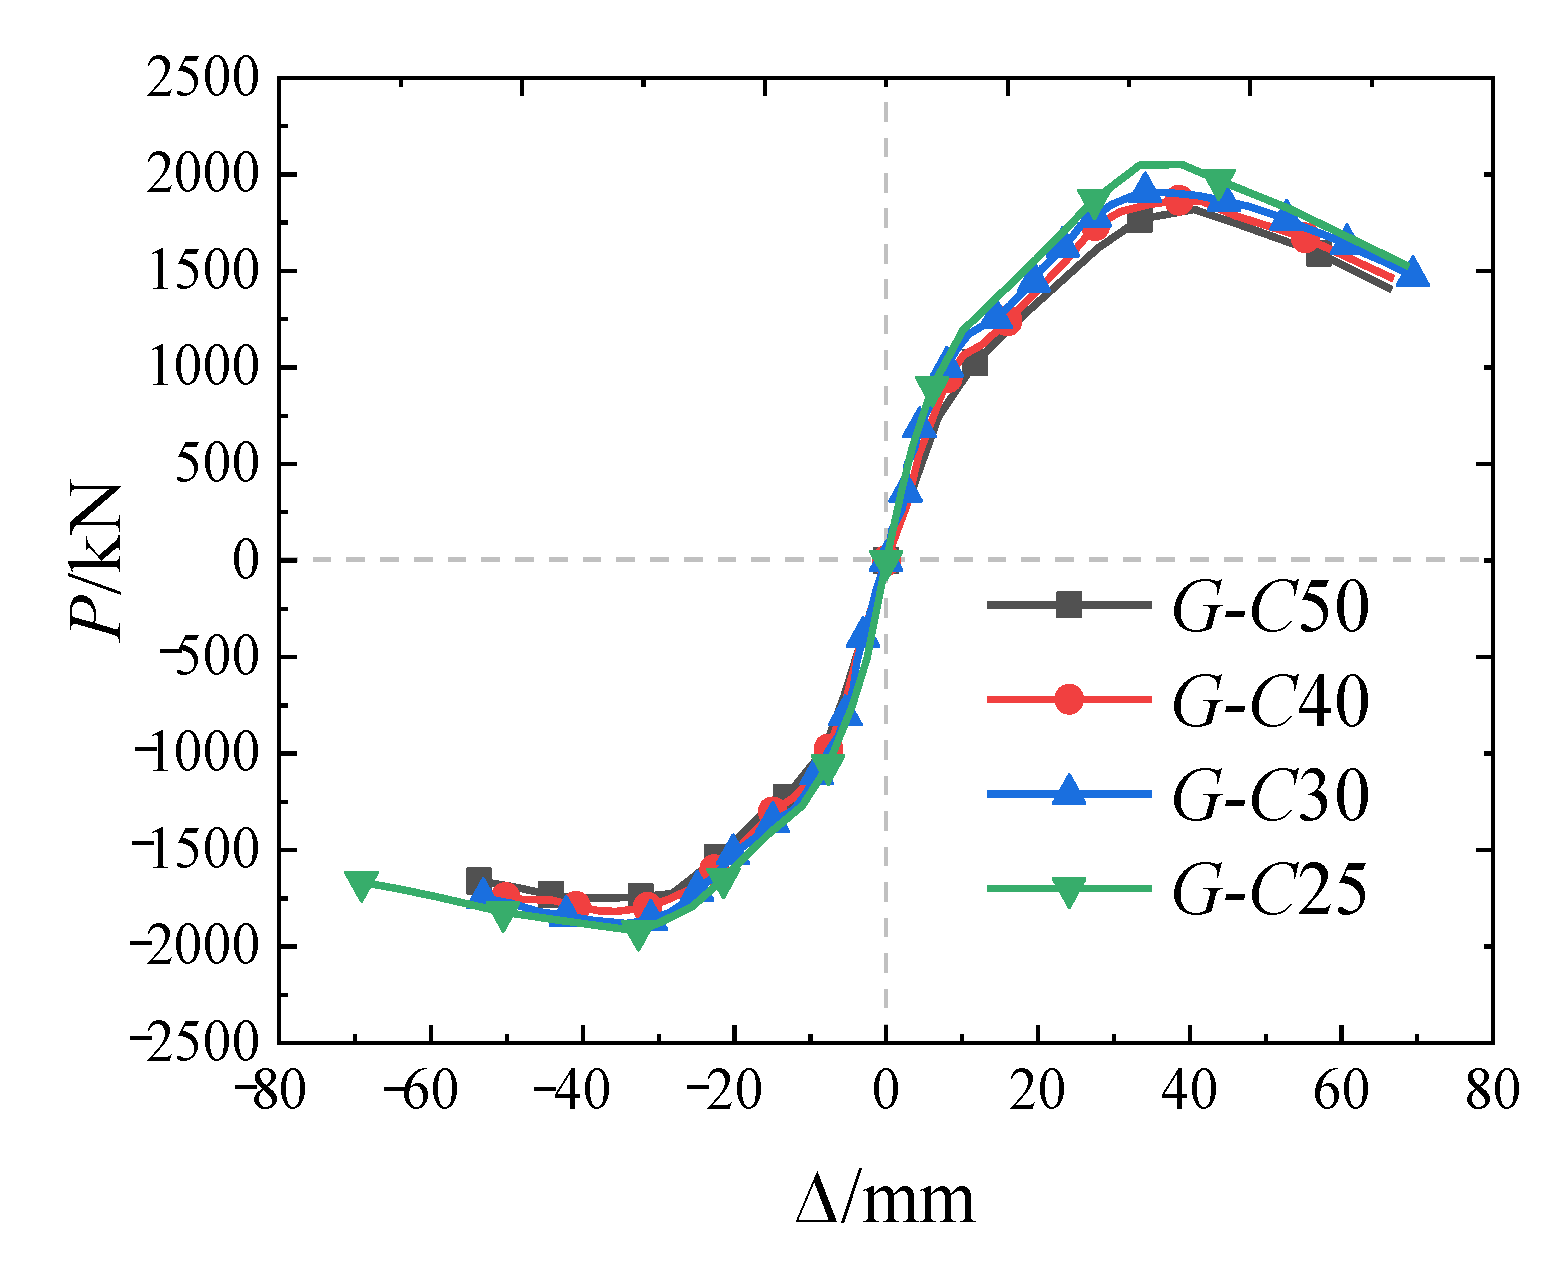
6.3.6. Influence of RCFSTK Concrete Grade

Figure 26 shows the load–displacement skeleton curves of each model with concrete grades in RCFSTK (G) of C25, C30, C40, and C50 under vertical and cyclic loads and other parameters remained unaltered.
Figure 26 and Table 9 show that the load–displacement skeleton curves of the models differed slightly. When the strength of the concrete inside the steel tube increased from C25 to C50, the yield load, ultimate load, failure load, and initial stiffness of the specimen increased by 9.6%, 8.4%, 8.4%, and 12.3%, respectively, and the displacement ductility ratio and energy dissipation coefficient decreased by 21.4% and 19.7%, respectively. The reason for these changes is similar to the reason for changes in RCFSTK steel strength. The change in RCFSTK concrete grade generally had little effect on the cyclic performance of the models. As the concrete grade of the shear wall and columns increases, the bearing capacity and the initial stiffness of the structure increase, while the ductility ratio and energy dissipation capacity decrease.

7. Conclusions

To find a method of connecting a shear wall and columns that can both reduce the amount of wet work required and maintain adequate stiffness, we propose connecting the shear wall to the vertical frame using rectangular concrete-filled steel tube keys (RCFSTKs). Static tests and finite element models were used to study their cyclic performance. The feasibility of the new method was analyzed. In addition, the influence of different parameters on the cyclic performance of the assembled structure was identified. The following conclusions can be obtained.
(1)
In terms of transferring force, RCFSTK produces a concentrated force perpendicular to the frame column when transferring the internal force between the column and the wall. This force changes the locations of the maximum bending moments of the column and the wall, making the bending moments more uniform in the vertical direction and improving the mechanical properties of the wall and the column.
(2)
The RCFSTKs yielded in the center of their lateral steel plates, while the ends of the steel plates on the upper and lower surfaces did not yield. This indicates that the RCFSTKs are predominantly subjected to shear deformation and are important in coordinating shear deformation of the walls and columns.
(3)
The prefabricated frame–shear wall structure using RCFSTKs, compared with the cast-in-place structure, has a fuller hysteresis curve, greater total energy consumption, better ductility, slightly higher energy consumption capacity, and slightly lower stiffness degradation and bearing capacity. The difference in bearing capacities was slight, so practical use of the proposed prefabricated structure is feasible.
(4)
Removing the RCFSTKs or the plain concrete blocks between them, or both, will significantly decrease the bearing capacity and initial stiffness of the prefabricated column–wall unit by 21.5%–52.2%. Thus, both RCFSTs and the concrete blocks between them are necessary. How to simplify the construction merits further investigation.
(5)
The cyclic performance of the prefabricated structure is influenced largely by the number of RCFSTKs, steel tube wall thickness, and axial compression ratio while to a lesser extent by the key height, steel strength, and concrete grade of the RCFSTKs.

Author Contributions

Conceptualization, M.L. and Z.Z.; methodology, Z.Z.; software, Q.W.; validation and formal analysis, M.L. and Z.Z.; data curation, S.Y. and L.Z.; writing—original draft preparation, Z.Z.; writing—review and editing, Q.W. All authors have read and agreed to the published version of the manuscript.

Funding

This research was funded by the National Natural Science Foundations of China (Grant No. 51978422), the General Project of Liaoning Provincial Department of Education (Grant No. LJKZ0561).

Institutional Review Board Statement

Not applicable.

Informed Consent Statement

Not applicable.

Data Availability Statement

Not applicable.

Conflicts of Interest

The author declares no potential conflicts of interest regarding the publication of this article.

References

  1. Ma, J.W. Study on Seismic Behavior of the New Full Precast Concrete Shear-Wall Frame Strucures. Master’s Thesis, Southeast University, Nanjing, China, 2018. [Google Scholar]
  2. Ma, J.W.; Mo, C.; Jiang, S.T.; Yin, W.Y.; Jin, R.C.; Zheng, Q. Study on Construction Method and Experimental Verification of Fully-precast RC Frame-shear Wall Structures. Constr. Technol. 2017, 46, 30–34, 52. [Google Scholar] [CrossRef]
  3. Ma, J.-W.; Pan, J.-L.; Yin, W.-Y.; Liu, S.-C.; Mo, C. Experimental study on seismic performance of full precast shear wall-frame structures with reinforcement spliced by grout-filled sleeves. Eng. Mech. 2017, 34, 178–187. [Google Scholar] [CrossRef]
  4. Mo, C. Study on Seismic Performance of Fully Precast Frame-Shear Wall Structure. Master’s Thesis, Southeast University, Nanjing, China, 2017. [Google Scholar]
  5. Ma, J.; Pan, J.; Yin, W.; Liu, S.; Jiang, S. Experimental study on seismic behavior of wholly precast RC frame-shear wall structure. J. Build. Struct. 2017, 38, 12–22. [Google Scholar] [CrossRef]
  6. Zhao, W.; Tong, J.; Yuan, S.; Guo, Y. Research on the connection method of column-wall member in precast frame-shear wall structure. J. Shenyang Jianzhu Univ. 2015, 31, 408–417. [Google Scholar]
  7. Bournas, D.; Negro, P.; Molina, F.; Viaccoz, B.; Magonette, G. Pseudodynamic Testing of the SAFECAST 3-Storey Precast Concrete Building; JRC Technical Report EUR; Institute for the Protection and Security of the Citizen, Joint Research Centre: Ispra, Italy, 2012. [Google Scholar]
  8. Buddika, H.S.; Wijeyewickrema, A.C. Post-tensioned hybrid precast wall-frame buildings for seismic regions. J. Struct. Eng. 2014, 142, 04016021. [Google Scholar] [CrossRef]
  9. Tong, J.X. Research of the Connection Methods between Frame Beam Column and Shear Wall Based on the Shear Test. Master’s Thesis, Shenyang Jianzhu University, Shenyang, China, 2015. [Google Scholar]
  10. Gao, Q. Structure Forms and Assembly Technologies on Precast Frame-Shear Wall Structure. Master’s Thesis, Shenyang Jianzhu University, Shenyang, China, 2014. [Google Scholar]
  11. Gao, Q.; Zhao, W.J. Experimental study on performance of grouted sleeve connection with surfacing forming under high stress repeated tension-compression load. J. Build. Struct. 2022, 43, 220–227. [Google Scholar] [CrossRef]
  12. Gao, Q.; Zhao, W.J. Experimental study on performance of grouted sleeve connection with surfacing forming under uniaxial tensile load. J. Build. Struct. 2022, 43, 208–219. [Google Scholar] [CrossRef]
  13. Ioani, A.M.; Tripa, E. Structural behavior of an innovative all-precast concrete dual system for residential buildings. PCI J. 2012, 57, 110–123. [Google Scholar] [CrossRef]
  14. Gao, J. Study on Performance of Concrete Filled Steel Tubular Composite Keyway Connection in Fabricated Frame-Shear Structures. Master’s Thesis, Shenyang Jianzhu University, Shenyang, China, 2019. [Google Scholar]
  15. Zhao, Y.; Wang, E.C.; Kong, D.Z.; Kong, D.P.; Li, Y.C. Experimental Research on Seismic Performance of New Low-rise Precast Concrete Shear Walls. China Concr. Cem. Prod. 2021, 2, 69–73. [Google Scholar] [CrossRef]
  16. Chen, Q.J.; Liang, J.J.; Cai, J.; Li, Z.; He, A.; Zuo, Z.L. Investigation on seismic behavior and influencing parameters of steel-jacket strengthened columns with recycled aggregate concrete. Eng. Mech. 2019, 36, 206–217, 256. [Google Scholar] [CrossRef]
  17. JGJ 101-1996; Specificating of Testing Methods for Earthquake Resistant Building. Architecture & Building Press: Beijing, China, 1996.
  18. Sun, X. Experimental research on seismic behavior of single span concrete-filled steel tubular frame with reinforced concrete beams. J. Build. Struct. 2009, 30, 142–146, 156. [Google Scholar] [CrossRef]
  19. Zheng, S.-S.; Liu, W.; Qin, Q.; Zhang, C.-C.; Dong, L.-G.; Li, Q.-Q. Experimental research on seismic behavior of rc frame beams under different loading protocols. Eng. Mech. 2018, 35, 109–117. [Google Scholar] [CrossRef]
  20. Li, Q.; Li, Q. Seismic performance study of new shaped plate applied in self-centering steel frame. J. Suzhou Univ. Sci. Technol. 2017, 30, 1–6. [Google Scholar] [CrossRef]
  21. Rong, X.; Chen, L.; Zhang, J.-X. Experimental Study on Seismic Performance of Bottom-Flange-Bolted and Top-Flange-Welded Prefabricated CFST Column to Steel Beam Joints. J. Northeastern Univ. 2020, 41, 1348–1355. [Google Scholar] [CrossRef]
  22. Weichang, L.; Mingwei, L.; Zhijian, Y.; Hongping, Y. Research on mechanical properties of square steel tube column-I-beam joints connected by T-section steel under reciprocating load. Ind. Arch. 2018, 48, 135–141. [Google Scholar] [CrossRef]
  23. Lu, Y.; Liu, L.; Cui, Q.; Cao, C.; Yang, Y. Research on the influence of shear reinforcement on the seismic performance of pre-compressed prefabricated joints. Ind. Arch. 2022, 52, 105–111. [Google Scholar] [CrossRef]
  24. Wei, H.; Li, Q. Experimental study on seismic behavior of prefabricated RC shear walls with horizontal joints welded by steel plates. J. Build. Struct. 2020, 41, 77–87. [Google Scholar] [CrossRef]
  25. Wang, W.; Chen, B.; Ou, Y.; Jiang, X. Experimental study on seismic performance of steel truss and concrete composite shear wall. J. Build. Struct. 2021, 42 (Suppl. S1), 330–340. [Google Scholar] [CrossRef]
  26. Saleh, H.M.; Salman, A.A.; Faheim, A.A.; El-Sayed, A.M. Sustainable composite of improved lightweight concrete from cement kiln dust with grated poly(styrene). J. Clean. Prod. 2020, 277, 123491. [Google Scholar] [CrossRef]
  27. Saleh, H.M.; Eskander, S.B. Innovative cement-based materials for environmental protection and restoration. In New Materials in Civil Engineering; Butterworth-Heinemann: Giza, Egypt, 2020; pp. 613–641. [Google Scholar]
  28. Zong, Z.H.; Ge, J.P.; Yang, Q.Y. Nonlinear finite element analysis of the concrete filled square steel tubular column to steel beam connections under low-cycle reversed loading. J. Build. Struct. 2006, 27, 75–81. [Google Scholar] [CrossRef]
Figure 1. Frame–shear wall structure showing the wall and columns connected by RCFSTKs. (a) Embedded part; (b) RCFSTKs; (c) Plain concrete block.
Coatings 12 01584 g001
Figure 2. Geometric dimensions and reinforcement of specimen XJ. (a) Geometric dimensions and reinforcement of specimen XJ; (b) 1–1; (c) 2–2; (d) 3–3.
Coatings 12 01584 g002
Figure 3. Geometric dimensions and reinforcement of specimen ZP. (a) Geometric dimensions and reinforcement of specimen ZP; (b) 1–1; (c) 2–2; (d) 3–3; (e) Embedded part; (f) RCFSTK; (g) Plain concrete block.
Coatings 12 01584 g003
Figure 4. Test loading device. (a) Loading device; (b) Live loading photo.
Coatings 12 01584 g004
Figure 5. Horizontal loading system.
Coatings 12 01584 g005
Figure 6. Arrangement of specimen ZP displacement meters and strain gauge; the displacement meters and steel strain gauge arrangement of specimen XJ were the same as for specimen ZP.
Coatings 12 01584 g006
Figure 7. Final damage of specimen XJ.
Coatings 12 01584 g007
Figure 8. Final damage of specimen ZP.
Coatings 12 01584 g008
Figure 9. Load–displacement hysteresis curves of specimens XJ and ZP.
Coatings 12 01584 g009
Figure 10. Load–displacement skeleton curves of specimens XJ and ZP.
Coatings 12 01584 g010
Figure 11. Stiffness degradation curves of specimens XJ and ZP.
Coatings 12 01584 g011
Figure 12. Graphical representation of energy dissipation coefficient calculation.
Coatings 12 01584 g012
Figure 13. Typical load–strain curves for the steel bars of each specimen. (a) Strain of steel bar at S1; (b) Strain of steel bar at S2; (c) Strain of steel bar at S3; (d) Strain of steel bar at S4.
Coatings 12 01584 g013
Figure 14. Load–strain curves of the steel plates at the top and bottom of the RCFSTKs. (a) Steel plate strain at RCFSTK A1; (b) Steel plate strain at RCFSTK B1; (c) Steel plate strain at RCFSTK C1; (d) Steel plate strain at RCFSTK D1.
Coatings 12 01584 g014
Figure 15. Load–stress curves of the steel plates at the side center of the RCFSTKs. (a) Steel plate stress at RCFSTK E5; (b) Steel plate stress at RCFSTK F5; (c) Steel plate stress at RCFSTK G5; (d) Steel plate stress at RCFSTK H5.
Coatings 12 01584 g015
Figure 16. Constitutive Relations. (a) Concrete compression behavior. (b) Concrete tensile behavior. (c) Reinforcement behavior. (d) Steel plate behavior.
Coatings 12 01584 g016
Figure 17. Physical test and simulated hysteresis curves for comparison. (a) XJ; (b) ZP.
Coatings 12 01584 g017
Figure 18. Physical test and simulated load–displacement curves for comparison. (a) XJ; (b) ZP.
Coatings 12 01584 g018
Figure 19. Load–displacement skeleton curves of each model for comparison.
Coatings 12 01584 g019
Figure 20. Concrete plastic strain cloud charts for each model. (a) Model ZP; (b) Model JJWK; (c) Model QZYK; (d) Model QZWK.
Coatings 12 01584 g020
Figure 21. Load–displacement skeleton curves for models with different numbers of RCFSTKs.
Coatings 12 01584 g021
Figure 22. Load–displacement skeleton curves for models with different RCFSTK unit height.
Coatings 12 01584 g022
Figure 23. Load–displacement skeleton curves for models with different RCFSTK steel tube wall thickness.
Coatings 12 01584 g023
Figure 24. Load–displacement skeleton curves of models with different axial pressure ratios.
Coatings 12 01584 g024
Figure 25. Load–displacement skeleton curve of models with different RCFSTK steel strengths.
Coatings 12 01584 g025
Figure 26. Load–displacement skeleton curves of models with different RCFSTK concrete grades.
Coatings 12 01584 g026
Table 1. Design parameters of specimens.
Wall IDSpecimen TypeWall and Column Connection MethodWall Section b × h (mm)Column, Loading Beam, and Ground Beam Sections b × h (mm)
XJcast-in-placecast-in-place1080 × 200400 × 400
ZPprefabricatedRCFSTKs800 × 200400 × 400
Table 2. Mechanical properties of concrete, steel bars, and steel plate.
MaterialsModulus of Elasticity E
(105 N/mm2)
Yield Strain εy
(με)
Yield Strength fy
(MPa)
Tensile Strength fu
(MPa)
Cube Compressive Strength of Concrete
fck (MPa)
Concrete0.34---42
Steel plate2.11304274352-
Steel bar (A8)1.43100434584-
Steel bar (C10)2.22400528604-
Steel bar (C18)1.72335397563-
Table 3. Characteristic index values in the load–displacement skeleton curves of specimens XJ and ZP.
Specimen IDYield Load (kN)Ultimate Load (kN)Failure Load (kN)Initial Stiffness (kN/mm)Ductility Ratio
XJ1583176915031312.7
ZP1443165314051013.3
Table 4. Bearing capacity degradation coefficients of specimens XJ and ZP.
Specimen ID1∆−1∆2∆−2∆
XJ0.940.940.890.86
ZP0.950.920.960.96
Note: Since the damage of the third cycle was severe and the bearing capacity had decreased to <85% of the ultimate load, the third cycle was only cycled once.
Table 5. Energy dissipation coefficients of specimens XJ and ZP.
Specimen ID1∆2∆3∆
XJ0.580.691.23
ZP0.580.751.28
Table 6. Comparison results of physical tests and simulation.
Wall IDResultLoad (kN)Initial Stiffness (kN/mm)Ductility RatioEnergy Dissipation
Coefficient
YieldUltimateFailure
XJtest1583176915031312.71.23
simulation1353165814091432.91.31
error14.5%6.3%6.3%9.2%7.4%6.5%
ZPtest1443165314051013.31.28
simulation1298151912911123.71.34
error10.0%8.1%8.1%10.9%12.1%4.7%
Table 7. Model characteristics.
ModelModel TypeModel Characteristics
ZPAssemblySet plain concrete blocks between RCFSTKs
JJWKAssemblyNo plain concrete blocks between RCFSTKs
QZYKAssemblyGaps between the wall and columns
QZWKAssemblyNo gaps between the wall and columns
Table 8. Characteristic indexes given by load–displacement skeleton curves for each model.
ModelUltimate Load (kN)Failure Load (kN)Yield Load (kN)Initial Stiffness (kN/mm)
ZP151912911298138
JJWK11931014951102
QZYK88475268343
QZWK102887483366
Table 9. Values of characteristic indexes of load–displacement skeleton curves for each model.
Parameter ValueYield Load (kN)Ultimate Load (kN)Failure Load (kN)Initial Stiffness (kN/mm)Ductility RatioEnergy Dissipation Coefficient
n = 2122414861263952.70.39
n = 41242150812821582.80.47
n = 61413188516031603.00.58
n = 81421188916061603.20.67
h = 151356187415931603.00.65
h = 201421188916061603.20.67
h = 251533201017091622.80.62
t = 41280151912911123.71.34
t = 81421188916061603.20.67
t = 121228175514921623.80.84
ζ = 0.21209169814431603.60.68
ζ = 0.41421188916061603.20.67
ζ = 0.51507198416861602.80.54
Q-Q2351421188916061603.20.67
Q-Q3901568199816981632.90.63
Q-Q4201593204817411672.80.61
G-C251562205017431422.80.61
G-C301553190916231532.90.63
G-C401421188916061603.20.67
G-C501411187915971643.40.73
Publisher’s Note: MDPI stays neutral with regard to jurisdictional claims in published maps and institutional affiliations.

