Article

Sustainability Evaluation of Cold In-Place Recycling and Hot Mix Asphalt Pavements: A Case of Qassim, Saudi Arabia

Department of Civil Engineering, College of Engineering, Qassim University, Buraydah 51452, Saudi Arabia
*
Author to whom correspondence should be addressed.
Coatings 2022, 12(1), 50; https://doi.org/10.3390/coatings12010050
Submission received: 17 November 2021 / Revised: 13 December 2021 / Accepted: 28 December 2021 / Published: 1 January 2022
(This article belongs to the Special Issue Asphalt Pavement Materials and Surface)

Abstract

:
The construction of conventional hot mix asphalt (HMA) pavements results in a number of economic and environmental issues, such as the cost of new overlays and associated impacts on natural resources. Although the cold recycling with an emulsified asphalt-recycling agent holds certain benefits over the HMA, its implementation on different road types, ranging from farm-to-market roads to expressways, is yet contentious due to the need for sophisticated equipment and trained workforce. The present research developed a methodology to evaluate all the three dimensions of sustainability, including economic (construction cost), environmental (natural resource depletion), and social (need for advanced equipment and skilled labor) of various scenarios of RAP and conventional asphalt pavements. The present study evaluated an equivalent thickness of the Cold In-place Recycling (CIR) pavement, which behaves similar to HMA pavement under the influence of different traffic loads. Fifty CIR and HMA scenarios for different traffic volumes and pavement layers thicknesses were developed. Finally, the sustainability of all the scenarios was evaluated for traffic designation in Saudi Arabia using fuzzy-based multicriteria analysis. Ranking of scenarios found CIR as a more sustainable overlay option for the feeders, collectors, main urban streets, expressways, and heavily trafficked highways in industrial areas where ESALs (Equivalent Single Axle Loads) range between 2,000,000 and >31,000,000. Considering the limited availability of advanced equipment and skilled labor for CIR pavements, HMA was found be a more sustainable option for farm-to-market roads with the “very light” traffic class. The methodology will help the pavement managers in decision making regarding the selection of sustainable pavement technologies for different road types in Saudi Arabia and the rest of the world.

1. Introduction

Increasing urban development trends have resulted in the construction of dense road infrastructure. Conventionally used Hot-Mix Asphalt Pavement (HMA) caused various environmental impacts from its material production to operations and disposal. This has prompted the government agencies and designers to search for appropriate ways to reduce the detrimental environmental impacts of road construction and maintenance, such as consumption of natural resources and production of emissions that are harmful to the health of the workers and residents. An increasing focus on the use of reclaimed asphalt pavement (RAP) in the construction and maintenance of roads around the world has been noticed in the recent past. RAP holds several environmental and economic benefits gained from recycling in comparison to other recycling technologies [1].
RAP materials are produced from road maintenance activities by milling or crushing the existing HMA. Reusing RAP as a surface course [2] or base and sub-base layers [3] is the primary advantage, while it can also be mixed with other materials to improve the performance, such as using crumb rubber [4] and Portland cement concrete [5]. Cold in-place recycling (CIR) technology is an alternate to make use of RAP. Saudi Arabia started exploring the possibility of using this technology on a large scale after launching the 2030 Vision that aims to establish a sustainable economy, preserve natural resources, and reduce harmful emissions. Besides the economic and environmental benefits of recycled pavements, the need for specialized equipment and skilled labor is among some of the anticipated barriers to their implementation. Evaluation of the recycled pavements, encompassing all the three dimensions of sustainability, has yet to be evaluated in Saudi Arabia.
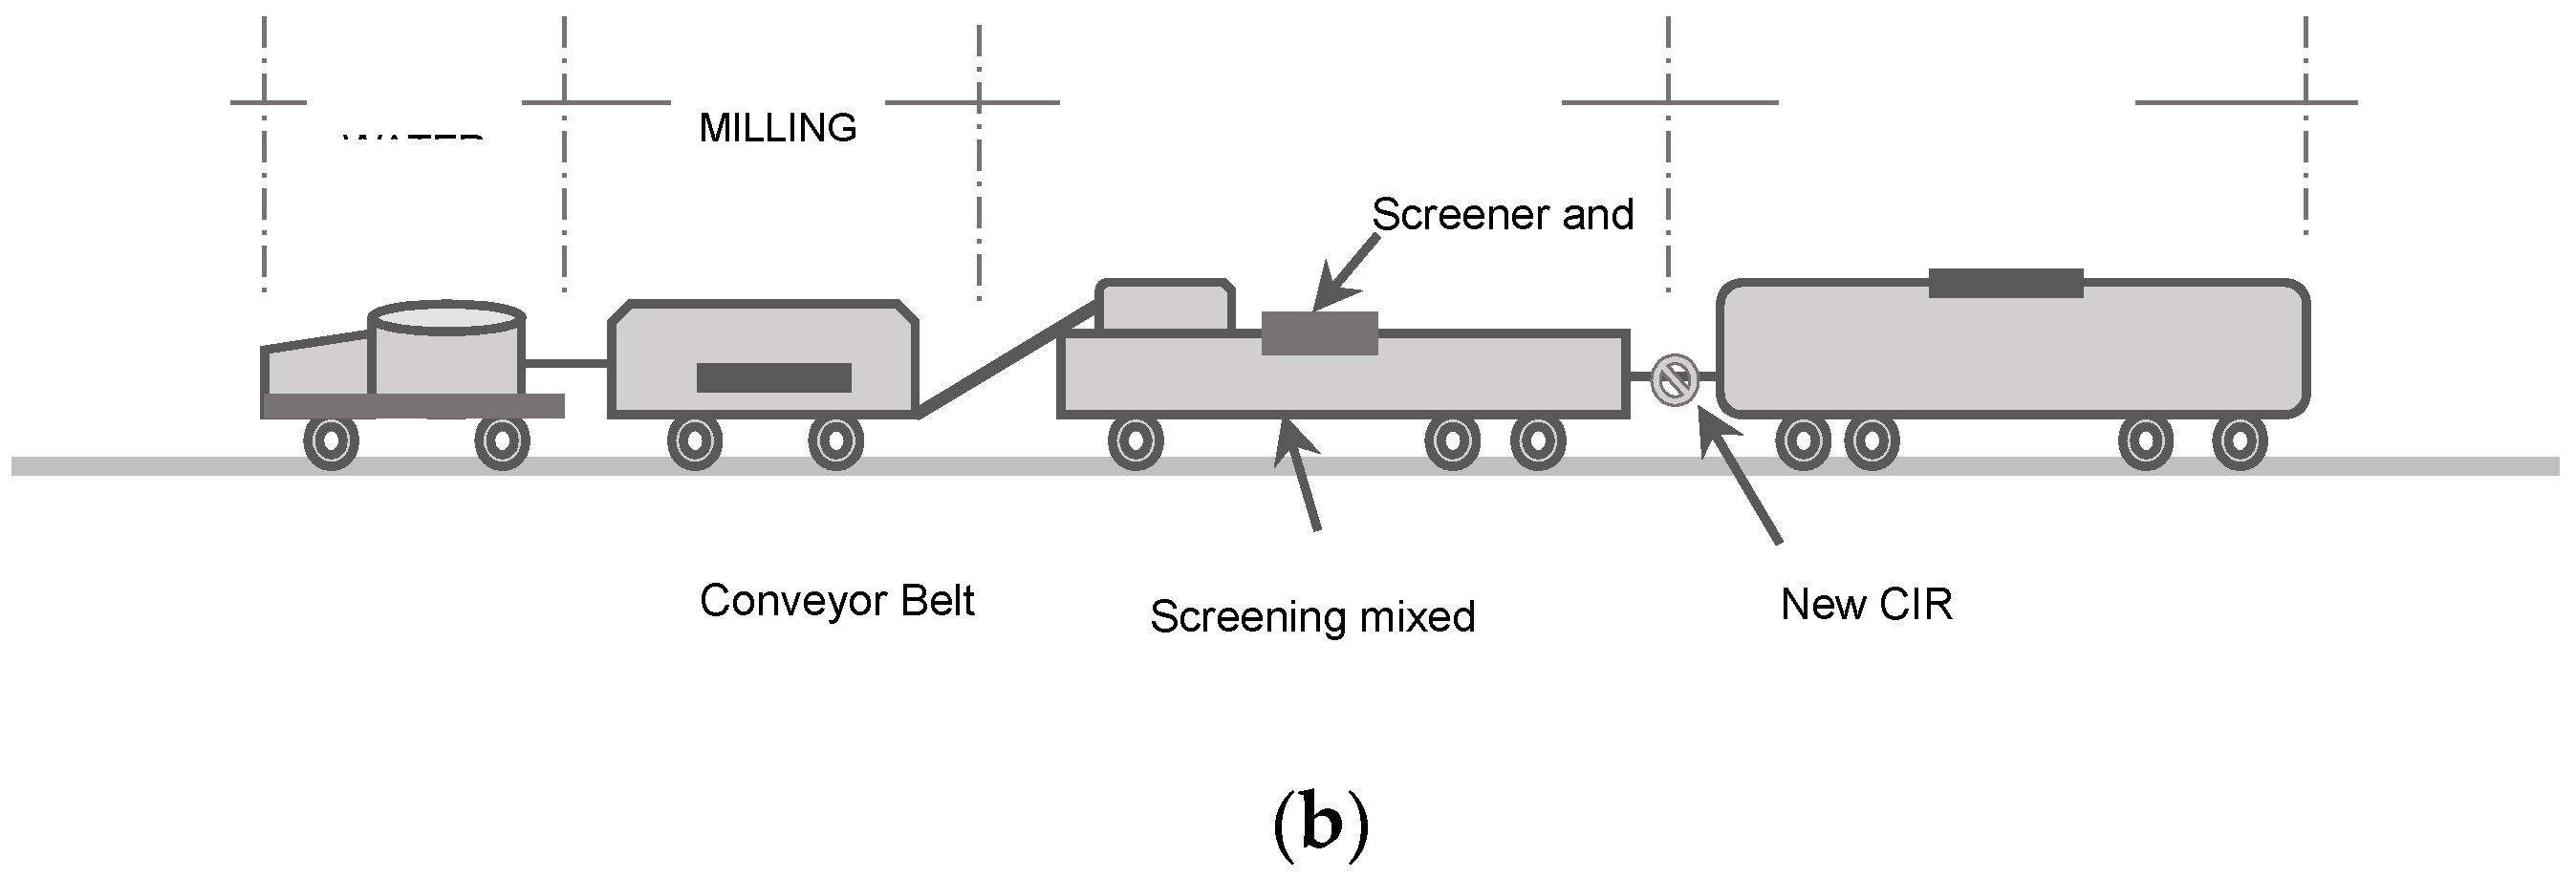
CIR technology follows a continuous process of cold milling of the pavement surface and remixing with asphalt emulsion or other modifiers to improve the qualities of the reprocessed material, followed by screeding and compaction of the reprocessed materials [6]. Chemical additives are often used to improve the efficiency of the CIR process. The process starts with a milling machine pulverizing to deteriorate the top 50–100-mm layer of HMA. To achieve the necessary gradation, the milled material is crushed and screened on site. Subsequently, the milled grains are mixed with binding agents, such as emulsion, cement, lime, or fly ash. The mixture is reapplied to the roadway, which is subsequently graded to the final elevation [6]. CIR holds several advantages over HMA in terms of reducing aggregate usage, material transportation, and energy consumption. Furthermore, using CIR is environmentally sustainable as it reduces carbon dioxide (CO2) emissions by 9% over the lifecycle as opposed to conventional mixtures; the CO2 emission reduction is 54% when just considering the recycling process [7]. According to Schwartz (2016), CIR technology reduces CO2 emissions by 80% as compared to conventional HMA applications and saves 60% of bitumen content [8]. Presently, the RAP is being used for low-traffic roads in Saudi Arabia, where a simple surface treatment is all that is required. Examples of such work include restoring a damaged pavement, excessive cracking, extreme rutting, and an unstable base or subgrade [9,10,11]. The quality of the old milling materials influences the strength of the cold recycled asphalt mixture [12]. The sustainability of CIR for the construction of major highways in Saudi Arabia has not been investigated to date.
To investigate how the RAP temperature affects the strength of the CIR mixture components, Kim and Lee (2011) prepared samples of foamed CIR at various temperatures and performed indirect tensile strength [13]. They determined that the temperature of RAP materials has a substantial effect on the wet indirect tensile strength of CIR foam mixtures, and the optimal foam quality varies with temperature after checking the samples. RAP sources and properties, as well as residual binders, influence CIR mechanical properties and efficiency. In comparison to traditional HMA blends, it is clear that the literature indicates that the CIR technology has quality engineering properties and field efficiency to be effectively used in constructing low-volume traffic roads.
Construction and maintenance of roads require an extensive amount of material and energy that significantly impact both the physical environment and natural resources. The Federal Highway Administration (FHWA) considers that a sustainable pavement should meet the basic human needs, use available resources effectively, and conserve adjacent environment [14]. Sustainability of pavements can be achieved during the entire life cycle, including all the processes initiating from material production, pavement design, construction, operation, and maintenance/rehabilitation, to the end of pavement life [15].
CIR has a lot of potential for repairing, strengthening, and recycling asphalt pavements. However, estimating the design thickness of the pavement layers from CIR compared to HMA for different traffic loads is not yet clear in the literature. The main objective of the present research was to develop a sustainability evaluation methodology for CIR and HMA pavements. The thickness of an equivalent CIR pavement that behaves similarly to the conventional HMA was estimated for different traffic loads. Scenario analysis of both the CIR and HMA paving structures for varying traffic classes and thicknesses for the base and sub-base layers was performed. The study also aimed to find the difference in thickness of the paving layers for each method and use this data to determine the difference in the cost and environmental and social impacts of CIR compared to HMA. Finally, sustainability of all the pavement scenarios was evaluated using fuzzy-based multicriteria analysis.

2. Materials and Methods

2.1. Study Area

The province of Qassim lies in the heart of Saudi Arabia (see Figure 1). Qassim holds a special geographical significance in the country as it joins the capital city Riyadh to Madinah that is famous for its religious importance. Due to the extensive agricultural activities in Qassim, both the rural and urban areas are interconnected through a blend of various road types ranging from farm-to-market roads to four-lane urban highways and intercity expressways. The capital of Qassim is Buraydah that is located at 26°19′16″ N and 43°57′32″ E. Frequent traffic movements due to ever-increasing agricultural and industrial activities demand regular rehabilitation of HMA pavements. In the absence of asphalt recycling practices, all the replaced asphalt is presently being disposed of in the open dumps located at various sites. Figure 1 shows one of the asphalt disposal sites located near a high-value residential neighborhood in Buraydah. Figure 1b illustrates the processes involved in a conventional CIR train. The current situation clearly demands for an investigative effort to come up with a sustainable solution for this useful yet out-of-the-place resource. For evaluating the sustainability of CIR and HMA pavements for the study area, cost data were obtained from the Department of Transportation in Qassim.

2.2. Pavement Design

The relative capacity of different road pavements to serve certain traffic over time determines their efficiency. According to the definition, serviceability is the ability of a specific section of the pavement to serve high-speed, high-volume, and mixed traffic in its existing condition [17]. The design procedure for flexible pavement, as recommended by the American Association of State Highway and Transportation Officials (AASHTO), requires several inputs to determine the appropriate thickness of the pavement (see Figure 2). Examples of the inputs used for the design of flexible pavement include traffic volume, performance period, resilient modulus of the soil on which the road will be constructed, and specifications of the materials used in paving for the surface, base, and sub-base layers. Evaluating the relative impact of each input can optimize the pavement design.
A prepared sub-grade layer, which is the roadbed soil or borrow material compacted to a defined density, is the foundation for a flexible pavement. On top of the prepared roadbed, a sub-base course is constructed. The base course is built on top of the sub-base course or directly on the roadbed soil if no sub-base is used. The commonly used aggregates are crushed stone, crushed gravel, and sand. The surface layer sitting on the top of the base course is normally made up of an asphalt concrete binder mixture.
Since a flexible pavement is a layered structure, it was designed step by step using a process called Layered Design Analysis [18]. The AASHTO versatile design procedure relies on a design equation formed after a series of road tests and several nomographs. However, some of the design equations’ input parameters are either difficult to obtain or to choose definitively. The following subsections discuss the assumptions and correlations that were considered in the current study.
The equation incorporates the Structural Number (SN), which is an abstract number expressing the structural strength of a pavement layer system required for a given combination of soil support [19].
The AASHTO design equation for flexible pavement is presented as follows:
log 10 ( W 18 ) = Z R × S 0 + 9.36 log 10 ( S N + 1 ) 0.2 + log 10 ( Δ P S I 4.2 1.5 ) 0.4 + 1094 ( S N + 1 ) 5.19 + 2.3 log 10 M R 8.07
where SN is the structural number, W18 is the accumulated 80-kN Equivalent Single Axle Loads (ESALs) over the life of the project, ZR is the standard normal deviation, MR is resilient modulus (PSI), S0 denotes the standard deviation, and ΔPSI is the change in performance serviceability index.
In the present research, Equation (1) was used to design an equivalent CIR pavement that behaves similarly to the conventional HMA for different traffic loads. This equation was successfully applied by the Ministry of Transport for pavement design in Saudi Arabia with some local adjustments [20].

2.3. Performance Evaluation Variables

2.3.1. Performance Period

The performance period refers to how long an initial pavement construction will last until it needs to be repaired or how long it will last between repairs. It is the amount of time it takes for a new, rebuilt, or rehabilitated road structure to deteriorate from its original status to its terminal serviceability. In this research, a 10-year performance period was used since it is suitable for both HMA and CIR [6,21,22].

2.3.2. Traffic Loading

The design procedures are based on an overall estimated equivalent single-axle load (ESAL) of 80 kN [19]. The total ESALs over the analysis period is all that is needed if a pavement is built for the analysis period without any resurfacing or rehabilitation [18]. The Ministry of Transportation in the Kingdom of Saudi Arabia recommends using the information in Table 1 if the contract documents do not specify the ESALS applied to the project to determine the traffic classes needed for the design criteria [20].

2.3.3. Reliability

Generally, reliability is a way of integrating some level of certainty into the design process to ensure that the different design alternatives can last the lifetime period of the road. The reliability principle necessitates the selection of a standard deviation that is indicative of local conditions in order to be applied. The Federal Department of Transportation (FDOT) design guide suggests that a standard deviation of 0.45 be used for flexible pavements and reliability of 90% [23].

2.3.4. Serviceability

To compute the change in serviceability, PSI, used in Equation (1) and initial and terminal serviceability indexes must be created. According to the FDOT design guide, the typical initial value of PSI is 4.2 and the terminal value is 2.5.

2.3.5. Layer Coefficients

A material’s relative potential to behave as a structural component of the pavement is measured by the layer coefficient of a unit thickness of material. Layer coefficients may also be calculated using road test or a correlation with the material’s resilient modulus. The values of the layer coefficients are calculated using the AASHTO charts. Only granular base and sub-base materials are included in the guide equations relating the resilient modulus and the corresponding values of layer coefficients.
The equations used for each type of layer are as follows:
a 2 = 0.249 log E 2 0.977
a 3 = 0.227 log E 3 0.839
where E2 and E3 are resilient modulus (PSI) of unbound base layer materials and unbound sub-base layer materials, respectively. Column 4 of Table 2 presents the assumed and calculated values of the layer coefficient for various layers used in the present research.

2.4. Layer Thickness

Once the Required Structural Number (SN) has been determined, the AASHTO method uses a step-by-step method of analyzing layer thicknesses. Using acceptable layer coefficients, the structural number for each layer is converted into the corresponding thicknesses. The following formula is used to transform the structural numbers to layer thicknesses.
S N = ( a 1 × D 1 ) + ( a 2 × D 2 ) + ( a 3 × D 3 )
where SN is the total calculated strength of the pavement layers and has units of inches; a 1 , a 2 ,   and   a 3 are the layer coefficients that represent the strength of the materials used in surface, base, and sub-base layers; and   D 1 , D 2 ,   and   D 3 denote the actual thicknesses (in inches) of surface, base, and sub-base courses.

2.5. Development of Sustaianbility Index

2.5.1. Fuzzy Analytic Hierarchy Process

Fuzzy Analytic Hierarchy Process (Fuzzy-AHP) estimated the weights of the following sustainability criteria:
C1: Construction cost: The costs per m3 of different pavement layers were obtained from the Department of Transportation in Buraydah, Qassim, Saudi Arabia. The cost including both material and labor costs were as follows 280 SR/m3 for HMA, 64 SR/m3 for CIR, 45 SR/m3 for base layer, and 25 SR/m3 for sub-base layer.
C2: Resource conservation: This criterion corresponds to the layers’ thickness, obtained from Equation (4), as higher thicknesses required a large amount of gravel and other materials acquired from natural resources.
C3: Ease in construction: CIR pavement construction process is done with the help of a CIR train that involves a service of processes (e.g., milling, recycling, and emulsion), as shown in Figure 1b. Unlike HMA, the CIR train needs to be operated by trained personnel. Hence, this criterion entails the need for advanced equipment and skilled operators.
Fuzzy-AHP adopts a pairwise comparison using linguistic terms, such as equal importance and moderate importance. These terms are translated into triangular fuzzy numbers (TFN) to approximate the qualitative judgments of four decision makers from academia and field (engineers and managers working in construction and municipalities). Haider et al. (2020) used the α-cut approach-based Fuzzy-AHP to estimate the weights of water quality parameters for ranking of naturally contaminated groundwater wells in the Qassim Province of Saudi Arabia [25]. The same approach was adopted here and the detailed steps can be seen in [25,26] and Appendix A. Table A1 presents the nine-point rating scale used in pairwise comparison. The consistency of the pairwise matrix scored by each decision maker was checked through the consistency index (CI) and consistency ration (CR). The value of CR has to be less than ‘1′ to ensure the consistency of the pairwise matrix scored by each decision maker.

2.5.2. Fuzzy VIKOR

Serafim Opricovic (1998) first developed the VIKOR ranking method to deal with conflicting criteria [27]. In the present study, the Fuzzy VIKOR, an extension of this method, was used to rank various scenarios of HMA and CIR with varying pavement thicknesses. Fuzzy VIKOR was adopted to accommodate the uncertainties in estimation of cost and layers’ thicknesses (C1 and C2) and the vagueness in defining the ease in extension criteria (C3). The step-by-step procedure is outlined in the following [28].
Step 1: Fuzzy-AHP obtained the fuzzified weights for each sustainability criterion as W i ˜ = ( w l i , w l m , w l u ) , where w l i , w l m , and   w l u are the lower, medium, and upper limits of the criteria weights in the form of TFNs.
Step 2: As all the criteria are cost criteria and none of them is a benefit criterion, the positive triangular ideal solution ( f ˜ i * ) for each criterion corresponds to the lowest possible values, while the negative triangular ideal solution ( f ˜ i o ) corresponds to the highest values and is defined as:
f ˜ i * = M A X j f ˜ i j   f ˜ i o = M I N j f ˜ i j   for   i   I c
where Ic represents the set of WQPs as the cost criteria.
The f ˜ i * and f ˜ i o values for each sustainability criteria based on the data were obtained from Equation (5). The criteria with scores less than the lowest possible values were considered as the positive ideal solution.
Step 3: Using Equation (6), estimate the normalized fuzzy difference ( d ˜ i j ,   j = 1 ,   ,   J ,   i = 1 ,   ,   n ) :
d ˜ i j = ( f ˜ i * f ˜ i j ) / ( r i * l i o )     for   i   I c
Step 4: Using Equation (7), determine the fuzzy weighted sum S ˜ and fuzzy operators MAX R ˜ :
S ˜ j = i = 1 n ( w ˜ i d ˇ i j )   and   R ˜ j = M A X i ( w ˜ i d ˇ i j )
Step 5: To determine the final sustainability rank for each scenario, compute Q ˜ j as:
Q ˜ j = v ( S ˜ j S ˜ * ) / ( S o r S * l ) ( 1 v ) ( R ˜ j R ˜ * ) / ( R o r R * l )
where S ˜ * is the MIN S ˜ j , S o r is MAX S j r , R ˜ * is the MIN R ˜ j , S R o r is MAXj R j r , and v is the weight of the strategy.
Step 6: For the results obtained through Equation (9), perform the defuzzification using the following equation:
P ( M ˜ ) = M = l + 4 m + u 6
Step 7: As the high Q ˜ j corresponds to the pavement scenario with low sustainability, final sustainability ranks (SR) were established using the following relationship for each scenario:
S R i = 1 Q ˜ j

3. Results

3.1. Development of Pavement Scenarios

The present research was an attempt to improve the existing practice of open dumping of the replaced asphalt (generated from rehabilitation activities) and the allied social and environmental consequences in Saudi Arabia. Although the CIR has a potential to mitigate these impacts and enhance the overall sustainability of the pavement construction process, the technology needs to be evaluated on equal technical grounds with the HMA construction. A thicker CIR surface layer is required to behave analogously to HMA for a given traffic class. Five traffic classes and five different combinations of base and sub-base thicknesses generated 25 scenarios for each type of pavement. Table 3 presents all the 50 scenarios evaluated for CIR and HMA. The first step of this research estimated the equivalent thicknesses of CIR for each traffic class and different thicknesses of base and sub-base layers. The last column of Table 1 shows the values of ESALs used in the current study.
Table 3 presents five different base and sub-base layers’ thicknesses evaluated in this research. The inputs, including ESALs in Table 1 and layers’ thicknesses in Table 3, were applied to Equation (1). Using 90% reliability with 0.45 standard deviation, 4.2 initial serviceability index, 2.5 terminal serviceability index, and 62 MPa (8992 psi) sub-grade resilient modulus, the resulted layers’ thicknesses in the structural framework of HMA and CIR pavement are shown in Table 3 for the different scenarios. Table 3 also shows that, for most of the scenarios, design thickness of CIR-based pavement is higher than that of the HMA-based pavement at various traffic loads. This was expected because of the quality of the used materials, new versus recycled. Nevertheless, HMA needs new material for surface layers, while CIR uses the recycled material and does not need additional natural resources.
Table 3 illustrates the comparison between traditional HMA and recycled paving CIR according to the thickness of the paving layers. The table describes that, at lower ESALs (mostly up to 7,000,000), the thickness difference between the two techniques ranges from 0.0 cm for the lowest EASL to about 9.0 cm for medium ESAL. For higher ESALs, the difference significantly increases up to 12 cm. Moreover, it appears that the ratio between the thickness of CIR and HMA layers decreases with the increasing thickness of base and sub-base layers. For instance, the difference was 4 cm for very light and 12 cm for very heavy traffic classes with a 15-cm base layer without any sub-base while the difference reduced to 1 cm and 10 cm for the same traffic classes with a 10-cm sub-base and 20-cm base layer. For the equal thickness (20 cm) for both the base and sub-base, the difference reduced to 0 cm for very light and to 9 cm for very heavy traffic, which further reduced to 0 am and 8 cm with a 20-cm sub-base and 25-cm base layer. This may be attributed to the obvious effect of the foundation soil layers on the pavement design. Therefore, the design engineer would be able to develop other alternatives of road design to the client to choose among them based on the needed road class or grade and the available budget for the project.

3.2. Sustainability Evaluation of Pavement Scenarios

Based on the thicknesses of pavement layers, 10 scenarios were developed for each traffic class that came up with a total of 50 scenarios. Five scenarios each for HMA and CIR make a total count of 50 scenarios (see Table 4). The last three columns of Table 3 present the scores of the three sustainability criteria. Possible uncertainities in criteria weight estimation, construction cost estimation (C1), assumptions in calculating pavement thicknesses (C2), and subjective assessment of ease in construction (C3) were accomodated by the Fuzzy-AHP and Fuzzy-VIKOR methods. Consistency ratios for the four pairwise matrices were found to be less than ‘1′ as per the Equation (A4) and Table A2 of the Fuzzy-AHP methodology described in Appendix A. The fuzzified weights of the crtieria were found to be C1: 0.44, 0.558, and 0.615; C2: 0.239, 0.269, and 0.283; and C3: 0.171, 0.172, and 0.178.
In the subsequent step, the fuzzy-VIKOR aggregated the criteria scores to estimate the sustainability ranks for all the traffic classes’ scenarios. Keeping in view the space limitations, Table 5 presents results for the ‘medium’ traffic class as an example. Table 5 presents the fuzzified scores of all the criteria for scenario numbers 1.3, 2.3, 3.3, 4.3, and 5.3. The last two columns of Table 5 provide the positive triangular ideal solution ( f ˜ i * ) and the negative triangular ideal solution ( f ˜ i o ) for each criterion. As all are the cost criteria, f ˜ i * corresponds to the ‘best-case scenario’ and f ˜ i o to the ‘worst-case senario’.
Table 6 presents the fuzzy results for Sj, Rj, and Qj, using the steps descibed in Equations (6)–(8). Equation (9) defuzzified the final scores and the results are given in Table 6. The defuzzified Qj scores are essentially the aggregated performance ranks for each pavement scenario. Finally, Equation (10) established the sustainability ranks (also mentioned in Table 4), and Figure 3 summarizes these results for all the scenarios evaluated in the present study.

4. Discussion

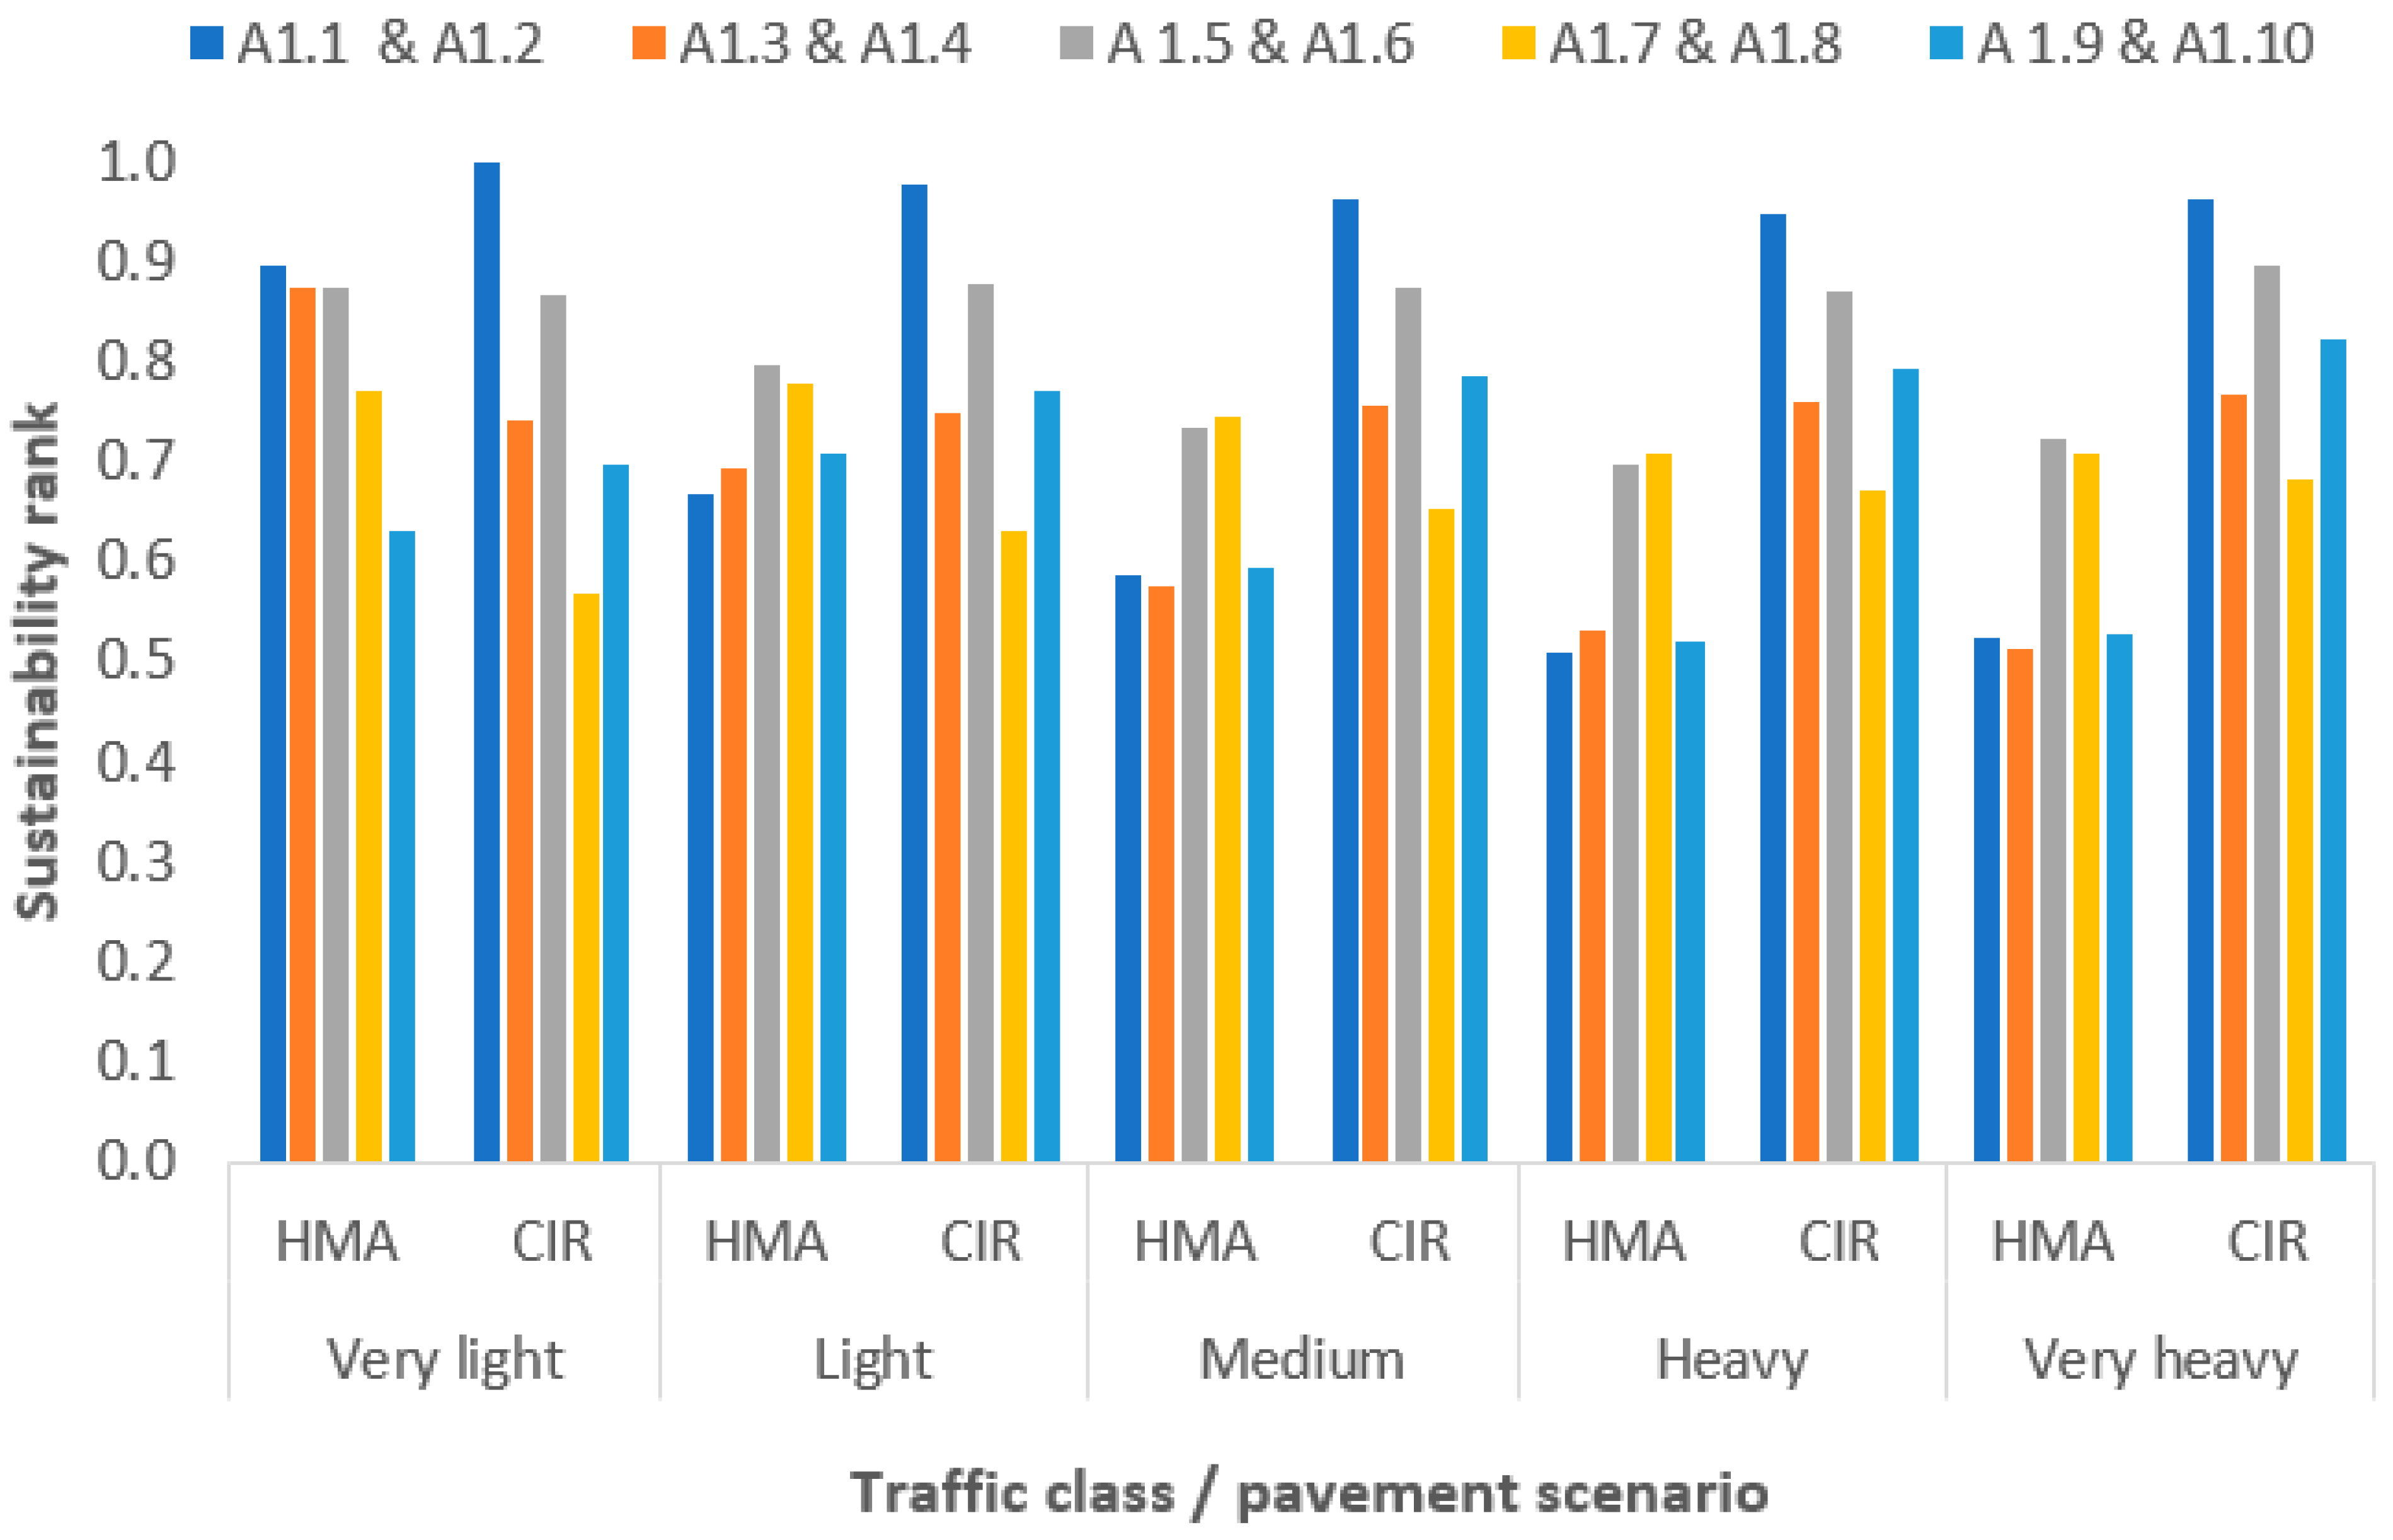
The results presented in Figure 3 show an overall supersedence of CIR over the HMA pavement for all traffic classes due to its low cost and minimal use of natural resources. Interestingly, in the case of ‘very light’ traffic class, HMA with a 0-cm sub-base, 15-cm base, and 16-cm wearing coarse (A1.1: 0SB-15B-16HMA) came out to be the second-best scenario based on the overall sustainability rank. The sustainability rank score of the top-ranked CIR scenario with the same thicknesses of sub-base and base and almost two times thicker wearing course (A1.2: 0SB-15B-29CIR) was almost 10% higher (1.0) than the HMA scenario (0.894). The results could be different if a higher relative weight is given to C3: need for advanced equipment and skilled labour. In the same traffic class, the third and fourth ranks were also obtained by the HMA. These results suggest the use of HMA for the farm-to-market roads with very-light traffic (<300,000 ESALs), where the availability of both the advanced equipment and skilled labors could be a primary constraint to using CIR pavements.
In the case of the ‘light’ traffic class, the CIR scenarios superseded the HMA scenarios with the top two sustainability ranks. In the comparative evaluation of the two pavement types for a given thickness of sub-base and base, CIR scenarios also obtained higher ranks. For instance, A2.5:10SB-20B-17HMA ranked at third place while the CIR scenario (A2.6:10SB-20B-24CIR) obtained second rank. Similarly, A10:20SB-25B-19CIR outperformed A2.9:20SB-25B-113HMA by getting the fifth rank in comparison to the seventh rank of its counterpart. CIR attained the first four ranks in the overall classification for the medium traffic class (7,000,000 ESALs), except for an equal thickness of sub-base and base (20 cm) where HMA got fifth rank and CIR the seventh. Figure 3 illustrates an analogous behavior for ‘heavy’ and ‘very heavy’ traffic classes where all the CIR scenarios were visibly surpassing their comparable HMA scenarios.
The proposed evaluation of CIR and HMA clearly revealed that CIR technology is comparable to HMA for all traffic classes with some additional thickness of the surface layer. This approach will not only minimize the environmental impacts on non-renewable natural resources (aggregates) but also mitigate the visual nuisance due to open dumping of the asphalt mix generated from road maintenance. The proposed methodology will help the pavement engineers and managers for applying CIR as a sustainable construction and maintenance technology in Saudi Arabia and elsewhere.

5. Conclusions

The present research investigated the design thickness of the recycled-based pavement (CIR) equivalent to the conventional HMA pavement under the influence of different traffic loading classes. Five design scnearios with varying thicknesses of sub-base, base, and wearing course for each traffic class were investigated that generated a total of 50 scenarios, 25 each for CIR and HMA pavement types. All the scenarios were evalauted for their economic (construction cost), enviornmental (natural resource depletion), and social (need of advanced equipment and skill labour) sustainbility.
A thicker CIR surface layer behaves identically to that of HMA. Moreover, the ratio between the CIR and HMA layers reduces as the thickness of base and sub-base layers increases. The difference of 4 cm for very light (250,000 ESALs) and 12 cm for very heavy (31,000,000 ESALs) traffic classes was obtained for a 15-cm base layer in the absence of a sub-base. The difference reduced to 1 cm for very light and 10 cm for very heavy traffic classes for a 10-cm sub-base and 20-cm base layer. Interestingly, the same thickness (7 cm) was found for both the CIR and HMA for very light traffic with equal thickness (20 cm) for both the base and sub-base, while 9 cm was found for very heavy traffic.
The results of the sustainability evaluation menifest a clear dominance of CIR over the HMA for all classes except ‘very light’ traffic. This means that CIR is a more sustainable pavement overlay for feeders, collectors, main urban streets and highways, expressways, and heavily trafficked highways in industrial areas where ESALs range from 2,000,000 to more than 31,000,000. In the particular case of the ‘very light’ traffic class, HMA was found be a more sustainable option, keeping in view the limited availability of advanced equipment and skilled labour for construction of farm-to-market-roads. A recycled pavement mixture could present an economic design alternative to the conventional mixtures and should be considered when designing and rehabilitating roads. This sustainable alternative is not only economically attractive but also it conserves the environment with less use of natural materials. The study will help the design engineers and infrastructure asset managers for planning pavement construction and rehabilitation programs in Saudi Arabia and elsewhere. Future studies can investigate deatiled lifecycle costing and lifecycle assessment of CIR pavements.

Author Contributions

F.A. (Fawaz Alharbi), funding, supervision, conceptualization, methodology, writing—original draft preparation; F.A. (Fahad Alshubrumi), data collection, analysis, validation, writing—original draft preparation, M.A., conceptualization, supervision, writing—review and editing; H.H., supervision, methodology, writing—original draft preparation; A.E., conceptualization, methodology, supervision; S.E., conceptualization, supervision, writing—review and editing. All authors have read and agreed to the published version of the manuscript.

Funding

This research was funded by the Deanship of Scientific Research, Qassim University with Grant No. 9909-qec-2019-1-1-Q.

Institutional Review Board Statement

Not applicable.

Informed Consent Statement

Not applicable.

Data Availability Statement

All the shareable data are given in the main text.

Acknowledgments

The authors gratefully acknowledge Qassim University, represented by the Deanship of Scientific Research, on the financial support for this research under the number 9909-qec-2019-1-1-Q during the academic year 1440 AH/2019 AD.

Conflicts of Interest

The authors declare no conflict of interest.

Appendix A

The procedure of α-cut-based Fuzzy-AHP is as follows [27].
Step 1: Develop the pairwise comparison matrix.
K denotes the number of decision makers (DMs) who completed the pairwise comparison matrix. Using the nine-point rating scale given in Table A1, the fuzzy reciprocal judgment matrix A ˜ k   was developed:
A ˜ k = [ a ˜ i j ] k
where i and j represent the criteria and number of the criteria in the matrix, respectively, and j = 1, 2,…, n.
The complete fuzzy reciprocal matrix R ˜ k is defined as:
R ˜ k = [ r ˜ i j ] k
where r ˜ i j is the relative importance difference between the criteria i and j. It is represented by the triangular fuzzy numbers (TFN), illustrated in Figure A1, as
r ˜ i j = ( l i j , m i j , u i j ) .   Here   r ˜ 11 = ( 1 , 1 , 1 ) ,   i = j   and   r ˜ i j = 1 r ˜ i j   k ,   i = j = 1 , 2 , , n .
Step 2: Perform consistency check.
R ˜ k = [ r ˜ i j ] represents the fuzzy positive reciprocal matrix where r ˜ i j = ( α i j , β i j , γ i j ) and its consistency is checked for each DM in the α-cut approach using the following equation:
C I = λ m a x n n 1
where λ m a x is the dimension of the matrix and is the maximum eigenvalue.
Equation (A4) calculates the consistency ratio (CR):
C R = C I R I
where RI represents the random index in Table A2 and is found for the number of sustainability criteria (i.e., n).
Figure A1. The α-cut of a triangular fuzzy number T ˜ Source: [26].
Coatings 12 00050 g0a1
Table A1. Fuzzy scales and triangular fuzzy numbers (TFN) used for linguistic variables.
Linguistic TermFuzzy NumberTFN
(l, m, u)
Linguistic TermFuzzy NumberTFN
(l, m, u)
Extreme unimportance 9 ˜ 1 1/9, 1/9, 1/9 Intermediate   value   between   1 ˜   and   3 ˜ 2 ˜ 1, 2, 3
Intermediate   values   between   7 ˜ 1   and   9 ˜ 1 8 ˜ 1 1/9, 1/8, 1/7Moderate importance 3 ˜ 2, 3, 4
Very unimportance 7 ˜ 1 1/8, 1/7, 1/6 Intermediate   value   between   3 ˜   and   5 ˜ 4 ˜ 3, 4, 5
Intermediate   value   between   5 ˜ 1   and   7 ˜ 1 6 ˜ 1 1/7, 1/6, 1/5Essential importance 5 ˜ 4, 5, 6
Essential unimportance 5 ˜ 1 1/6, 1/5, ¼ Intermediate   value   between   5 ˜   and   7 ˜ 6 ˜ 5, 6, 7
Intermediate   value   between   3 ˜ 1   and   5 ˜ 1 4 ˜ 1 1/5, 1/4, 1/3Very vital importance 7 ˜ 6, 7, 8
Moderate unimportance 3 ˜ 1 1/4, 1/3, ½ Intermediate   value   between   7 ˜   and   9 ˜ 8 ˜ 7, 8, 9
Intermediate   value   between   1 ˜   and   3 ˜ 1 2 ˜ 1 1/3, 1/2, 1Extreme importance 9 ˜ 9, 9, 9
Equally importance 1 ˜ 1, 1, 1
Table A2. Randomly generated values of consistency index (RI).
n12345688910
RI000.580.901.121.241.321.411.451.49
Step 3: Estimate the fuzzy weights.
Equation (A5) finds the positive matrix ‘k’:
T ˜ α = [ ( m 1 ) α + l ,   u ( u m ) α ] , 0 1
R ˜ m k = [ r ˜ i j ] m k can be calculated by setting = 1 , while the lower and upper bounds R ˜ l k = [ r ˜ i j ] l k and R ˜ u k = [ r ˜ i j ] u k can be found by setting = 0 .
Next, estimate the criteria weights using Equations (A1) and (A6) for all the DMs:
w i = ( j = 1 n a i j ) 1 / n j = 1 n ( j = 1 n a i j ) 1 / n
where w i represents the criteria weight and the weight vector W = ( w i ), i = 1, 2, …, n.
By applying Equation (A6) to l, m, and u bounds, the weight vertices were calculated as W l k = ( w i ) l k , W m k = ( w i ) m k , a n d   W u k = ( w i ) u k .
The smallest possible constant S l k   and the largest possible constant S l u k for minimizing the fuzziness of the weights were estimated using Equations (A7a) and (A7b):
S l k = m i n { ( w i m k w i l k | 1 i n ) }
S u k = m a x { ( w i m k w i u k | 1 i n ) }
The following equations estimated the lower and upper bounds of the weight vector:
w i l * k = S l k w i l k , i = 1 , 2 , , n
w i u * k = S u k w i u k , i = 1 , 2 , , n
Finally, the fuzzy weight matrix was developed for each DM as:
W ˜ i k = ( w i l * k , w i m * k , w i u * k ) ,   i = 1 , 2 , , n
Step 4: Combine the judgment of all the DMs.
This step aggregates the fuzzy weights’ matrices obtained from Equation (A9) using Equation (A10):
W ¯ i ˜ = 1 K ( W ˜ i 1 W ˜ i 2   W ˜ i k )
where W ¯ i ˜ is the combined fuzzified weight of the criterion i estimated by gathering the K number of DMs’ judgments. The combined fuzzy weights from Equation (A10) were used in Fuzzy-VIKOR for sustainbility ranking of pavement scenarios.

References

  1. Guo, M.; Liu, H.; Jiao, Y.; Mo, L.; Tan, Y.; Wang, D.; Liang, M. Effect of WMA-RAP technology on pavement performance of asphalt mixture: A state-of-the-art review. J. Clean. Prod. 2020, 266, 121704. [Google Scholar] [CrossRef]
  2. Xudong, H.; Yihua, N.; Yu, F.; Zheng, Q. Pavement performance of asphalt surface course containing reclaimed asphalt pavement (RAP). J. Test. Eval. 2012, 7, 1162–1168. [Google Scholar]
  3. Arshad, M. Laboratory investigations on the mechanical properties of cement treated RAP-natural aggregate blends used in base/subbase layers of pavements. Constr. Build. Mater. 2020, 254, 119234. [Google Scholar] [CrossRef]
  4. Saberi, F.; Fakhri, M.; Azami, A. Evaluation of warm mix asphalt mixtures containing reclaimed asphalt pavement and crumb rubber. J. Clean. Prod. 2017, 165, 1125–1132. [Google Scholar] [CrossRef]
  5. Al-Qraimi, S.; Hago, A.; Hassan, H. Recycling of reclaimed asphalt pavement in portland cement concrete. J. Eng. Res. 2009, 6, 37–45. [Google Scholar]
  6. Asphalt Recycling & Reclaiming Association. Basic Asphalt Recycling Manual; Federal Highway Adminstration: Washington, DC, USA, 2015.
  7. Giani, M.; Dotelli, G.; Brandini, N.; Zampori, L. Comparative life cycle assessment of asphalt pavements using reclaimed asphalt, warm mix technology and cold in-place recycling. Resour. Conserv. Recycl. 2015, 104 Pt A, 224–238. [Google Scholar] [CrossRef]
  8. Schwartz, C. Structural characteristics and environmental benefits of cold-recycled asphalt paving materials. In Proceedings of the National Pavement Preservation Conference, Nashville, TN, USA, 10–11 November 2016. [Google Scholar]
  9. Bhavsar, J. Comparing Cold In-Place Recycling (cir) and Cold In-Place Recycling with Expanded Asphalt Mixture (CIREAM). Master’s Thesis, University of Waterloo, Waterloo, ON, Canada, 2015. [Google Scholar]
  10. Kim, J.; Lee, H.; Jahren, C.; Heitzman, M.; Chen, D. Long-Term field performance of cold in-place recycled roads in iowa. J. Perform. Constr. Facil. 2010, 24, 265–274. [Google Scholar] [CrossRef]
  11. Kim, Y.; Lee, H.; Heitzman, M. Dynamic modulus and repeated load tests of cold in-place recycling mixtures using foamed asphalt. J. Mater. Civ. Eng. 2009, 21, 279–285. [Google Scholar] [CrossRef]
  12. Wang, H.; Zhao, Y.; Huang, X.; Pi, Y. Strength mechanism and influence factors for cold recycled asphalt mixture. Adv. Mater. Sci. Eng. 2015, 2015. [Google Scholar]
  13. Kim, Y.; Lee, H. Influence of reclaimed asphalt pavement temperature on mix design process of cold in-place recycling using foamed asphalt. J. Mater. Civ. Eng. 2011, 23, 961–968. [Google Scholar] [CrossRef]
  14. Ozer, H.; Al-Qadi, I.; Harvey, J. Strategies for Improving the Sustainability of Asphalt Pavements; FHWA-HIF-16-012; US Department of Transportation: Washington, DC, USA, 2016.
  15. Al-Jumaili, M.A.H. Sustainability of asphalt paving materials containing different waste materials. In IOP Conference Series: Materials Science and Engineering, Proceedings of the International Conference on Robotics and Mechantronics (ICRoM 2017), Hong Kong, China, 12–14 December 2017; IOP Publishing: Bristol, UK, 2018. [Google Scholar]
  16. Department of Public Roads; Los Angelos County. Cold In-Place Recycling (CIR). Available online: https://dpw.lacounty.gov/gmed/lacroads/treatmentcoldinplace.aspx (accessed on 13 December 2021).
  17. Highway Research Board. The AASHO Road Test. Report 5—Pavement Research; Highway Research Board, National Academy of Sciences, National Research Councel: Washington, DC, USA, 1962.
  18. Huang, Y. Pavement Analysis and Design; Prentice-Hall, Inc.: Englewood Cliffs, NJ, USA, 1993. [Google Scholar]
  19. AASHTO. AASHTO Guide for Design of Pavement Strucutres; AASHTO: Washington, DC, USA, 1993. [Google Scholar]
  20. Ministry of Transport and Logitics Services in KSA. Hot Mix Asphalt Design System Using SuperPave System; MOT: Riyadh, Saudi Arabia, 2006.
  21. Zhou, Q.; Okte, E.; Sen, S.; Ozer, H.; Al-Qadi, I.; Roesler, J.; Chatti, K. Development of a Life-Cycle Assessment Tool for Pavement Preservation and Maintenance on Flexible and Rigid Pavement; Center for Highway Pavement Preservation: East Lansing, MI, USA, 2019.
  22. Cross, S. Cold In-Place Recycling (CIR) Study; Federal Highway Administration: Lakewood, CO, USA, 2012.
  23. FDOT. Flexible Pavement Design Manual; Florida Department of Transportation: Tallahassee, FL, USA, 2020.
  24. Díaz-Sánchez, M.A.; Timm, D.H. Structural coefficients of cold central-plant recycled asphalt mixtures. J. Transp. Eng. 2017, 143 Pt A, 6. [Google Scholar] [CrossRef]
  25. Haider, H.; Ghumman, A.R.; Al-Salamah, I. Assessment framework for natural groundwater contamination in arid regions: Development of indices and wells ranking system using fuzzy VIKOR method. Water 2020, 12, 423. [Google Scholar] [CrossRef] [Green Version]
  26. Wang, C.-H.; Chou, M.-Y.; Pang, C.-T. Applying fuzzy analytic hierarchy process for evaluating service quality of online auction. Int. J. Comput. Inf. Eng. 2012, 6, 586–593. [Google Scholar]
  27. Opricovic, S. Multicriteria Optimization of Civil Engineering Systems. Ph.D. Thesis, Faculty of Civil Engineering of the University of Belgrade, Belgrade, Serbia, 2 January 1998; pp. 5–21. [Google Scholar]
  28. Opricovic, S. Fuzzy VIKOR with an application to water resources planning. Expert Syst. Appl. 2011, 38, 12983–12990. [Google Scholar] [CrossRef]
Figure 1. Study area and Cold in-place recycling (CIR) train, (a) Study area showing the open dumping at the asphalt disposal site in Buraydah, Qassim, (b) typical CIR train [16].
Coatings 12 00050 g001aCoatings 12 00050 g001b
Figure 2. A typical road cross section that shows its various layers.
Coatings 12 00050 g002
Figure 3. Satiability ranks for all scenarios defined in Table 3. The legend is showing the scenarios’ numbers for the very light traffic class only. The same color scheme is applicable to all traffic classes (also see Table 4).
Coatings 12 00050 g003
Table 1. ESALs and traffic designation [20].
Traffic ClassESALs RangeRoad GradesESALs Used in the Present Study
Very LightLess than 300,000Agricultural roads with light traffic, local and city streets without trucks 250,000
Light300,000 to 3 millionAgriculture, feeder, and collector roads 2,000,000
Medium3 million to 10 millionMain roads and city streets 7,000,000
Heavy10 million to 30 millionHighways and expressway20,000,000
Very HeavyMore than 30 millionHeavily trafficked highways and industrial areas31,000,000
Table 2. Resilient modulus and layer coefficients used in the present study.
No.Pavement LayerResilient Modulus (MR) aLayer Coefficient
1.HMA3500 MPa (507,632 PSI)assumed 0.44 b for asphalt concrete corresponds to E = 3500 MPa
2.CIR320 MPa (46,412 PSI)assumed 0.30 c corresponds to E = 320 MPa
3.Granular base200 MPa (29,000 PSI)calculated 0.13 from Equation (2) corresponds to E2 = 200 MPa
4.Granular sub-base100 MPa (14,500 PSI)calculated 0.11 from Equation (3) corresponds to E3 = 100 MPa
a [6,18,22,23,24]. b [18,23]. c [6,22,24].
Table 3. Pavement Structure of HMA and CIR Scenarios.
ScenarioTraffic ClassESALsThickness of Paving Layers (cm)C1: Construction Cost (SR/m3)C2: Natural Resource Depletion 1C3: Need of Adv. Equipment and Skilled Operators 2
Sub-Base Base Surface
A1.1: 0SB-15B-16HMAVery light250,000015931.9524L
A1.2: 0SB-15B-29CIRVery light250,0000151315.0715H
A2.1: 0SB-15B-16HMALight2,000,0000151651.5531L
A2.2: 0SB-15B-29CIRLight2,000,0000152321.4715H
A3.1: 0SB-15B-16HMAMedium7,000,0000152062.7535L
A3.2: 0SB-15B-29CIRMedium7,000,0000152925.3115H
A4.1: 0SB-15B-16HMAHeavy 20,000,0000152473.9539L
A4.2: 0SB-15B-29CIRHeavy20,000,0000153529.1515H
A5.1: 0SB-15B-16HMAVery heavy31,000,0000152679.5541L
A5.2: 0SB-15B-29CIRVery heavy31,000,0000153831.0715H
A1.3: 0SB-20B-19HMAVery light250,000020831.428L
A1.4: 0SB-20B-27CIRVery light250,0000201116.0420H
A2.3: 0SB-20B-19HMALight2,000,0000201448.234L
A2.4: 0SB-20B-27CIRLight2,000,0000202122.4420H
A3.3: 0SB-20B-19HMAMedium7,000,0000201962.239L
A3.4: 0SB-20B-27CIRMedium7,000,0000202726.2820H
A4.3: 0SB-20B-19HMAHeavy 20,000,0000202270.642L
A4.4: 0SB-20B-27CIRHeavy20,000,0000203330.1220H
A5.3: 0SB-20B-19HMAVery heavy31,000,000020257945L
A5.4: 0SB-20B-27CIRVery heavy31,000,0000203531.420H
A1.5: 10SB-20B-17HMAVery light250,0001020731.137L
A1.6: 10SB-20B-24CIRVery light250,0001020816.6230H
A1.5: 10SB-20B-17HMALight2,000,00010201245.142L
A1.6: 10SB-20B-24CIRLight2,000,00010201722.3830H
A3.5: 10SB-20B-17HMAMedium7,000,00010201759.147L
A3.6: 10SB-20B-24CIRMedium7,000,00010202426.8630H
A4.5: 10SB-20B-17HMAHeavy 20,000,00010202170.351L
A4.6: 10SB-20B-24CIRHeavy20,000,00010203030.730H
A5.5: 10SB-20B-17HMAVery heavy31,000,00010202273.152L
A5.6: 10SB-20B-24CIRVery heavy31,000,00010203231.9830H
A1.7: 20SB-20B-14HMAVery light250,0002020733.647L
A1.8: 20SB-20B-21CIRVery light250,0002020718.4840H
A2.7: 20SB-20B-14HMALight2,000,0002020104250L
A2.8: 20SB-20B-21CIRLight2,000,00020201422.9640H
A3.7: 20SB-20B-14HMAMedium7,000,00020201453.254L
A3.8: 20SB-20B-21CIRMedium7,000,00020202127.4440H
A4.7: 20SB-20B-14HMAHeavy 20,000,00020201864.458L
A4.8: 20SB-20B-21CIRHeavy20,000,00020202731.2840H
A4.9: 20SB-25B-13HMAVery heavy31,000,0002020207060L
A4.10: 20SB-25B-19CIRVery heavy31,000,00020202932.5640H
A1.9: 20SB-25B-13HMAVery light250,0002025735.8552L
A1.10: 20SB-25B-19CIRVery light250,0002025720.7345H
A2.9: 20SB-25B-13HMALight2,000,0002025838.6553L
A2.10: 20SB-25B-19CIRLight2,000,00020251223.9345H
A3.9: 20SB-25B-13HMAMedium7,000,00020251352.6558L
A3.10: 20SB-25B-19CIRMedium7,000,00020251928.4145H
A5.7: 20SB-20B-14HMAHeavy 20,000,00020251763.8562L
A5.8: 20SB-20B-21CIRHeavy20,000,00020252532.2545H
A5.9: 20SB-25B-13HMAVery heavy31,000,00020251969.4564L
A5.10: 20SB-25B-19CIRVery heavy31,000,00020252733.5345H
1 Total thickness of all layers for each scenario. 2 Subjective criteria.
Table 4. Scenarios for all traffic classes.
Very Light 1RankHeavyRank
A1.1: 0SB-15B-16HMA2A4.1: 0SB-15B-16HMA10
A1.2: 0SB-15B-29CIR1A4.2: 0SB-15B-29CIR1
A1.3: 0SB-20B-19HMA3A4.3: 0SB-20B-19HMA8
A1.4: 0SB-20B-27CIR7A4.4: 0SB-20B-27CIR4
A1.5: 10SB-20B-17HMA4A4.5: 10SB-20B-17HMA6
A1.6: 10SB-20B-24CIR5A4.6: 10SB-20B-24CIR2
A1.7: 20SB-20B-14HMA6A4.7: 20SB-20B-14HMA5
A1.8: 20SB-20B-21CIR10A4.8: 20SB-20B-21CIR7
A1.9: 20SB-25B-13HMA9A4.9: 20SB-25B-13HMA9
A1.10: 20SB-25B-19CIR8A4.10: 20SB-25B-19CIR3
LightVery Heavy
A2.1: 0SB-15B-16HMA9A5.1: 0SB-15B-16HMA9
A2.2: 0SB-15B-29CIR1A5.2: 0SB-15B-29CIR1
A2.3: 0SB-20B-19HMA8A5.3: 0SB-20B-19HMA10
A2.4: 0SB-20B-27CIR6A5.4: 0SB-20B-27CIR4
A2.5: 10SB-20B-17HMA3A5.5: 10SB-20B-17HMA5
A2.6: 10SB-20B-24CIR2A5.6: 10SB-20B-24CIR2
A2.7: 20SB-20B-14HMA4A5.7: 20SB-20B-14HMA6
A2.8: 20SB-20B-21CIR10A5.8: 20SB-20B-21CIR7
A2.9: 20SB-25B-13HMA7A5.9: 20SB-25B-13HMA8
A2.10: 20SB-25B-19CIR5A5.10: 20SB-25B-19CIR3
Medium
A3.1: 0SB-15B-16HMA9
A3.2: 0SB-15B-29CIR1
A3.3: 0SB-20B-19HMA10
A3.4: 0SB-20B-27CIR4
A3.5: 10SB-20B-17HMA6
A3.6: 10SB-20B-24CIR2
A3.7: 20SB-20B-14HMA5
A3.8: 20SB-20B-21CIR7
A3.9: 20SB-25B-13HMA8
A3.10: 20SB-25B-19CIR3
1 SB: Sub-base, B: Base, HMA: Hot Mix Asphalt, and CIR: Cold In-place Recycling.
Table 5. Example of scoring matrix for nine scenarios (No. 10 not included due to space limitations) for medium traffic class.
CriteriaA3.1: 0SB-15B-16HMAA3.2: 0SB-15B-29CIRA3.3: 0SB-20B-19HMAA3.4: 0SB-20B-27CIRA3.5: 10SB-20B-17HMAA3.6: 10SB-20B-24CIRA3.7: 20SB-20B-14HMAA3.8: 20SB-20B-21CIRA3.9: 20SB-25B-13HMA
lmrlmrlmrlmrlmrlmrlmrlmrlmr
f1 = CC57.7562.7567.7520.3125.3130.3157.262.267.221.2826.2831.2854.159.164.121.8626.8631.8648.253.258.222.4427.4432.4447.6552.6557.65
f2 = RC303540101520343944152025424752253035495459354045535863
f3 = EC1238910123891012389101238910123
f1+101520101520101520101520101520101520101520101520101520
f1−758085758085758085758085758085758085758085758085758085
ri o − li *757575757575757575757575757575757575757575757575757575
dij=0.5030.6370.7700.0040.1370.2710.4960.6290.7630.0170.1500.2840.4550.5880.7210.0250.1580.2910.3760.5090.6430.0330.1660.2990.3690.5020.635
f2+101520101520101520101520101520101520101520101520101520
f2−606570606570606570606570606570606570606570606570606570
ri * − li o606060606060606060606060606060606060606060606060606060
dij =0.1670.3330.500−0.170.0000.1670.2330.4000.567−0.0830.0830.2500.3670.5330.7000.0830.2500.4170.4830.6500.8170.2500.4170.5830.5500.7170.883
f3+123123123123123123123123123
f3−891089108910891089108910891089108910
ri o − li *999999999999999999999999999
dij=−0.220.0000.2220.5560.7781.000−0.220.0000.2220.5560.7781.000−0.220.0000.2220.5560.7781.000−0.220.0000.2220.5560.7781.000−0.220.0000.222
Table 6. Ranking of pavement scenarios (No. 10 not included due to space limitations) using fuzzy-VIKOR.
A3.1: 0SB-15B-16HMAA3.2: 0SB-15B-29CIRA3.3: 0SB-20B-19HMAA3.4: 0SB-20B-27CIRA3.5: 10SB-20B-17HMAA3.6: 10SB-20B-24CIRA3.7: 20SB-20B-14HMAA3.8: 20SB-20B-21CIRA3.9: 20SB-25B-13HMA
lmrlmrlmrlmrlmrlmrlmrlmrlmr
Sj0.2230.4450.6550.0570.2110.3910.2360.4590.6690.0820.2400.4230.2500.4720.6810.1260.2900.4750.2430.4590.6660.1690.3390.5270.2560.4730.680
Sj Crisp0.440.220.460.250.470.290.460.340.47
Rj0.5030.6370.7700.0040.1370.2710.4960.6290.7630.5560.7781.000−0.220.0000.2220.0250.1580.291−0.220.0000.2220.5560.7781.0000.3690.5020.635
Rj Crisp0.640.140.630.780.000.160.000.780.50
Qj−0.100.4240.909−0.4170.0370.492−0.090.4370.922−0.240.2440.724−0.270.2790.788−0.340.1270.586−0.280.2660.771−0.150.3490.835−0.110.4170.899
Qj Crisp0.4140.0370.4260.2430.2680.1260.2560.3470.407
Publisher’s Note: MDPI stays neutral with regard to jurisdictional claims in published maps and institutional affiliations.

