
Effect of Thermal Management Approaches on Geometry and Productivity of Thin-Walled Structures of ER 5356 Built by Wire + Arc Additive Manufacturing

 and
and
Abstract
:1. Introduction
2. Materials and Methods
3. Results and Discussion
4. Conclusions
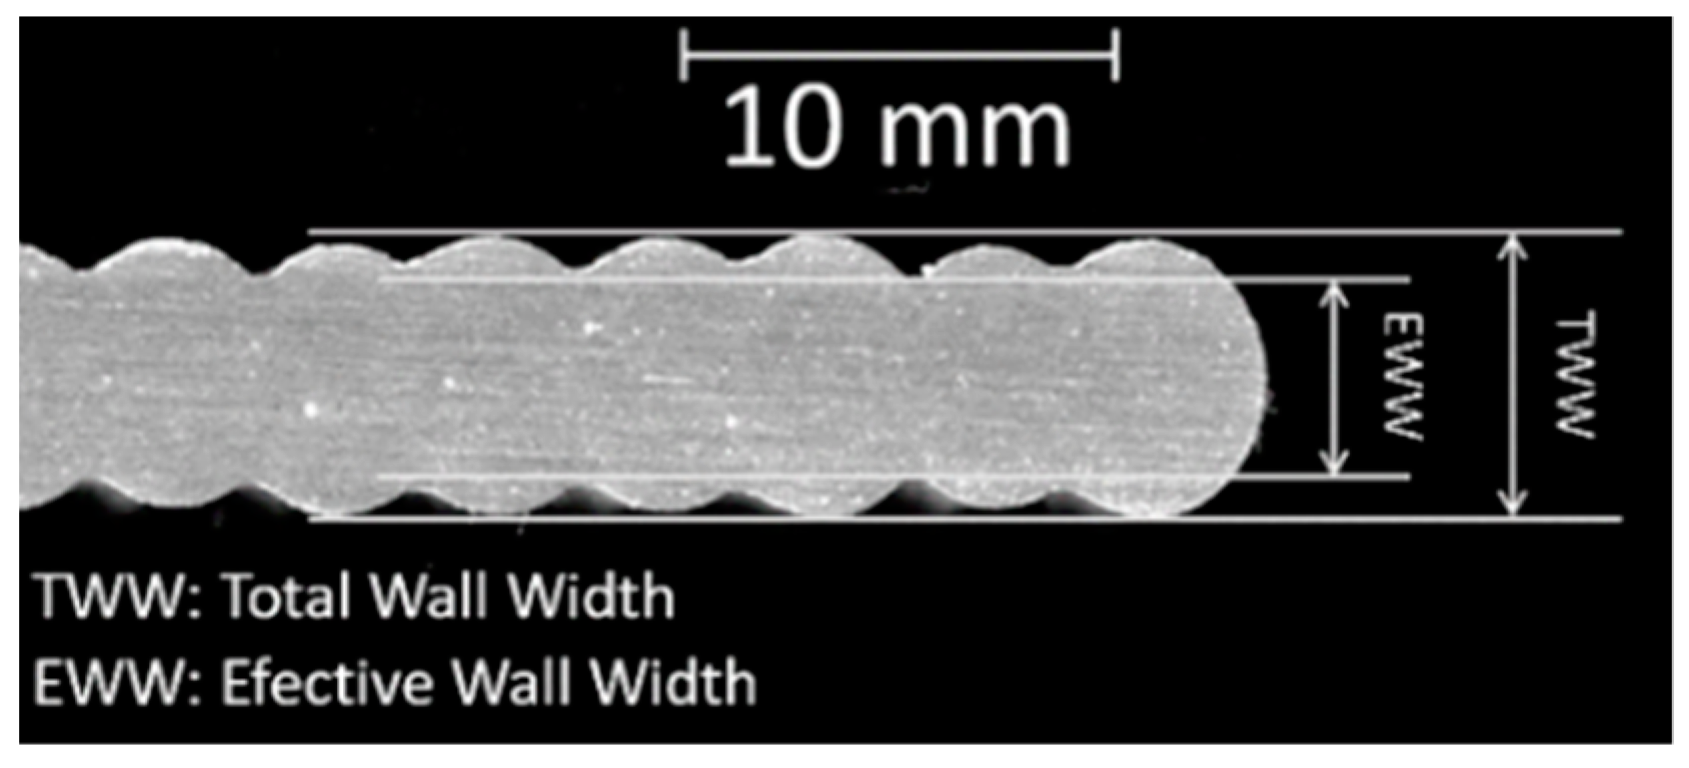
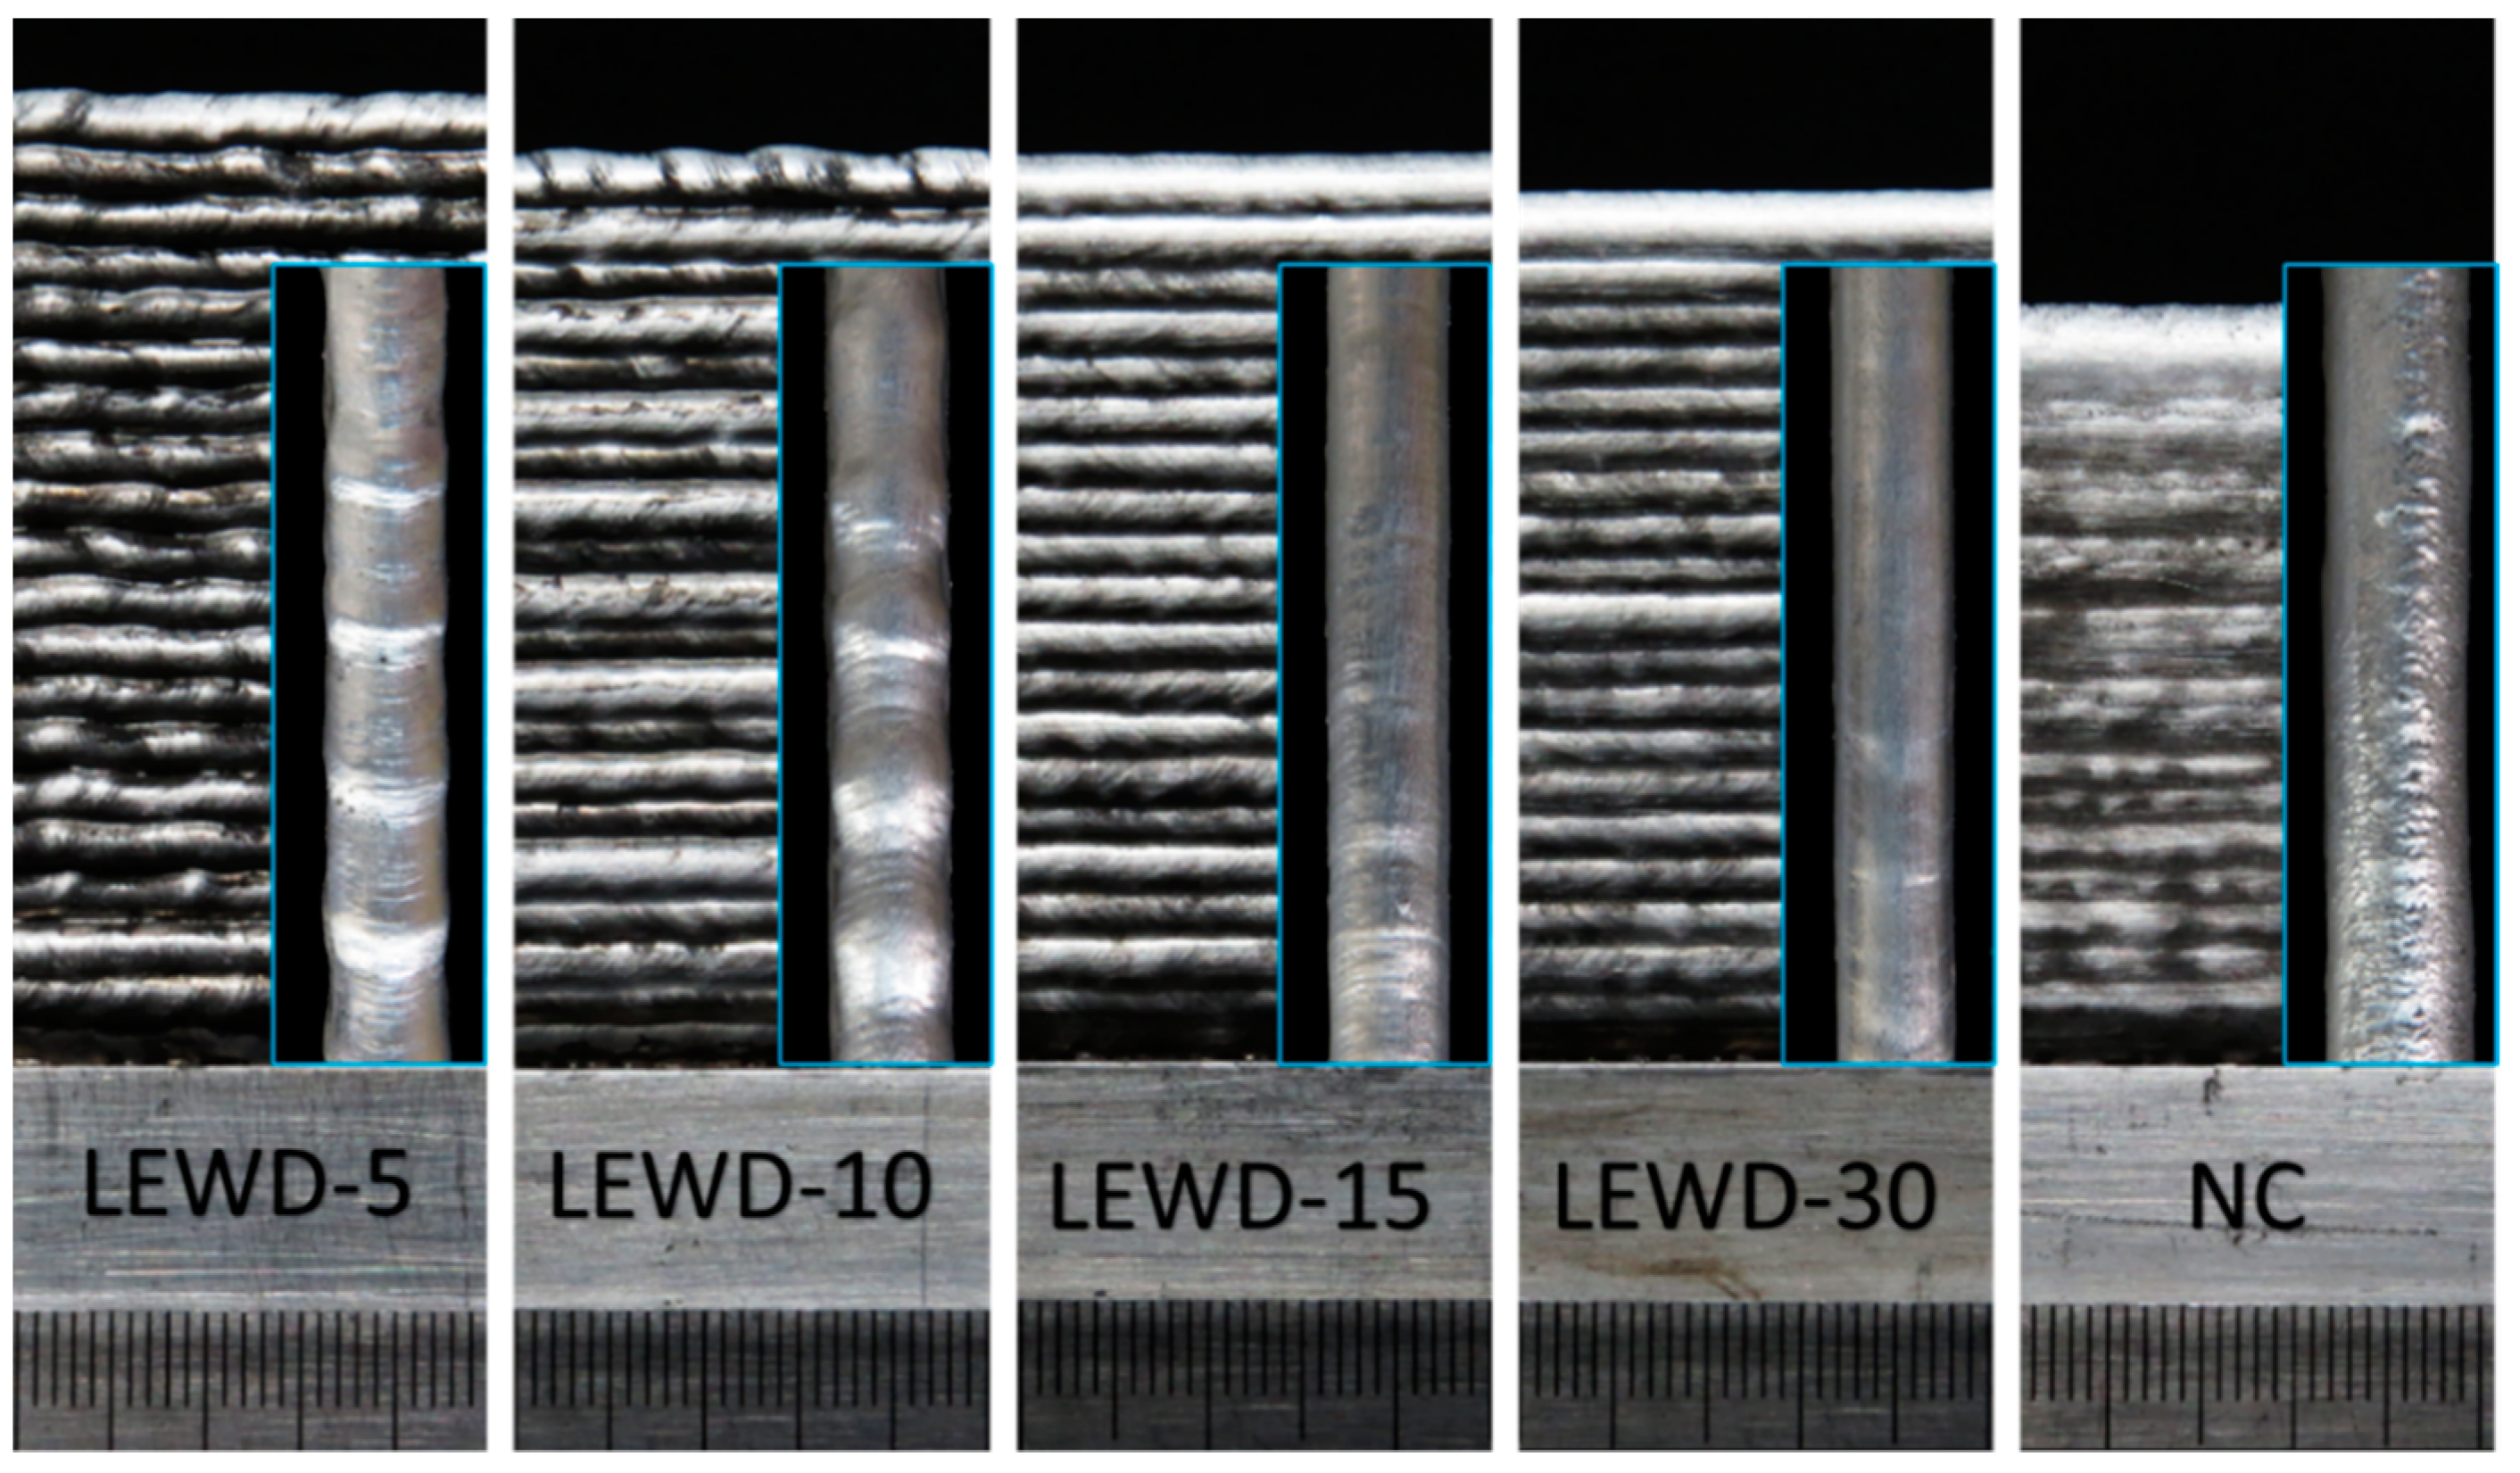
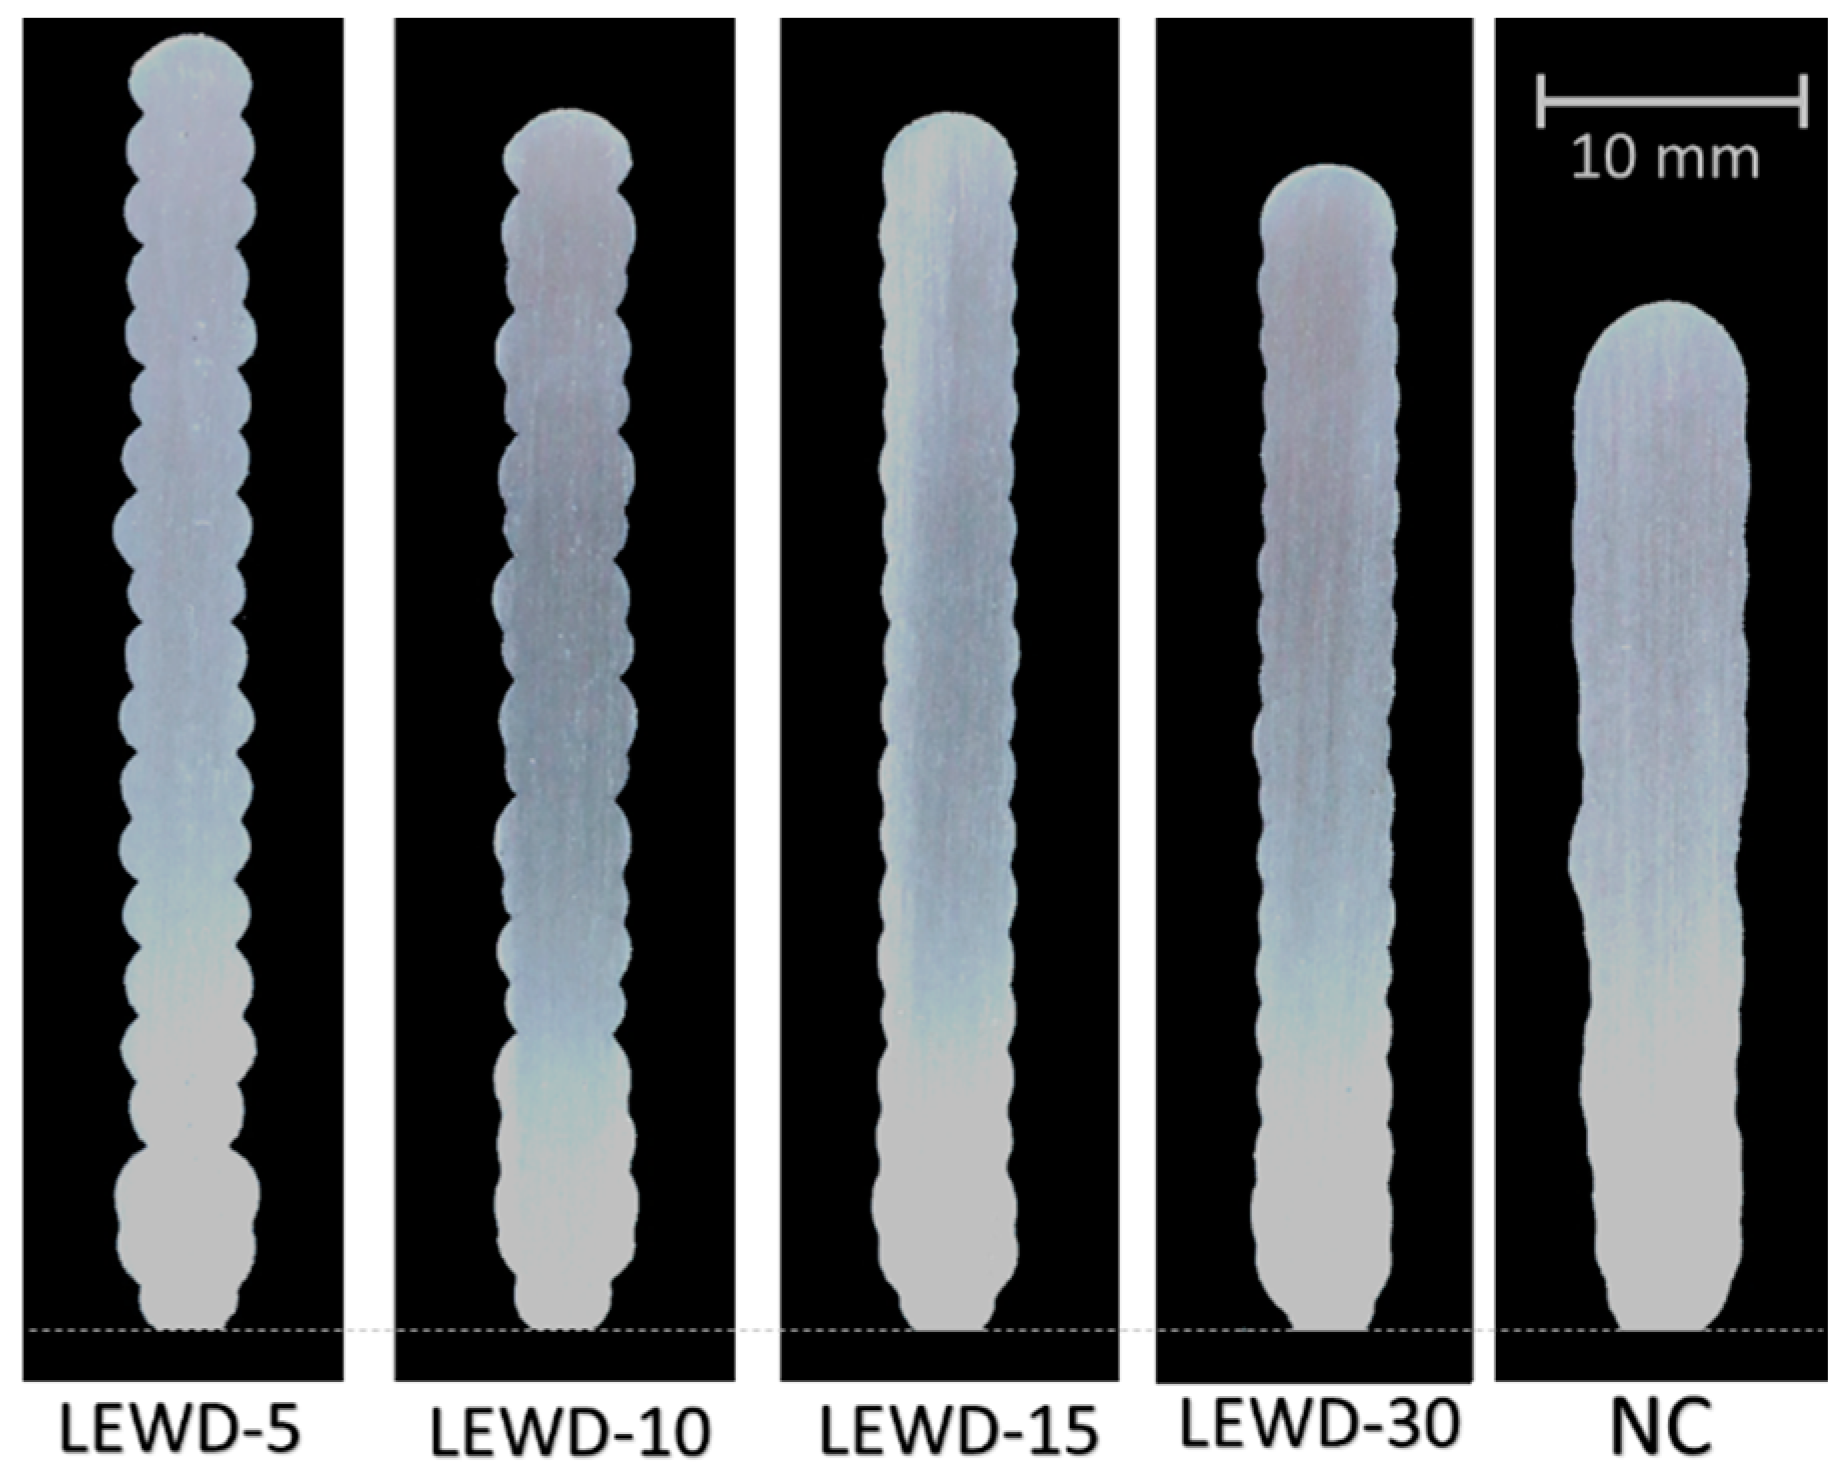
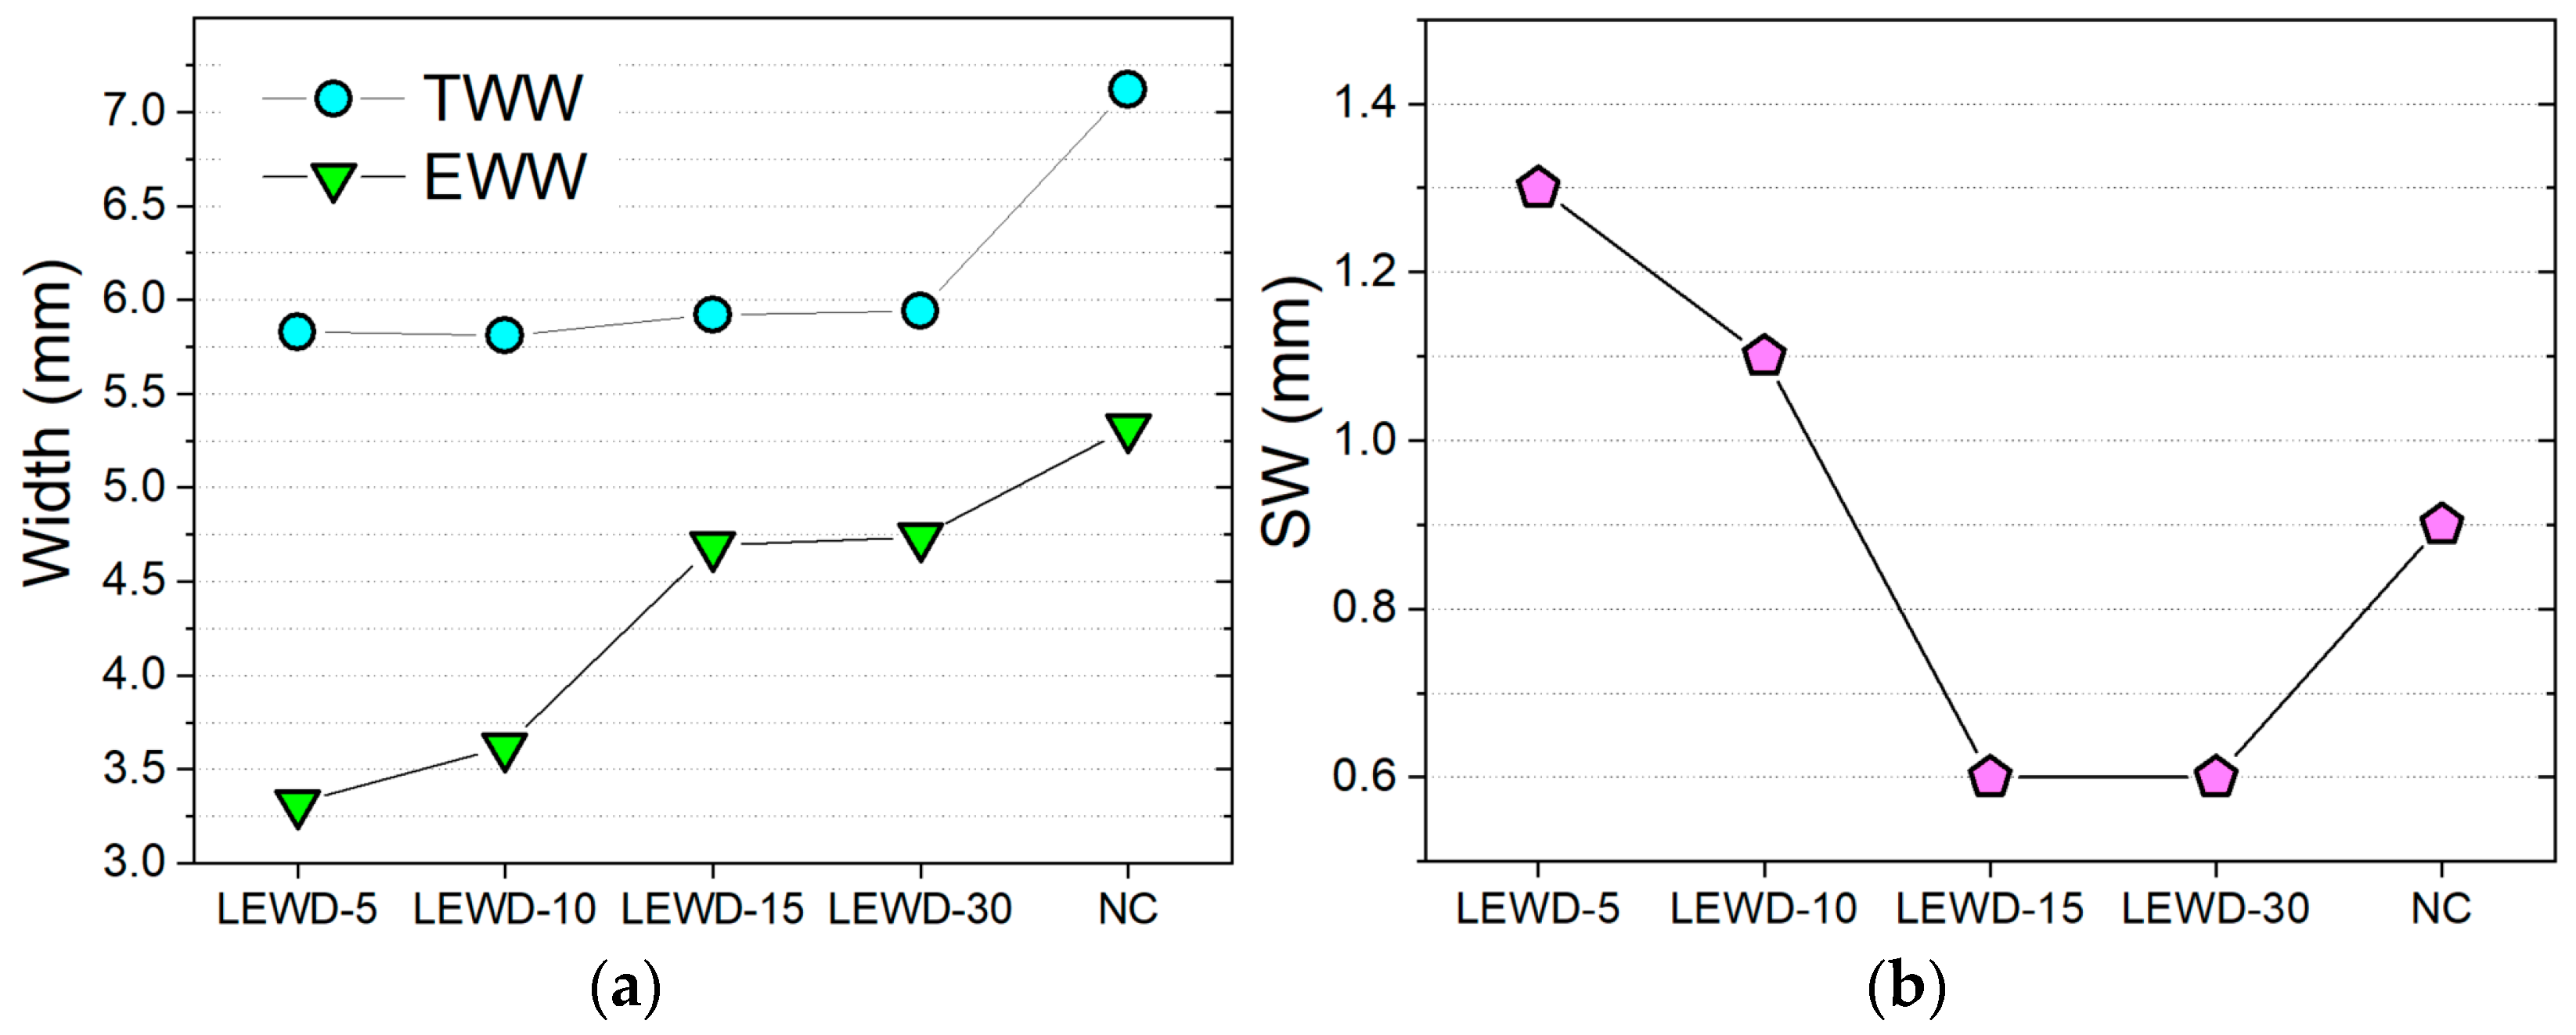
- The LEWD variation had no significant effect on the total width of the walls, while their effective width values increased and surface waviness levels reduced with increasing LEWD values;
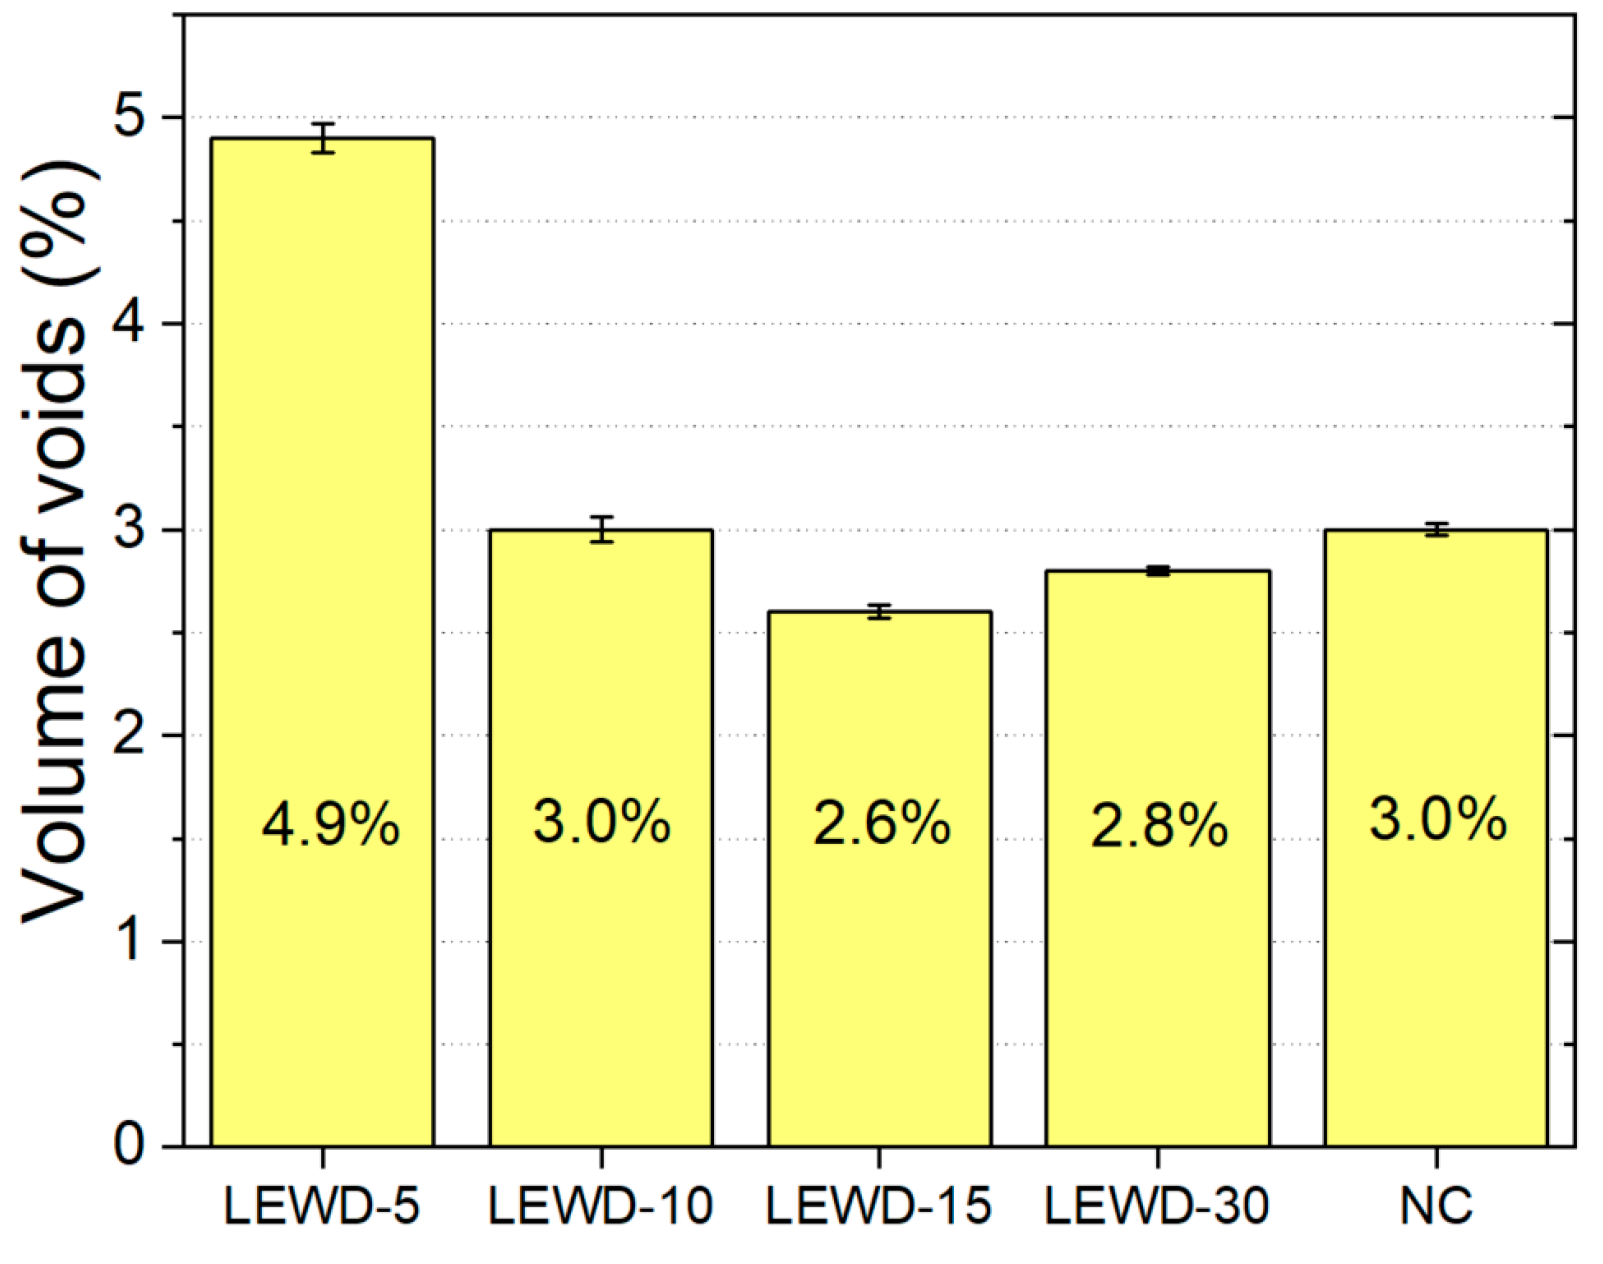
- In general, the porosity level was in accordance with the numbers reported in the current literature, despite the fact it tends to significantly increase with LEWD values below 10 mm;
- In terms of geometry and porosity, the walls deposited under the NIAC technique with LEWD values between 15 and 20 mm showed more adequate results for the arc energy level (82 J/mm) and material (ER 5356) employed;
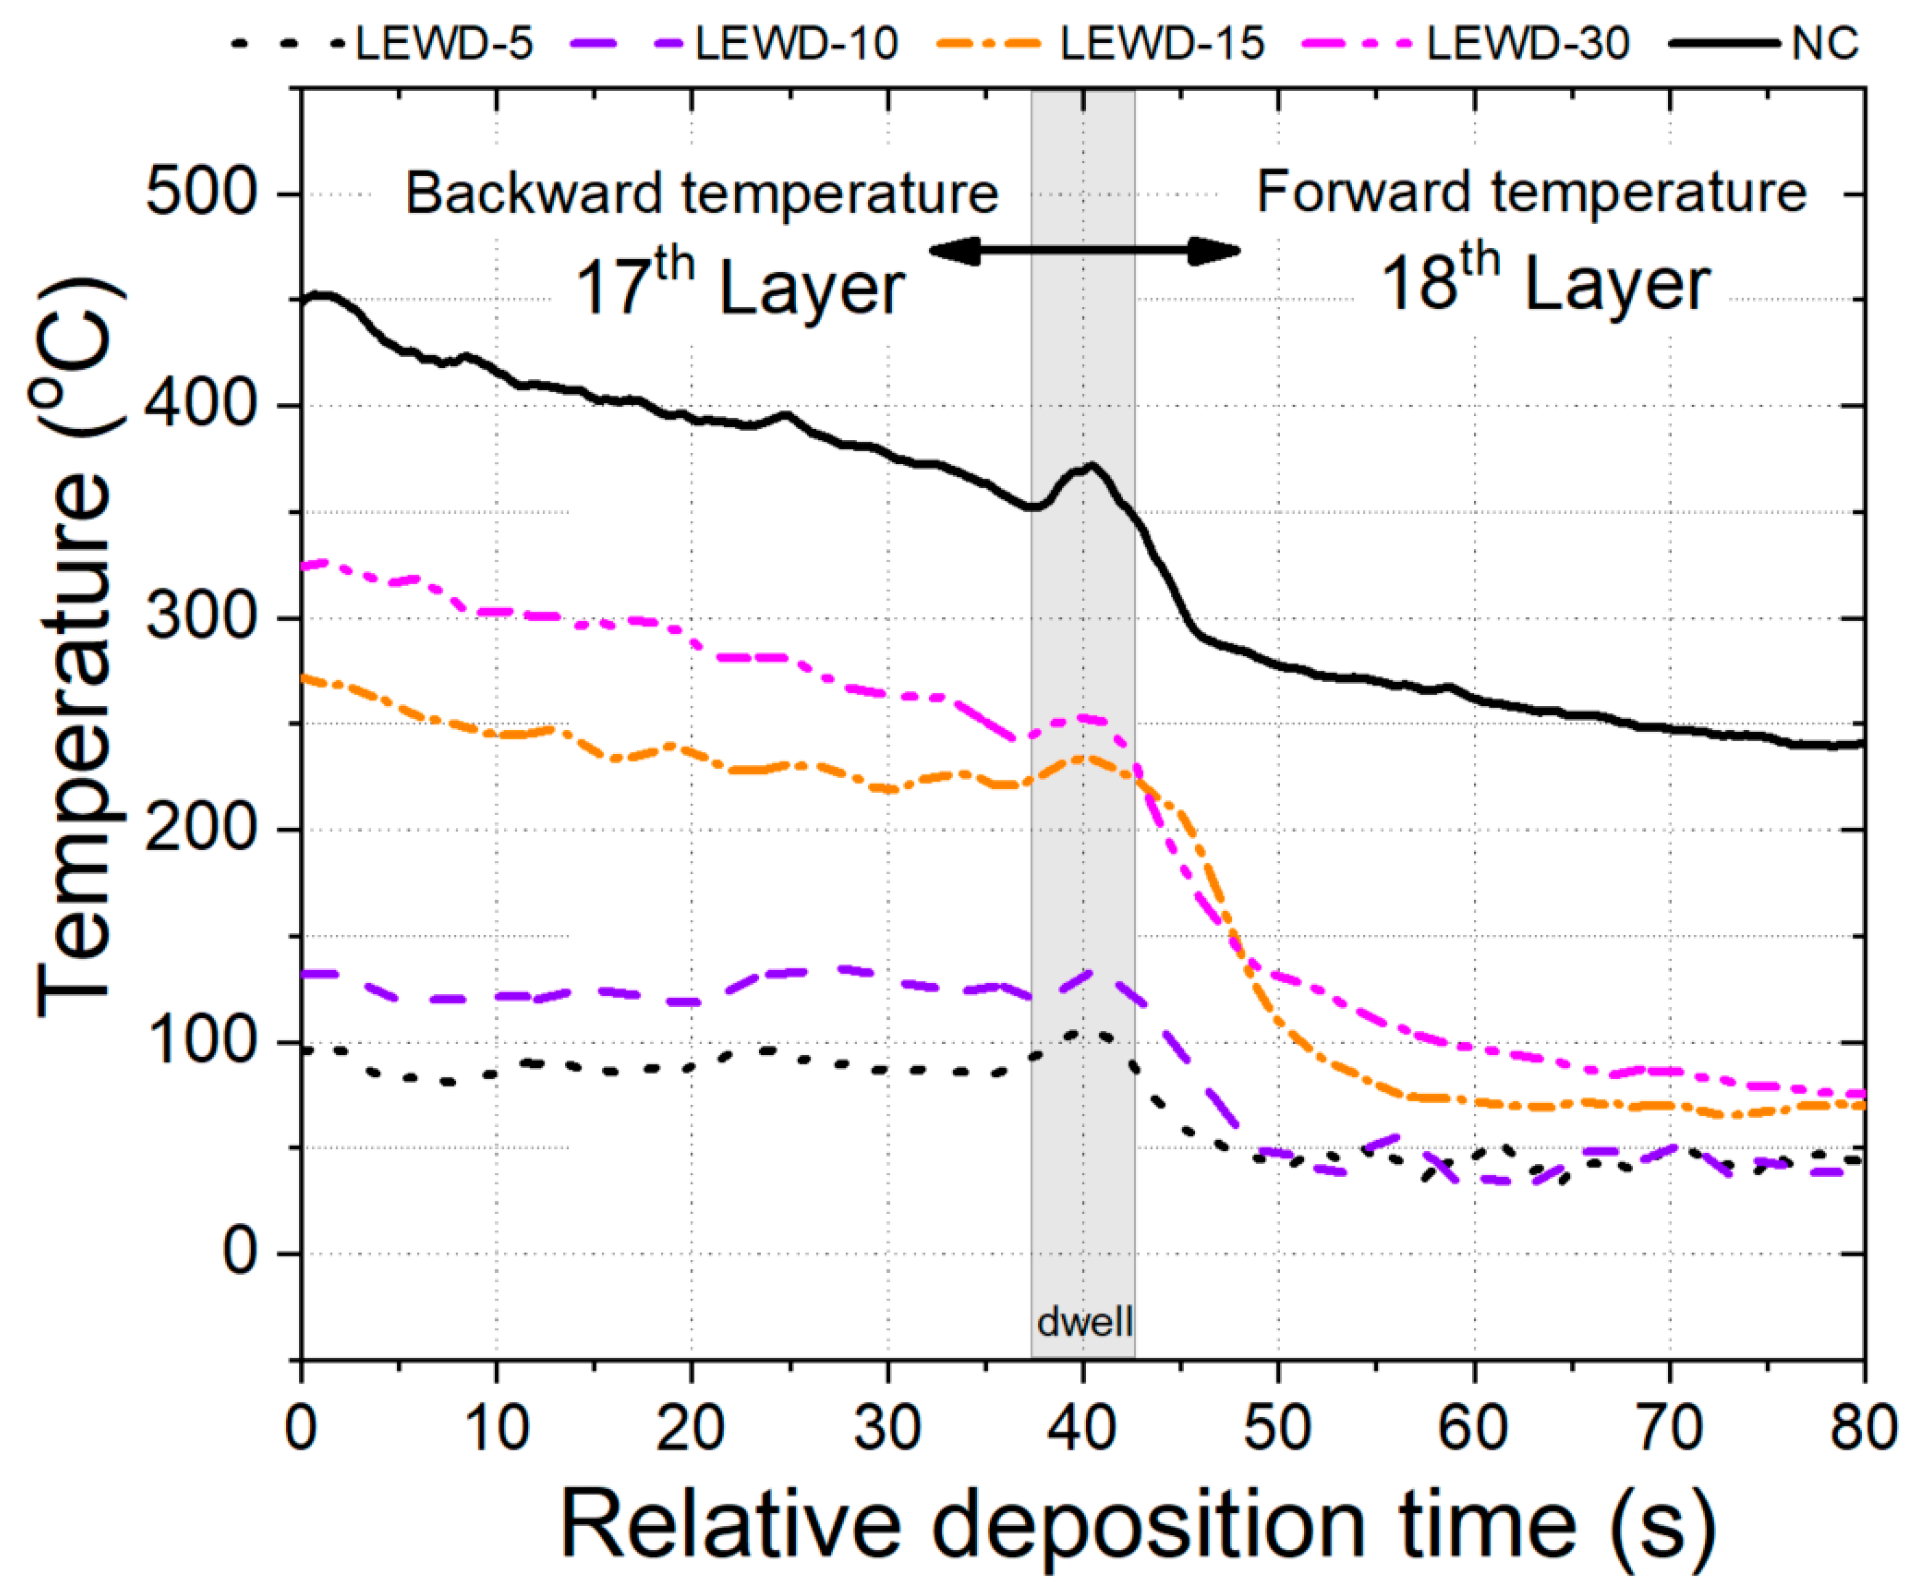
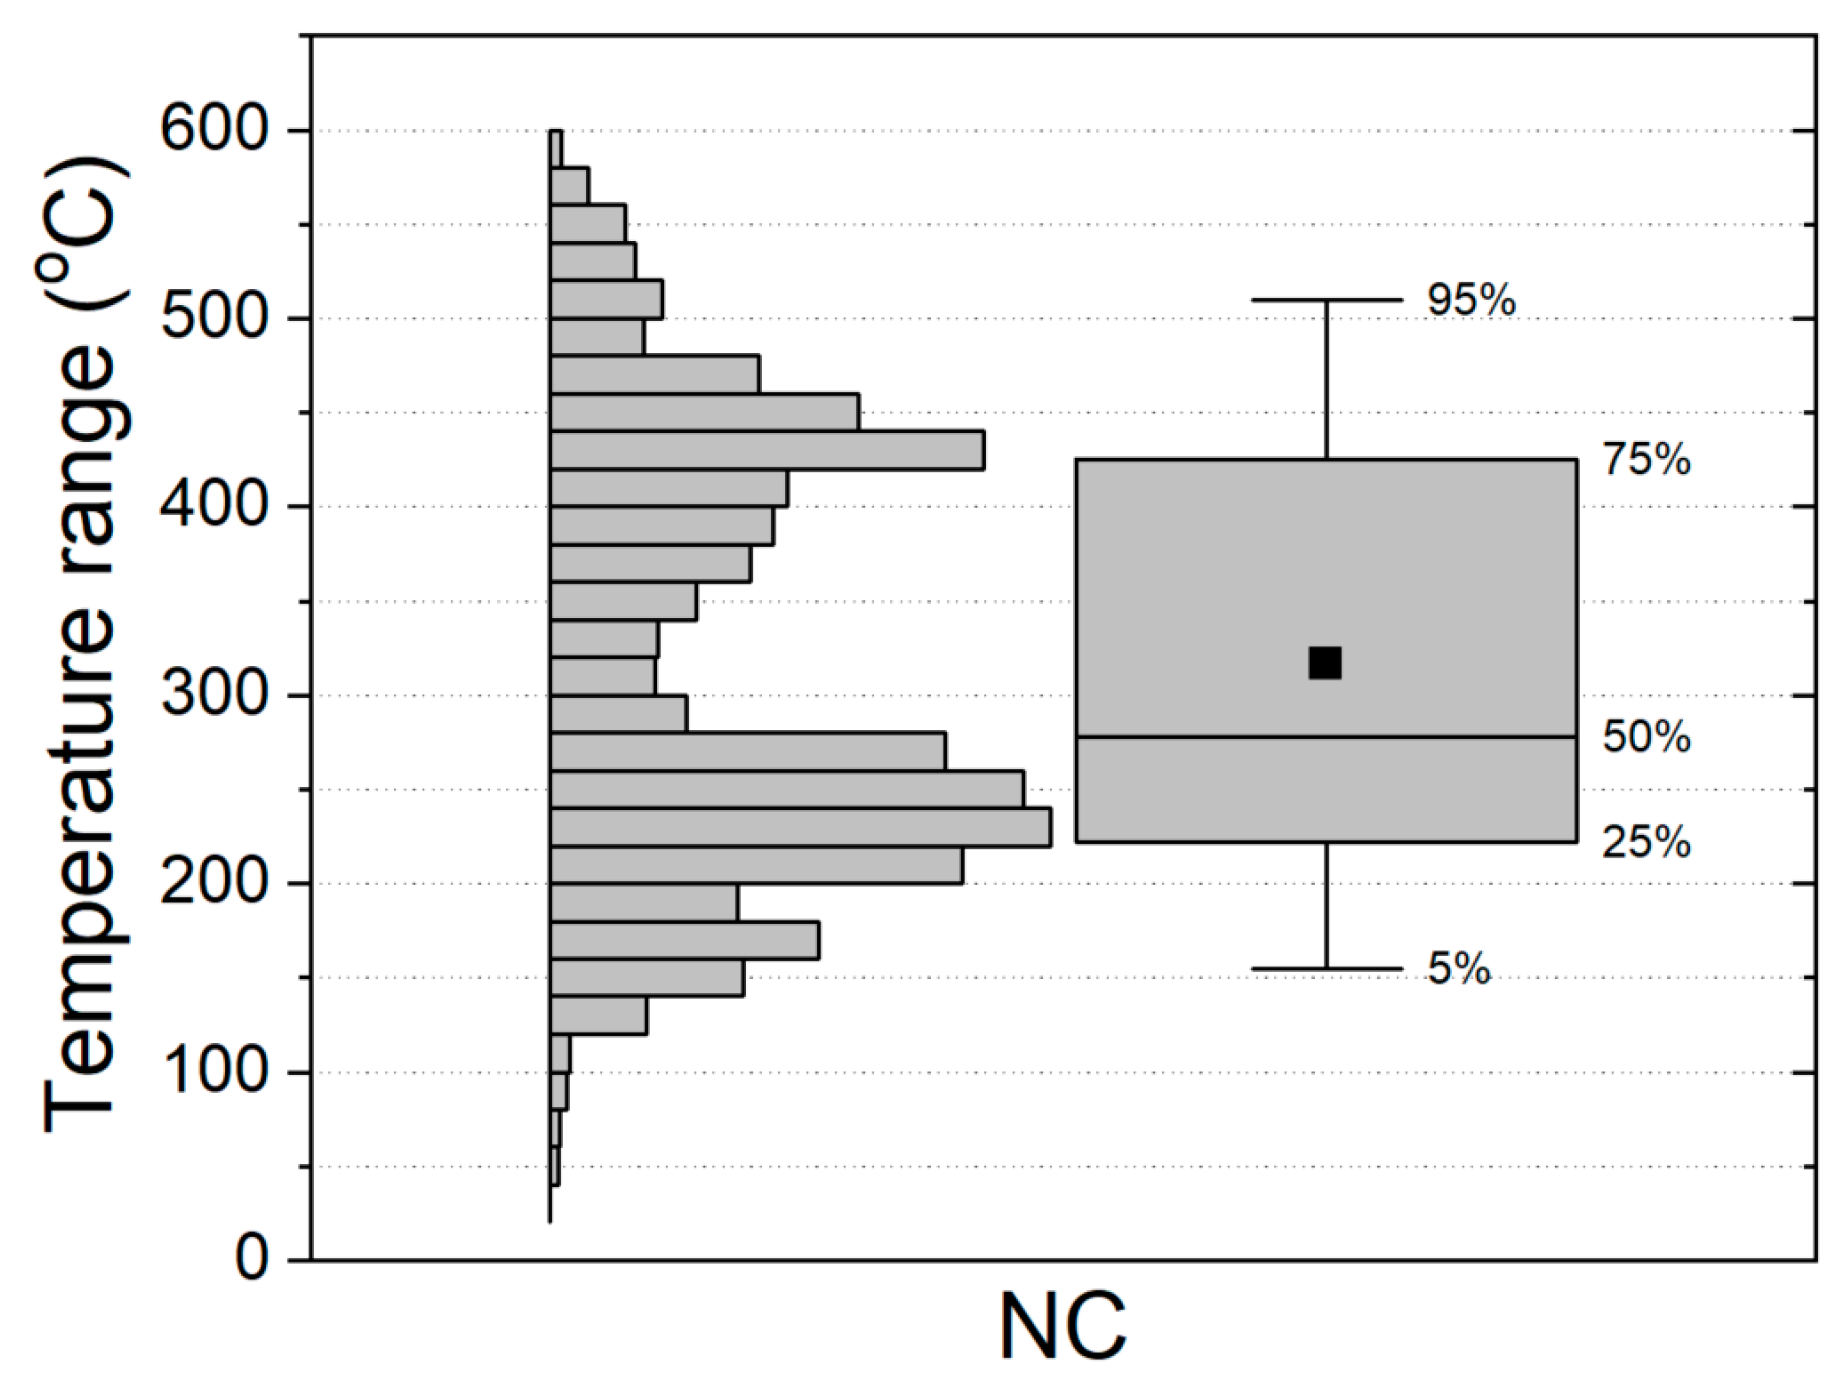
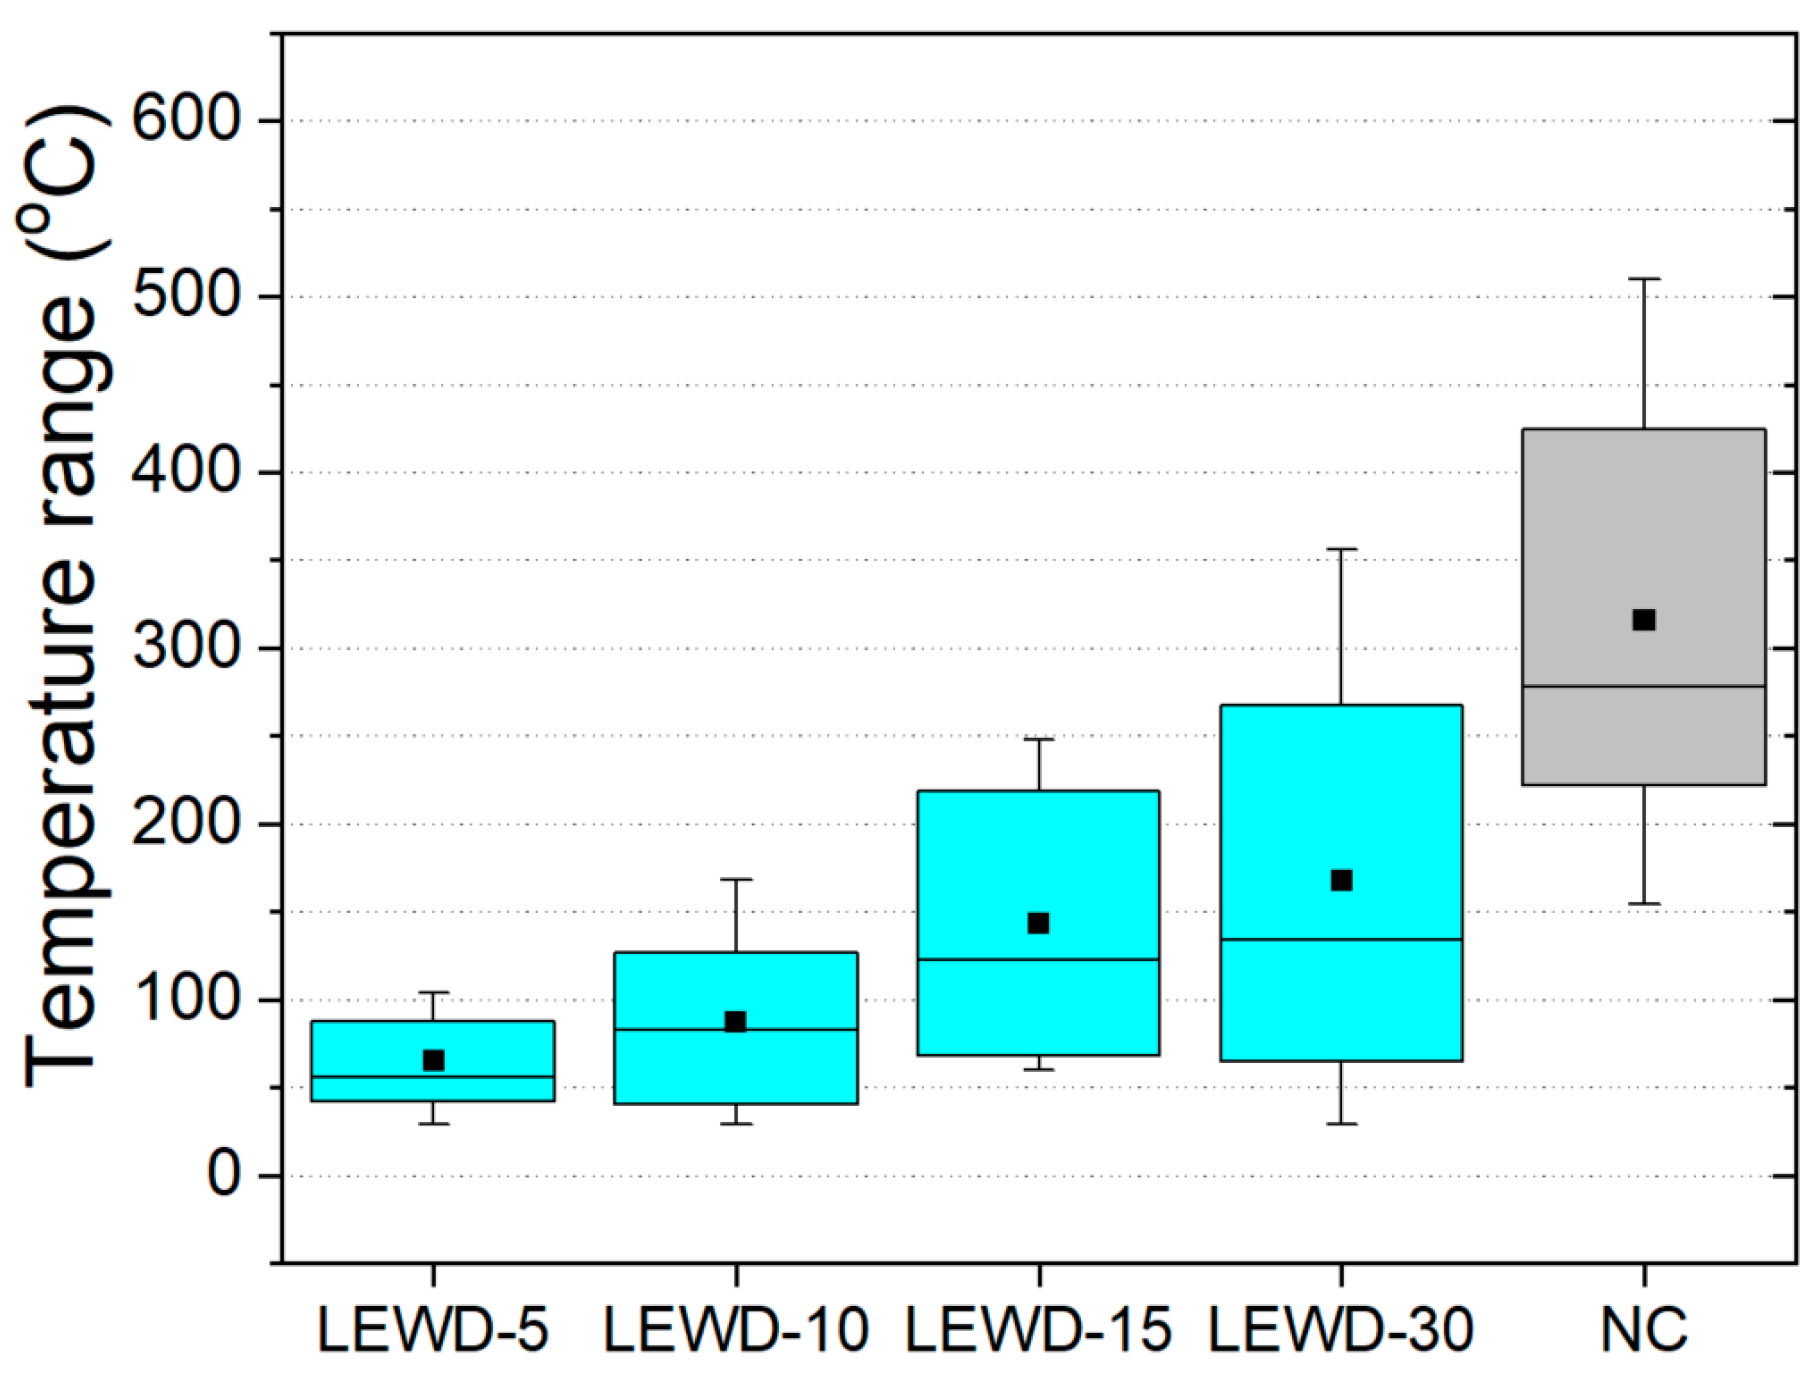
- The temperature data from the trailing/leading IR pyrometer extracted during the deposition time tend to fit a bimodal distribution, being the first quartile (Q1) representative of the interpass temperature;
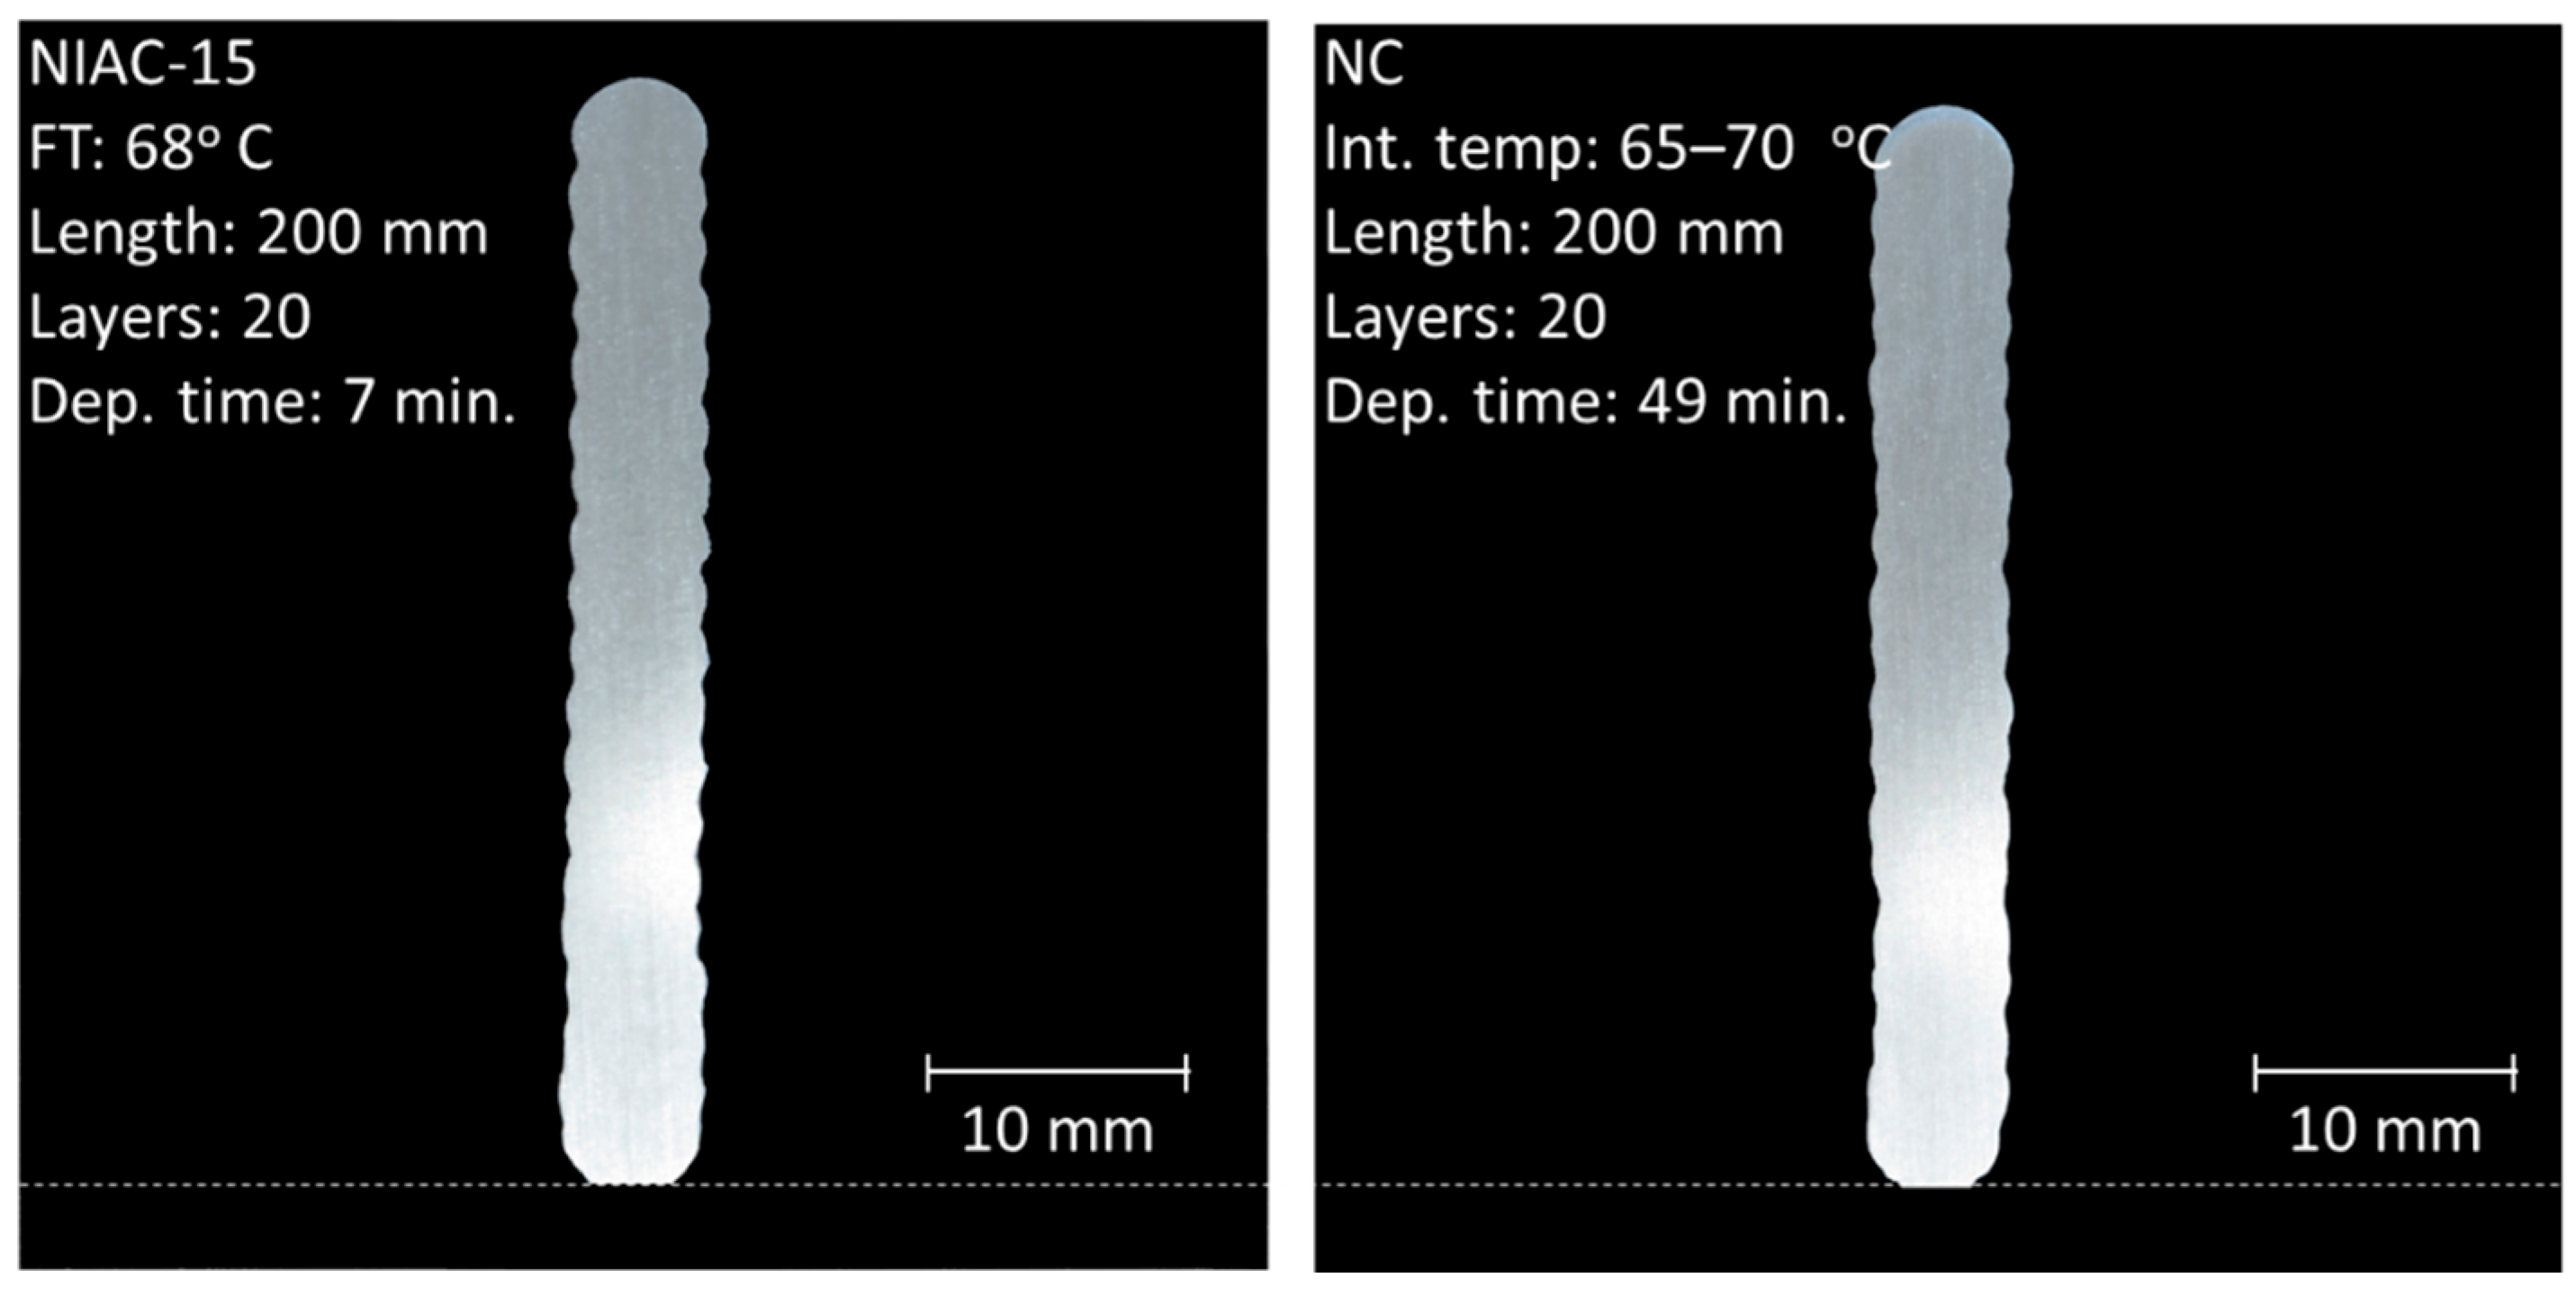
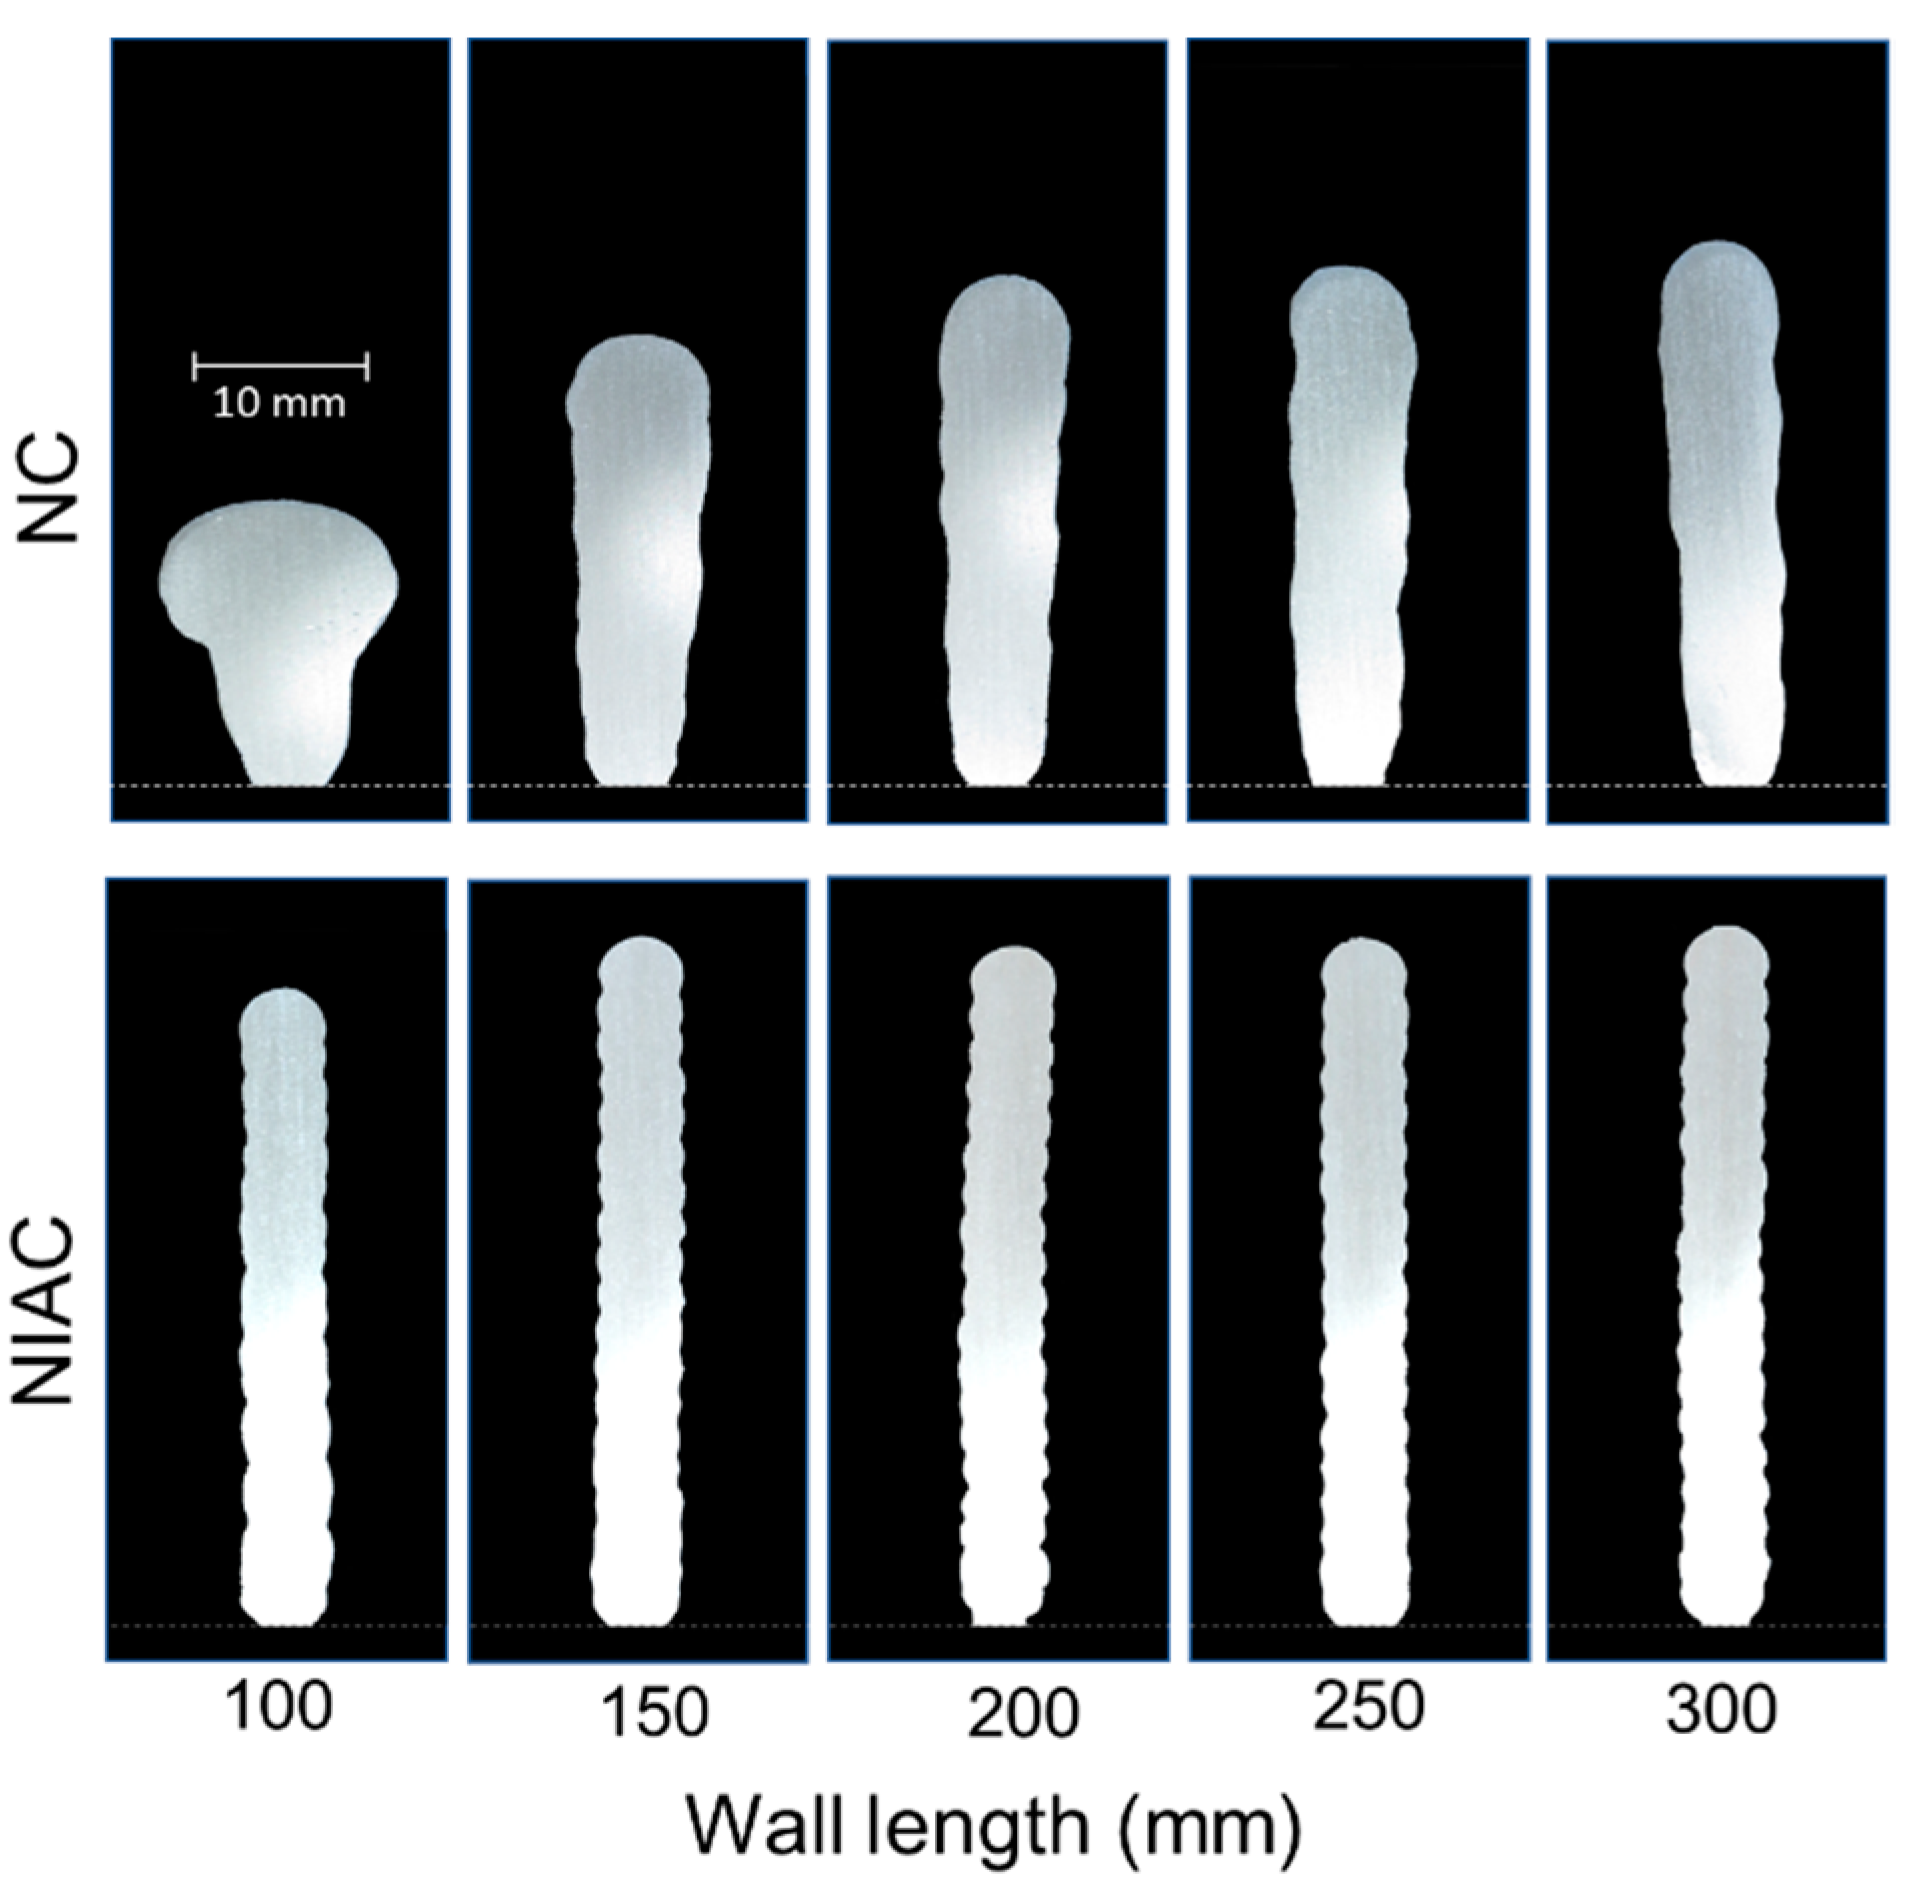
- Thin-walled structures built with the NIAC and NC approaches can assume quite similar geometries if equivalent interpass temperatures are applied, but the total deposition time with the latter approach is significantly extended due to the need for long interpass dwell time;
- The NIAC technique has been demonstrated as able to cope with the heat accumulation due to deposition concentration, and being capable of aiding continuous building of small components and/or features by WAAM.
Author Contributions
Funding
Institutional Review Board Statement
Informed Consent Statement
Data Availability Statement
Acknowledgments
Conflicts of Interest
References
- ASTM. ASTM F3187-16-Standard Guide for Directed Energy Deposition of Metals; ASTM International: West Conshohocken, PA, USA, 2016; pp. 1–22. [Google Scholar] [CrossRef]
- TWI. Which is Important—Preheat or Interpass? Frequently Asked Questions. 2021. Available online: https://www.twi-global.com/technical-knowledge/faqs/faq-which-is-important-preheat-or-interpass (accessed on 23 August 2021).
- da Silva, L.J.; Reis, R.P.; Scotti, A. The potential of IR pyrometry for monitoring interpass temperature in wire + arc additive manufacturing. Evol. Mech. Eng. 2019, 3, 1–4. [Google Scholar] [CrossRef]
- Wu, B.; Ding, D.; Pan, Z.; Cuiuri, D.; Li, H.; Han, J.; Fei, Z. Effects of heat accumulation on the arc characteristics and metal transfer behavior in wire arc additive manufacturing of Ti6Al4V. J. Mater. Process. Technol. 2017, 250, 304–312. [Google Scholar] [CrossRef]
- Hagqvist, P.; Sikström, F.; Christiansson, A.-K. Emissivity estimation for high temperature radiation pyrometry on Ti–6Al–4V. Measurement 2013, 46, 871–880. [Google Scholar] [CrossRef]
- Da Silva, L.J.; Souza, D.M.; De Araújo, D.B.; Reis, R.P.; Scotti, A. Concept and validation of an active cooling technique to mitigate heat accumulation in WAAM. Int. J. Adv. Manuf. Technol. 2020, 107, 2513–2523. [Google Scholar] [CrossRef]
- Henckell, P.; Günther, K.; Ali, Y.; Bergmann, J.P.; Scholz, J.; Forêt, P. The Influence of Gas Cooling in Context of Wire Arc Additive Manufacturing—A Novel Strategy of Affecting Grain Structure and Size. In TMS 2017 146th Annual Meeting & Exhibition Supplemental; Springer: Cham, Germany, 2017; pp. 147–156. [Google Scholar] [CrossRef]
- Cunningham, C.; Dhokia, V.; Shokrani, A.; Newman, S. Effects of in-process LN2 cooling on the microstructure and mechanical properties of type 316L stainless steel produced by wire arc directed energy deposition. Mater. Lett. 2021, 282, 128707. [Google Scholar] [CrossRef]
- Xu, X.; Ding, J.; Ganguly, S.; Diao, C.; Williams, S. Oxide accumulation effects on wire + arc layer-by-layer additive manufacture process. J. Mater. Process. Technol. 2018, 252, 739–750. [Google Scholar] [CrossRef]
- Williams, S.W.; Martina, F.; Addison, A.C.; Ding, J.; Pardal, G.; Colegrove, P. Wire + Arc Additive Manufacturing. Mater. Sci. Technol. 2016, 32, 641–647. [Google Scholar] [CrossRef] [Green Version]
- Lei, Y.; Xiong, J.; Li, R. Effect of inter layer idle time on thermal behavior for multi-layer single-pass thin-walled parts in GMAW-based additive manufacturing. Int. J. Adv. Manuf. Technol. 2018, 96, 1355–1365. [Google Scholar] [CrossRef]
- Lu, X.; Zhou, Y.F.; Xing, X.L.; Shao, L.Y.; Yang, Q.X.; Gao, S.Y. Open-source wire and arc additive manufacturing system: Formability, microstructures, and mechanical properties. Int. J. Adv. Manuf. Technol. 2017, 93, 2145–2154. [Google Scholar] [CrossRef]
- Wang, H.; Jiang, W.; Ouyang, J.-H.; Kovacevic, R. Rapid prototyping of 4043 Al-alloy parts by VP-GTAW. J. Mater. Process. Technol. 2004, 148, 93–102. [Google Scholar] [CrossRef]
- Xiong, J.; Zhang, G.; Qiu, Z.; Li, Y. Vision-sensing and bead width control of a single-bead multi-layer part: Material and energy savings in GMAW-based rapid manufacturing. J. Clean. Prod. 2013, 41, 82–88. [Google Scholar] [CrossRef]
- Wu, B.; Pan, Z.; Ding, D.; Cuiuri, D.; Li, H.; Fei, Z. The effects of forced interpass cooling on the material properties of wire arc additively manufactured Ti6Al4V alloy. J. Mater. Process. Technol. 2018, 258, 97–105. [Google Scholar] [CrossRef] [Green Version]
- Ma, C.; Li, C.; Yan, Y.; Liu, Y.; Wu, X.; Li, D.; Han, Y.; Jin, H.; Zhang, F. Investigation of the in-situ gas cooling of carbon steel during wire and arc additive manufacturing. J. Manuf. Process. 2021, 67, 461–477. [Google Scholar] [CrossRef]
- Scotti, F.M.; Teixeira, F.R.; Da Silva, L.J.; De Araújo, D.B.; Reis, R.P.; Scotti, A. Thermal management in WAAM through the CMT advanced process and an active cooling technique. J. Manuf. Process. 2020, 57, 23–35. [Google Scholar] [CrossRef]
- Teixeira, F.R.; Scotti, F.M.; Reis, R.P.; Scotti, A. Effect of the CMT advanced process combined with an active cooling technique on macro and microstructural aspects of aluminum WAAM. Rapid Prototyp. J. 2021, 27, 1206–1219. [Google Scholar] [CrossRef]
- R Rosli, N.A.; Alkahari, M.R.; bin Abdollah, M.F.; Maidin, S.; Ramli, F.R.; Herawan, S.G. Review on effect of heat input for wire arc additive manufacturing process. J. Mater. Res. Technol. 2021, 11, 2127–2145. [Google Scholar] [CrossRef]
- da Silva, L.; Teixeira, F.; Araújo, D.; Reis, R.; Scotti, A. Work envelope expansion and parametric optimization in WAAM with relative density and surface aspect as quality constraints: The case of Al5Mg thin walls with active cooling. J. Manuf. Mater. Process. 2021, 5, 40. [Google Scholar] [CrossRef]
- Martina, F.; Mehnen, J.; Williams, S.; Colegrove, P.; Wang, F. Investigation of the benefits of plasma deposition for the additive layer manufacture of Ti–6Al–4V. J. Mater. Process. Technol. 2012, 212, 1377–1386. [Google Scholar] [CrossRef] [Green Version]
- Ríos, S.; Colegrove, P.; Martina, F.; Williams, S.W. Analytical process model for wire + arc additive manufacturing. Addit. Manuf. 2018, 21, 651–657. [Google Scholar] [CrossRef]
- Ryan, E.; Sabin, T.; Watts, J.; Whiting, M. The influence of build parameters and wire batch on porosity of wire and arc additive manufactured aluminium alloy 2319. J. Mater. Process. Technol. 2018, 262, 577–584. [Google Scholar] [CrossRef]
- Da Silva, C.L.M.; Scotti, A. The influence of double pulse on porosity formation in aluminum GMAW. J. Mater. Process. Technol. 2006, 171, 366–372. [Google Scholar] [CrossRef]
- Toda, H.; Hidaka, T.; Kobayashi, M.; Uesugi, K.; Takeuchi, A.; Horikawa, K. Growth behavior of hydrogen micropores in aluminum alloys during high-temperature exposure. Acta Mater. 2009, 57, 2277–2290. [Google Scholar] [CrossRef]
- Gu, J.; Ding, J.; Williams, S.W.; Gu, H.; Ma, P.; Zhai, Y. The effect of inter-layer cold working and post-deposition heat treatment on porosity in additively manufactured aluminum alloys. J. Mater. Process. Technol. 2016, 230, 26–34. [Google Scholar] [CrossRef]


| Reference | Thermal Management Approach | Deposition Process and Material | Selected Highlights |
|---|---|---|---|
| [8] | In-process cooling with liquid N2 (cryogenic) | GMA 1 and AISI 316L | In-process cooling promoted grain refinement and improvement of mechanical properties. |
| [11] | Dwell time (natural cooling) | GMA and low carbon steel | No heat accumulation occurred for interpass times above 5 min. |
| [12] | Cooling of the platform/substrate | GMA and low carbon steel | Thin walls were more difficult to deposit continuously without a compulsory cooling solution, i.e., natural condition. |
| [13] | Reduction of the deposition current | GTA 2 and Al-Si alloy | Reduction in deposition current (from 140 to 100 A over 40 layers) was sufficient to deal with heat accumulation. |
| [14] | Increasing of the travel speed | GMA and low carbon steel | Layer width was kept constant along the part cross section by increasing the welding speed as the layers were deposited. |
| [15] | Interpass cooling with compressed CO2 jet | GTA and Ti6Al4V | Interpass cooling reduced oxidation and significantly increased productivity. |
| [16] | In-process cooling with compressed CO2, N2 and air | GMA and low carbon steel | CO2 had better cooling effect than N2, which exceeded the capacity of air. |
| [17] | Active cooling and variable polarity deposition current | GMA and Al-Mg alloy | Active cooling and deposition process approaches were used to mitigate heat accumulation, but the former was shown to be more efficient. |
| [18] | Active cooling and variable polarity deposition current | GMA and Al-Mg alloy | Active cooling and deposition process approaches affected macro and microstructural aspects of Al parts. |
| Arc Deposition Equipment | Fronius CMT—TransPuls Synergic 5000 |
| Wire (deposition material) | AWS ER 5356—Ø 1.0 mm |
| Shielding gas | Commercially pure argon at 12 L/min |
| Synergic line code | CMT 1070 |
| Substrate | Al5052 (330 mm × 38.1 mm × 6.35 mm) |
| Wire feed speed 1 | 7.6 m/min |
| Arc current 1 | 96 A |
| Arc voltage 1 | 8.5 V |
| Deposition speed | 60 cm/min |
| Arc energy | 82 J/mm |
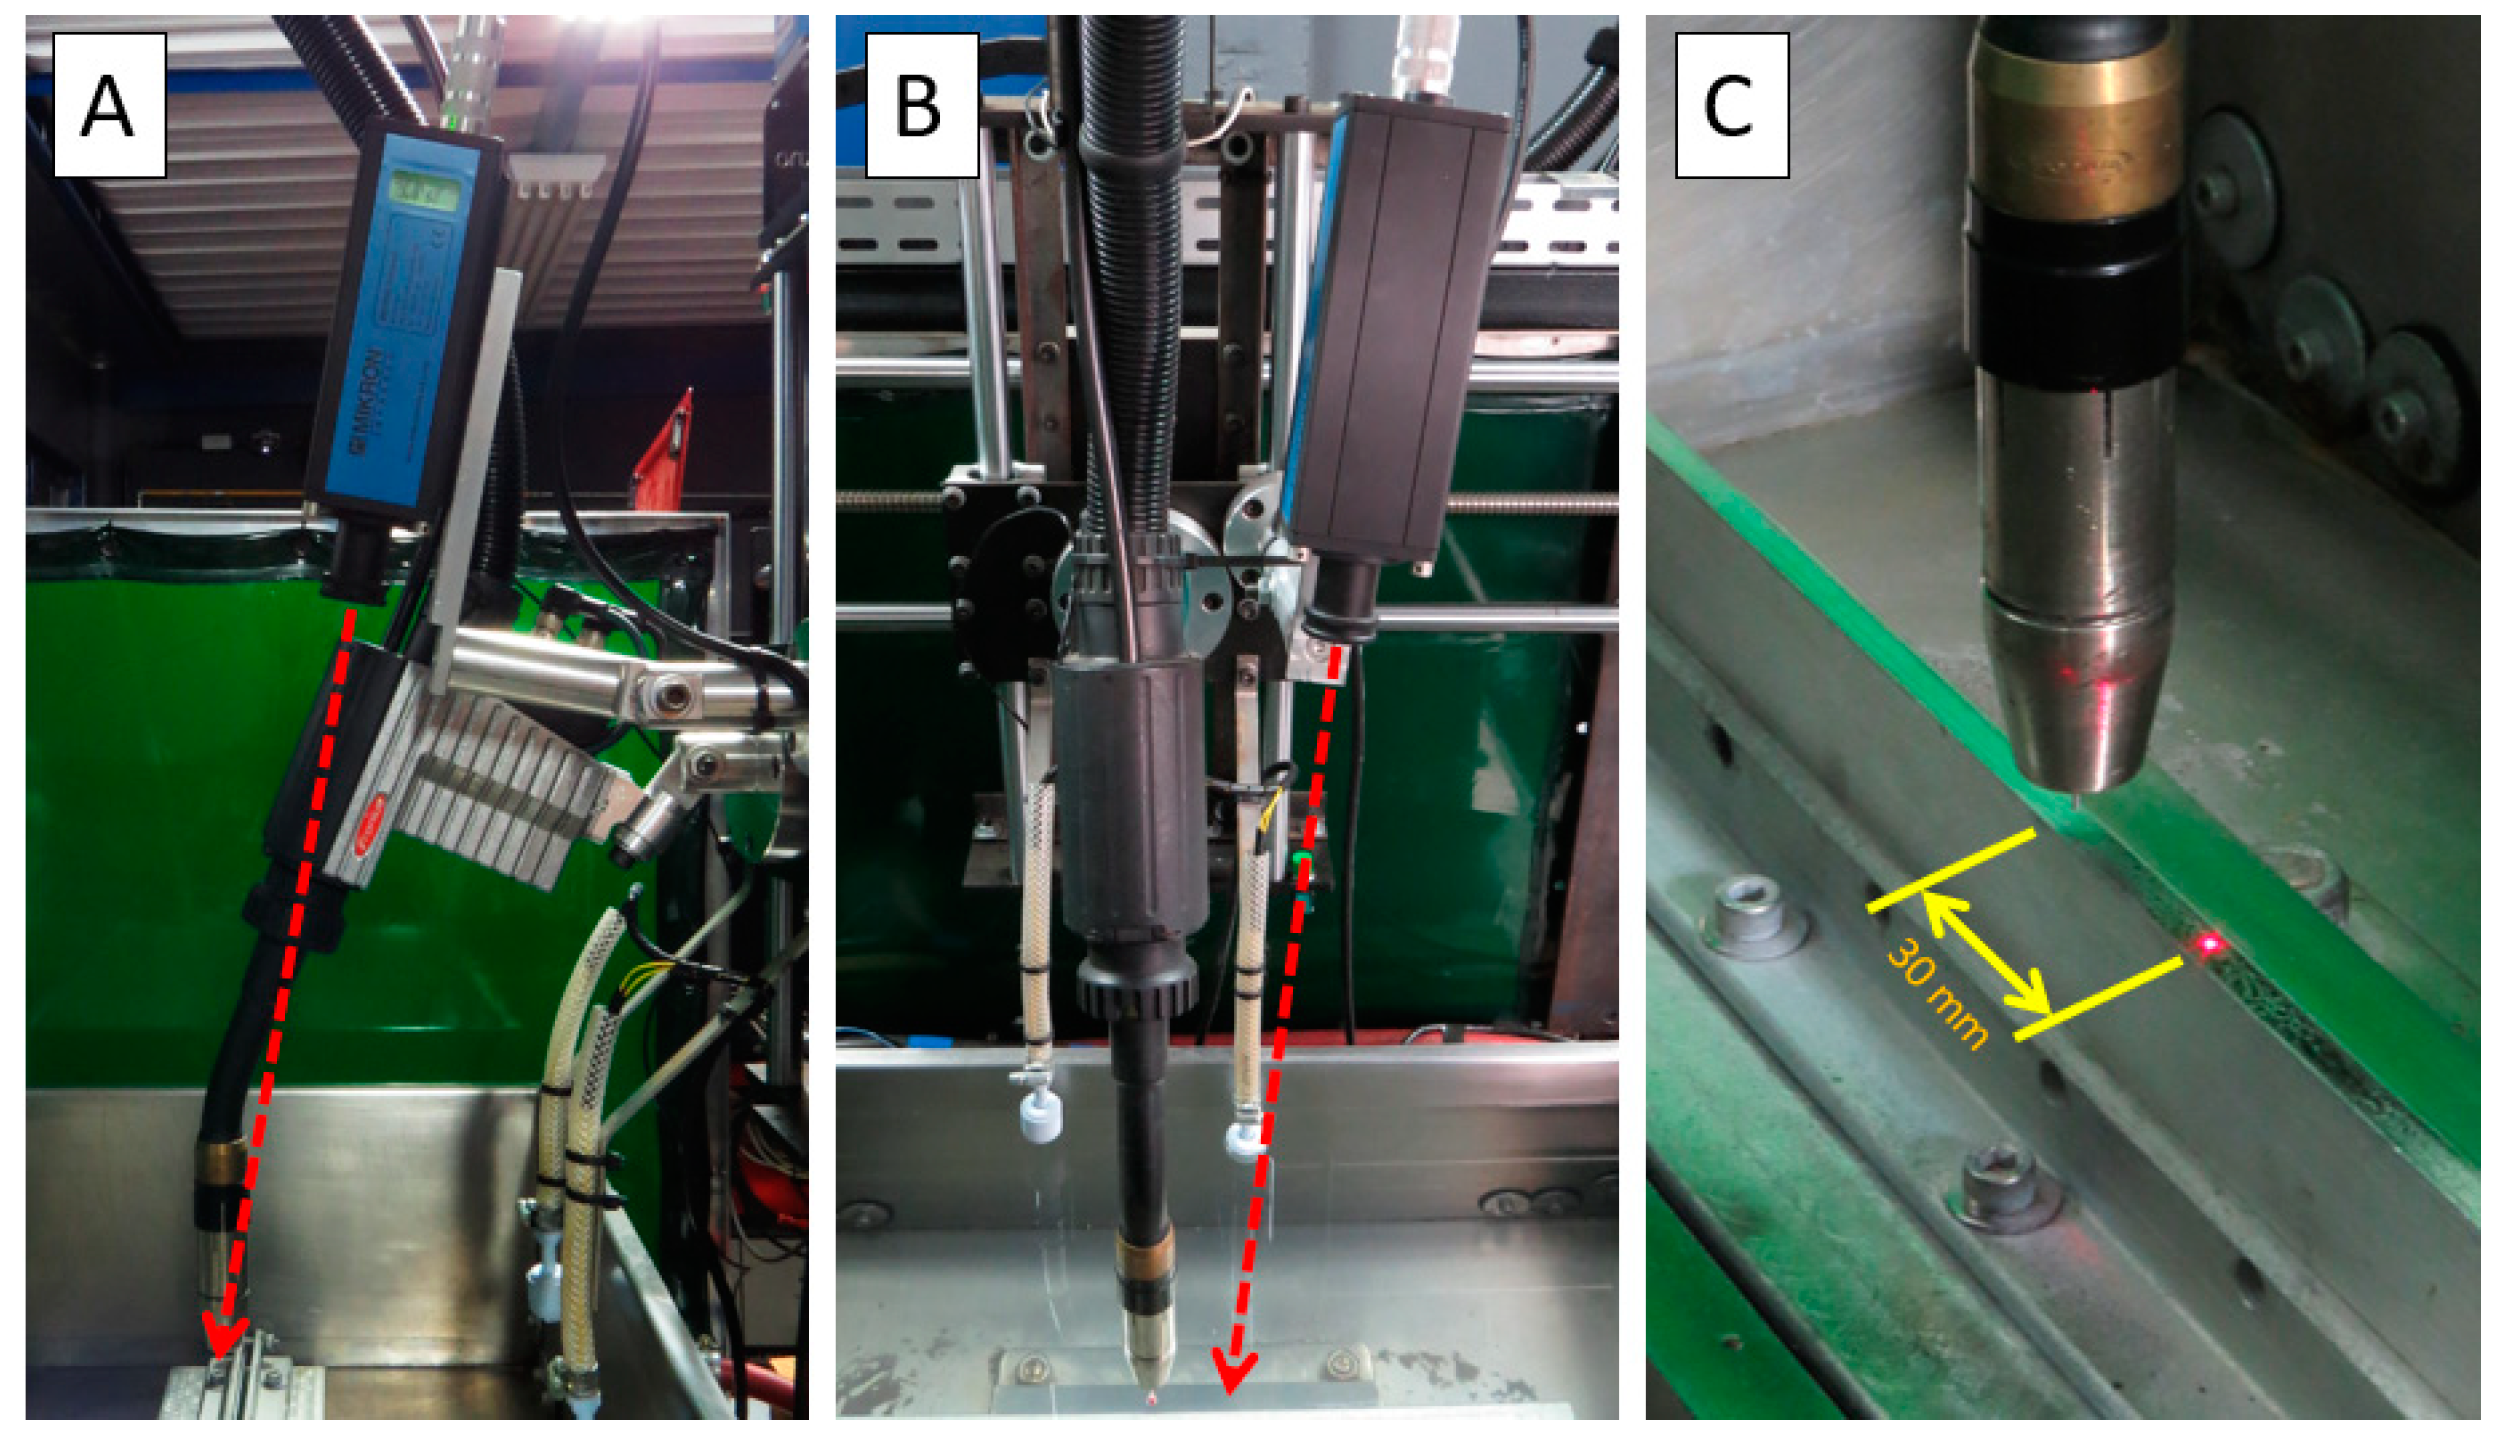
| CTWD 2 | 12 mm |
| LEWD 3 | 5, 10, 15, and 30 mm |
| Cooling liquid | Tap water |
| Work tank volume | 50 L |
| Preform geometry | Single wall with 20 layers |
| Preform lengths | 100, 1500, 200, 250, 300 and 350 mm |
| Building strategy | Single-pass multi-layer bidirectional depositions |
| Dwell time | 5 s/layer |
| IR Pyrometer | Mikron MI-PE140 with Focusable Optics |
| Spectral range | 3–5 μm |
| Temperature range | 30–1000 °C |
| Spot size | Ø 2.9 mm at 380 mm |
| Resolution | 0.1 °C |
| Layer temperature | LEWD-5 | LEWD-10 | LEWD-15 | LEWD-30 | Natural |
|---|---|---|---|---|---|
| Forward temperature—FT (°C) | 42 | 40 | 68 | 65 | 222 |
| Backward temperature—BT (°C) | 88 | 127 | 219 | 267 | 425 |
Publisher’s Note: MDPI stays neutral with regard to jurisdictional claims in published maps and institutional affiliations. |
© 2021 by the authors. Licensee MDPI, Basel, Switzerland. This article is an open access article distributed under the terms and conditions of the Creative Commons Attribution (CC BY) license (https://creativecommons.org/licenses/by/4.0/).
Share and Cite
da Silva, L.J.; Ferraresi, H.N.; Araújo, D.B.; Reis, R.P.; Scotti, A. Effect of Thermal Management Approaches on Geometry and Productivity of Thin-Walled Structures of ER 5356 Built by Wire + Arc Additive Manufacturing. Coatings 2021, 11, 1141. https://doi.org/10.3390/coatings11091141
da Silva LJ, Ferraresi HN, Araújo DB, Reis RP, Scotti A. Effect of Thermal Management Approaches on Geometry and Productivity of Thin-Walled Structures of ER 5356 Built by Wire + Arc Additive Manufacturing. Coatings. 2021; 11(9):1141. https://doi.org/10.3390/coatings11091141
Chicago/Turabian Styleda Silva, Leandro João, Henrique Nardon Ferraresi, Douglas Bezerra Araújo, Ruham Pablo Reis, and Américo Scotti. 2021. "Effect of Thermal Management Approaches on Geometry and Productivity of Thin-Walled Structures of ER 5356 Built by Wire + Arc Additive Manufacturing" Coatings 11, no. 9: 1141. https://doi.org/10.3390/coatings11091141