Article

Mathematical Simulation and Experimental Verification of Carburizing Quenching Process Based on Multi-Field Coupling

1
College of Material Science and Engineering, Hebei University of Science and Technology, Shijiazhuang 050018, China
2
Key Laboratory of Near Net Forming of Materials in Hebei Province, Hebei University of Science and Technology, Shijiazhuang 050018, China
3
Department of Material Science and Engineering, Saitama Institute of Technology, Fukaya 369-0293, Japan
4
Parts Development Department, Zhejiang Wanliyang Co., Ltd., Jinhua 321000, China
5
College of Mechanical Engineering, Hebei University of Technology, Tianjin 300130, China
*
Authors to whom correspondence should be addressed.
Coatings 2021, 11(9), 1132; https://doi.org/10.3390/coatings11091132
Submission received: 31 July 2021 / Revised: 3 September 2021 / Accepted: 13 September 2021 / Published: 17 September 2021
(This article belongs to the Special Issue Surface Modification and Functionalization for Advanced Materials)

Abstract

:
Based on the multi-field coupling effect of temperature, diffusion, and phase change, the finite element model of carburizing and quenching was established. The 20CrMnTiH steel helical gear as the research object, prediction accuracy of carburizing, and quenching model of complex helical gear was studied. The material properties database of experimental steel was established by JMatPro, and the material thermophysical parameters needed in the calculation process were obtained. The carburizing and quenching process of transmission helical gear was numerically simulated by thermodynamic three-dimensional coupling analysis method combined with actual heat treatment process. The microstructure morphology, macro hardness, and deformation were characterized. The experimental results show that the microstructure of the hardened surface layer was acicular martensite and a small amount of residual austenite. The highest hardness appears at the surface layer of 778.8 HV, the effective hardened layer depth was 0.9 mm, and the maximum deformation of the gear was 0.055 mm. By comparing the experimental measurement results with the simulation results, they were in good agreement, which verifies the accuracy of the finite element model. This indicates that the model has good prediction ability in carburizing and quenching process.

Graphical Abstract

1. Introduction

With the rapid development of the new energy automobile industry, higher requirements are put forward for the performance of the key parts of the transmission system, especially the surface hardness and wear resistance. Surface strengthening process (carburizing and quenching) is the key technology for reliable performance of the gear [1], which is an important factor directly affecting the performance. After carburizing, there is a carbon concentration gradient in the surface layer of gear, while the carbon content in the core remains unchanged [2,3,4]. After quenching treatment, the surface layer will generate a martensite structure with high hardness and good wear resistance. In this process, the gear bears complex boundary conditions such as heat and diffusion, and the generated stress is complex and changeable [5,6,7]. The resulting excessive residual stress, deformation, and cracking are the most important issues affecting the performance of gear products. Therefore, it is of great practical significance to understand and master the changing law of stress and realize the accurate control of microstructure and deformation.
At present, it is not easy to study the law of stress variation and control the deformation accurately by means of experiment. However, the rapid development of numerical calculation theory and finite element simulation technology [8] makes it easier to study gear structure, stress, and deformation. Some finite element software has realized the simulation of carburizing and quenching process [9,10,11], and many scholars have thoroughly researched this aspect. Ju, D.Y. [12] focuses on the influence of carbon content on phase transformation behavior. The accuracy of carburizing and quenching simulation is improved by identifying the thermal properties of materials according to carbon content. Lee, K.O. [13] used accurate mechanical property data for simulation to predict the deformation after quenching, but the disadvantage was that the simulation did not include the phase transition during heat treatment. Farivar, H. [14,15] studied the relationship between heat treatment–microstructure-toughness and -hardness of experimental steel by combining experiments and simulation. By using a modified hardening cycle, the deformation caused by quenching is reduced, while maintaining high hardness and toughness.
Studies have shown [16] that with the increase in hardenability, deformation will become larger. As a gear steel material with good hardenability, it is necessary to study the microstructure, hardness, and deformation of 20CrMnTiH steel. In this study, the COSMAP (Computer Simulation of Manufacturing Process) software developed by the thermodynamics-based “metal-thermo-mechanics“ theory [17,18] was used to numerically simulate the carburizing and quenching process of 20CrMnTiH gears. The ability of temperature, and stress and strain coupling behavior evolution in quenching process was analyzed from macroscopic and microscopic perspectives. The variation laws of microstructure, hardness, and deformation of gears were studied, and the corresponding experimental verification was carried out. It provides reference and support for the practical application of heat treatment process.

2. Model Construction

2.1. Mathematical Model

In the process of carburizing and quenching, the field of microstructure, stress and strain, and temperature field influence each other. In order to ensure the accuracy of numerical simulation, the mutual coupling between phase transformation field, stress–strain field and temperature field must be considered in mathematical modeling. This coupling effect was based on the “metal-thermal-mechanics” theory of continuous thermodynamics.

2.1.1. Heat Conduction Equation and Diffusion Equation

The first law of thermodynamics is usually given based on internal energy:
U = [ G + T η + 1 ρ σ i j ε i j e ]      
where G, η , σ i j , and ε i j e denote the Gibbs free energy, the entropy, the stress, and elastic strain, respectively.
Introducing expressions for the specific heat c ( = T η T ) and enthalpy density H ( = g + T η ) , the general form of heat conduction equation is:
ρ U ˙ σ i j ε ˙ i j e + q i x i = 0
ρ c T ˙ + T ε i j e T σ ˙ i j ( σ i j ε ˙ i j i ρ H ε i j i ε ˙ i j i ρ H k k ˙ ) + ρ I = 1 N l I ξ I = k 2 T x i x i
q i = k T x i
l I = H ξ I
where c and ρ denote the specific heat coefficient and the density coefficient, respectively; their changes with temperature are shown in Figure 1a,b. l I is the I th component of latent heat and k denotes the coefficient of heat conduction. The third term on the left side of Equation (3) denotes the heat generated by inelastic dissipation which is significant when compared with the elastic work represented by the second term, and the fourth term is the latent heat generated by phase transition.
The convection boundary conditions for heat transfer on the surface are set to be:
K T x i n i = h T ( T T W )
where h T and T W are, respectively the heat transfer coefficient and coolant temperature on the heat transfer boundary of unit normal n i .
The radiation boundary conditions for heat transfer on the surface are set to be:
K T x i n i = h T ( T T W )
The carbons in the process of carburizing diffusion are the following equation:
C t x i ( D c C x i ) r c = 0
D f ( C e , t )          
where β c is the coefficient of surface reaction rate, C W is the carbon content of the external environment, C is the carbon content of the experimental steel surface, D is a function of temperature, and t is time.

2.1.2. Constitutive Equation

Total strain rate ε ˙ i j can be divided into elastic strain rate ε ˙ i j e , plastic strain rate ε ˙ i j P , thermal strain rate ε ˙ i j T , phase transformation strain rate ε ˙ i j m , and transformation plasticity rate ε ˙ i j t p :
ε ˙ i j = ε ˙ i j e + ε ˙ i j P + ε ˙ i j T + ε ˙ i j m + ε ˙ i j t p
Here, the elastic strain is as follows:
ε ˙ i j e = 1 + v E σ i j v E ( σ k l ) δ i j
where E and v denote the Young’s module and the Poisson’s ratio, respectively; their changes with temperature are shown in Figure 1c. δ i j is the deviator stress.
The plastic strain is as follows:
ε ˙ i j P = λ F σ i j
where the parameter λ is a function of stress, stress rate and strain and their history.
Then, the plasticity of phase I -th is controlled by the following yield function:
F = ( T , C , σ i j , ε P , ξ 1 , k )
where the T , C , σ i j , ε P , ξ 1 , and k denote temperature, carbon content, flow stress, plastic strain, individual phase, and hardening parameter, respectively.
The thermal strain is:
ε ˙ i j T = α ( T T 0 ) δ i j  
where the α denotes a function of carbon content and structural volume fraction.
The phase transformation strain is:
ε ˙ i j m = I = 1 N β I ξ ˙ I δ i j
where β I denotes the phase transformation coefficient of the change in length caused by the instantaneous phase transformation [19] and I -th represents the structural expansion caused by components. The phase transformation expansion coefficients of martensite and bainite are 6.31 × 10⁻³ and 1.95 × 10⁻³.
The transformation plasticity is:
ε ˙ i j t p = I = 1 N k I ( 1 ξ I ) ξ ˙ I δ i j
where k I denotes the coefficient of transformation plasticity of martensite and bainite. The coefficient of transformation plasticity is an important parameter affecting the deformation after heat treatment [20,21]; martensite and bainite coefficient of transformation plasticity are 9.82 × 10⁻⁵ and 3.761 × 10⁻⁵, respectively.

2.1.3. Quenching Kinetics

During the quenching process, the martensite phase changes into the dominant non-diffusive phase transition [22], according to the following law:
V M = 1 e x p { φ 1 T + φ 2 ( C C 0 ) + φ 3 σ m + φ 4 σ e + φ 5 ) }
where V M denotes the volume fraction of martensite, which is a function of carbon content, temperature, and stresses. σ m and σ e are mean and equivalent stress, respectively. φ 1 ,   φ 2 ,   φ 3 , and φ 4 are the experimental coefficient.
The other type of phase transformation is controlled by diffusion mechanism, and the volume fraction of developing phase such as may be expressed by modifying the Johnson–Mehl [23] relation.
V B = 1 e x p { 0 t f 1 ( T ) f 2 ( σ i j ) f 3 ( C ) ( t τ ) 3 d τ }      
f 1 ( T ) = a 0 ( T a 1 a 2 ) a 3 ( a 4 T a 5 ) a 6
f 2 ( σ i j ) = e x p ( a 9 σ m )
f 3 ( C ) = e x p { a 7 ( C C 0 ) }
where f 1 ( T ) t , f 2 ( σ i j ) , and f 3 ( C ) are functions of temperature T , stress σ i j , and carbon content C , respectively.

2.1.4. Mixing Rules

In the process of heating and cooling, a variety of phase transition behaviors happen to steel. In the whole process of the phase change experiment, steel consists of a mixture, dependent on the kind of organization (austenitic, pearlite, martensite, and bainite). The control equation for multiphase mixture model is:
χ = I = 1 N χ I ξ I                 ;                   I = 1 N ξ I = 1
where ξ I the volume fraction of the I-th constituent.

2.1.5. Hardening Rule

The yield function is determined by the plastic strain ε ij p and the scalar hardening parameter κ exhibiting the magnitude of material hardening (Figure 1d), which depends on loading history, as well as the stress and temperature:
F = F ( σ ij , ε ij p , k , T )
As the hardening parameter k and temperature T appearing in Equation (18) play a role to isotropic expansion (or contraction) of yield surface, while the tensor parameter ε ij p contributes the anisotropic hardening, the following equation is formed:
F = f ( σ ij , ε ij p ) K ( k , T )
The temperature field, diffusion field, and stress field of carburized quenching process were simulated by macro scale finite element method. This model has been implemented in the finite element software COSMAP.

2.2. Geometric Model

2.2.1. Model Establishment and Cell Division

The experimental focus is the bevel gear of the gearbox differential of 20CrMnTiH. The size and main parameters of the gear are shown in Table 1. The three-dimensional model of the gear is established by SOLDWORKS and GID, as shown in Figure 2a. The marked red teeth and numbers (1, 18, 34, and 50) in Figure 2b correspond to the location of the measurement distortion. A hexahedral mesh with good quality is used. In order to determine the accuracy of the elements size on the calculation results, a cube of 10 mm × 10 mm × 10 mm was used for the trial calculation in advance. Figure 2c shows the simulated changes of surface carbon concentration at three elements sizes of 0.67 mm, 1 mm, and 1.5 mm. The results show that the error was large when the elements’ size was 1.5 mm, and the simulation results were consistent when the elements’ sizes were 1 mm and 0.65 mm. Therefore, in the case of ensuring high simulation accuracy and a small amount of calculation, the tooth profile position elements size is set to about 0.75 mm. The total number of elements and nodes are 10,657 and 9875, respectively. The points for the application of the constraint conditions are shown in Figure 2b. The displacement and rotation of points a1 and a2 in the yz direction on the profile are fixed, and the displacement and rotation of points b1 and b2 in the xz direction are fixed.

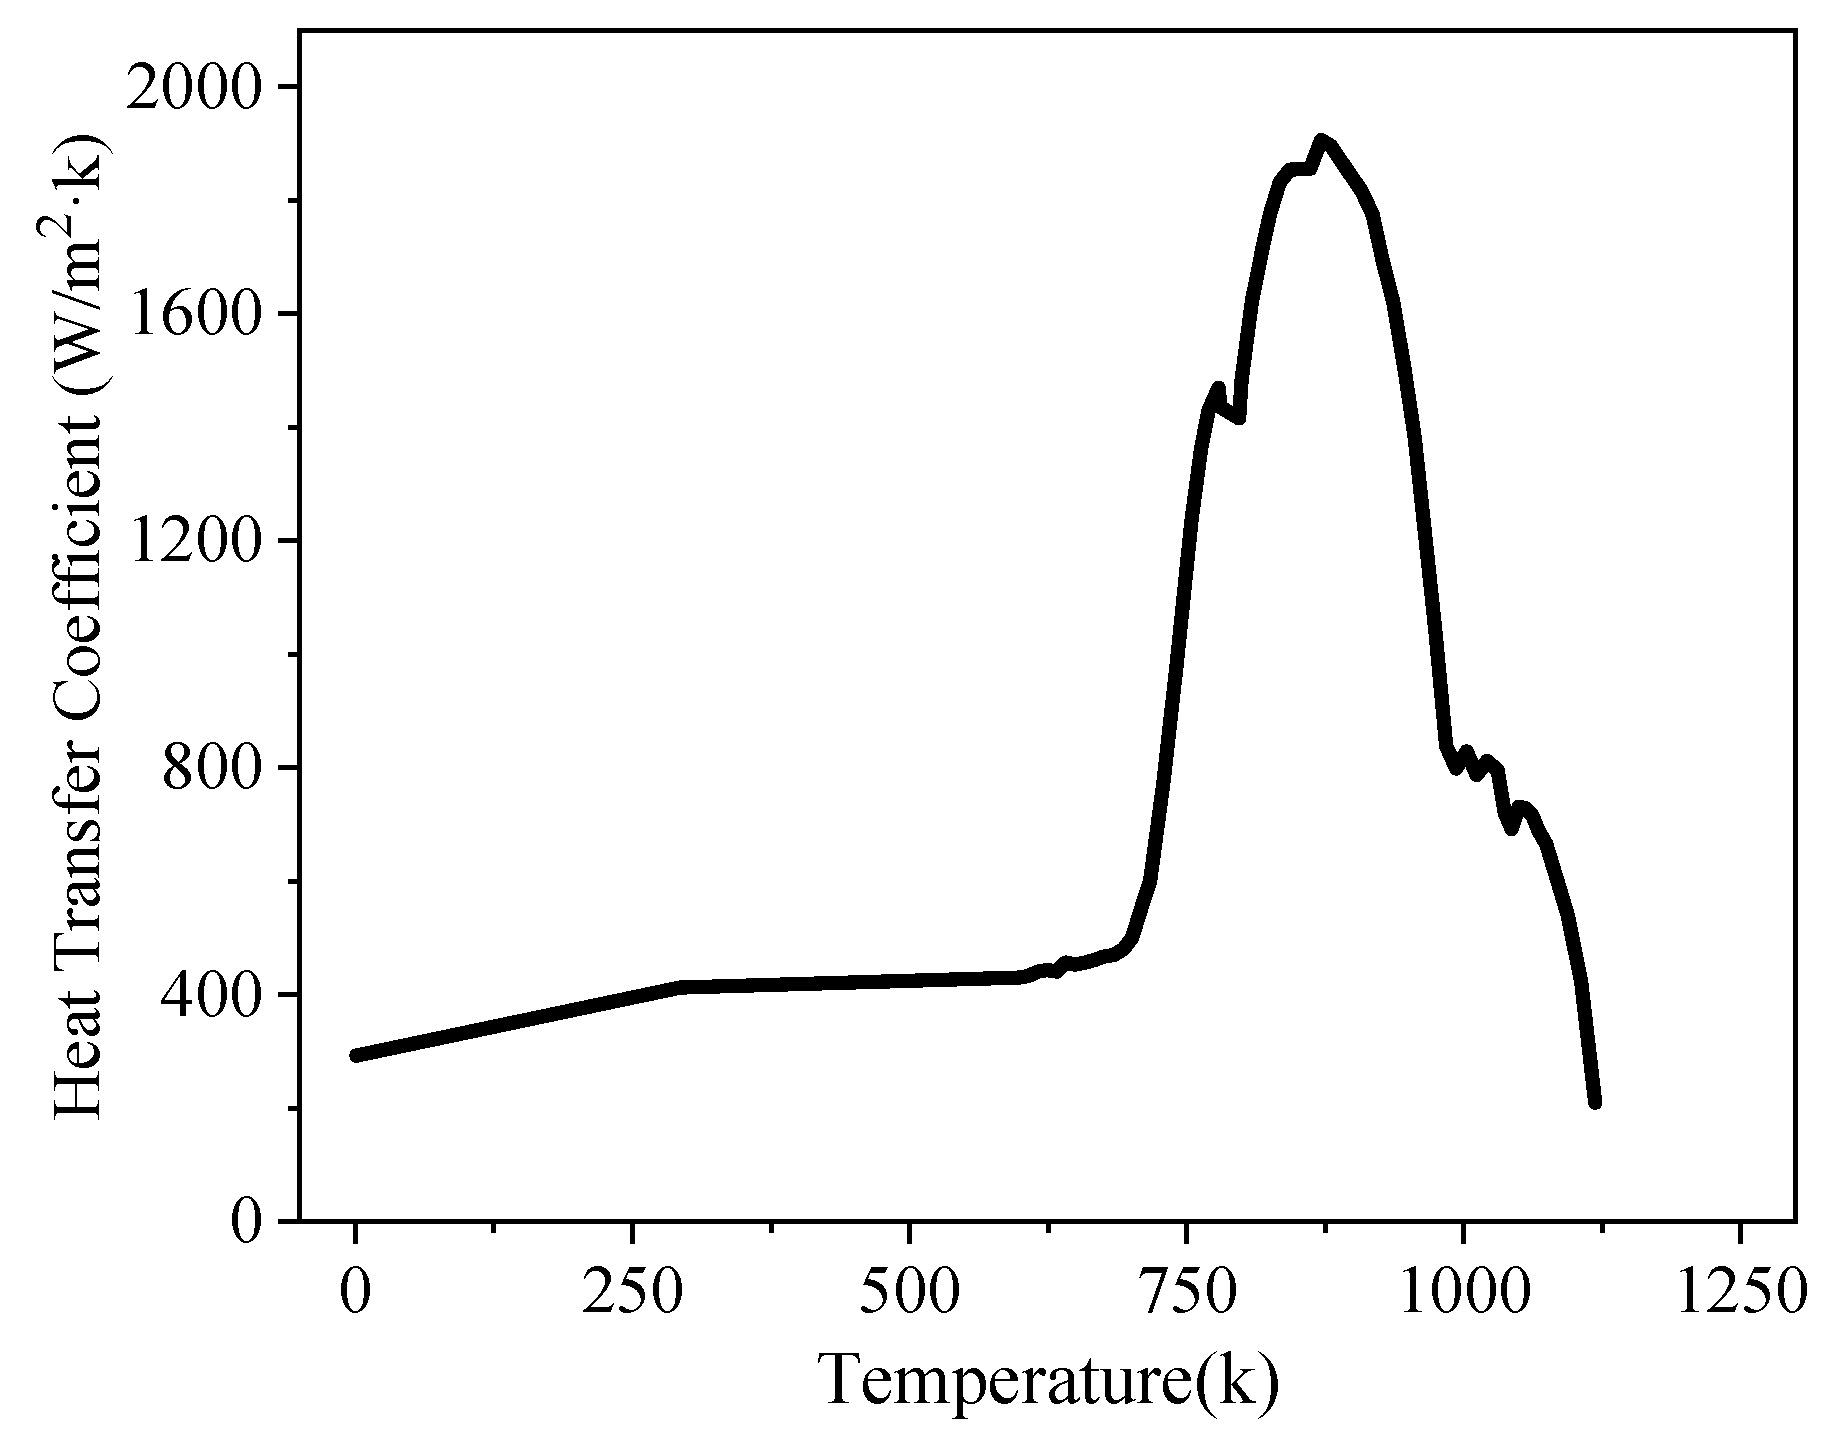
2.2.2. Heat Transfer Coefficient

Heat transfer coefficient can reflect heat flow exchange between a part’s surface and cooling medium during the cooling process [24,25]. The curve of heat exchange coefficient between the gear surface and quenching oil with temperature during quenching cooling is shown in Figure 3. When the temperature is above 900 K, a steam film will be formed on the surface of the experimental steel after it is put into the cooling medium, which cuts off the contact between the medium and the surface, hinders the heat exchange, and the heat exchange coefficient is small. When the temperature is below 600 K, the cooling medium and the surface of the parts allow convective heat transfer, so the heat exchange coefficient is also small. The maximum value of the heat exchange coefficient appears at about 850 K. At this time, the steam film produced by the high temperature breaks, boiling occurs, and a large number of bubbles are produced. The heat is quickly taken away from the bubbles, and the cooling rate is the fastest.

3. Experimental Method

Due to the low carburizing temperature and short carburizing time, there will be insufficient carburizing depth and surface decarburization. The high carbon potential carburizing diffusion cooling method can effectively avoid this problem [26]. We put the experimental steel in the continuous carburizing furnace (AICHELIN Heat Treatment Systems Co., Ltd., Beijing, China), heated 1168.15 k for 85 min, setting the carbon potential to 1.0%, and the diffusion time to 160 min, which is the strong infiltration period; the temperature of the diffusion period is 1158.15 k, the carbon potential is 0.86%, and the diffusion time is 75 min. We cooled the steel to a quenching temperature of 1108.15 k at a certain cooling rate, keeping the carbon potential at 0.76%, hold time for 54 min, and cooled to room temperature with oil. The heat treatment process curve is shown in Figure 4.
The carbon concentration changes of the gears after carburizing and quenching were tested by delamination method. Firstly, after carburizing and quenching the samples were removed the oxide layer. After grinding and leveling, the chemical composition of the sample surface was measured by direct reading spectrometer (SPECTRO, Kleve, Germany) to obtain its carbon content. The mechanical grinding method was used for layer-by-layer measurement, and the vernier caliper was used to measure the thickness of the delamination, and finally the carbon concentration distribution of the gear was obtained. In order to ensure the accuracy of the measurement data, each was layer measured in three positions, and we used the average.
The cross section of gear sample was processed, polished, and corroded (4% nitric acid alcohol). Optical microscope (Carl Zeiss MicroImaging GmbH, Oberkochen, Germany) and scanning electron microscope (SEM, TESCAN, Brno, Czech Republic) were used to observe the microstructure of the gear before heat treatment and from the surface layer to the center after heat treatment.
The volume fraction and lattice parameters of martensite and retained austenite were determined by quantitative X-ray diffraction (XRD, Beijing Advance Science & Technology Corporation, Beijing, China) analysis according to ASTM E975-13 standard. X-ray diffraction (XRD) was performed on SmartLabX diffractometer, 45 kV, 200 mA, using the Cu-Ka radiation and a scanning speed of less than 1°/min.
The microhardness from the surface to the center of the gear after carburizing and quenching was obtained by micro-Vickers hardness tester (Beijing TIME High Technology Ltd., Beijing, China) under the load of 1000 gf and the holding time of 10 s. It is reported [27] that in hardened steel, the critical value of effective hardening layer depth corresponds to about 0.40% martensite carbon content and about 550 HV microhardness.
Figure 2a shows taking four tooth shapes (1, 18, 34, and 50) of the gear; the displacement of the whole tooth surface before and after heat treatment is measured by a probe to determine the deformation after quenching.
In practical engineering applications, the gear drives mesh at the pitch circle (tooth width), so the data of pitch circle position are taken for research. When the simulation results are compared with the experimental measurement results, the sampling position is the tooth with the largest deformation.

4. Results and Discussion
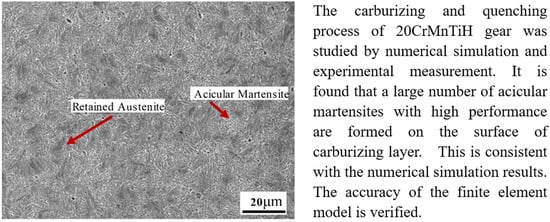
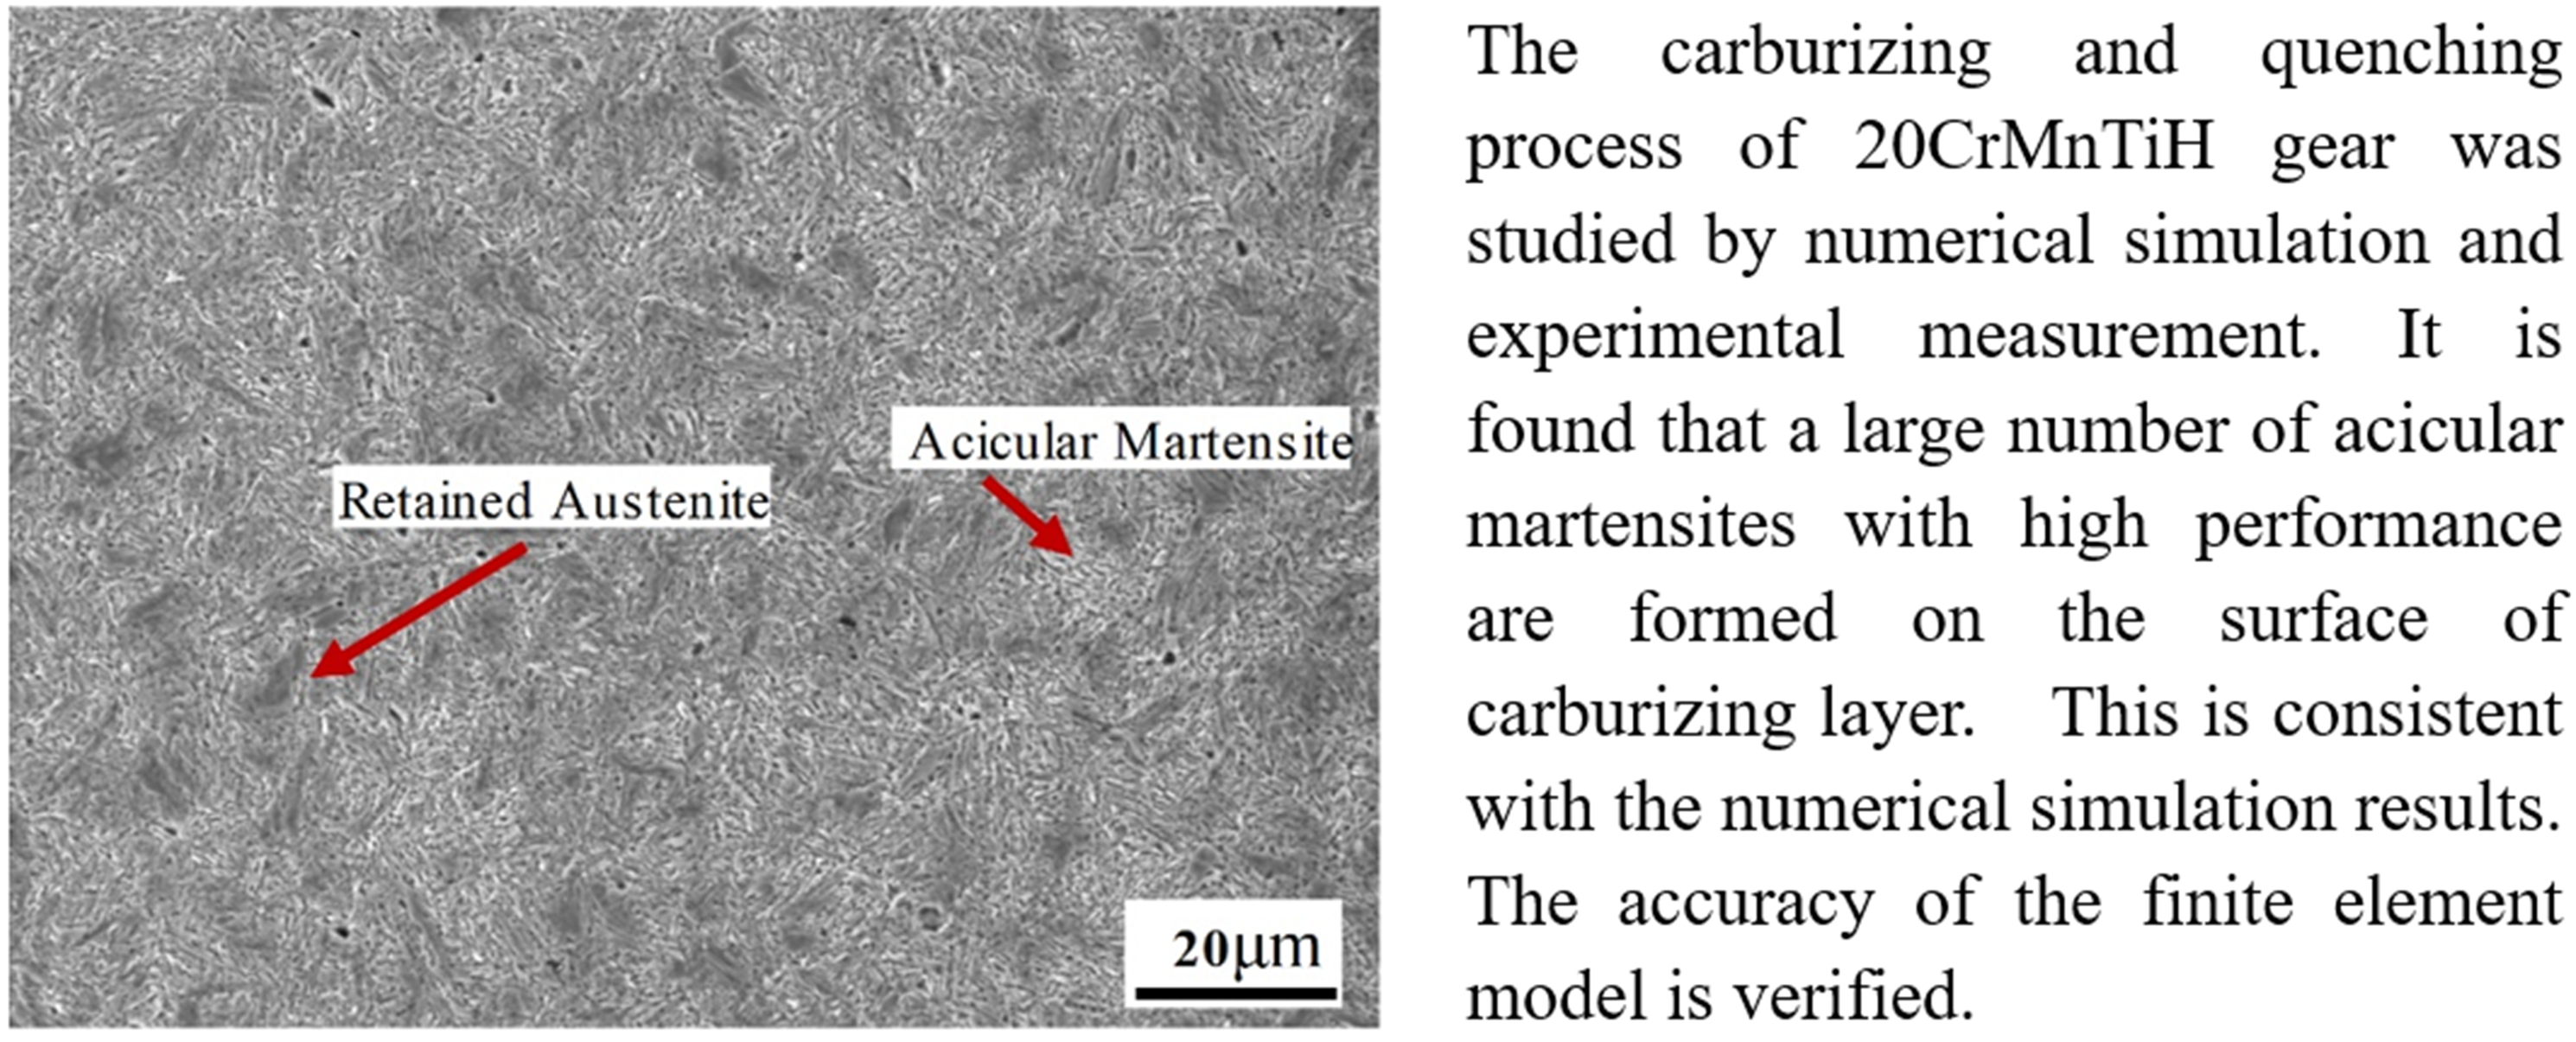
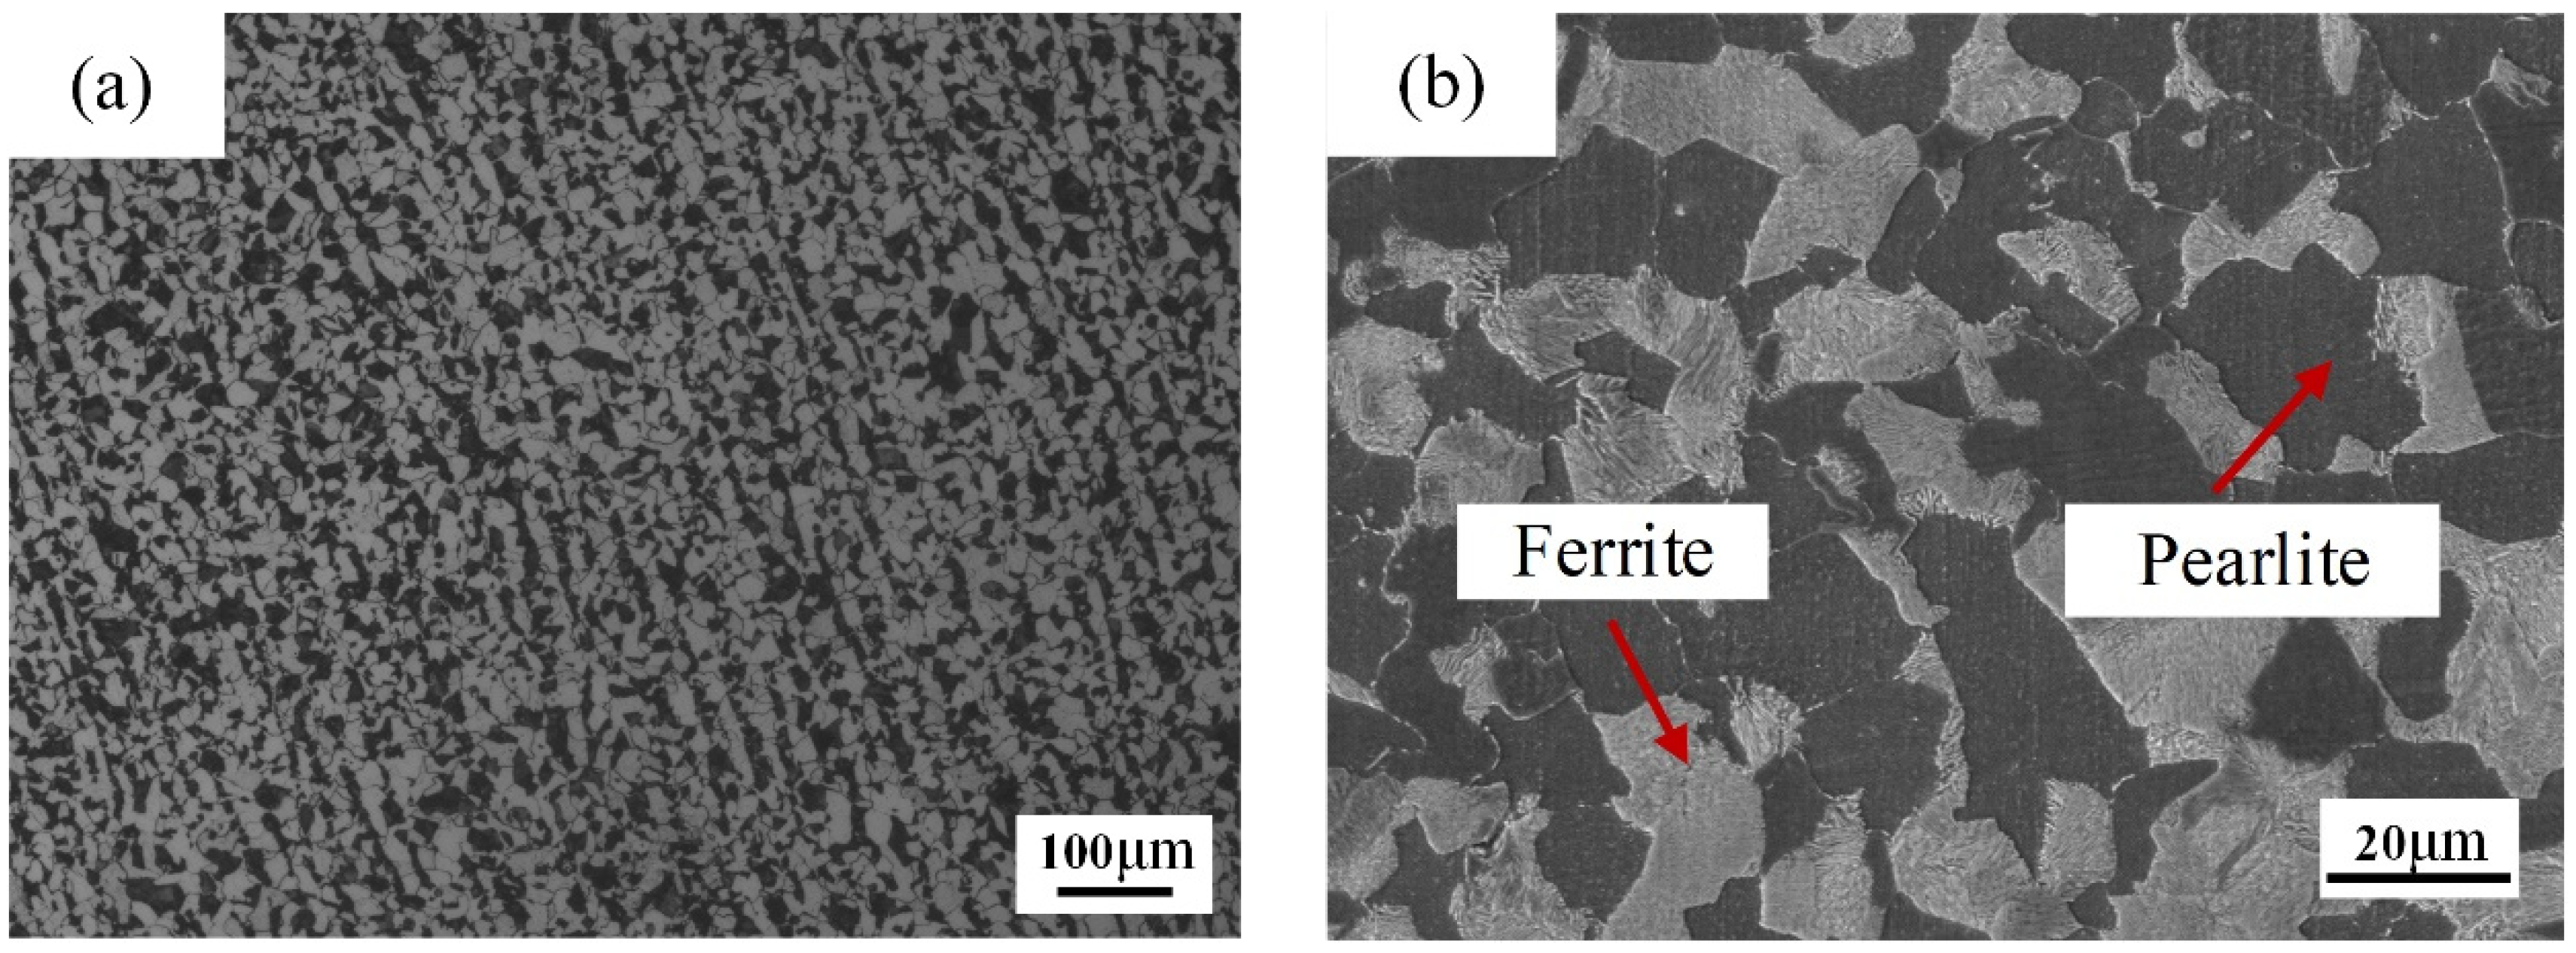
4.1. Microstructure

Figure 5a shows the distribution cloud of carbon concentration of gear after carburizing and quenching heat treatment. The carbon concentration inside the gear is lower than the surface carbon concentration. The gear surface has a maximum carbon concentration of approximately 0.75 wt.%, with carbon concentrations ranging from 0.22 wt.% to 0.75 wt.%. Figure 5b shows a comparison between simulated and experimentally measured carbon concentrations at the pitch circle position of the gear. Red and black represent simulation data and experimental measurement data, respectively. The concentration difference of carbon atoms on the surface and inside of the gear during carburizing promotes the diffusion of carbon atoms, and the carbon content in the surface layer is measured to be 0.76%. The carbon concentration decreases with the increase in distance, and tends to be stable at 0.21% when the distance is 1.5 mm. The effective depth of carburizing is 0.85 mm. The carbon concentration gradient is relatively gentle, preparing for subsequent quenching, which is essential to improve the surface hardness of gear and reduce the content of austenite. The higher the carbon content of the experimental steel, the lower the temperature of austenite to martensite transformation. The distribution characteristics of carbon concentration will cause the different simultaneity of martensite transformation and produce the microstructure stress, which will affect the deformation of gear. The carbon concentration distribution obtained by finite element simulation of carbon diffusion driven by Fick’s law is consistent with the experimental data measured by the delamination method, which verifies the accuracy of the numerical simulation.
Figure 6 shows the microstructure of the experimental steel before heat treatment. The microstructure consists of fine ferrite and pearlite with a size of about 20 μm and a grain size of about grade 9. The ferrite grains and pearlite grains are distributed in layers with the same band. This may be due to the formation of ferrite, preferentially in the band formed by dendrite segregation, and non-metallic inclusion extension during the phase transformation of steel during the cooling process after hot rolling, resulting in the formation of ferrite bands. The pearlite is between the ferrite bands, and the two phases are distributed in layers. According to the national standard (GB/T 13299-1991), the banded structure was evaluated as B3 grade. Meanwhile, the existence of banded structure in the original material will adversely affect the deformation of the gear after heat treatment.
Figure 7a shows the distribution cloud of martensite phase on the gear surface after carburizing and quenching. It can be seen from the cloud image that the maximum martensite content on the tooth surface is 0.995. The martensite phase content at both ends of the tooth shape is slightly higher than that at the middle position, without great deviation, and the martensite phase is evenly distributed. Figure 7b shows the relative phase fraction of martensite. The maximum and minimum martensite contents are 0.991 and 0.975, respectively, and the average surface martensite content is 0.977. Figure 7c shows the XRD pattern of the carburizing layer after carburizing and quenching of gears. The carburized layer is mainly composed of an α’-Fe (martensite) phase of body-centered cubic, and its lattice parameter a = b = c = 2.886. After quenching, the retained austenite content is lower, and the XRD failed to detect it. Using Magee’s [28] formula to calculate:
V γ = e x p [ α ( M s T q ) ]
where M s is the initial temperature of austenite to martensite transformation during quenching, which is calculated by JmatPro as 682.1 K, T q is the temperature of quenching medium, and α is a constant with a value of 1.10 × 10⁻², the content of residual austenite is about 0.030, which is close to the simulated content of 0.023.
Figure 8 shows the microstructure of carburized layer, transition layer, and core of experimental steel after carburizing and quenching. OM images are shown in Figure 8a,c,e, and SEM images are shown in Figure 8b,d,f. The microstructure after quenching is composed of high-carbon acicular martensite and a small amount of residual austenite, as shown in Figure 8a,b. This is due to the high carbon content in the carburized layer; the M s line moves downward. During the cooling process, some austenite cannot generate martensite, and remains between martensite. The size of martensite is very small, and the evaluation grade is grade 2, which is due to the low carburizing temperature and relatively small austenite grain. The carbon content of the transition layer decreased, and the microstructure was acicular martensite and lamellar martensite, as shown in Figure 8c,d. The carbon content in the heart is the lowest, and the cooling rate is close to the bainite transformation region. The microstructure is low carbon lamellar martensite and a small amount of lower bainite, as shown in Figure 8e,f.

4.2. Hardness Distribution

Figure 9a shows the hardness distribution nephogram of the gear after carburizing and quenching, which is similar to the distribution law of martensite nephogram in Figure 7a. The maximum hardness of the tooth profile is 746.6 HV, which occurs at the top of the tooth. The surface hardness distribution is uniform and there is no large fluctuation. Figure 9b shows the hardness of simulated surface nodal circle positions, ranging from 741 HV to 745.5 HV, and the average hardness is 743.6 HV. Figure 9c shows the microhardness distribution measured from the surface to the center of the gear. The hardness decreased gradually from the surface to the heart, the highest value appeared in the surface was 778.8 HV, and the lowest value appeared in the heart was 355 HV. When the thickness is 0.4–1.2 mm, the acicular martensite decreases with the increase in distance, and the hardness decreases sharply. When the depth exceeds 1.2 mm, the hardness decreases slightly, slowly, and finally tends to be stable. The critical value of 550 HV occurs at a depth of about 0.9 mm. Figure 9d shows the comparison between the hardness values of the gear surface solved by finite element method and the hardness values of the surface measured by experiment. From the comparison of H1, H2, and H3, it is found that the simulated surface hardness values are less than the experimental surface hardness values. The difference between simulated and measured values is 35.2 HV, and the error is within 5%. The reason for the error is that the hardness points measured in the experiment are concentrated in a small area, while the simulation hardness calculation is mainly based on the average value of the simulation area.

4.3. Deformation Distribution

Figure 10a shows the distortion distribution nebula-graph of the gear after carburizing and quenching. It can be seen from the cloud image that the maximum position of deformation is 0.093 mm at the top of the end face of the gear, and the minimum position is 0.015 mm at the middle of the tooth shape. The distribution of simulated deformation first decreases, and then increases from one end of the gear to the other. As shown in Figure 10b, the distribution of the simulated deformation of the maximum deformation tooth of the gear is shown. The maximum deformation is 0.051 mm, and the minimum deformation is 0.013 mm near the middle. Table 2 shows the comparison between the maximum deformation values of the four teeth measured by simulation and experiment. It can be seen from the table, the tooth with the largest deformation is No. 1. The simulated deformation value is 0.051 mm, and the measured deformation value is 0.055 mm. The difference of values is small and can be well matched. As shown in Figure 10c, the temperature field change of gear during quenching is simulated. Red and black represent the end face and tooth flank with large deformation, respectively. There is a small temperature difference between the gear side and the end face at the beginning of quenching. With the extension of quenching time, the temperature difference between the gear side and the end face increases, and the maximum difference is 50 k. When the time reaches 170 s, the temperature change tends to be consistent. This temperature difference is due to the formation of vapor film on the gear surface during quenching [29,30,31]. The vapor film located at the outer end surface ruptured preferentially, and the temperature changed dramatically. The position of the inner end face is close to the center, the vapor film is finally broken, and the temperature changes slowly. This temperature difference results in different simultaneity of the microstructure transition, resulting in uneven thermal stress and microstructure stress of the gear. The effect of this stress on the gear is characterized by the uneven deformation after quenching.

5. Conclusions

Based on the theory of metal thermodynamics, the carburizing and quenching process of helical gear was studied by combining an experiment with numerical simulation. From these results, we have the following important conclusions:
(1)
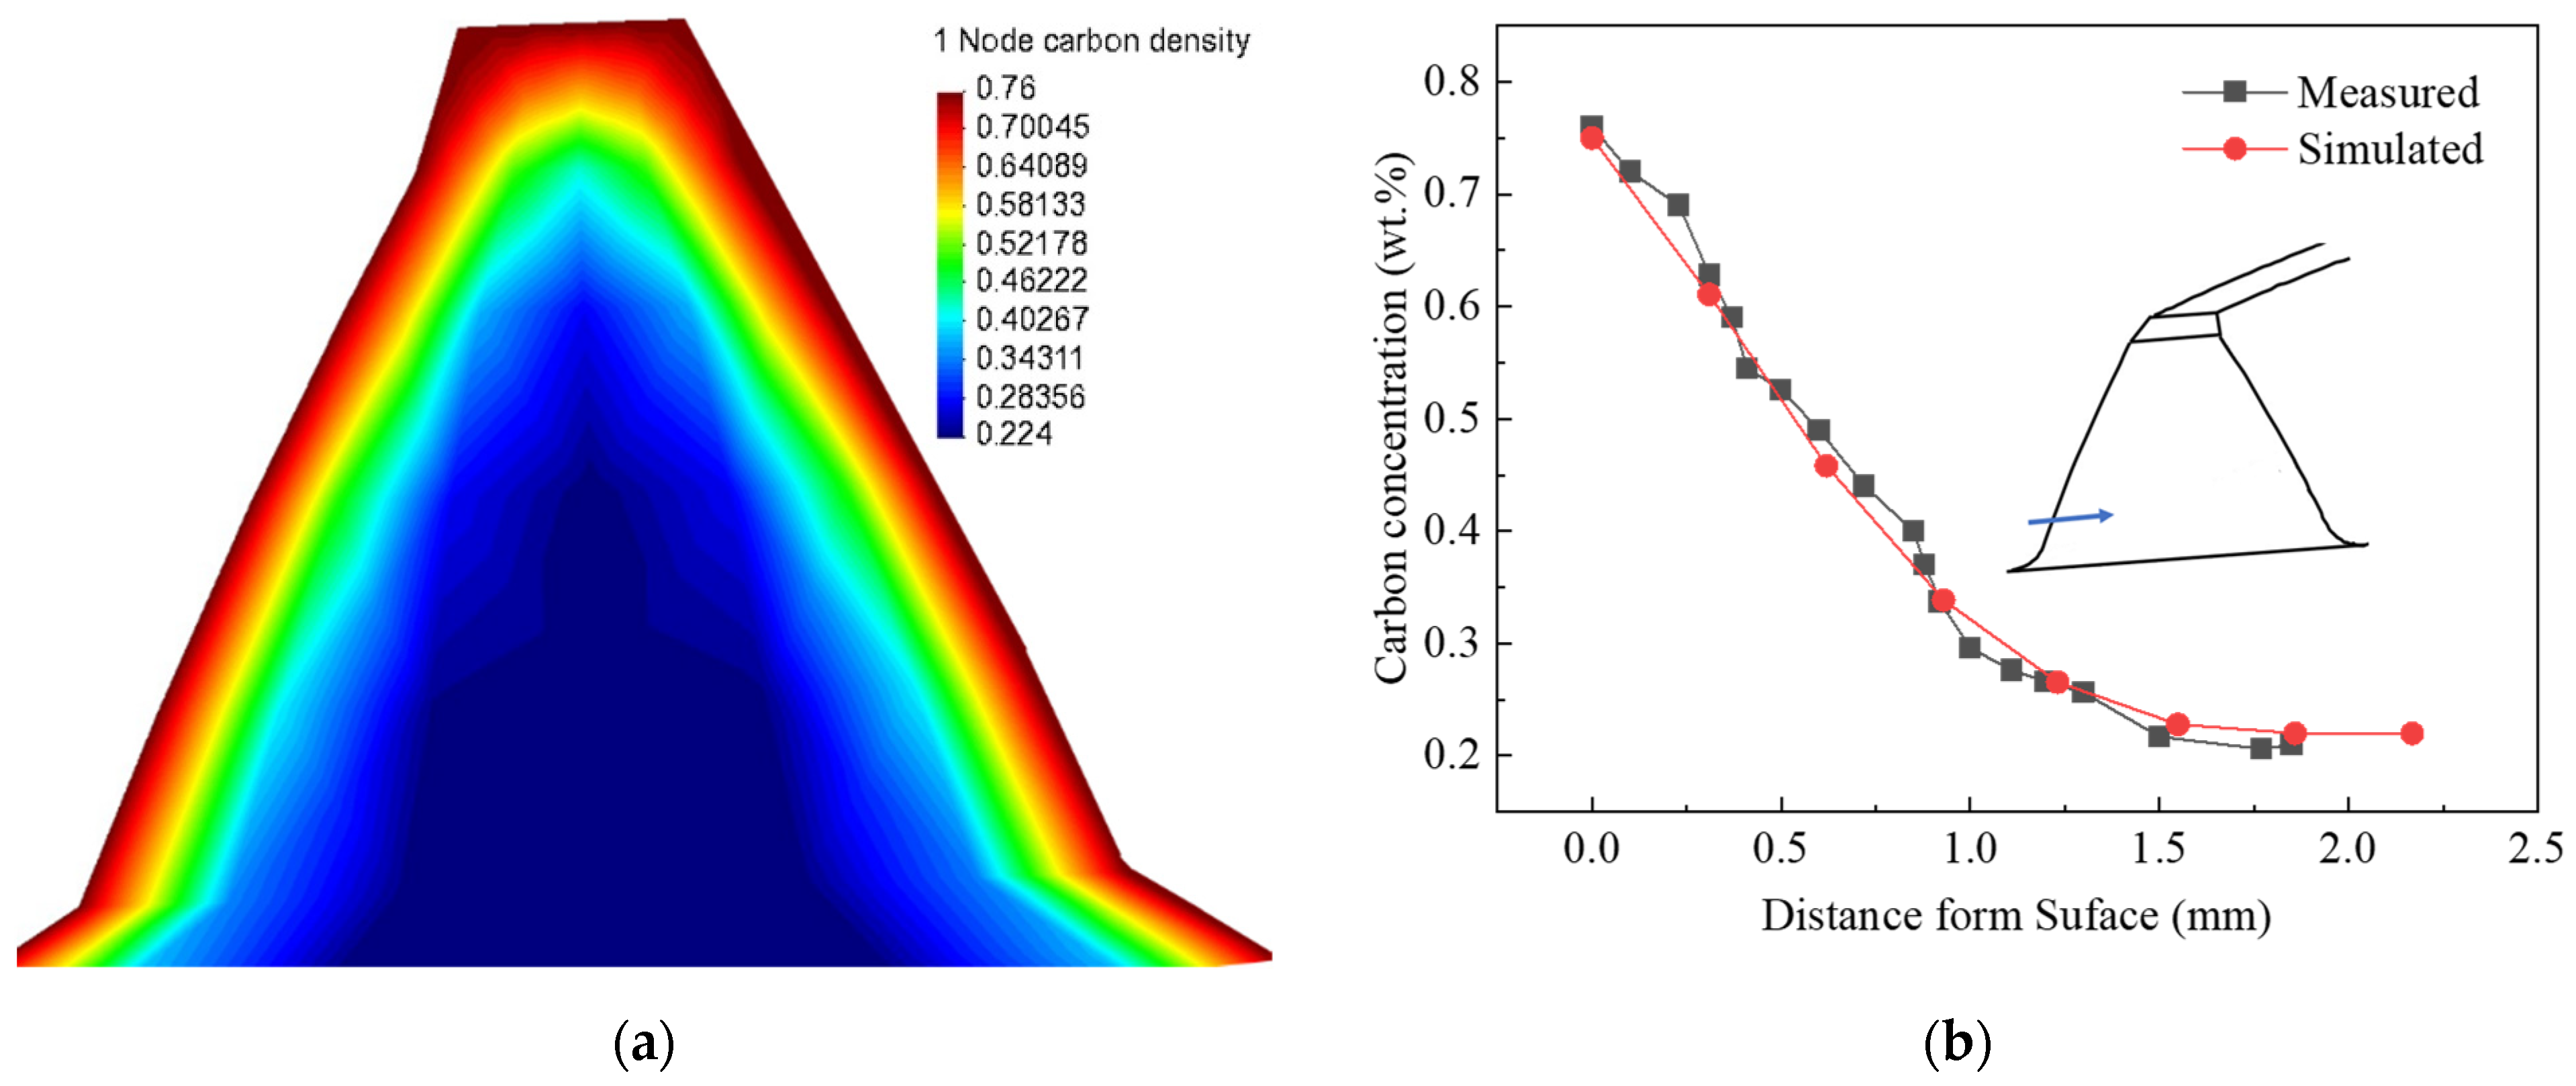
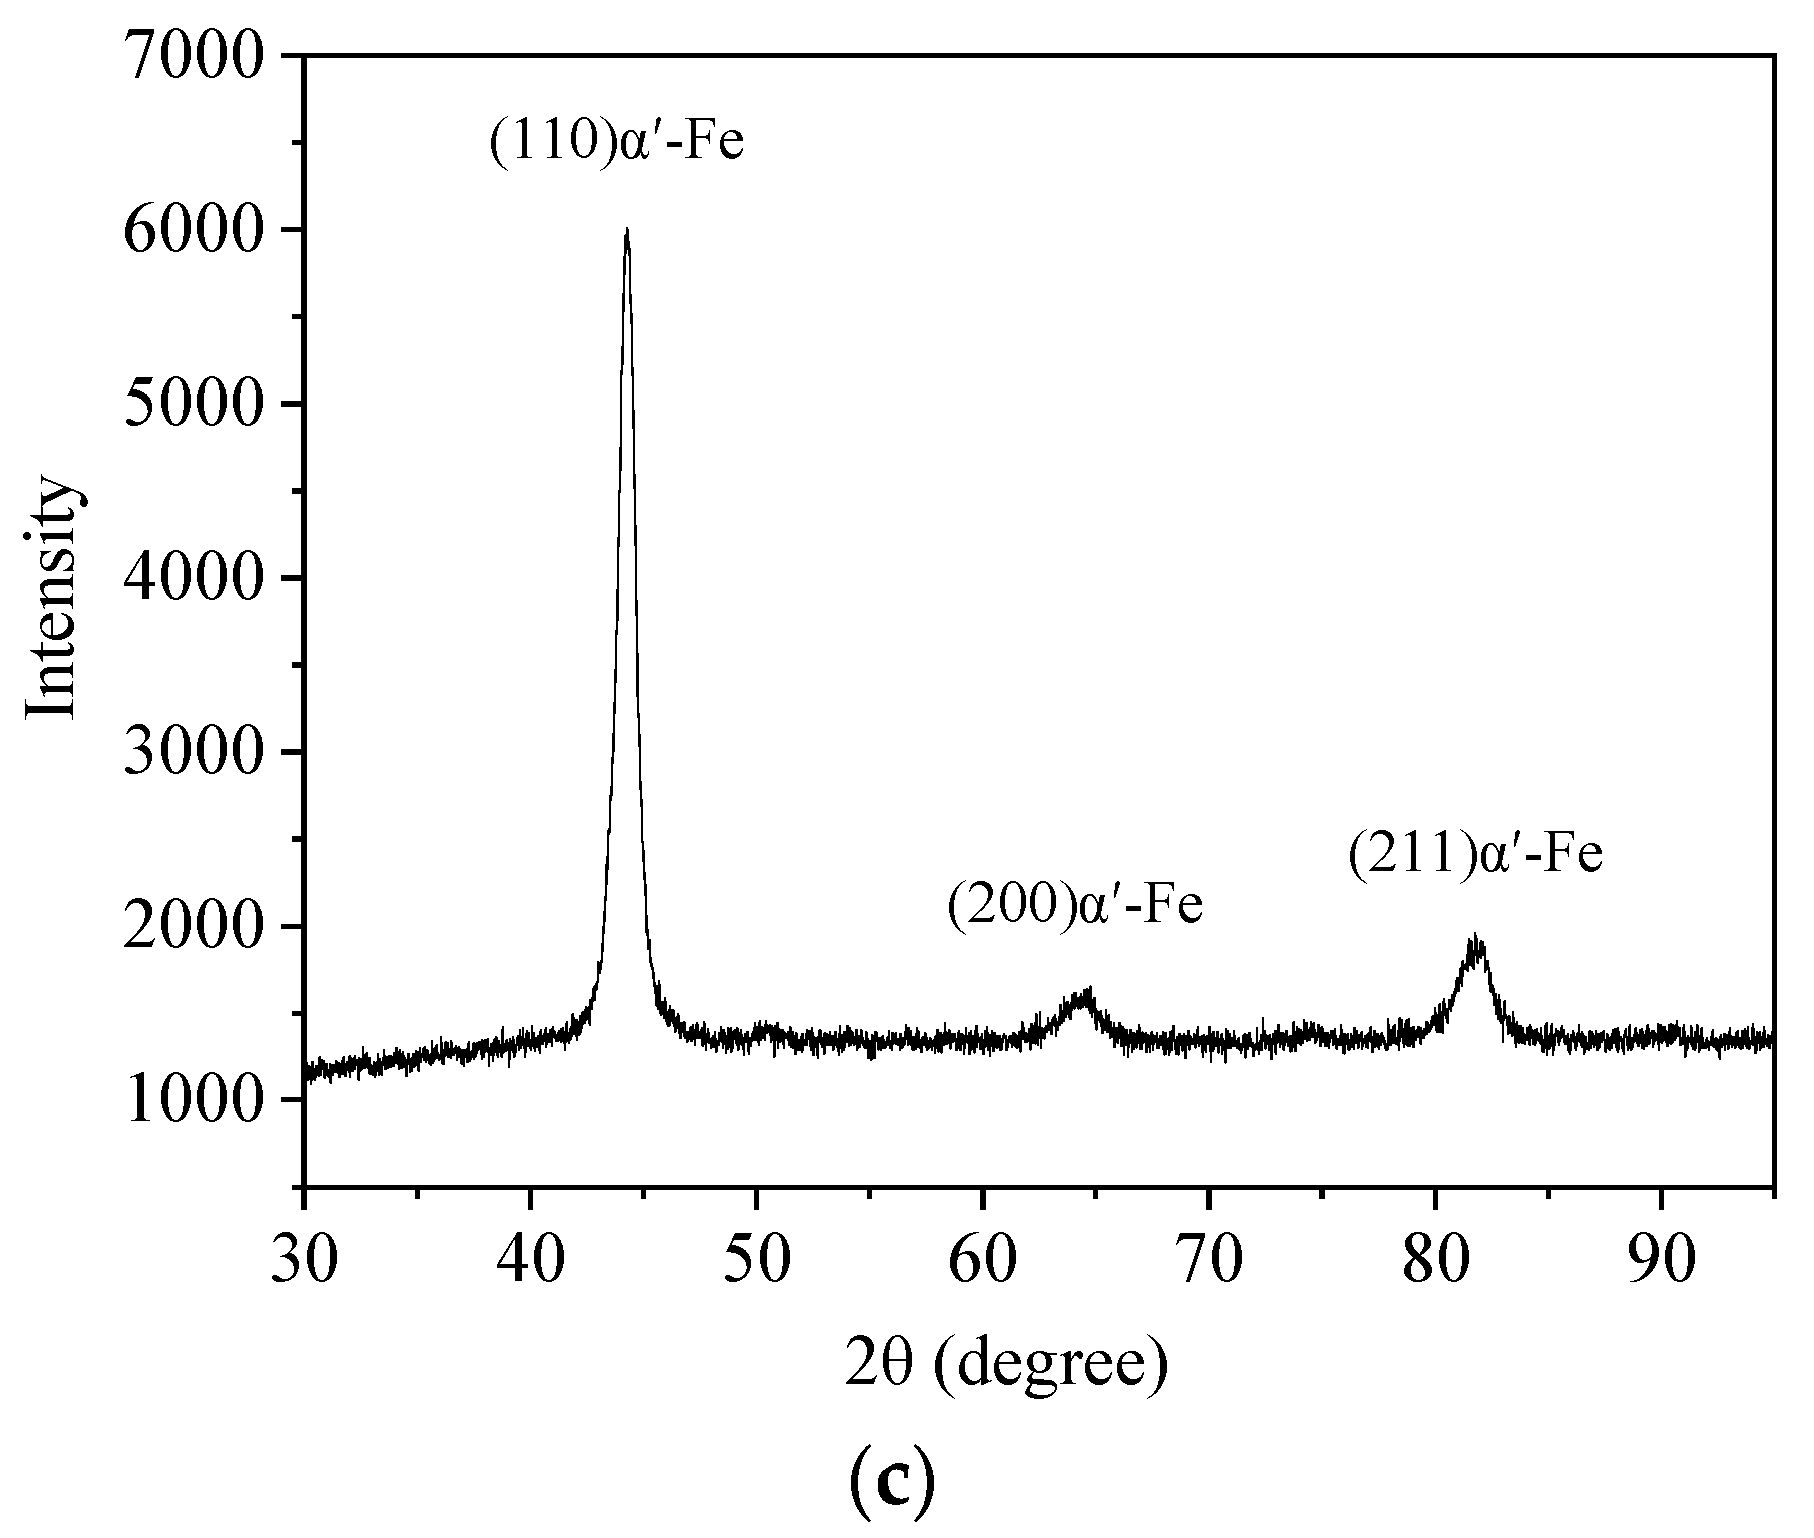
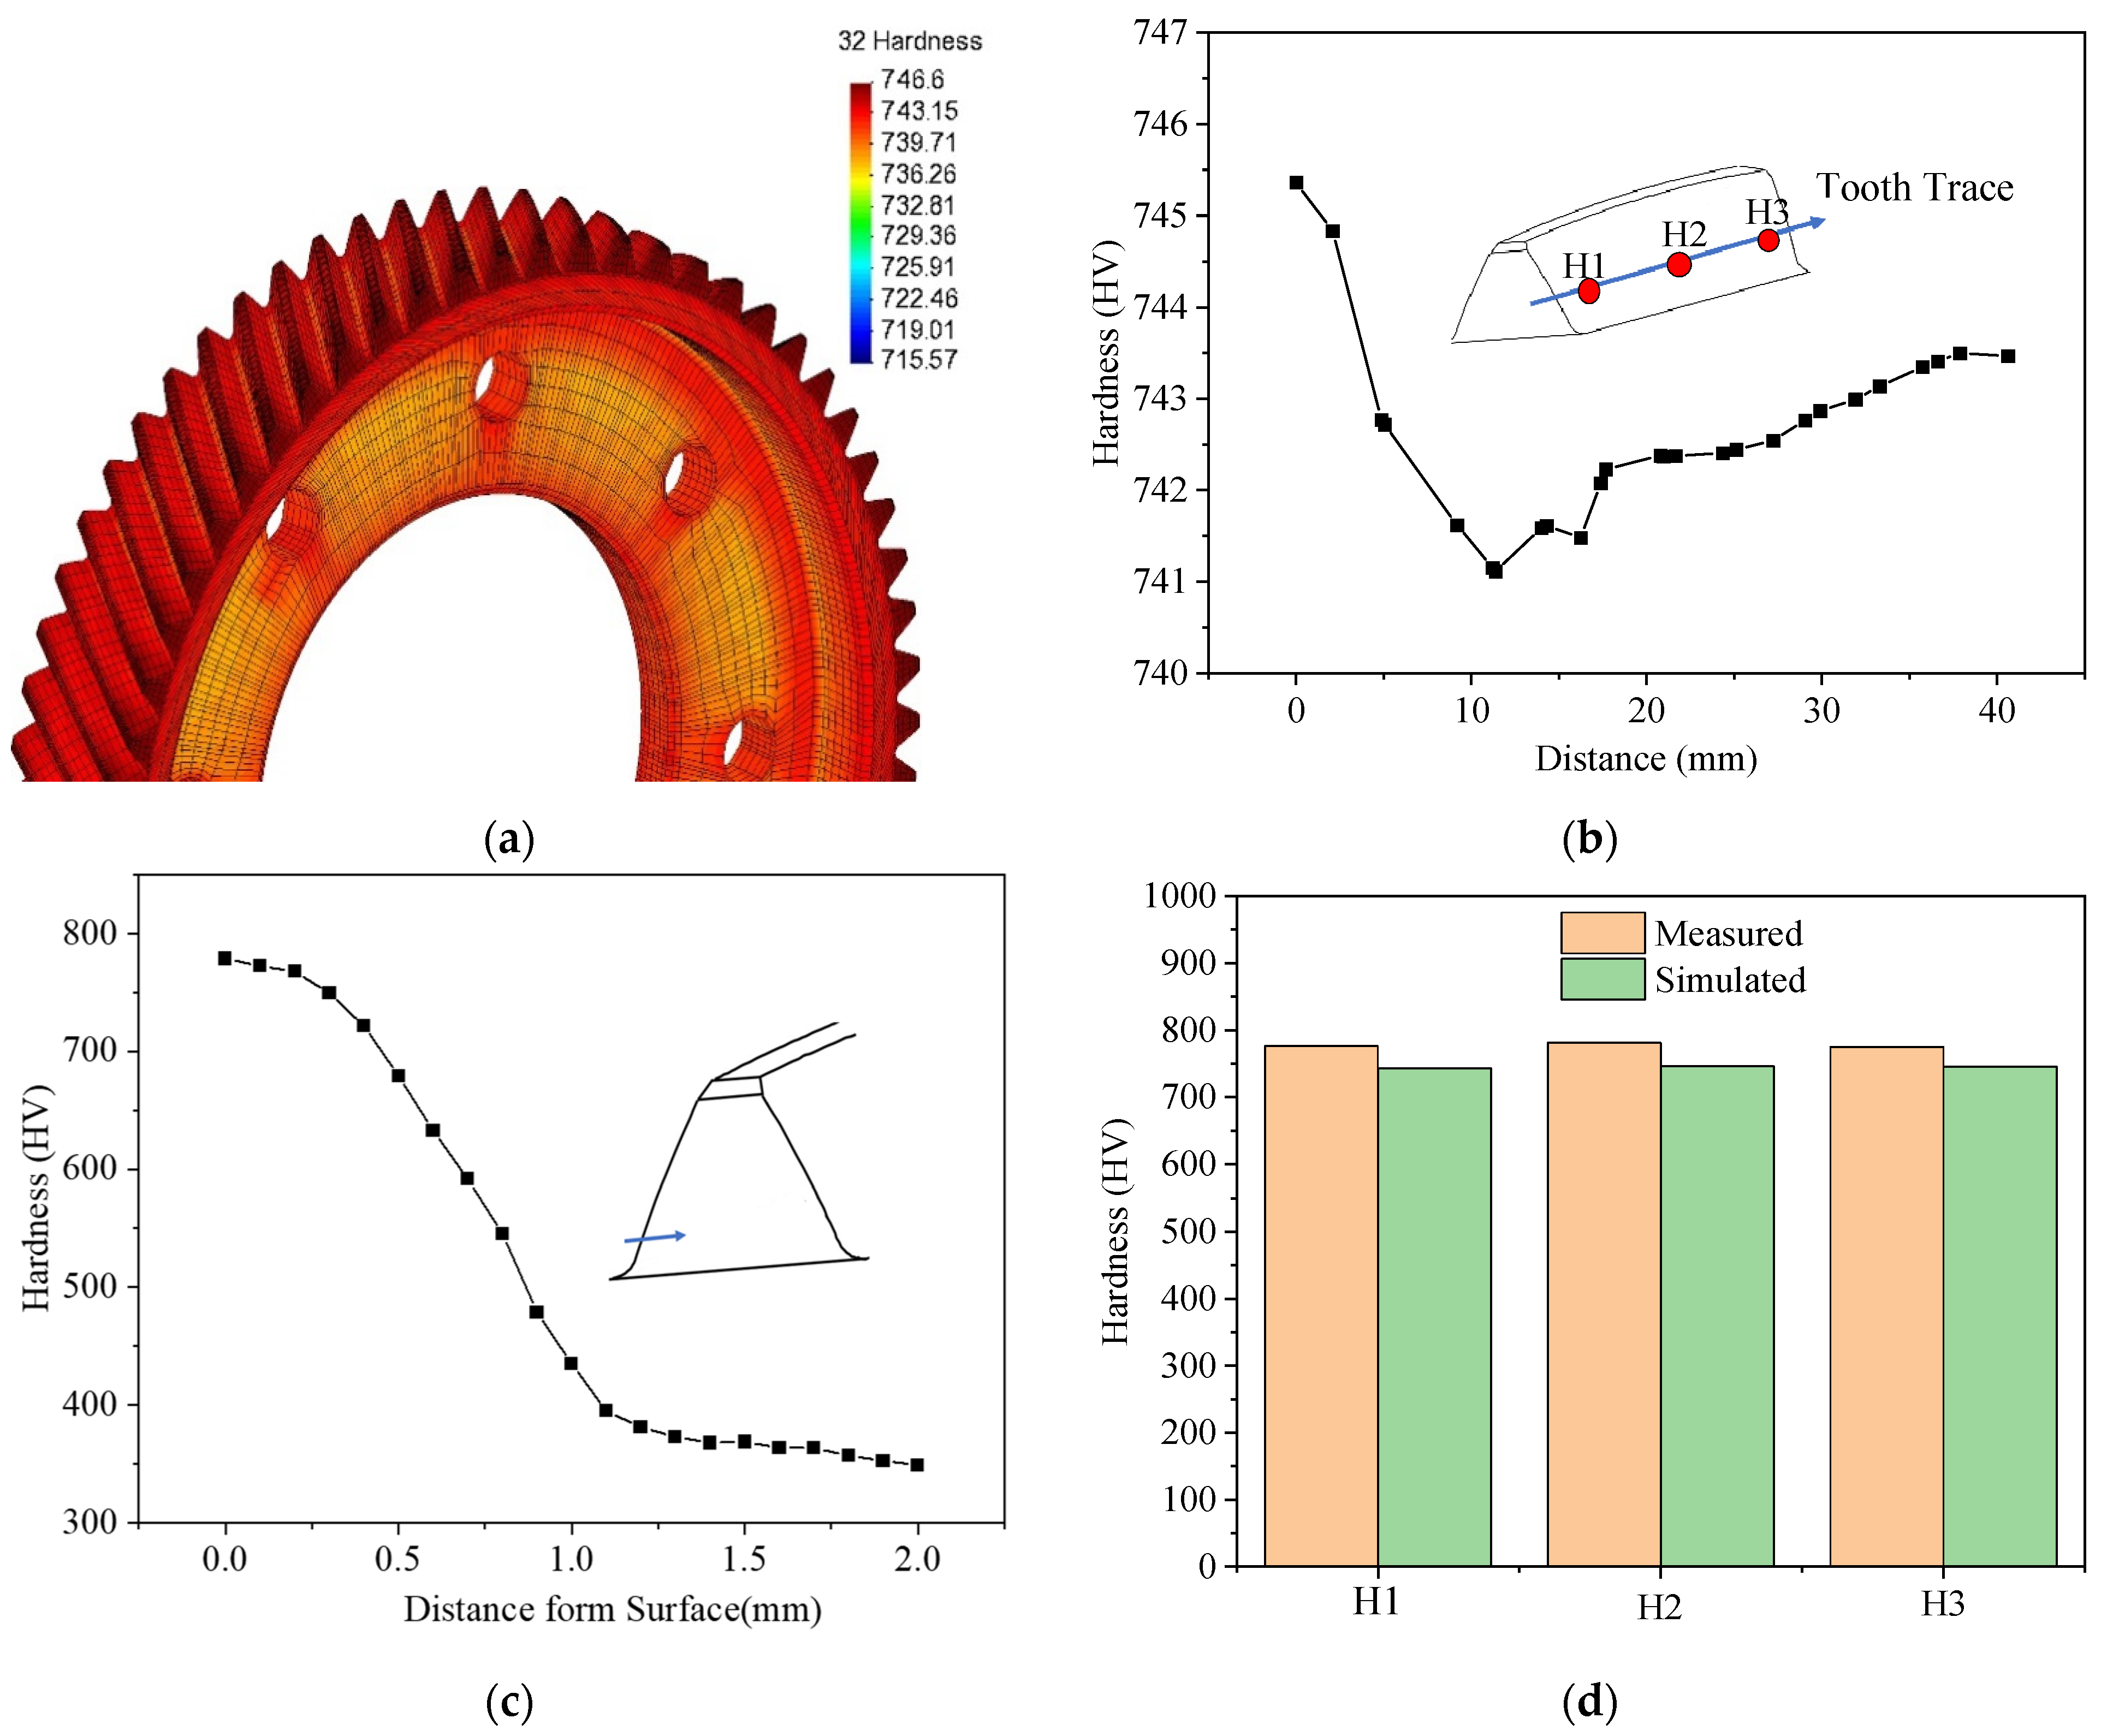
After carburizing and quenching, the maximum carbon content which appeared in the surface layer was 0.76%, the maximum hardness which appeared in the surface layer was 778.8 HV, and the depth of carburizing layer was about 0.9 mm.
(2)
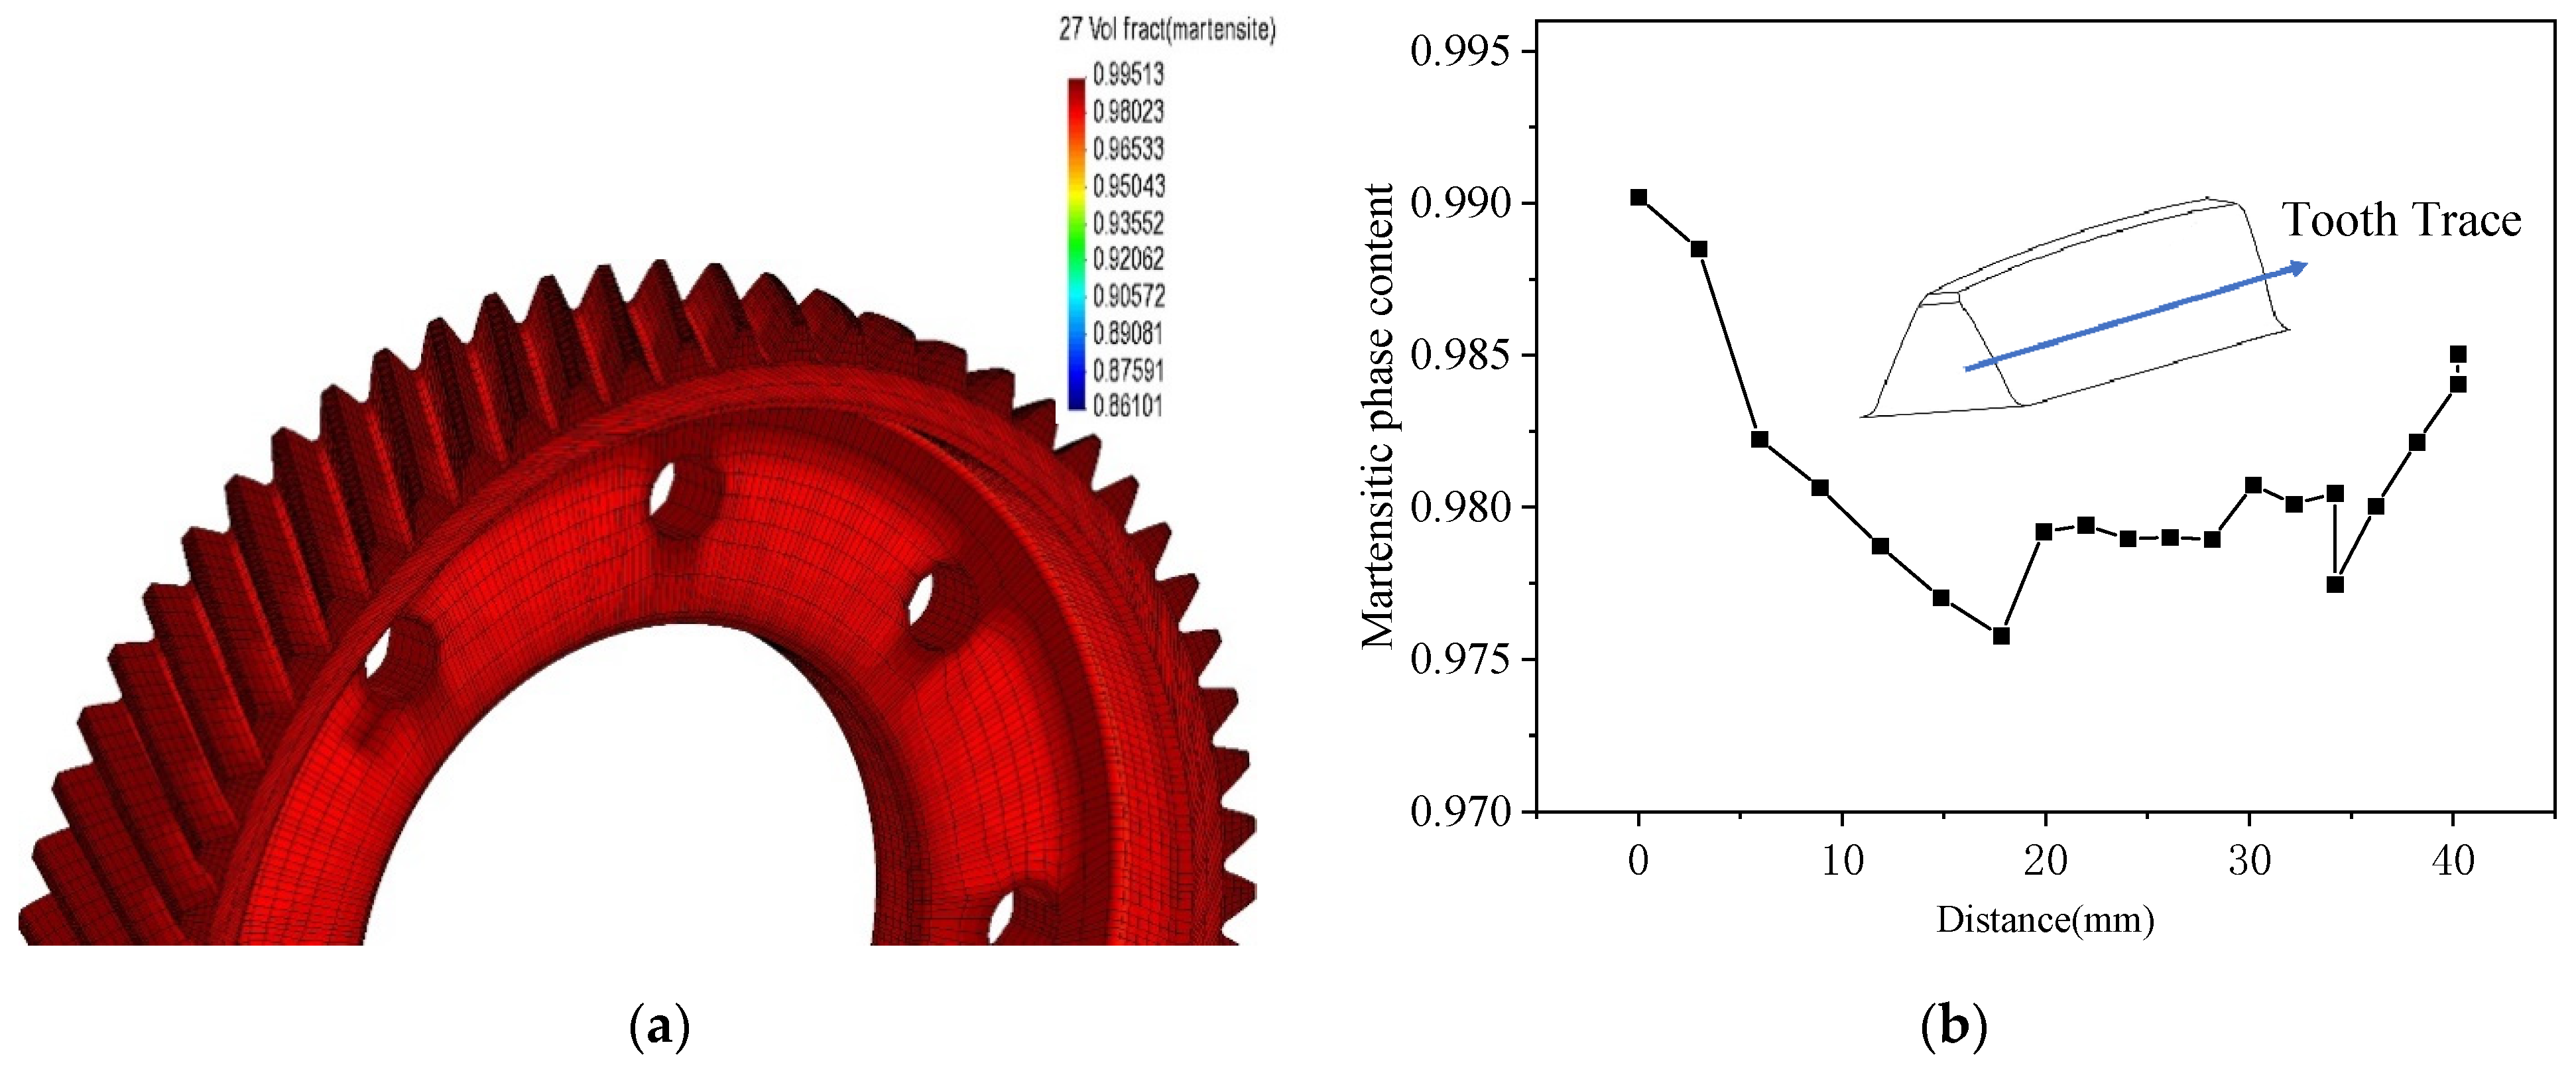
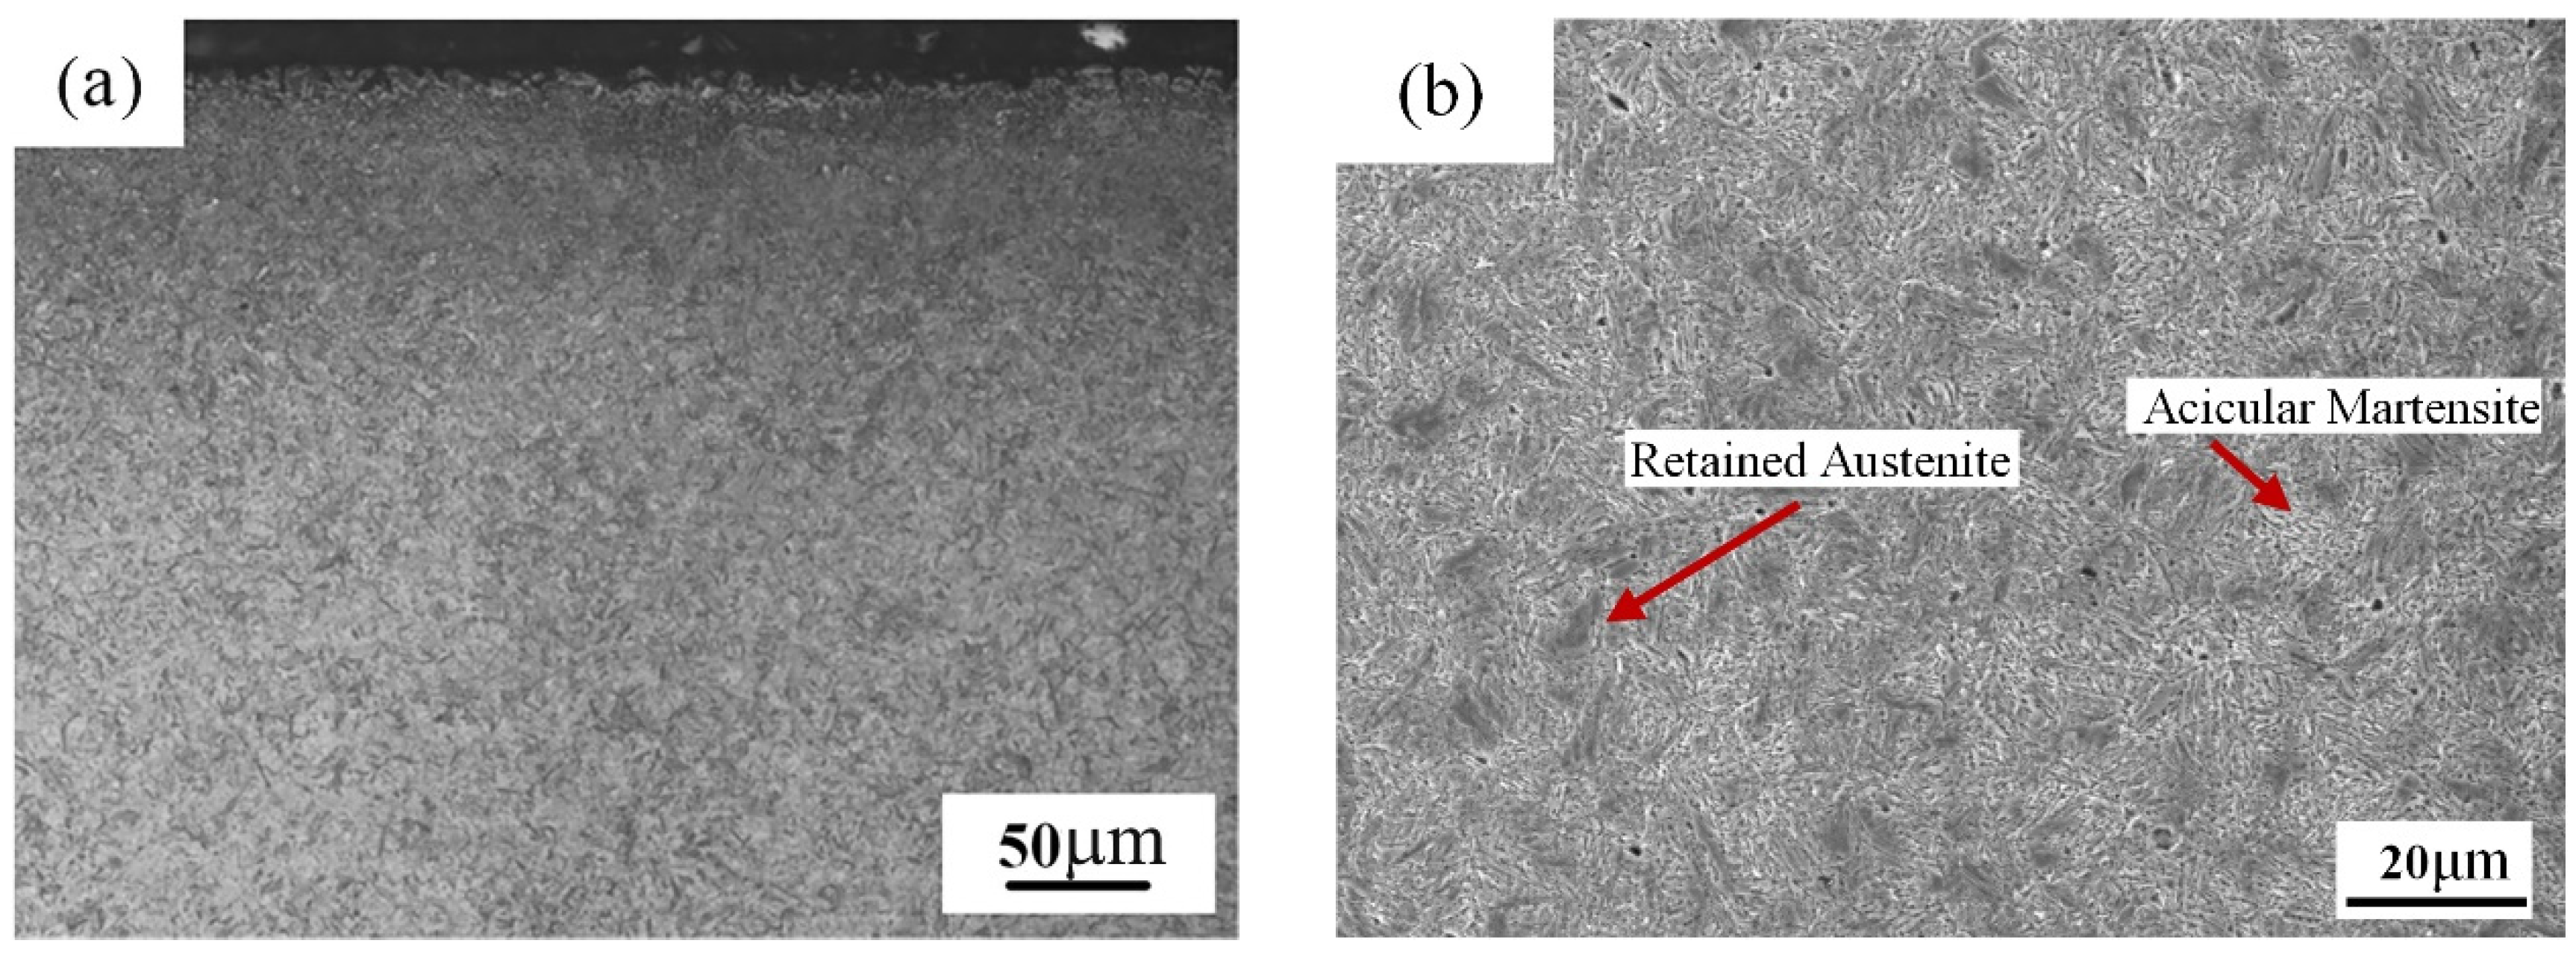
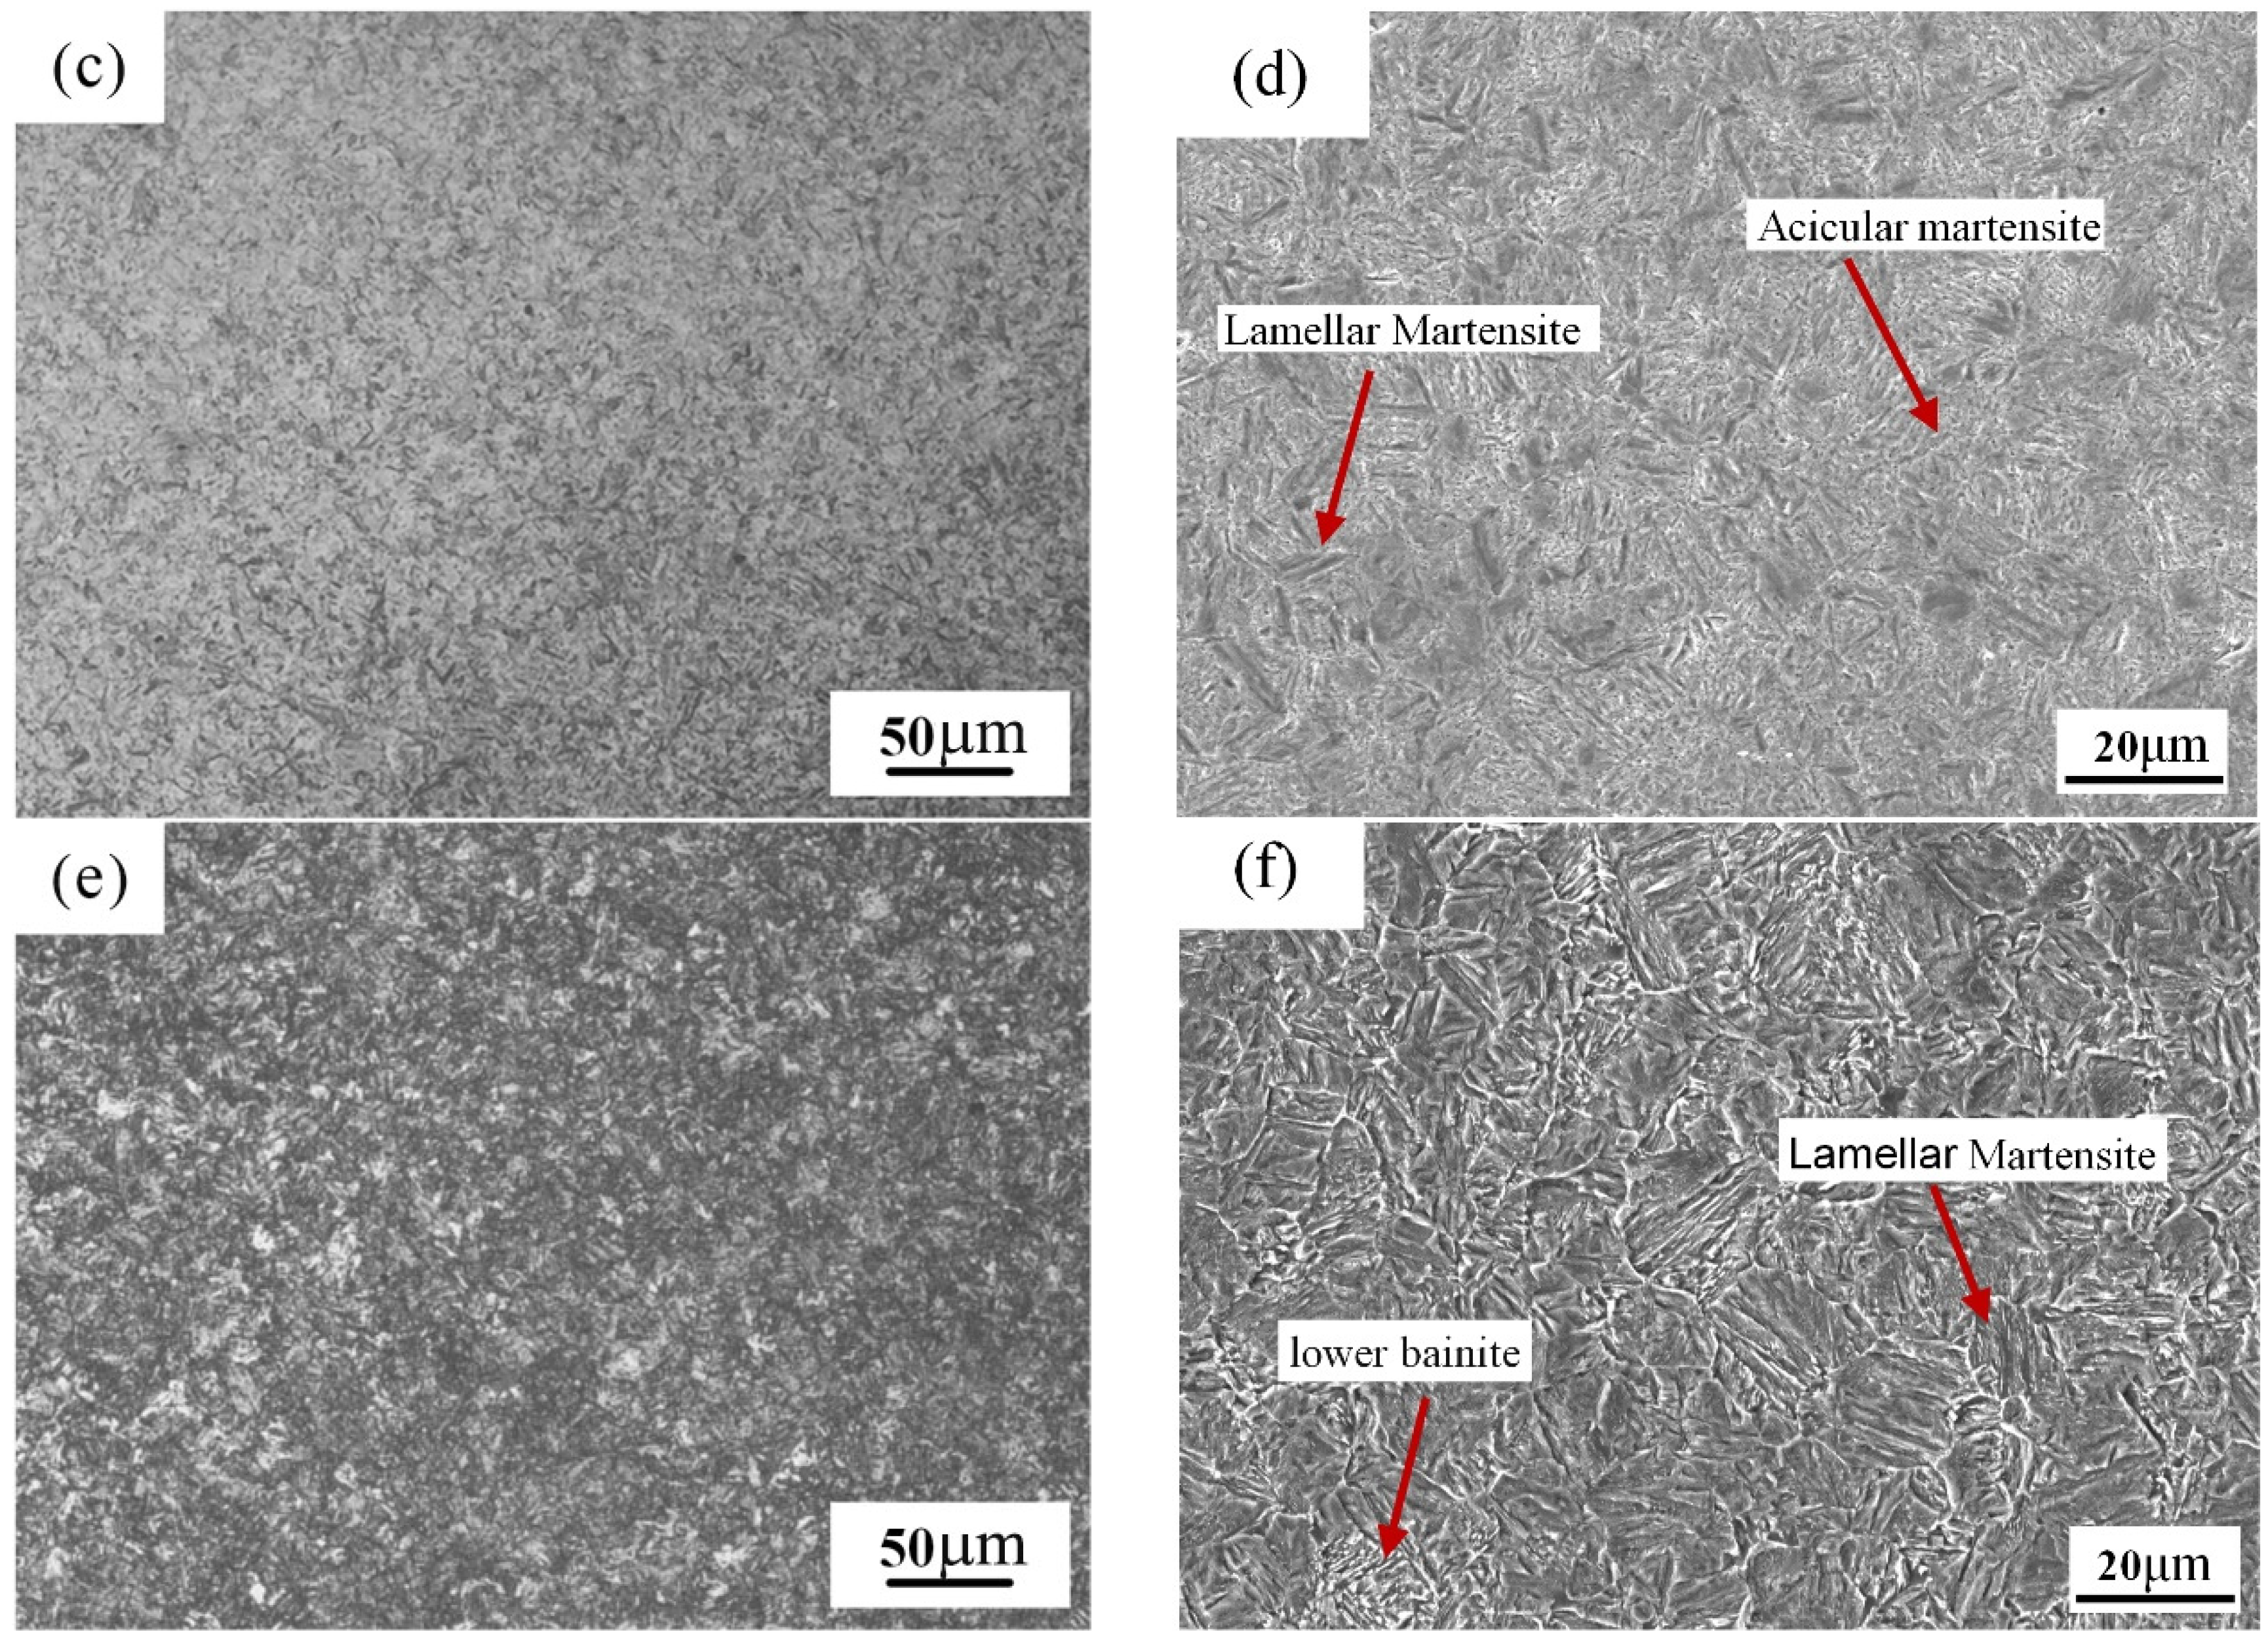
The microstructure of the carburized layer was fine acicular martensite and a small amount of retained austenite. The core cooling rate was close to the martensite transformation zone and contains a small amount of lower bainite.
(3)
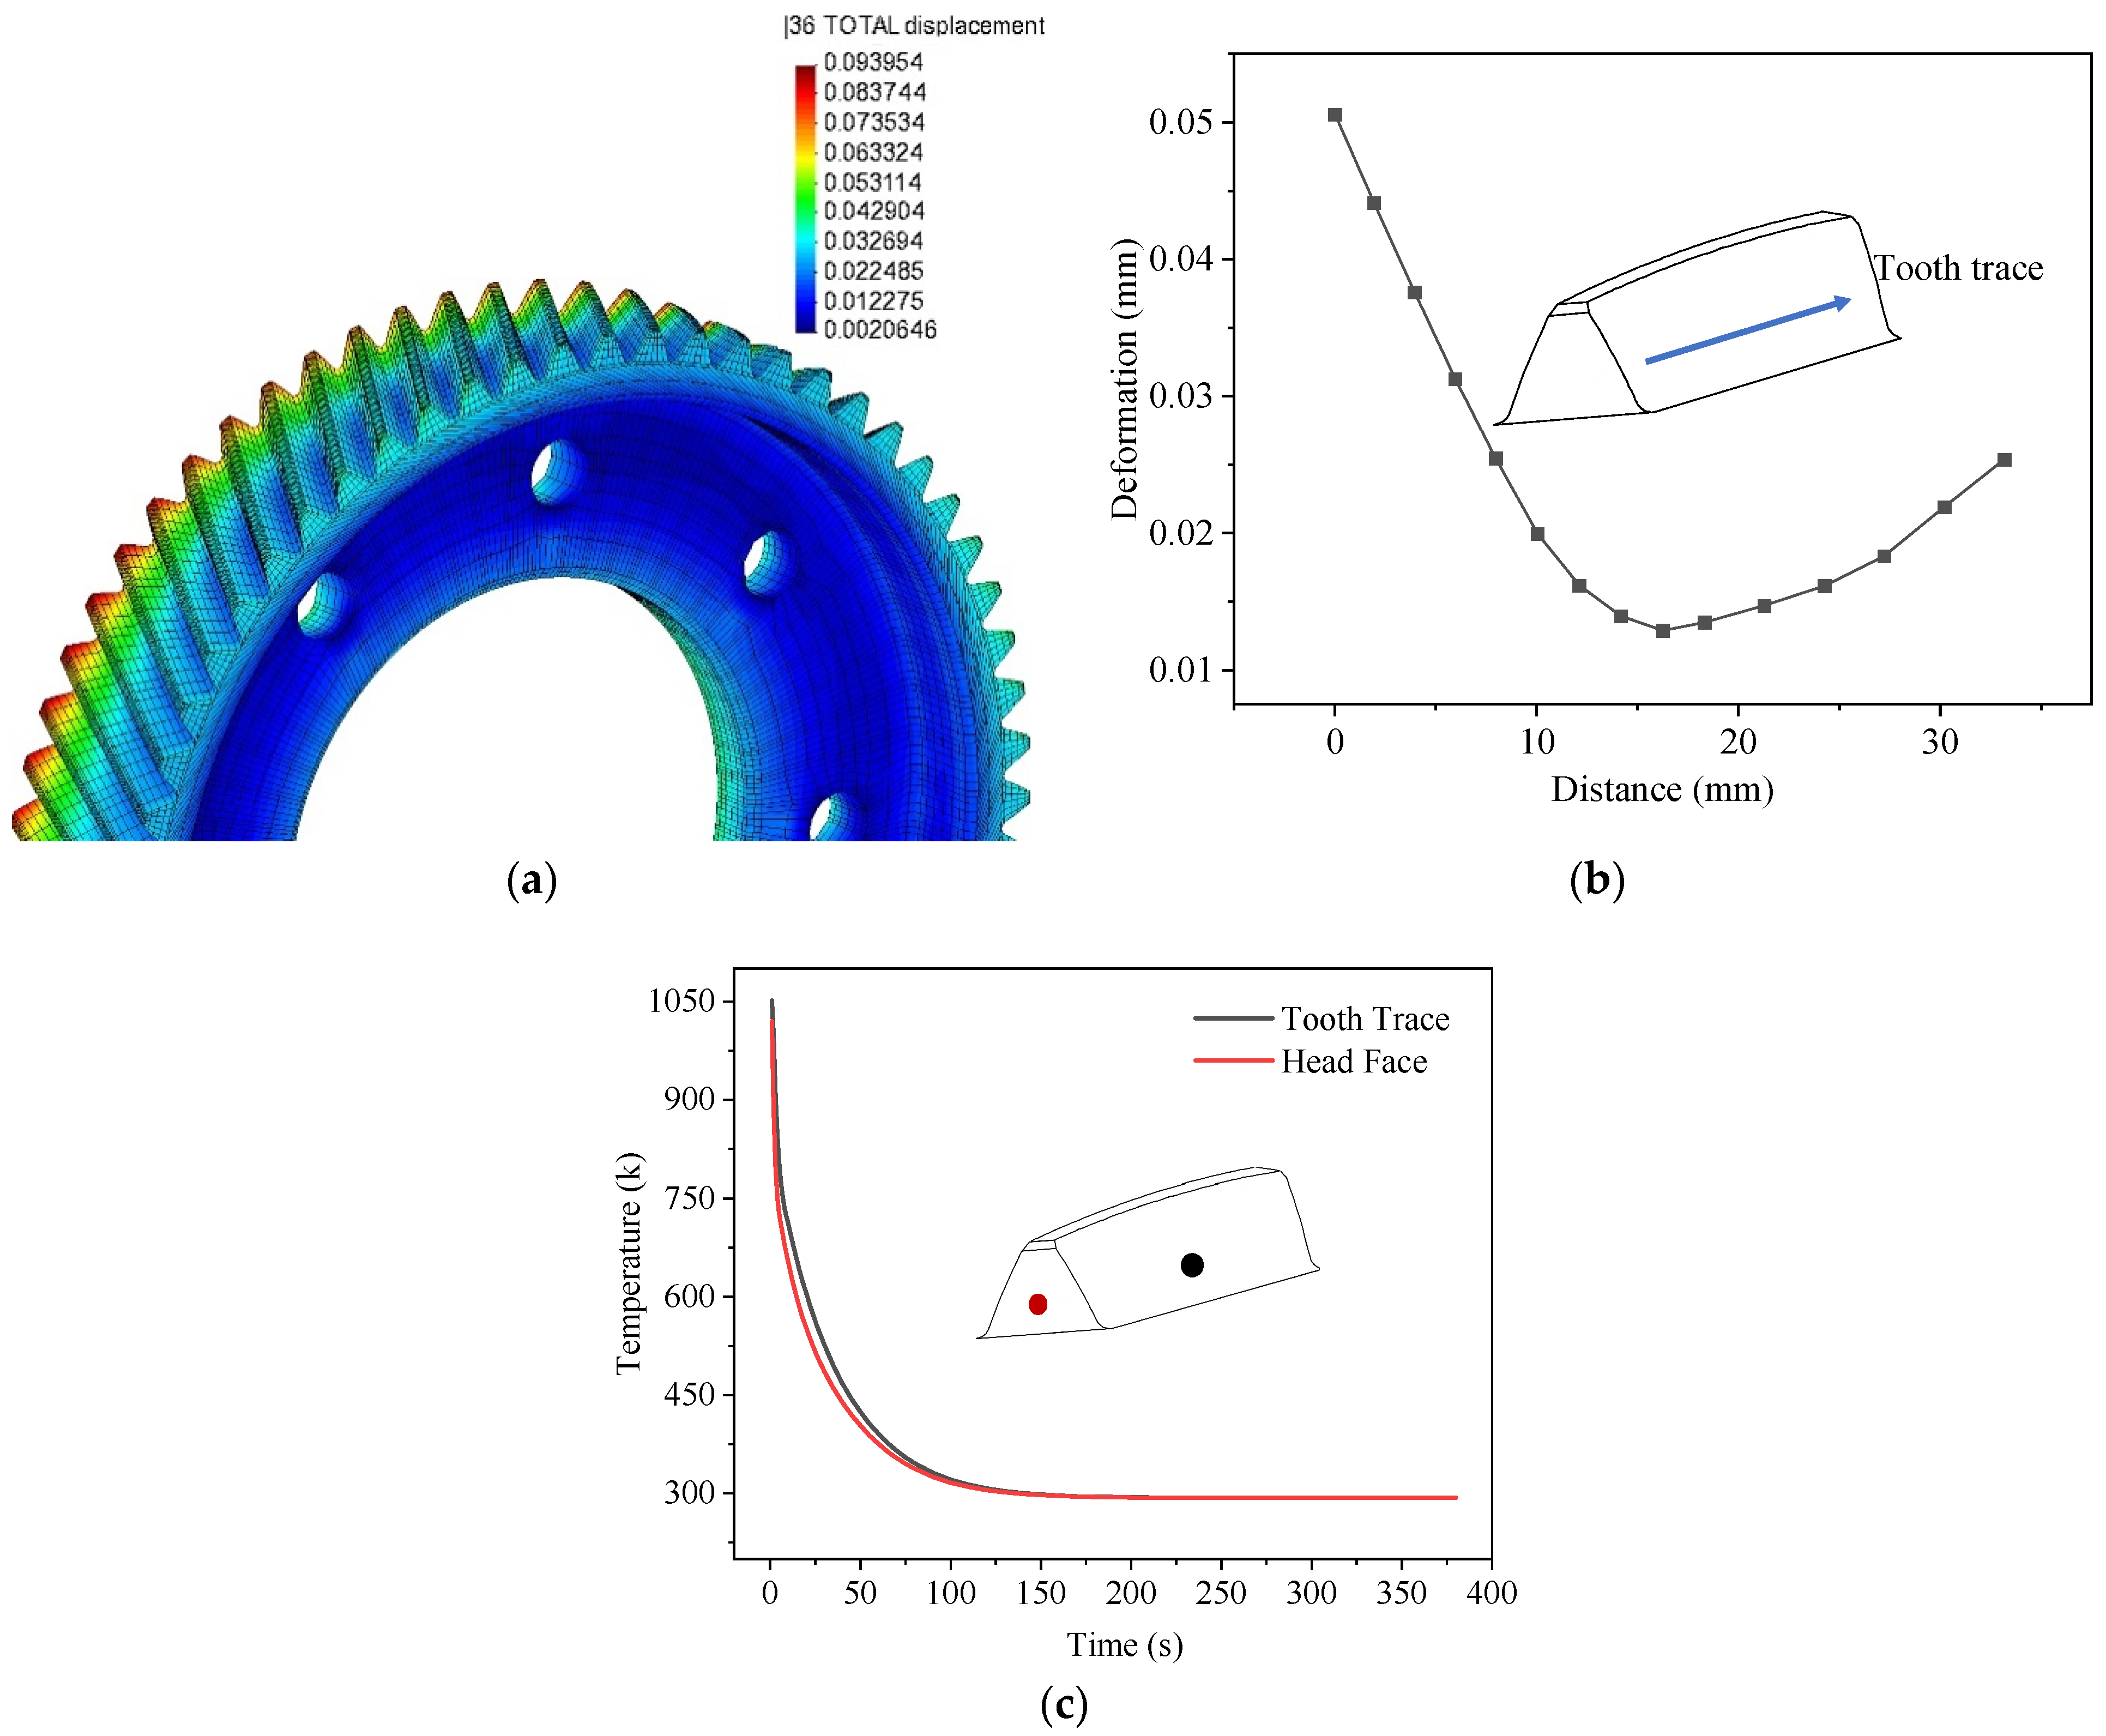
The temperature difference during quenching produces uneven thermal stress and microstructure stress, which made the gear produce uneven deformation.
(4)
This model simulates the gear after carburizing and quenching under the multi-field coupling effect of temperature field, stress–strain field, and phase transformation field. Compared with the experimental results, the simulation results are in good agreement with the experimental results. The distribution of carbon concentration, microstructure, and deformation was accurately predicted, indicating that the thermophysical parameters were accurate and the model could be used as a guide for practical application. This provides a prerequisite for the subsequent realization of the microstructure, and performance optimization and micro deformation control of gear steel.
(5)
The limitation of this model is that the simulated hardness calculation is mainly based on the average value of the simulated domain, while the hardness points measured in the experiment are concentrated in a small area. An error of less than 5% is highly reliable. However, the above factors need to be considered to improve the accuracy of the simulation method.

Author Contributions

Conceptualization, J.W., S.Y. and D.J.; Data curation, J.W., S.Y., F.H. and H.L.; Formal analysis, J.W. and S.Y.; Funding acquisition, J.W., S.Y., D.J. and Y.C.; Investigation, J.W., S.Y. and Y.C.; Methodology, J.W. and S.Y.; Project administration, J.W., S.Y., D.J. and Y.C.; Resources, J.W., S.Y. and D.J.; Software, J.W., S.Y. and X.L.; Supervision, J.W. and S.Y.; Validation, J.W., S.Y. and D.J.; Visualization, J.W. and S.Y.; Writing—original draft, J.W. and S.Y.; Writing—review & editing, J.W., S.Y. and J.L. All authors have read and agreed to the published version of the manuscript.

Funding

This research was funded by National Key R&D Program of China (NO. 2018YFE0207000).

Institutional Review Board Statement

Not applicable.

Informed Consent Statement

Not applicable.

Data Availability Statement

Not applicable.

Conflicts of Interest

The authors declare no conflict of interest.

References

  1. Hiremath, P.; Sharma, S.; Gowrishankar, M.C.; Shettar, M.; Gurumurthy, B.M. Effect of post carburizing treatments on residual stress distribution in plain carbon and alloy steels—A numerical analysis. J. Mater. Res. Technol. 2020, 9, 8439–8450. [Google Scholar] [CrossRef]
  2. Peng, Y.; Gong, J.; Chen, C.; Liu, Z.; Jiang, Y. Numerical analysis of Stress gradient and traps effects on carbon diffusion in AISI 316L during low temperature gas phase carburization. Metals 2018, 8, 214. [Google Scholar] [CrossRef] [Green Version]
  3. Dong, M.; Cui, X.; Lu, B.; Feng, X.; Jin, G.; Shi, L.; Wang, H. Accelerated diffusion of carbon and grain refinement of vacuum carburized layer by La ion implantation. J. Alloys Compd. 2020, 814, 152308. [Google Scholar] [CrossRef]
  4. Liu, L.; Li, Q.; Liu, X.; Gao, Y.; Ren, X.; Liao, B.; Yang, Q. Stress field simulation of carburized specimens with different carbon content during quenching process. Mater. Lett. 2007, 61, 1251–1255. [Google Scholar] [CrossRef]
  5. Besoky, J.I.; Danon, C.A.; Ramos, C.P. Retained austenite phase detected by Mössbauer spectroscopy in ASTM A335 P91 steel submitted to continuous cooling cycles. J. Mater. Res. Technol. 2019, 8, 1888–1896. [Google Scholar] [CrossRef]
  6. Liu, B.; Li, W.; Lu, X.; Jia, X.; Jin, X. The effect of retained austenite stability on impact-abrasion wear resistance in carbide-free bainitic steels. Wear 2019, 428, 127–136. [Google Scholar] [CrossRef]
  7. Moghaddam, P.V.; Hardell, J.; Vuorinen, E.; Prakash, B. The role of retained austenite in dry rolling/sliding wear of nanostructured carbide-free bainitic steels. Wear 2019, 428, 193–204. [Google Scholar] [CrossRef]
  8. Mackerle, J. Finite element analysis and simulation of quenching and other heat treatment processes: A bibliography (1976–2001). Comput. Mater. Sci. 2003, 27, 313–332. [Google Scholar] [CrossRef]
  9. Hamouda, A.M.S.; Sulaiman, S.; Lau, C.K. Finite element analysis on the effect of workpiece geometry on the quenching of ST50 steel. J. Mater. Process. Technol. 2001, 119, 354–360. [Google Scholar] [CrossRef]
  10. Ferguson, B.L.; Li, Z.; Freborg, A.M. Modeling heat treatment of steel parts. Comput. Mater. Sci. 2005, 34, 274–281. [Google Scholar] [CrossRef]
  11. Şimşir, C.; Gür, C.H. 3D FEM simulation of steel quenching and investigation of the effect of asymmetric geometry on residual stress distribution. J. Mater. Process. Technol. 2008, 207, 211–221. [Google Scholar] [CrossRef]
  12. Mukai, R.; Ju, D.Y. Simulation of carburizing-quenching of a gear. Effect of carbon content on residual stresses and distortion. In Journal de Physique IV (Proceedings). EDP Sci. 2004, 120, 489–497. [Google Scholar]
  13. Lee, K.O.; Kim, J.M.; Chin, M.H.; Kang, S.S. A study on the mechanical properties for developing a computer simulation model for heat treatment process. J. Mater. Process. Technol. 2007, 182, 65–72. [Google Scholar] [CrossRef]
  14. Farivar, H.; Deepu, M.J.; Hans, M.; Phanikumar, G.; Bleck, W.; Prahl, U. Influence of post-carburizing heat treatment on the core microstructural evolution and the resulting mechanical properties in case-hardened steel components. Mater. Sci. Eng. A 2019, 744, 778–789. [Google Scholar] [CrossRef]
  15. Farivar, H.; Prahl, U.; Hans, M.; Bleck, W. Microstructural adjustment of carburized steel components towards reducing the quenching-induced distortion. J. Mater. Process. Technol. 2019, 264, 313–327. [Google Scholar] [CrossRef]
  16. Cao, Y.G. Study on Hardenability, Heat Treatment Distortion and Fatigue Property of Carburized Gear Steels; Central Iron & Steel Research Institute: Beijing, China, 2017. [Google Scholar]
  17. Inoue, T.; Ju, D.Y.; Arimoto, K. Proceedings 1st International. Conference on Quenching and the Control of Distortion; ASM International: Almere, The Netherlands, 1992; pp. 205–212. [Google Scholar]
  18. Bowen, R.M. Continuum Physics; Eringen, A.C., Ed.; Academic Press: Cambridge, MA, USA, 1976; Volume 3, pp. 2–129. [Google Scholar]
  19. Magee, C.L. Nucleation of Martensite; ASM International: Materials Park, OH, USA, 1968; Volume 3. [Google Scholar]
  20. Kim, D.W.; Cho, H.H.; Lee, W.B.; Cho, K.T.; Cho, Y.G.; Kim, S.J.; Han, H.N. A finite element simulation for carburizing heat treatment of automotive gear ring incorporating transformation plasticity. Mater. Des. 2016, 99, 243–253. [Google Scholar] [CrossRef]
  21. Zhong, H.; Wang, Z.; Gan, J.; Wang, X.; Yang, Y.; He, J.; Wei, T.; Qin, X. Numerical simulation of martensitic transformation plasticity of 42CrMo steel based on spot continual induction hardening model. Surf. Coat. Technol. 2020, 385, 125428. [Google Scholar] [CrossRef]
  22. Ju, D.Y.; Zhang, W.M.; Zhang, Y. Modeling and experimental verification of martensitic transformation plastic behavior in carbon steel for quenching process. Mater. Sci. Eng. A 2006, 438, 246–250. [Google Scholar] [CrossRef]
  23. Johnson, W.A.; Mehl, R.F. Reaction kinetics in processes of nucleation and growth. Am. Inst. Min. Metal. Petro. Eng. 1939, 135, 416–458. [Google Scholar]
  24. Fu, P.; Zhou, P.; Zhao, T.Y.; Song, Y.P.; Huang, Z.W. Study of the heat transfer coefficient of a nickel-based superalloy in the end-quench test with air. Int. J. Therm. Sci. 2020, 155, 106416. [Google Scholar] [CrossRef]
  25. Lu, J.F.; Bourouga, B.; Ding, J. Transient boiling heat transfer performances of subcooled water during quenching process. Int. Commun. Heat Mass Transf. 2013, 48, 15–21. [Google Scholar] [CrossRef]
  26. Miao, S.; Ju, D.Y.; Chen, Y.; Liu, Y.Q. Optimization based on orthogonal experiment design and numerical simulation for carburizing quenching process of helical gear. Mater. Perform. Charact. 2018, 8, 66–79. [Google Scholar] [CrossRef]
  27. Ma, L.; Wang, M.Q.; Shi, J.; Hui, W.J.; Dong, H. Influence of niobium microalloying on rotating bending fatigue properties of case carburized steels. Mater. Sci. Eng. A 2008, 498, 258–265. [Google Scholar] [CrossRef]
  28. Magee, C.L. In Phase Transformation; ASM International: Metals Park, OH, USA, 1970; 115p. [Google Scholar]
  29. Dhir, V.K. Proceedings of the Third Microgravity Fluid Physics Conference; CP-3338; NASA: Washington, DC, USA, 1996; pp. 153–158. [Google Scholar]
  30. Jan, J.; Scott Mac Kenzie, D. Thermal Processing in Motion 2018-Conference Proceedings; ASM International: Almere, The Netherlands, 2018; Volume 9, pp. 112–123. [Google Scholar]
  31. Kanamori, H.; Ju, D.Y. Identification of Heat Transfer Coefficients and Simulation of Quenching Distortions on Disk Probe. Mater. Trans. 2020, 61, 884–892. [Google Scholar] [CrossRef]
Figure 1. Physical parameters: (a) Specific heat coefficient; (b) density coefficient; (c) Young’s modulus and Poisson’s ratio; and (d) Hardening coefficient.
Coatings 11 01132 g001
Figure 2. (a) Helical gear three-dimensional model; (b) restrictive conditions; and (c) simulation value of carbon concentration.
Coatings 11 01132 g002aCoatings 11 01132 g002b
Figure 3. Heat transfer coefficient curve.
Coatings 11 01132 g003
Figure 4. Heat treatment process curve.
Coatings 11 01132 g004
Figure 5. Carbon concentration distribution (a) Carbon concentration distribution cloud atlas after carburizing and quenching; (b) Contrast measured value and simulation value.
Coatings 11 01132 g005
Figure 6. 20CrMnTiH organization before carburizing (a) Metallograph; (b) SEM.
Coatings 11 01132 g006
Figure 7. (a) Martensite phase distribution cloud atlas after carburizing and quenching; (b) simulation value of surface martensitic phase content of surface; and (c) XRD diffraction diagram of the carburized layer surface.
Coatings 11 01132 g007aCoatings 11 01132 g007b
Figure 8. 20CrMnTiH organization after carburizing (a) OM surface; (b) SEM surface; (c) OM transition; (d) SEM transition; (e) OM center; and (f) SEM center.
Coatings 11 01132 g008aCoatings 11 01132 g008b
Figure 9. (a) Hardness distribution cloud atlas after carburizing and quenching; (b) simulation value of surface hardness; (c) measured in-depth micro-hardness of the carburized specimens; and (d) measured and simulated surface hardness value contrast.
Coatings 11 01132 g009
Figure 10. (a) Deformation distribution cloud atlas after carburizing and quenching; (b) simulation value of surface deformation; and (c) temperature evolution of the surface.
Coatings 11 01132 g010
Table 1. Dimension and main parameters of the gear.
Gear ParametersData
Module2.68
Pressure angle25°
Number of teeth61
Helix angle31°
Modification coefficient−0.1965
Reference diameter190.721 mm
Base diameter167.535 mm
Addendum diameter196.1 mm
Root diameter182.164 mm
Table 2. Measured and simulated surface deformation value contrast.
Number of TeethSimulated Deformation (mm)Measured Deformation (mm)
10.0510.055
180.0260.012
340.0400.017
500.0450.020
Publisher’s Note: MDPI stays neutral with regard to jurisdictional claims in published maps and institutional affiliations.

