Article

High Response of Ethanol Gas Sensor Based on NiO-Doped Apple Pectin by the Solution Process

1
Institute of Microelectronics, Department of Electrical Engineering, National Cheng Kung University, Tainan 70101, Taiwan
2
Department of Engineering Science, National Cheng Kung University, Tainan 70101, Taiwan
3
Department of Photonics, National Cheng Kung University, Tainan 70101, Taiwan
*
Author to whom correspondence should be addressed.
Coatings 2021, 11(9), 1073; https://doi.org/10.3390/coatings11091073
Submission received: 16 August 2021 / Revised: 30 August 2021 / Accepted: 31 August 2021 / Published: 5 September 2021
(This article belongs to the Topic Multiple Application for Novel and Advanced Materials)

Abstract

:
Novel gas sensor devices, based on biomaterial apple pectin film (APN) doped with NiO, were fabricated for the first time using a solution processing technique. The device was then annealed in a microwave chamber. The structural, elemental, and surface morphology of the device was investigated, using TEM, XPS, and AFM, respectively. The as-fabricated film sensor possessed a superior sensing performance regarding ethanol gas, compared to the pure apple pectin film sensor. The response of the device was recorded at a maximum efficiency of 161. For a 10 ppm concentration of ethanol gas at an operational temperature of 250 °C, the response time was 1.379 s. Nevertheless, the sensing mechanism for the sensor device is also described thoroughly.

1. Introduction

Ethanol is a volatile, flammable, colorless liquid with a molecular formula of C2H5OH, which is also known as ethyl alcohol. Ethanol is commonly used in different applications, such as hand sanitizers in hospitals. The appropriate alcohol concentration can help with sterilization and disinfectant [1]. However, ethanol contains hydrogen–oxygen bond volatile organic compounds. Excessive concentrations of this compound may cause physical discomfort. Meanwhile, alcoholic drinks are inexpensive and very easy to buy. Long-term drinking can damage body organs and affect the ability of people to think, control emotions, and regulate behavior. Some road accidents are attributed to drunk driving, threatening many lives and properties [2]. Therefore, developing a high-sensitivity alcohol gas sensor is necessary.
In recent years, methods such as the metal oxide semiconductor (MOS) adsorption of precious metals (Au, Pt), or the use of heterostructures, have been widely employed in alcohol gas-sensing applications [3,4,5,6,7,8,9]. NiO is an electron-donating p-type semiconductor material with a cubic crystal structure. It has a wide energy gap (3.6–4.0 eV), good thermal stability, chemical stability, and optical properties, and it is often used in solar cells, photodetectors, electrochemical materials, and gas sensors [10,11,12]. According to some of the literature, the MOS of NiO nanostructures has attracted plenty of attention as a gas-sensing material, which possesses an excellent catalytic activity for VOCs [13,14]. It is necessary to develop and fabricate a potential NiO material for high sensitivity gas sensors.
Arshak et al. revealed that ultrathin hexagonal NiO nanosheets grew using a simple hydrothermal method, with the best device response occurring at 250 °C with 50 ppm ethanol [15]. Miao et al. synthesized the novel morphology of flake-flower NiO architectures, in which the surface area of the device possessed the highest ethanol response at 400 ppm, 300 °C [16]. Rai et al. utilized a simple solution process to synthesize the Au@NiO yolk–shell nanoparticles (NPs), which is an efficient gas sensor for H2S gas, with the ethanol response being almost three at 5 ppm, 400 °C [17]. Sayan et al. used NiO/ZnO p-n heterojunction diodes to detect the sensitivity of different VOCs, and found that these diodes can detect alcohol gas, although they show a weak response [18]. Artem et al. reported that pure and Au-functionalized p-type NiO MOS metal detects methanol and acetone. The oxidation of reducing gas molecules releases the surface-trapped electrons into the semiconductor, which increases the resistance of p-type MOS, and the responsivity can be improved using metal–oxygen bond energy or surface acidity [19]. Teboho et al. revealed an excellent response of 60 ppm H2S at a relatively low temperature (75 °C), which is induced by a relatively higher Brunauer–Emmett–Teller surface area, large pore diameter, and the presence of a large number of surface defects, related to oxygen or nickel vacancies [20]. However, few studies have focused on organic materials that are decorated with MOS materials in gas sensing (Table 1).
The motivation of this experiment is to use the biomaterial apple pectin as the main bulk to reduce environmental pollution, and to use p-type NiO as the gas-sensing material. The device was baked using advanced microwave processing, and the APN components are expected to have high sensitivity, response time, and stability (regarding the alcohol sensor). Finally, the sensing mechanism of the APN device in ethanol gas is discussed.

2. Materials and Methods

2.1. Materials

The pectin from apple and nickel oxide dispersions (99.98%) was purchased from Sigma-Aldrich and UNI-ONWARD Corporation, respectively. All the chemicals and MOS solution were used as received, without any purification treatment or further heating.

2.2. Sensor Fabrication

Apple pectin solution (2 wt%) was prepared by placing pectin powder in deionized water, and stirring until completely dissolved on the magnetic stirrer (UNI-ONWARD CORP., New Taipei City, Taiwan). To synthesize the NiO-doped apple pectin solution, the solution of apple pectin and NiO nanoparticles dispersion liquid was mixed, constantly stirring under an ambient temperature, and prepared for the APN solution. The APN gas sensors were fabricated, during which the APN solution spun on the cleaned glass (2 cm × 1.5 cm) and was baked in a microwave oven (500 W) for 10 min. Finally, the device was put through a shadow mask deposition around a 100 nm aluminum metal electrode, using a PVD E-beam evaporator (ULVAC Inc., Chigasaki, Japan). The device has four pairs of interdigitated parallel lines (five fingers). The interdigital width, length, and gap distance are 0.25, 4.5 and 0.25 nm, respectively. The response for the gas sensor device is defined by Equation (1) below, which the resistance of the target gas and the air is defined as Rgas and Rair, respectively [7].
S = R gas R air R air

2.3. Characterization

The APN device examined the surface composition and chemical states of the elements using XPS (PHI 5000 Versa Probe, Physical Electronics, Inc., Chanhassen, MN, USA). Morphological investigation of the prepared film was carried out using an AFM (Dimension ICON with a Nano Scope V controller, Bruker, Kaohsiung, Taiwan). Structures and element distribution were observed using TEM (JEM-2100F, GD Capital Co., Ltd., Taipei city, Taiwan) and line scan analysis. The gas sensor performance at distinct temperatures, and under an ambient gas and ethanol atmosphere (in the electrical analytic system), was measured using Keithley 2636B (TEKTRONIX, INC., Taipei city, Taiwan)

2.4. Device Measurement

The APN gas-sensing device was placed on a heating platform inside the chamber, and was heated to 250 °C in an ambient atmospheric environment. It is worth noting that the pressure of the chamber was reduced by evacuating some air through the vacuum pump. Afterwards, the target gas was flowed into the chamber using the pressure differential. The I–V curves in the air, and the alcohol of the 10 ppm concentration, were measured using Keithley 2636b. The measurement time for each gas was 60 s, with an applied voltage of 1 V.

3. Result and Discussion

3.1. XPS Analysis

The chemical composition and state of the APN device was characterized by using XPS spectra. Figure 1a displays the entire XPS analysis spectra, detecting a near-surface composition with the predominant presence of C, O, N, and Ni atomics (with composition percentages of 59.1%, 38.9%, 1.3%, and 0.7%, respectively). The high-resolution XPS for O1s and Ni peak are also analyzed. The O1s peak has been resolved into peaks at 532.8 and 534.8 eV, which represents the carbonyl group (C=O) and carbon–oxygen (C–O) bond as in Figure 1b [21,22]. The XPS spectra for the Ni peak contained a noise signal, due to the low concentration of NiO NPs.

3.2. FTIR Analysis

Figure 2 shows the FTIR spectrum of the APN thin film. The bands around the region of 3394 cm−1 are attributed to the O–H band stretching vibration. The peak at 2927 cm−1 indicated a C–H stretching vibration. The band cantered at 1739 cm1 was assigned to the C=O stretching vibration of the methyl ester. The peak at 1641 cm−1 is assigned to the H–O–H bending vibrations mode. The absorbance at 1102 and 1020 cm−1 is attributed to the galacturonic acid, because all the peptic polysaccharides were mainly characterized by these peaks [23,24,25,26,27].

3.3. AFM Analysis

The surface morphology of the APN device is demonstrated using atomic force microscopy (AFM) to display the nanometer resolution, in which the 2D and 3D images are shown in Figure 3a,b. The root-mean-square (RMS) roughness value of APN was approximately 4.52 nm. The rough surface was attributed to NiO nanoparticles. There was a high surface-to-volume ratio, promoting the device to absorb more gas that can be detected [28,29,30,31].

3.4. Device Morphology, SEM Top View and Energy Dispersive Spectroscopy

Scanning electron microscopy (SEM) analysis was utilized to observe the top of the device (Figure 4a), and energy dispersive spectroscopy was used to analyze the quantitative data (Figure 4b). The APN thin film morphological is smooth and the NiO nanoparticles are randomly distributed. The yellow cross mark of the SEM images is shown in Figure 4a, and the C, N, O, and Ni atomic percentages are 17.61%, 2.56%, 34.02%, and 45.81%, respectively.

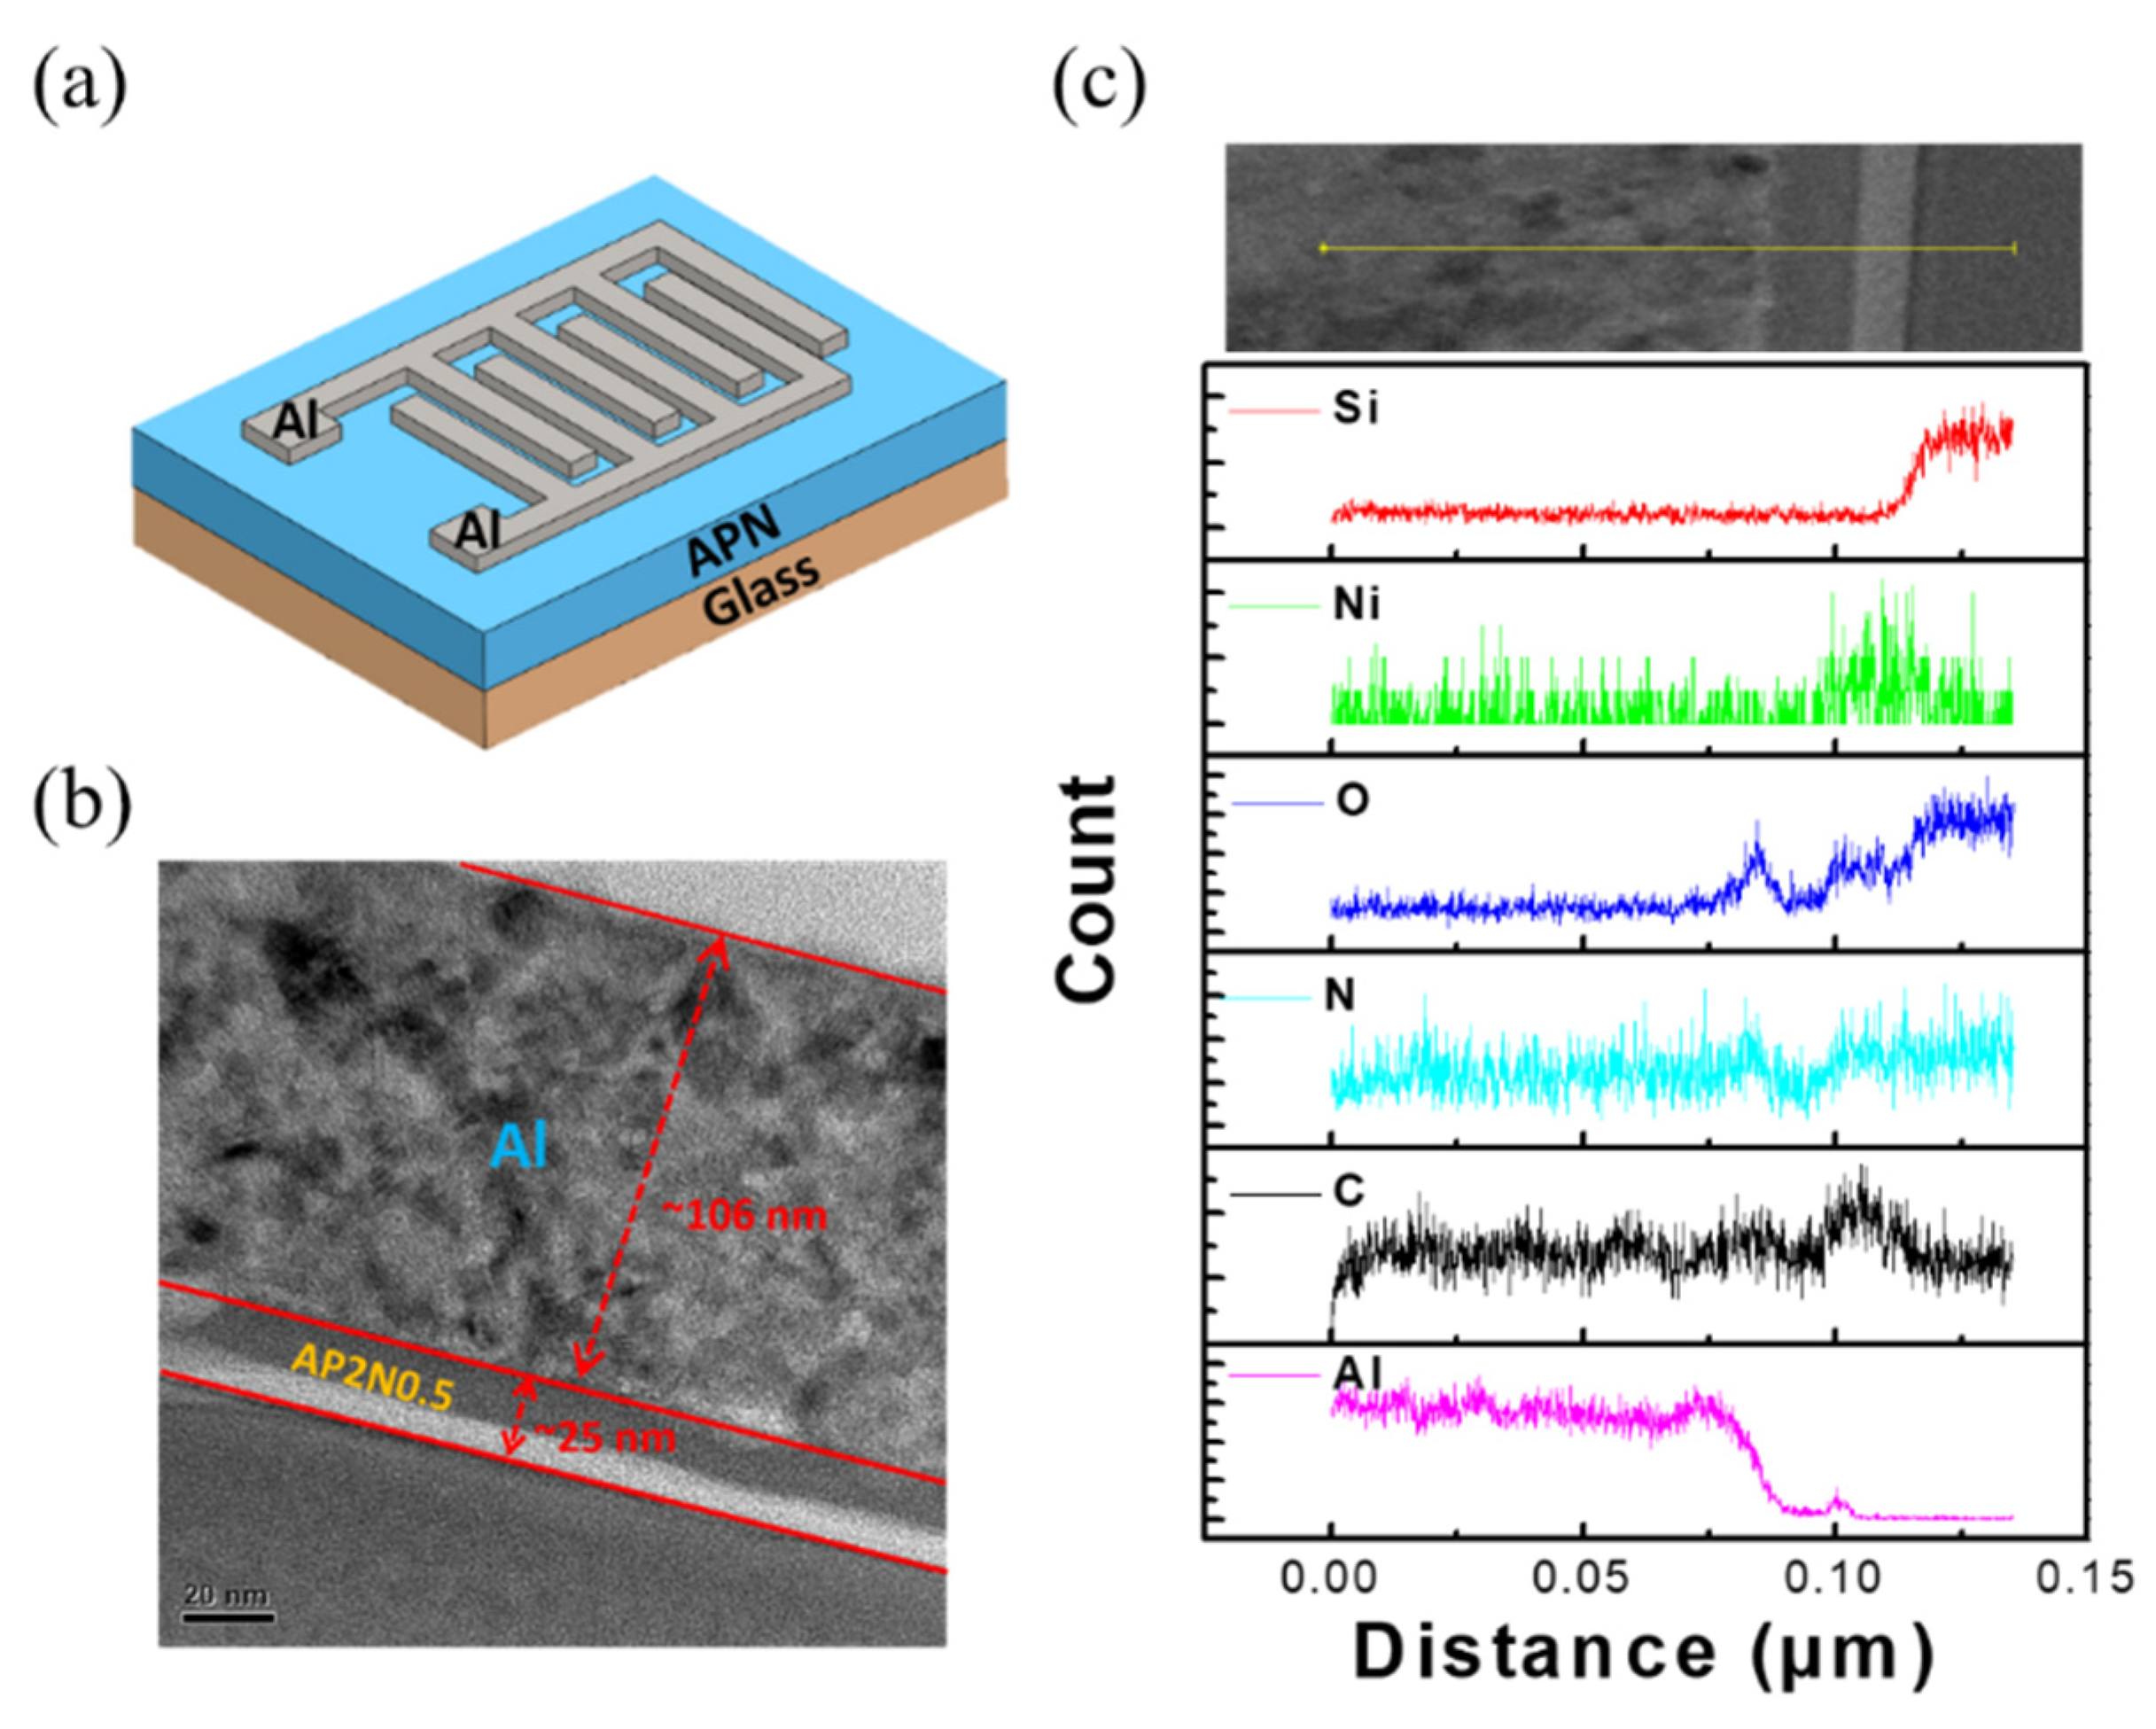
3.5. Device Structure, TEM Cross-Section View, and EDS Analysis

The as-fabricated, NiO-doped apple pectin was spun onto the glass, which sputtered the top Al electrode, as shown in Figure 5a. The cross-section view of the APN gas sensor was observed through TEM. In the TEM (Figure 5b), the APN device structure is Al/APN/Glass, demonstrating the formation of an apple pectin layer through solution processing, combined with the dispersed NiO NP. The thickness of the NiO-doped apple pectin layer is approximately 25 nm, and the thickness of the Al metal electrode is approximately 106 nm. In Figure 5c, the line scan profile of the APN gas sensor device (along the yellow line) was obtained in each layer. Line scan elemental analysis identified that the intensities of C, N, O, and Ni are identified in the gas-sensing layer. C, N, and O can be detected and attributed to the organic material, pectin. Ni and some oxygen elements slightly increased on the APN film, indicating that NiO dispersed in pectin. The Al element was characterized by the interdigital electrode.

3.6. Gas-Sensing Experiment

First, the electrical measurements of pure apple pectin and APN devices at 250 °C and 10 ppm ethanol were compared. The minimum detection limit of the gas sensor’s chamber is 10 ppm. Pure pectin showed no response to alcohol gas (Figure 6a). Previous studies reported that MOS materials, including NiO materials, exhibit gas-sensing properties [16,17,18,19,20,21]. In the present work, the NiO nanoparticle solution was mixed with apple pectin (APN device), which has an excellent response to alcohol gas (Figure 6a). The measurement regarding the calibration curve during the measurement process was taken before the beginning of the gas responses. The device was stabilized in the air for approximately 10 min, and followed the air > target gas > air steps to analyze the gas sensing capabilities in the sequence. Each step was around 1 min, and the bias voltage was kept at 1 volt. Next, we will discuss a series of measurements and explain the mechanism. MOS sensors reportedly operate at elevated temperatures, and operating at the optimized temperature is necessary. The relevant literature has demonstrated that an excellent gas response can be obtained at room temperature [21,22,23,24,25,26,27]. The electrical response of the APN device for ethanol at different operating temperatures (200~300 °C) was compared (Figure 6b). The responsivity of the APN device at 200, 250 and 300 °C were 150, 161, and 26, respectively. The device declined rapidly at 300 °C; therefore, we defined the breakdown temperature of the component to be 300 °C. The best response of the sensor was 161 at 250 °C. The response gradually increased at a sufficiently high temperature, which conduced to reduce the potential barrier and increase the carrier mobility.
The selectivity of the APN device towards the various reducing gases of ethanol, acetone, and ammonia was tested at a 10 ppm concentration and 250 °C. As shown in Figure 7, the responsivity of the different gases was achieved at 161, 38.6 and 0.6, respectively. Apple pectin is a type of hydrogel material with an excellent response to ethanol gas. Therefore, the response of all the gases to ethanol was higher than the other gases.
As shown in Figure 8a, the response time is defined as the time required for a sensor to reach 90%, from 10% of the total response time when exposed to the target gas. In contrast, the recovery time is defined as the time required for a sensor to return to 10%, from 90% of the original baseline. The responsivity was 161 at 250 °C, the response time was 1.379 s, and the recovery time was 1.057 s.
The best stability and sensitivity were achieved at 250 °C. The transient response of the APN device with dynamic repeatability is represented in Figure 8b. In the beginning, the machine was relatively unstable regarding its measurements, and the responsivity was more unstable in different parts. However, the second and third cycle waveforms produced relatively stable measurements. The resistance increased sharply when the ethanol gas was injected into the chamber. By contrast, the testing gas was released when the resistance rapidly declined. This result confirms the good stability and repeatability of the APN device.
Durability is one of the evaluation criteria for device performance. As shown in Figure 9, the responsivity of the as-fabricated APN device after 10, 20, and 30 days is 161, 137, 129, and 121, respectively. According to our conjecture, the reason for the degradation of the device performance is likely to be the aluminum top electrode oxidation, which contributes to the decline in responsivity.
The ethanol-sensing mechanism of the APN device is explained and visualized in Figure 10. The oxygen molecules were absorbed into the surface of the p-type NiO nanoparticles when the device was exposed to air. The electron of the conduction band was trapped by the oxygen molecules, which were converted into oxygen ion species. The reaction equation in the air is described as follow:
O2 (ads) + 2e → 2O
Thus, the APN device decreased the resistance by reducing the depletion region. The ethanol injected into the chamber reacted with the oxygen ions that were absorbed into the NiO NPs’ surface, and released electrons, which increased the depletion region and resistance [6,10,11,19,21]. The chemical reaction can be described as:
C2H5OH (gas) + 6O (ads) → 2CO2 + 3H2O + 6e

4. Conclusions

NiO-doped apple pectin film was successfully synthesized through the solution procedure. The device was baked using a microwave oven. Temperature-optimized testing results showed that the response of the APN device exhibited the highest response of 161 to 10 ppm ethanol at 250 °C, with the response and recovery times of 1.379 and 0.882 s, respectively. The stability and repeatability were also excellent. Therefore, the device has potential applications in ethanol gas sensing.

Author Contributions

J.-C.J. designed and performed the experiments, conceptualized the study and methodology, and analyzed the data; J.-C.J. and Y.-C.C. prepared the original draft; Y.-C.C., S.-P.C. and S.-J.C. reviewed and edited the manuscript. All authors have read and agreed to the published version of the manuscript.

Funding

This work was supported by the Ministry of Science and Technology under contract number MOST 110-2636-E-006-006.

Institutional Review Board Statement

Not applicable.

Informed Consent Statement

Not applicable.

Data Availability Statement

Not applicable.

Acknowledgments

We also thank Jui-Chin Lee (Instrument Center NCKU) for the sample preparation and XPS investigation.

Conflicts of Interest

The authors declare no conflict of interest.

References

  1. Dhama, K.; Patel, S.K.; Kumar, R.; Masand, R.; Rana, J.; Yatoo, M.I.; Tiwari, R.; Sharun, K.; Mohapatra, R.K.; Natesan, S. The role of disinfectants and sanitizers during COVID-19 pandemic: Advantages and deleterious effects on humans and the environment. Environ. Sci. Pollut. Res. 2021, 28, 1–18. [Google Scholar] [CrossRef]
  2. Musile, G.; Pigaiani, N.; Sorio, D.; Colombari, M.; Bortolotti, F.; Tagliaro, F. Alcohol-associated traffic injuries in Verona territory: A nine-year survey. Med. Sci. Law 2021, 61, 7–13. [Google Scholar] [CrossRef]
  3. Cho, S.Y.; Yoo, H.W.; Kim, J.Y.; Jung, W.B.; Jin, M.L.; Kim, J.S.; Jeon, H.J.; Jung, H.T. High-Resolution p-Type Metal Oxide Semiconductor Nanowire Array as an Ultrasensitive Sensor for Volatile Organic Compounds. Nano Lett. 2016, 16, 4508–4515. [Google Scholar] [CrossRef] [PubMed]
  4. Choi, D.; Kim, H.; Son, M.; Kim, H.; Lee, H.C.; Lee, C.S. Fabrication of a kinetically sprayed CuO ultra-thin film to evaluate CO gas sensing parameters. New J. Chem. 2019, 43, 7814–7821. [Google Scholar] [CrossRef]
  5. Din, S.U.; Ul Haq, M.; Sajid, M.; Khatoon, R.; Chen, X.H.; Li, L.; Zhang, M.J.; Zhu, L.P. Development of high-performance sensor based on NiO/SnO(2)heterostructures to study sensing properties towards various reducing gases. Nanotechnology 2020, 31, 13. [Google Scholar] [CrossRef] [PubMed]
  6. Nakate, U.T.; Patil, P.; Na, S.I.; Yu, Y.T.; Suh, E.K.; Hahn, Y.B. Fabrication and enhanced carbon monoxide gas sensing performance of p-CuO/n-TiO2 heterojunction device. Colloid Surf. A-Physicochem. Eng. Asp. 2021, 612, 8. [Google Scholar] [CrossRef]
  7. Tsai, Y.T.; Chang, S.J.; Ji, L.W.; Hsiao, Y.J.; Tang, I.T.; Lu, H.Y.; Chu, Y.L. High Sensitivity of NO Gas Sensors Based on Novel Ag-Doped ZnO Nanoflowers Enhanced with a UV Light-Emitting Diode. ACS Omega 2018, 3, 13798–13807. [Google Scholar] [CrossRef] [PubMed]
  8. Umar, A.; Lee, J.H.; Kumar, R.; Al-Dossary, O.; Ibrahim, A.A.; Baskoutas, S. Development of highly sensitive and selective ethanol sensor based on lance-shaped CuO nanostructures. Mater. Des. 2016, 105, 16–24. [Google Scholar] [CrossRef]
  9. Wang, C.; Cui, X.B.; Liu, J.Y.; Zhou, X.; Cheng, X.Y.; Sun, P.; Hu, X.L.; Li, X.W.; Zheng, J.; Lu, G.Y. Design of Superior Ethanol Gas Sensor Based on Al-Doped NiO Nanorod-Flowers. ACS Sens. 2016, 1, 131–136. [Google Scholar] [CrossRef]
  10. Cao, S.X.; Han, T.; Peng, L.L. Surfactant-free synthesis of 3D hierarchical flower-like NiO nanostructures with enhanced ethanol-sensing performance. J. Mater. Sci. Mater. Electron. 2020, 31, 17291–17296. [Google Scholar] [CrossRef]
  11. Zhang, J.; Zeng, D.; Zhu, Q.; Wu, J.; Huang, Q.; Xie, C. Effect of Nickel Vacancies on the Room-Temperature NO2 Sensing Properties of Mesoporous NiO Nanosheets. J. Phys. Chem. C 2016, 120, 3936–3945. [Google Scholar] [CrossRef]
  12. Zhang, J.; Zeng, D.W.; Zhu, Q.; Wu, J.J.; Huang, Q.W.; Zhang, W.; Xie, C.S. Enhanced room temperature NO2 response of NiO-SnO2 nanocomposites induced by interface bonds at the p-n heterojunction (vol 18, pg 5386, 2016). Phys. Chem. Chem. Phys. 2017, 19, 10695–10697. [Google Scholar] [CrossRef] [Green Version]
  13. Bai, G.M.; Dai, H.X.; Deng, J.G.; Liu, Y.X.; Ji, K.M. Porous NiO nanoflowers and nanourchins: Highly active catalysts for toluene combustion. Catal. Commun. 2012, 27, 148–153. [Google Scholar] [CrossRef]
  14. Bai, G.M.; Dai, H.X.; Deng, J.G.; Liu, Y.X.; Qiu, W.G.; Zhao, Z.X.; Li, X.W.; Yang, H.G. The microemulsion preparation and high catalytic performance of mesoporous NiO nanorods and nanocubes for toluene combustion. Chem. Eng. J. 2013, 219, 200–208. [Google Scholar] [CrossRef]
  15. Lin, L.; Liu, T.; Miao, B.; Zeng, W. Hydrothermal fabrication of uniform hexagonal NiO nanosheets: Structure, growth and response. Mater. Lett. 2013, 102, 43–46. [Google Scholar] [CrossRef]
  16. Miao, R.; Zeng, W. Hydrothermal synthesis of flake-flower NiO architectures: Structure, growth and gas-sensing properties. Mater. Lett. 2016, 171, 200–203. [Google Scholar] [CrossRef]
  17. Rai, P.; Yoon, J.-W.; Jeong, H.-M.; Hwang, S.-J.; Kwak, C.-H.; Lee, J.-H. Design of highly sensitive and selective Au@ NiO yolk–shell nanoreactors for gas sensor applications. Nanoscale 2014, 6, 8292–8299. [Google Scholar] [CrossRef] [PubMed]
  18. Dey, S.; Nag, S.; Santra, S.; Ray, S.K.; Guha, P.K. Voltage-controlled NiO/ZnO p-n heterojunction diode: A new approach towards selective VOC sensing. Microsyst. Nanoeng. 2020, 6, 9. [Google Scholar] [CrossRef]
  19. Marikutsa, A.; Novikova, A.; Rumyantseva, M.; Khmelevsky, N.; Gaskov, A. Comparison of Au-functionalized semiconductor metal oxides in sensitivity to VOC. Sens. Actuator B-Chem. 2021, 326, 12. [Google Scholar] [CrossRef]
  20. Mokoena, T.P.; Tshabalala, Z.P.; Hillie, K.T.; Swart, H.C.; Motaung, D.E. The blue luminescence of p-type NiO nanostructured material induced by defects: H2S gas sensing characteristics at a relatively low operating temperature. Appl. Surf. Sci. 2020, 525, 19. [Google Scholar] [CrossRef]
  21. Codorniu Pujals, D.; Rodríguez Garcés, D.; Arias de Fuentes, O.; Desdín García, L.F. XPS of carbon nanostructures obtained by underwater arc discharge of graphite electrodes. Nucleus (La Habana) 2018, 51, 15–18. [Google Scholar]
  22. Zhang, W.; Zhou, Z. Citrus pectin-derived carbon microspheres with superior adsorption ability for methylene blue. Nanomaterials 2017, 7, 161. [Google Scholar] [CrossRef] [PubMed]
  23. Acikgoz, C. Extraction and characterization of pectin obtained from quince fruits (Cydonia vulgaris Pers.) grown in Turkey. Asian J. Chem. 2011, 23, 149. [Google Scholar]
  24. Mishra, R.K.; Datt, M.; Pal, K.; Banthia, A. Preparation and characterization of amidated pectin based hydrogels for drug delivery system. J. Mater. Sci. Mater. Med. 2008, 19, 2275–2280. [Google Scholar] [CrossRef]
  25. Qiao, H.; Wei, Z.; Yang, H.; Zhu, L.; Yan, X. Preparation and characterization of NiO nanoparticles by anodic arc plasma method. J. Nanomater. 2009, 2009, 795928. [Google Scholar] [CrossRef] [Green Version]
  26. Shuihab, A.; Khalf, S. Fabrication and characterization of nickel oxide nanoparticles/silicon NiO NPS/Si. In AIP Conference Proceedings; AIP Publishing: Melville, NY, USA, 2018; p. 020026. [Google Scholar]
  27. Zanella, K.; Taranto, O.P. Influence of the drying operating conditions on the chemical characteristics of the citric acid extracted pectins from ‘pera’sweet orange (Citrus sinensis L. Osbeck) albedo and flavedo. J. Food Eng. 2015, 166, 111–118. [Google Scholar] [CrossRef] [Green Version]
  28. Chang, C.M.; Hon, M.H.; Leu, I.C. Influence of Size and Density of Au Nanoparticles on ZnO Nanorod Arrays for Sensing Reducing Gases. J. Electrochem. Soc. 2013, 160, B170–B176. [Google Scholar] [CrossRef]
  29. Wu, Y.; Jiang, T.; Shi, T.; Sun, B.; Tang, Z.; Liao, G. Au modified ZnO nanowires for ethanol gas sensing. Sci. China Technol. Sci. 2017, 60, 71–77. [Google Scholar] [CrossRef]
  30. Young, S.J.; Chu, Y.L. Platinum Nanoparticle-Decorated ZnO Nanorods Improved the Performance of Methanol Gas Sensor. J. Electrochem. Soc. 2020, 167, 6. [Google Scholar] [CrossRef]
  31. Yu, L.M.; Wei, J.S.; Luo, Y.Y.; Tao, Y.L.; Lei, M.; Fan, X.H.; Yan, W.; Peng, P. Dependence of Al3+ on the growth mechanism of vertical standing ZnO nanowalls and their NO2 gas sensing properties. Sens. Actuator B-Chem. 2014, 204, 96–101. [Google Scholar] [CrossRef]
Figure 1. XPS characterization of (a) as-fabricated APN film, and (b) high-resolution spectra of O1s.
Coatings 11 01073 g001
Figure 2. FTIR spectrum of the APN thin film.
Coatings 11 01073 g002
Figure 3. AFM images of (a) 2D and (b) 3D of as-fabricated APN film.
Coatings 11 01073 g003
Figure 4. Scanning electron microscopy (SEM) image observation; (a) the top view and (b) the energy dispersive spectroscopy of APN film. The element’s (C, N, O, and Ni) atomic percentages are also shown in Figure 4b.
Coatings 11 01073 g004
Figure 5. (a) Schematic illustration of gas sensor based on the APN film. (b) HR-TEM images of the cross-section view. (c) Line scan profiles from the APN device.
Coatings 11 01073 g005
Figure 6. (a) The response measurement compared with the APN device and pure apple pectin device at 10 ppm ethanol, 250 °C. (b) Response values of the APN sensor with different temperatures at 10 ppm.
Coatings 11 01073 g006
Figure 7. The selectivity of the APN device was exposed to three different gases (ethanol, acetone, and ammonia) under 10 ppm at 250 °C.
Coatings 11 01073 g007
Figure 8. (a) Response and recovery time, and (b) dynamic repeatability of the APN sensor at 10 ppm ethanol, 250 °C.
Coatings 11 01073 g008
Figure 9. The APN device durability of 0, 10, 20, and 30 days.
Coatings 11 01073 g009
Figure 10. Schematic diagram of the gas-sensing mechanism of an APN device in the air and in ethanol.
Coatings 11 01073 g010
Table 1. Comparison of NiO materials as the gas-sensing response from the different literature.
ElementWorking Temperature (°C)GasGas Concentration (ppm)ResponseRef.
NiO nanosheets250Ethanol5065[15]
NiO flake-flower300Ethanol40032[16]
Au@NiO NPs400Ethanol5~3[17]
NiO/ZnO300Ethanol95~1[18]
NiO–Au functionalized150Acetone and Methanol20<1[19]
NiO-8 h75H2S6074[20]
Publisher’s Note: MDPI stays neutral with regard to jurisdictional claims in published maps and institutional affiliations.

