Article

Effect of ZnO Nanomaterial and Red and Green Cabbage Dyes on the Performance of Dye-Sensitised Solar Cells

by
Abdullah K. Alanazi
Department of Chemistry, Faculty of Science, Taif University, P.O. Box 11099, Taif 21944, Saudi Arabia
Coatings 2021, 11(9), 1057; https://doi.org/10.3390/coatings11091057
Submission received: 14 July 2021 / Revised: 16 August 2021 / Accepted: 20 August 2021 / Published: 1 September 2021

Abstract

:
Visible light can be converted into electricity using dye sensitised solar cells (DSSCs), with their performance mainly based on the type of dye used as a sensitiser. Currently, dyes extracted from natural sources are highly preferred by researchers in this field. Natural dyes reduce the high cost of metal complex sensitisers and replace expensive processes of chemical synthesis with simple extraction processes. Natural dyes are environmentally friendly, abundant, easily extractable, and safe. Their application has become a promising development in DSSC technology. In this study, two natural dyes extracted from the plant leaves of green cabbage (GC) and red cabbage (RC) that were used as sensitisers. The performance characteristics of RC and GC extracts were investigated using both cyclic voltammetry and amperometry methods for solar cell detection. At an extraction temperature of 60 °C maintained for 8 h under optimum conditions, the measured values of maximum power (Pm), fill factor (FF), and efficiency (η) were 1.36 mW/cm2, 92.34%, and 0.161% for RC, and 0.349 mW/cm2, 44.19%, and 0.095% for GC, respectively. The RC and GC extracts exhibited excellent electrochemical performance with respect to current density potential and good cycling stability.

1. Introduction

Fossil fuels such as oil, natural gas, and coal are the main sources of energy used all over the world. Moreover, the burning of these fossil fuels emits tons of carbon dioxide, which pollutes the environment and changes the climatic conditions. The development of renewable energy sources may lead to sustainable technologies for a clean environment. Solar, wind, hydro, biomass, and geothermal energy generation technologies constitute the main sources of renewable energy, and all of them have their own merits and shortcomings [1]. Solar energy provides energy to all humans, plants, and animals for their growth and development; however, it varies geographically across the Earth. Solar energy can be directly converted into heat or electricity at commercial and domestic levels, and it is beneficial to individual owners as well as the environment. Today, scientists and engineers seek to utilise solar radiation directly to generate electricity through economic devices [2]. A photovoltaic cell converts solar radiation directly into electrical energy [3]. Silicon is usually employed for the fabrication of crystalline solar cells because it is abundant and an environmentally safe material. These solar cells are manufactured from silicon wafers, and their efficiency is higher than that of titanium dioxide (TiO2), zinc oxide (ZnO), and iron oxide. The overall commercial cost of crystalline solar cells is high due to their high cost of fabrication. Tobnaghi et al. [4] used one PV (photovoltaic) cell where the upper or n-type layer is crystalline silicon doped with phosphorus with 5 valence electrons while the lower or p-type layer is doped with boron, which has 3 valence electrons. The performance of crystalline solar cells is dependent on temperature; an increase of 67% in power conversion efficiency is observed at 36 °C for concentrator-coupled cells.
Dye-sensitised solar cells (DSSCs) are third-generation solar cells that can convert photon energy into electrical energy; notably, Mingsukang et al. [5] used two TiO2 layers. The ionized dye and/or the mediators of the first TiO2 layer are used as a blocking layer to suppress electron recombining. The second layer is mesoporous TiO2 with a 20–30 nm thickness. Chang et al. [6] demonstrated that fruits and vegetables reduce the cost of DSSCs and achieve more economical and environmental protection effects. Since ruthenium dyes are very rare and expensive, there has been considerable interest in recent times toward the use of natural organic dyes extracted from various plants, fruits, flowers, and leaves as molecular sensitisers in DSSCs. They concluded that several natural pigments such as anthocyanin, chlorophyll, tannin, and carotene have been successfully used as sensitisers in DSSCs. Ito et al. [7] indicated that Dye-sensitised solar cells (DSSCs) show great promise as an inexpensive organic dyes alternative to conventional p–n junction solar cells due to their highly efficient photovoltaic conversions, combined with the ease of manufacturing and low production costs that make the DSSC technology an attractive approach for large-scale solar energy conversion. Zheng et al. [8] developed chlorophyll and anthocyanin for the production of solar cells. These dyes could be controlled to obtain concentrated and minute dye particles vital for obtaining higher photoelectric conversion efficiency of solar cells. The cost of production of these dyes is however very low. As natural dyes are cheaper to obtain, it would be more economical to mass produce DSSCs that could be used in appliances as portable chargers or integrated into building facades.
In general, DSSC devices are based on a nanostructured metal oxide film, sensitised by an adsorbed dye molecule to harvest visible light. These cells comprise three basic components: A dye sensitiser, which absorbs visible light to generate excitons and transfer electrons from the excited state into the metal oxide conduction layer [9,10]; Ortíz et al. [9] used two pigments of bixin and norbixin, which were obtained by separation and purification from the dark-red extract (annatto), while Hardin et al. [10] concluded that for visible spectrum absorption in thinner films, Donor–pi–acceptor dyes absorb much more strongly than commonly employed ruthenium-based dyes.
Gomez et al. [11] studied the interaction between Cyanidin and Cyanidin 3,5-diglucoside with TiO2 as the semiconductor in its cluster and surface form for suitable super cell models representing the systems of interest, while Bai et al. [12] offered a brief review on the application of titanium dioxide nanomaterials in photovoltaic devices, including dye-sensitised solar cells, polymer-inorganic hybrid solar cells, quantum dot-sensitised solar cells, inorganic solid-state solar cells, and perovskite solar cells. In each section, the injected electrons travel through the electrode, which has an essential role in dye regeneration. The dye is regenerated by an electron donor in the electrolyte solution [13]. The dye sensitiser absorbs sunlight and transforms solar energy into electrical energy. In DSSCs, sensitisers such as ruthenium complexes and natural dyes are used [14]. With ruthenium complexes, DSSCs adsorbed on TiO2 reach efficiencies as high as 11–12%. DSSCs made with natural dyes are not only cheaper to manufacture but also suitable for a clean environment [15]. Pham et al. [16] developed new inexpensive, more stable, and highly efficient anthanthrone (ANT) dye core based lower cost hole transporting materials (HTMs) for cost-effective, conventional, and printable perovskite solar cells (PSCs). Also, they concluded that low cost hole transporting materials (HTM) based on an inexpensive starting precursor anthanthrone dye paves the way for economical and large-scale production of stable Perovskite solar cells [17].
Several natural dyes have been employed as sensitisers in DSSCs, such as anthocyanin [16], chlorophyll [18], and carotene [19]. Pratiwi et al. [20] used dragon fruit and red cabbage anthocyanin dyes as sensitisers for DSSCs, with conversion efficiencies of 0.024% and 0.054%, respectively. Sengupta et al. [21] reported a conversion efficiency of 0.148% using dye from spinach leaves as the sensitiser. Divya et al. [22] reviewed various attempts to fabricate solar cells using TiO2 nanoparticles. Vallejo et al. [23] synthesised and characterised composites of graphene. Harnchana et al. [24] used chemical vapour deposition to reduce sheets of graphene oxide. Liu et al. [25] used the density functional theory for predicting the catalytic activity of the Cu2SnS3 (CTS) electrode via first-principles calculations. Sadasivuni et al. [26] presented a review of recent research progress in flexible solar cell devices. Bahman et al. [27] used a surface methodology to extract alkaloid compounds. Divya et al. [22] used an anthocyanin-rich extract with TiO2 thin films for the photocatalytic degradation of methylene blue. Harnchana et al. [24] used poly (N-vinylcarbazole) (PVK) as an additive in the I/I−3 redox electrolyte and studied the photoelectrochemical effect of PVK with various concentrations, in terms of the corresponding photovoltaic performance. Bahman et al. [27] explored various approaches for improving the current-voltage potential of solar cells. Ahmad and Kan [28] developed visible-light-driven methods by coating cotton fabrics with dye-sensitised TiO2. Liang and Chen [29] used arylamine organic dyes, demonstrated the advantages/disadvantages of each class, compared the cell performance of each dye, and pointed out that the field that needs to reinforce the research direction towards the further application of DSSCs.
Calogero et al. [30] compared the solar energy conversion efficiency of synthetic dyes with that of vegetable dyes. Salinas and Ariza [31] focused on the selection, extraction, and characterization of natural dyes. Narayan [32] enhanced the sustainability strategies of classical DSSC materials. Anbarasan et al. [33] presented a detailed summary and evaluation of DSSCs. Pratiwi et al. [34] discussed the effect of adding synthetic dye to anthocyanin dye. Sharma et al. [35] outlined the relation between the construction principles of DSSCs and their efficiencies. Muliani et al. [36] described the fabrication of DSSCs based on gel electrolytes. Prabavathy et al. [37] studied DSSCs operating with iodide-based electrolytes and platinum as counter electrodes. Krawczak [38] reviewed the published literature on the influence of photosensitisers on DSSC efficiency. Hamid et al. [39] used ethanol to extract natural sensitisers for the fabrication of a DSSC device.
Alami et al. [40] presented the synthesis and deposition of CuI, Fe, and Cu materials on copper substrates for DSSC applications. Narayan [32] discussed the emergence, operation, and components of DSSCs together with the prior work done on natural dye-based DSSCs. Hosseinnezhad [41] developed tandem DSSCs using perovskite materials on the top and organic dyes at the bottom. Shaikh et al. [42] and Kumar et al. [43] focused on photo-anodes counter electrodes of DSSCs and nanostructured materials. Maurya et al. [44] used natural dyes extracted from four flowers as sensitisers for TiO2-based DSSCs. Ruhane et al. [45] explored the formulation of nanocrystalline TiO2 semiconductor paste for DSSCs. Bandy et al. [46] used electrophoretic deposition of TiO2 nanocrystalline particles for applications in DSSCs. Kotta et al. [47] used a non-metallic doping procedure for developing a new material with a performance similar to that of DSSCs. Licklederer et al. [48] used high-temperature H2S treatment for synthesising Nano tubular TiS2 structures of anodised TiO2 nanotube layers and by extension for use as counter electrodes in DSSCs. Selvaraja et al. [49] studied the effect of changing the TiO2 electrode thickness on the performance of DSSCs. Desai et al. [50] summarised and discussed the reasons for the exceptional performance of ZnO superstructures. Le et al. [51] reported ZnO urchin-like nanostructures synthesised by a one-step hydrothermal method, with the morphology optimised via the hydrothermal temperature. Habibi et al. [52] discussed the effect of coating the working electrodes with zinc titanate (ZT), ZnO, and TiO2 on a DSSC’s optical efficiency. Solano et al. [53] synthesised TiO2 and ZnO nanoparticles using a green chemistry approach. Susanti and Wicaksana [54] investigated the usage of a purple cabbage (Brassica oleracea var. capitata f.) and duwet fruit (Eugenia cumini) as natural dyes for constructing a DSSC prototype.
The performance of a dye solar cell is generally evaluated by determining the different parameters of the cell, such as the open circuit voltage, short circuit current, fill factor, maximum voltage, and maximum current of the cell [55,56]. Each of these parameters is discussed in detail as follows:

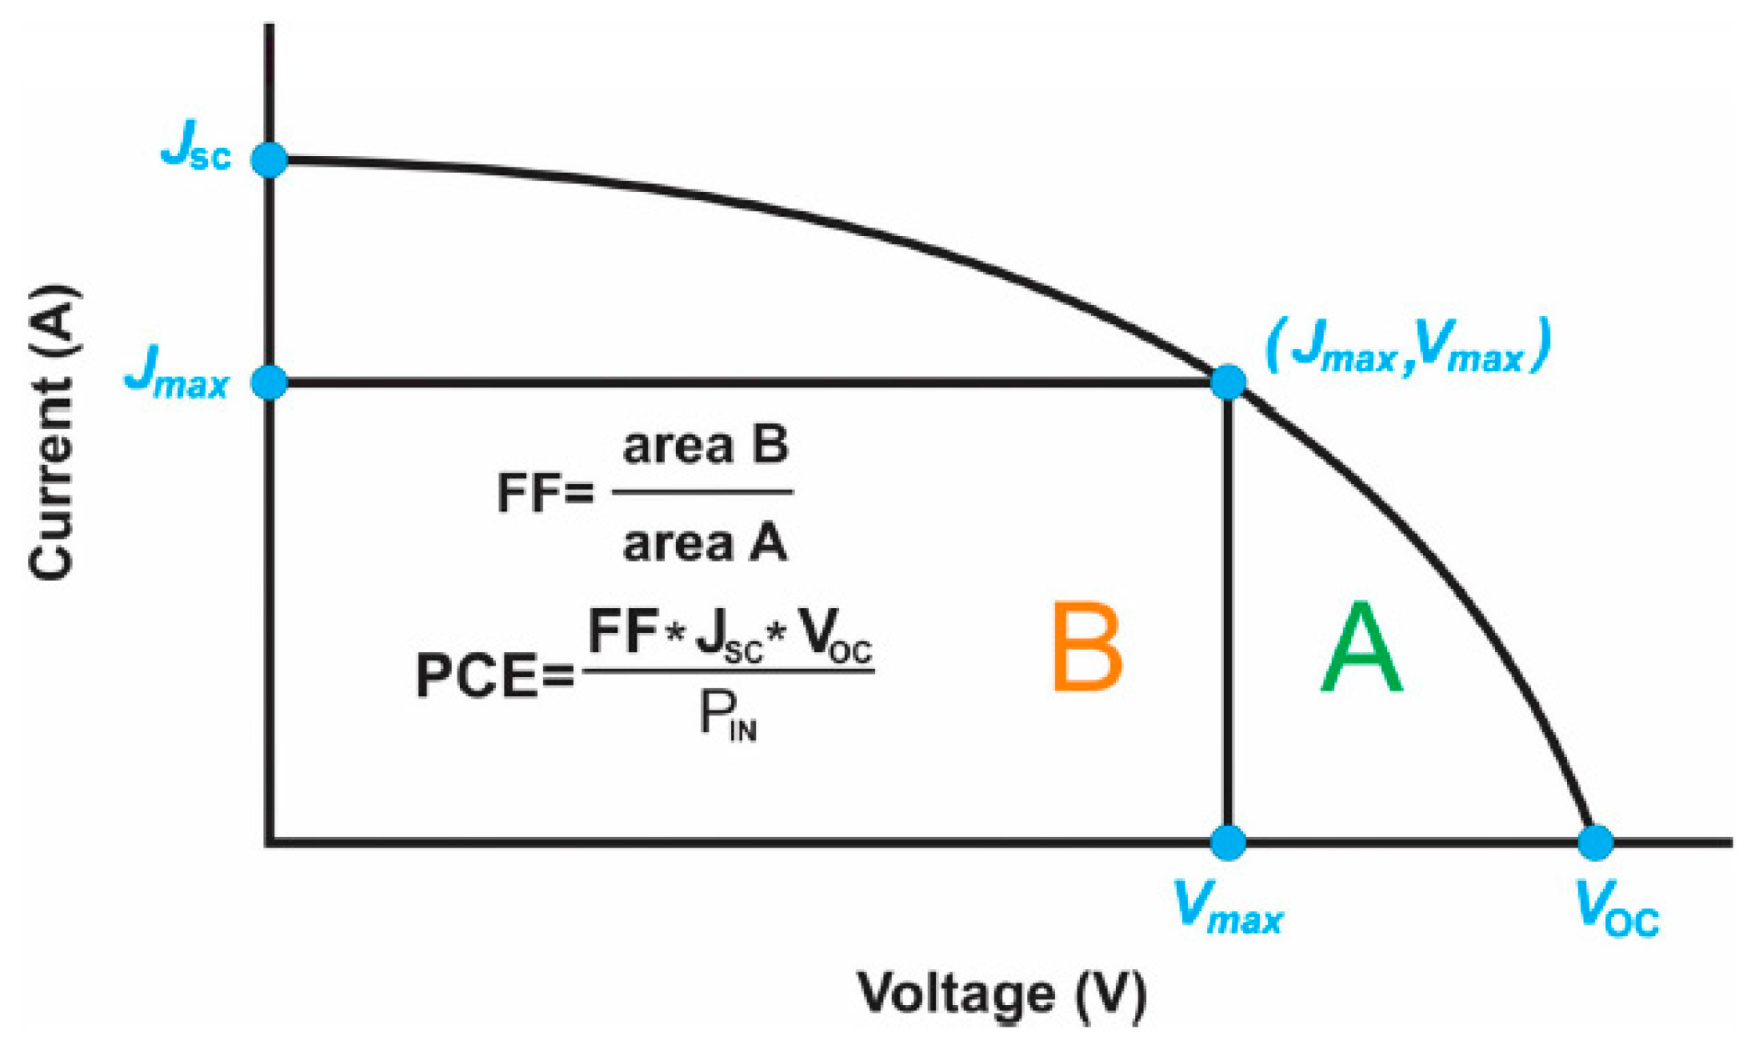
1.1. Current–Voltage (I–V) Characteristics

Under constant illumination and a potential scan application from zero voltage (short circuit conditions) to the open-circuit potential, I–V curves can be obtained in which all possible working points in the considered range are plotted. DSSCs have a relatively slow electrical response due to their high capacity. Therefore, the voltage scan must be performed sufficiently slowly. Isc is determined at the zero voltage measurement point and Voc obtained from the zero current measurement point of the I–V curve. The maximum output power of a solar cell is obtained when the product of |V × I| reaches a maximum. At this characteristic point the slope of the I–V curve is highlighted, as shown in Figure 1.

1.2. Open-Circuit Voltage

The open circuit voltage (Voc) of the solar cell is defined at the cell open terminals. With the cell temperature increment, the Voc decreases and is expressed as follows:
Voc = Vt Ln{(Isc/Io) + 1}.

1.3. Short-Circuit Current

The short circuit current (ISC) increases with an increasing temperature. It is expressed by the following equation:
ISC = I + Io{exp(Voc/Vt) − 1}.

1.4. Fill Factor

The fill factor (FF) of a solar cell can be defined as the ratio of the actual power (product of voltage Vm and current Im at the maximum power point) to the dummy power (product of Voc and Isc).
FF = (Vm × Im)/(Voc × Isc)

1.5. Maximum Power

Maximum power can be obtained through the following equation:
Power (Pmax.) = Imax × Vmax.

1.6. Efficiency

The Current–Voltage (I–V) characteristics of a solar cell under illumination are used to determine the Incident Photon to Current Conversion Efficiency η:
η = (Pmax./Pin) = (|V × I|max)/Pin = (FF × Voc × Isc)/Pin
where
Voc is the open-circuit voltage,
Isc is the short-circuit current,
Io is the dark saturation current,
Vm is the voltage at the maximum power point,
Im is the current at the maximum power point,
Vt is the terminal voltage of the cell, and
η is the efficiency of the cell.
Pin is the incident optical power.
Solar Power Constant = 650 W/cm2, [35],
Surface Area = 3.0 cm × 3.0 cm = 9.0 cm2.
This study aimed to use two natural dyes, extracted from plant leaves of green cabbage (GC) and red cabbage (RC), as sensitisers with zinc oxide nanoparticles (NZnO) using a green chemistry approach. The performances of RC and GC extracts were investigated using both cyclic voltammetry and amperometry methods for solar cell evaluation. The optimum extracting temperature and application period are discussed with respect to the photovoltaic parameters, that is, Pm, FF, and η values. The effects of the RC and GC extracts on the electrochemical performance, current density potential, and cycling stability of the cells were also determined, since they are promising alternative sensitisers for DSSCs for absorbing, transforming, and converting solar energy into electricity.

2. Experiments

2.1. Preparation of NZnO

Aqueous solutions of zinc sulphate heptahydrate and sodium hydroxide were combined drop-wise in a molar ratio of 1:2 under vigorous stirring for almost 18 h. A large amount of white precipitate was formed. This precipitate was filtered, washed with distilled water, and dried using a muffle furnace at a temperature of 100 °C [57].

2.2. Preparation of NZnO Paste

NZnO pastes were prepared using NZnO powder in ethanol. The NZnO suspension was stirred at 300 rpm for 30 min. NZnO pastes that had been formed were inserted into a bottle covered with aluminium foil and stored in an area free from direct sunlight.

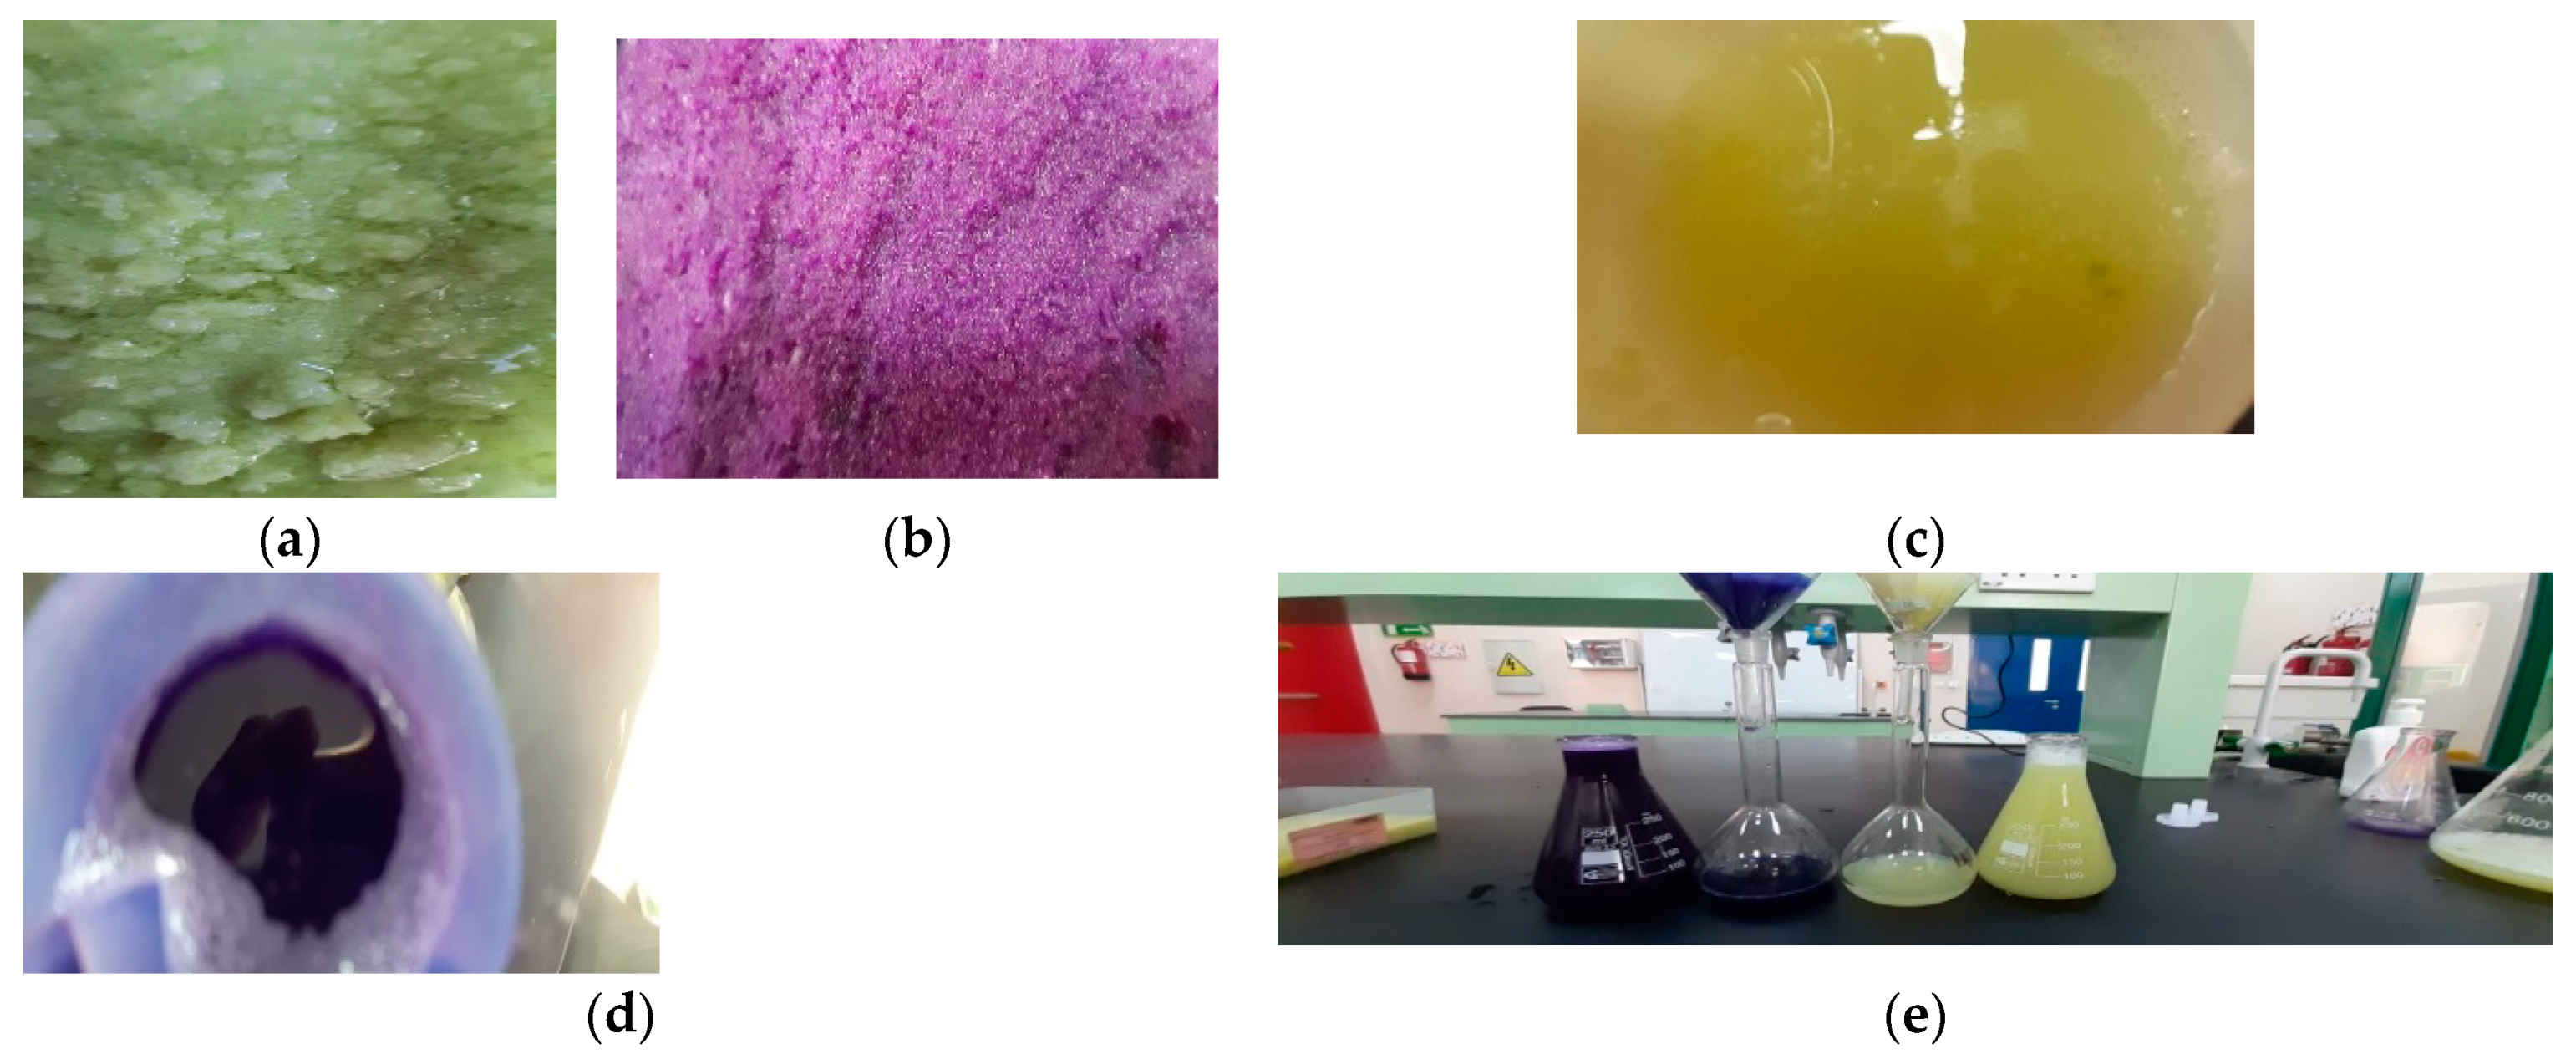
2.3. Preparation of Natural Dye Sensitisers

Green cabbage (GC) and red cabbage (RC) leaves were cut into smaller pieces, washed several times, dried at 80 °C, and crushed into a fine powder. Subsequently, 10 g of GC (Figure 2a) and 10 g of RC (Figure 2b) powders were weighed separately, immersed in 100 mL ethyl alcohol for GC (Figure 2c) and RC (Figure 2d), allowed to stand in dark conditions for one day, and filtered using filter paper (Figure 2e,) for the two cabbage types. Then, the two dye mixtures were analysed using a (Lambda 25 UV/VIS Spectrometer, Perkin Elmer Precisely, Shelton, CT 06484 USA) Conc. 50 spectrophotometer.

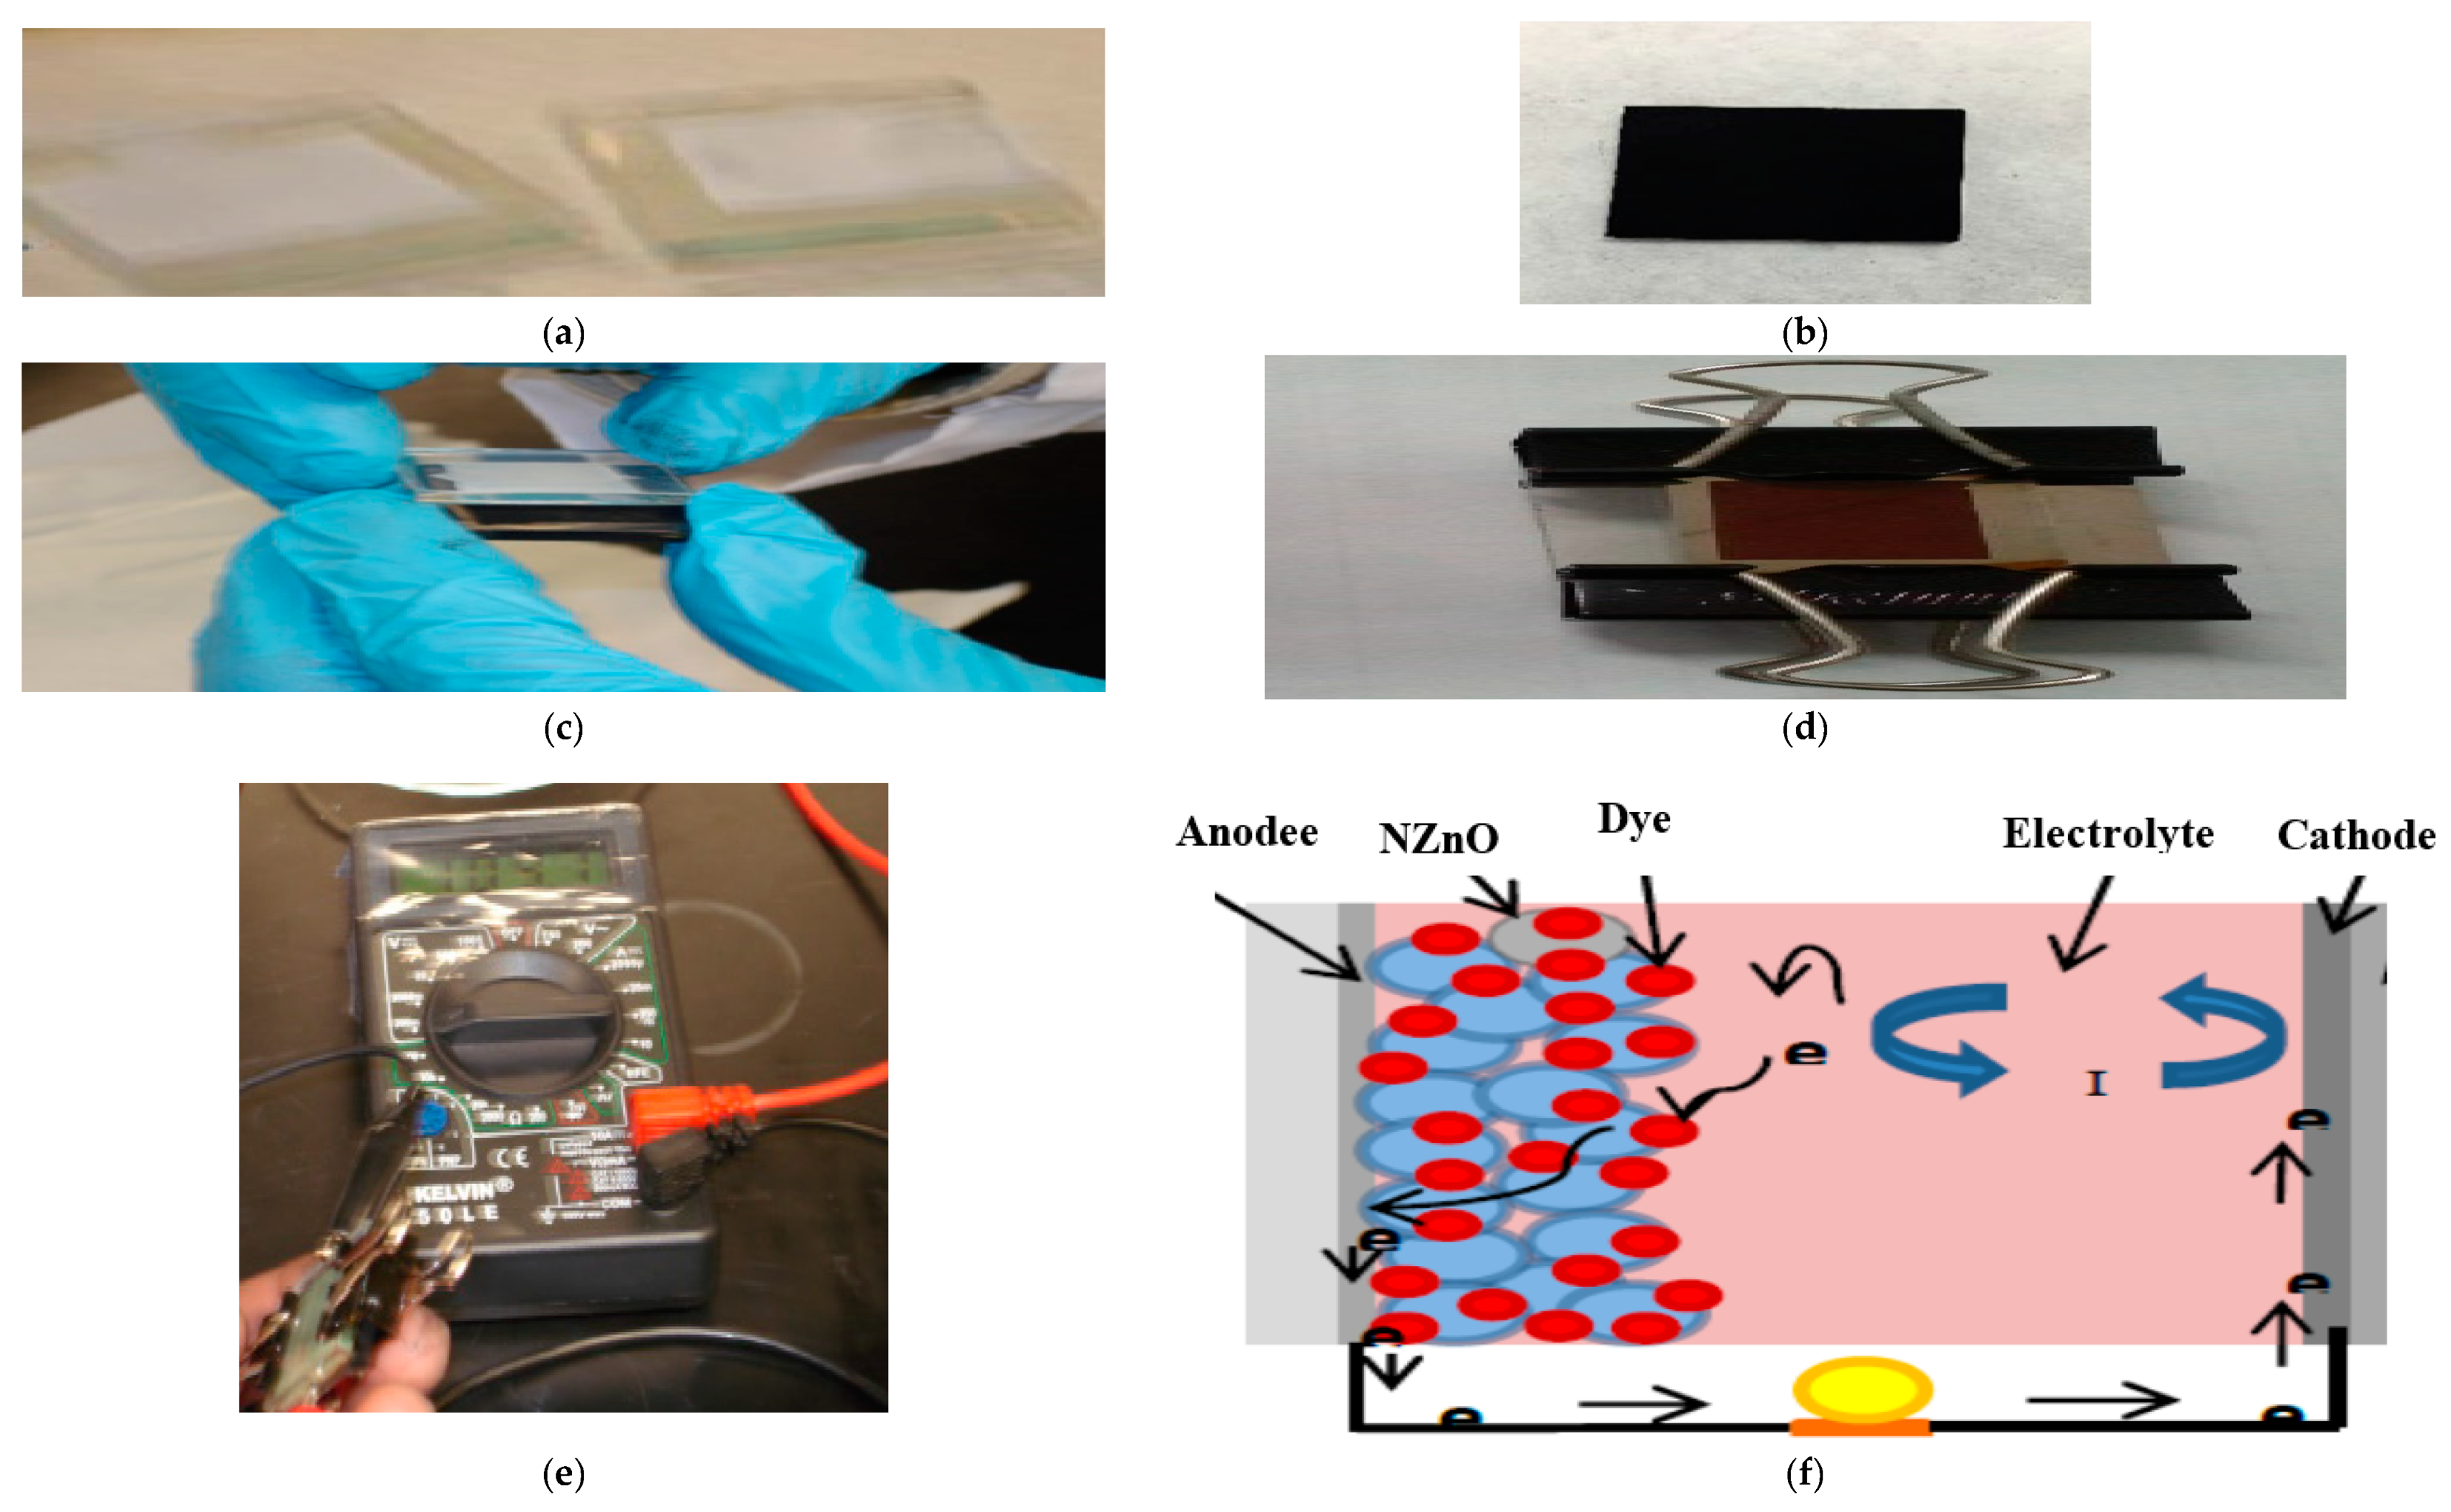
2.4. Preparation of Photo-Anode Electrode, Counter Electrode, and DSSC

NZnO powder (500 mg) was mixed with 3.5 mL concentrated acetic acid. A transparent conducting glass was cut into 3 cm × 3 cm pieces using a diamond glass cutter and used for both photo-anode and counter electrodes. A fluorine-doped tin oxide (FTO) conductive glass surface was scribed carefully and cleaned using a tissue paper. NZnO paste was sensitised by immersing it in the natural dye solutions, dried using a drier, deposited onto the FTO to form a photo-electrode (see Figure 3a), preheated at 120 °C for 10 min, and sintered on a conveyor-belt furnace at 500 °C for 15 min. The iodide electrolyte composed of 2 g of iodine (I2), 3 g of potassium iodide (KI), and 50 mL of deionised water and stirred to dissolve. Deionised water 100 mL diluted the dissolved solution. Two drops of this iodide electrolyte dropped onto the photo-anode electrode.
Another glass plate was coated with carbon soot to act as a counter electrode (Figure 3b). Then the DSSC was assembled by clipping the photo-anode and the counter electrode together (Figure 3c) using a pair of binder clips (Figure 3d). A voltammeter was used to characterise the complete DSSC properties under sunlight (Figure 3e). The interaction of the dye molecules with the photons from the sunlight caused their photoexcitation, generating electron hole pairs that were injected into the conduction band of the semiconductor NZnO. The electrons travelled through the semiconductor to the transparent electrode and eventually reached the counter electrode, regenerating the electrolyte via energy conversion (Figure 3f). A three-electrode cell assembly consisting of an Ag/AgCl reference electrode, a Pt wire counter electrode, and a glassy carbon-working electrode were used for the electrochemical measurements.

2.5. Basic Characterization of the Fabricated DSSC

The DSSC was constructed using: (a) support (FTO) coated with Transparent Conductive Oxides; (b) semiconductor film, (NZnO); (c) GC or RC sensitiser absorbed onto the surface of a semiconductor; (d) an electrolyte containing a redox mediator, and (e) a counter electrode that is capable of regenerating the redox mediator. The basic operating principle for NZnO DSSC consists of three steps: Absorption, separation, and collection. These steps were optimized to attain better efficiency. Thus, absorption occurs at the first step of the reactions in DSSC. Under illumination, GC or RC sensitiser dye (D) absorbs a photon that leads to an excited sensitiser state (D*). Photoexcitation the sensitiser was followed by the electron injection into the conduction band of the semiconductor (mesoporous). This caused the sensitiser to enter an oxidized state D+. The electrolyte donate electron containing a redox couple and the original dye state were restored. Notably, the relevant iodide couple is Iodide/triiodide. Iodide regenerates the sensitiser and the sensitiser is regenerated itself by the reduction of triiodide at the counter electrode. In this way, the circuit is completed by transferring electrons via the external load, as shown in Figure 3f in agreement with Divya et al. [22].

2.6. SEM Observations

The produced NZnO particles were studied with SEM (JEOL JSM-7001F TTLS (JEOL Ltd., Tokyo, Japan)).

3. Results and Discussion

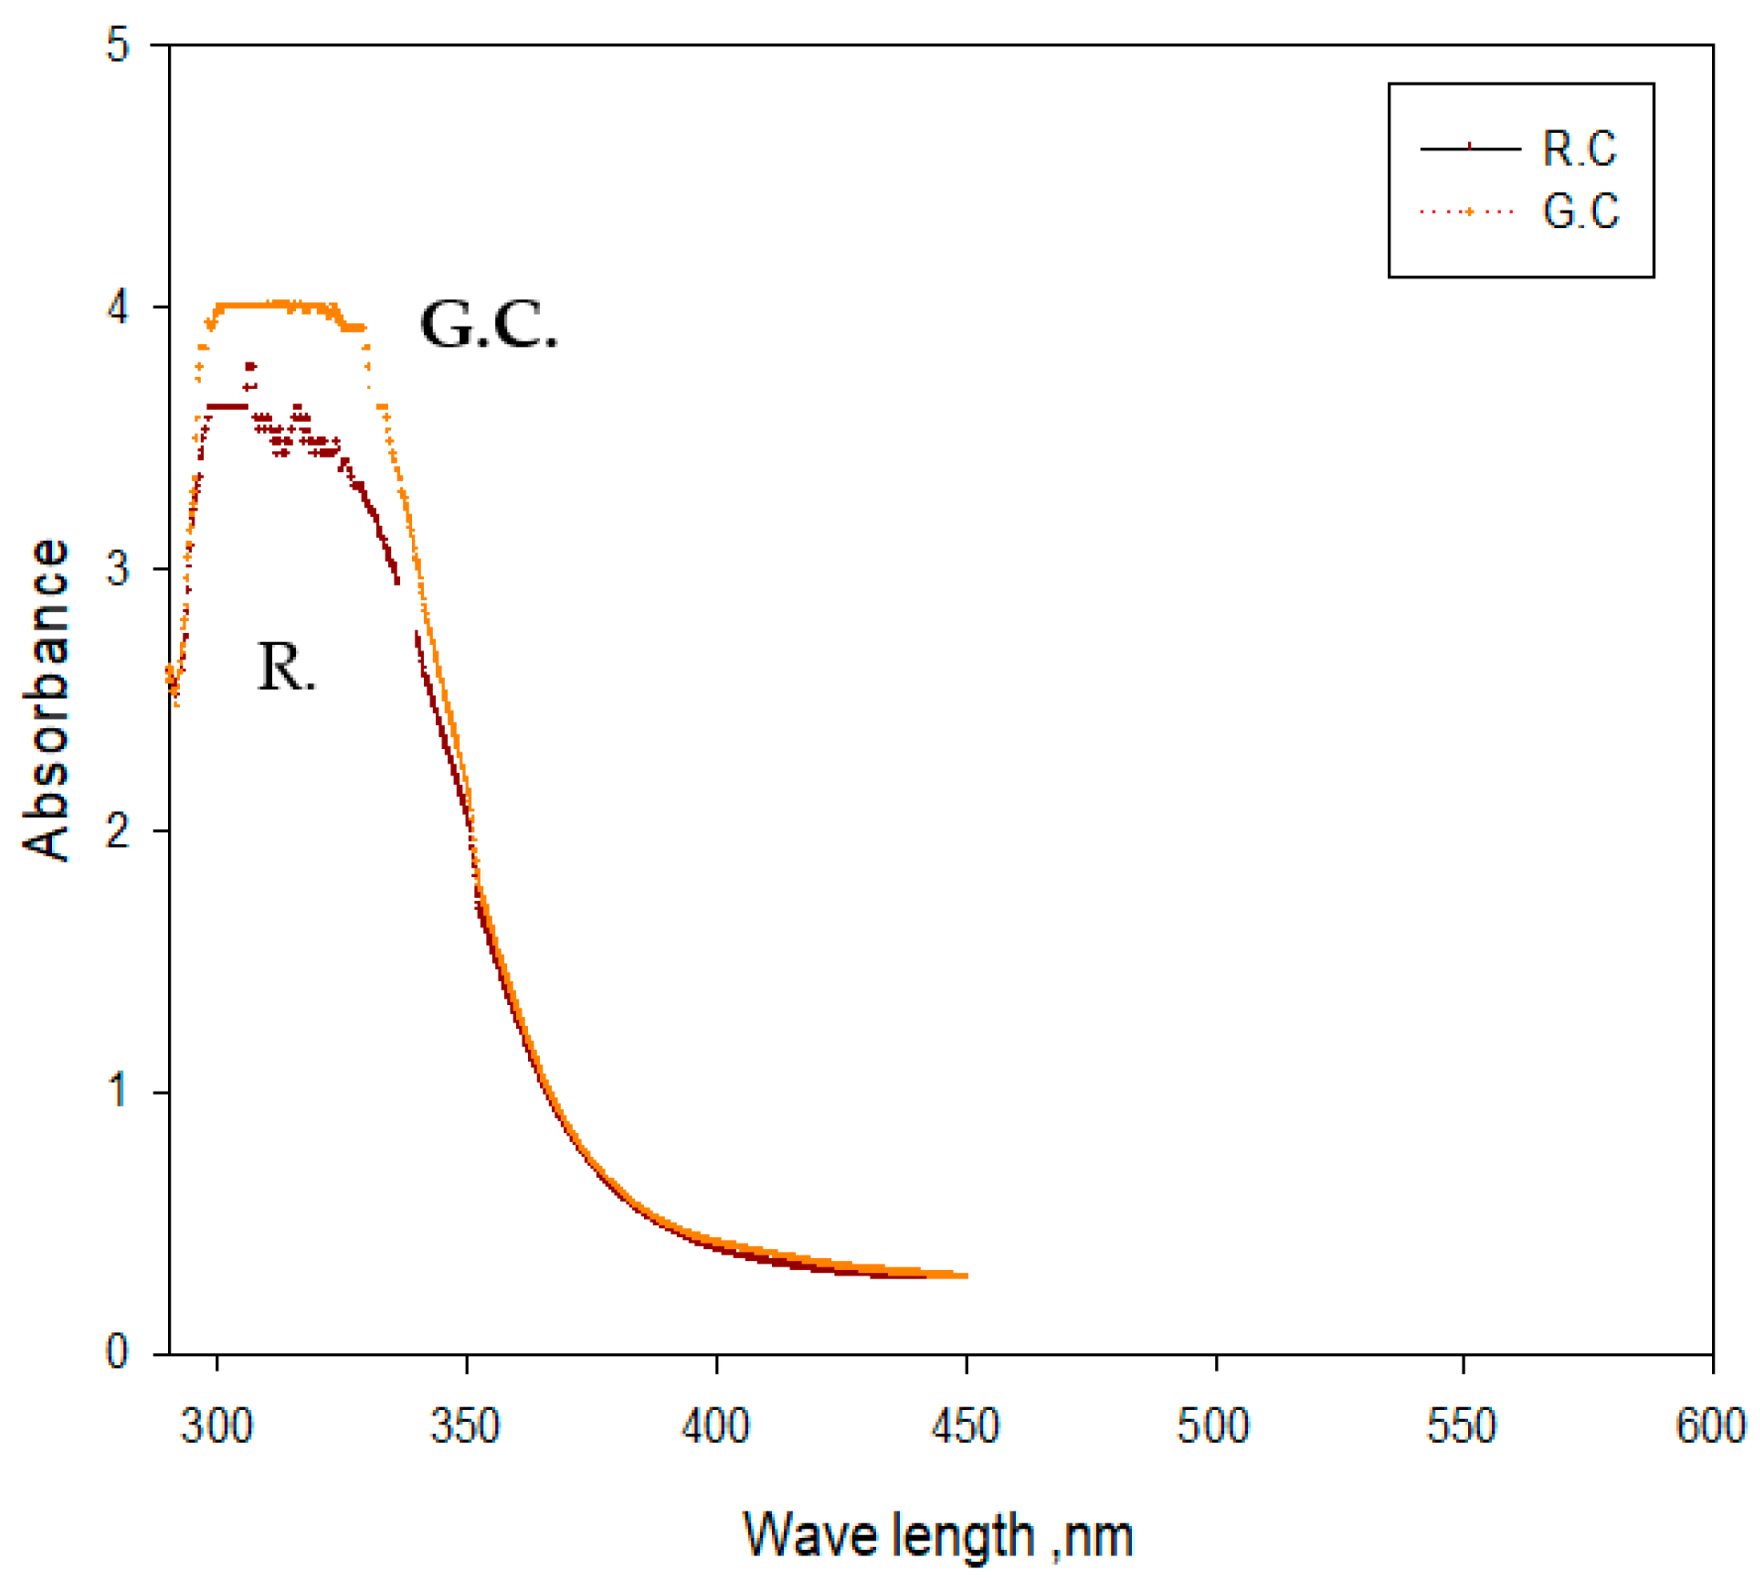
3.1. UV-Visible Absorption Spectra of Natural Dyes

The absorption spectra of the dye solutions prepared from the RC and GC leaves showed maximum absorption peaks at 330 nm and 280 nm, respectively (see Figure 3). It is evident that these natural extracts absorbed light and hence fulfilled the primary criterion for their use as sensitisers in DSSCs. The absorption spectra of the RC dye showed a higher photosensitive efficiency for DSSCs, which is in agreement with prior results [58,59].

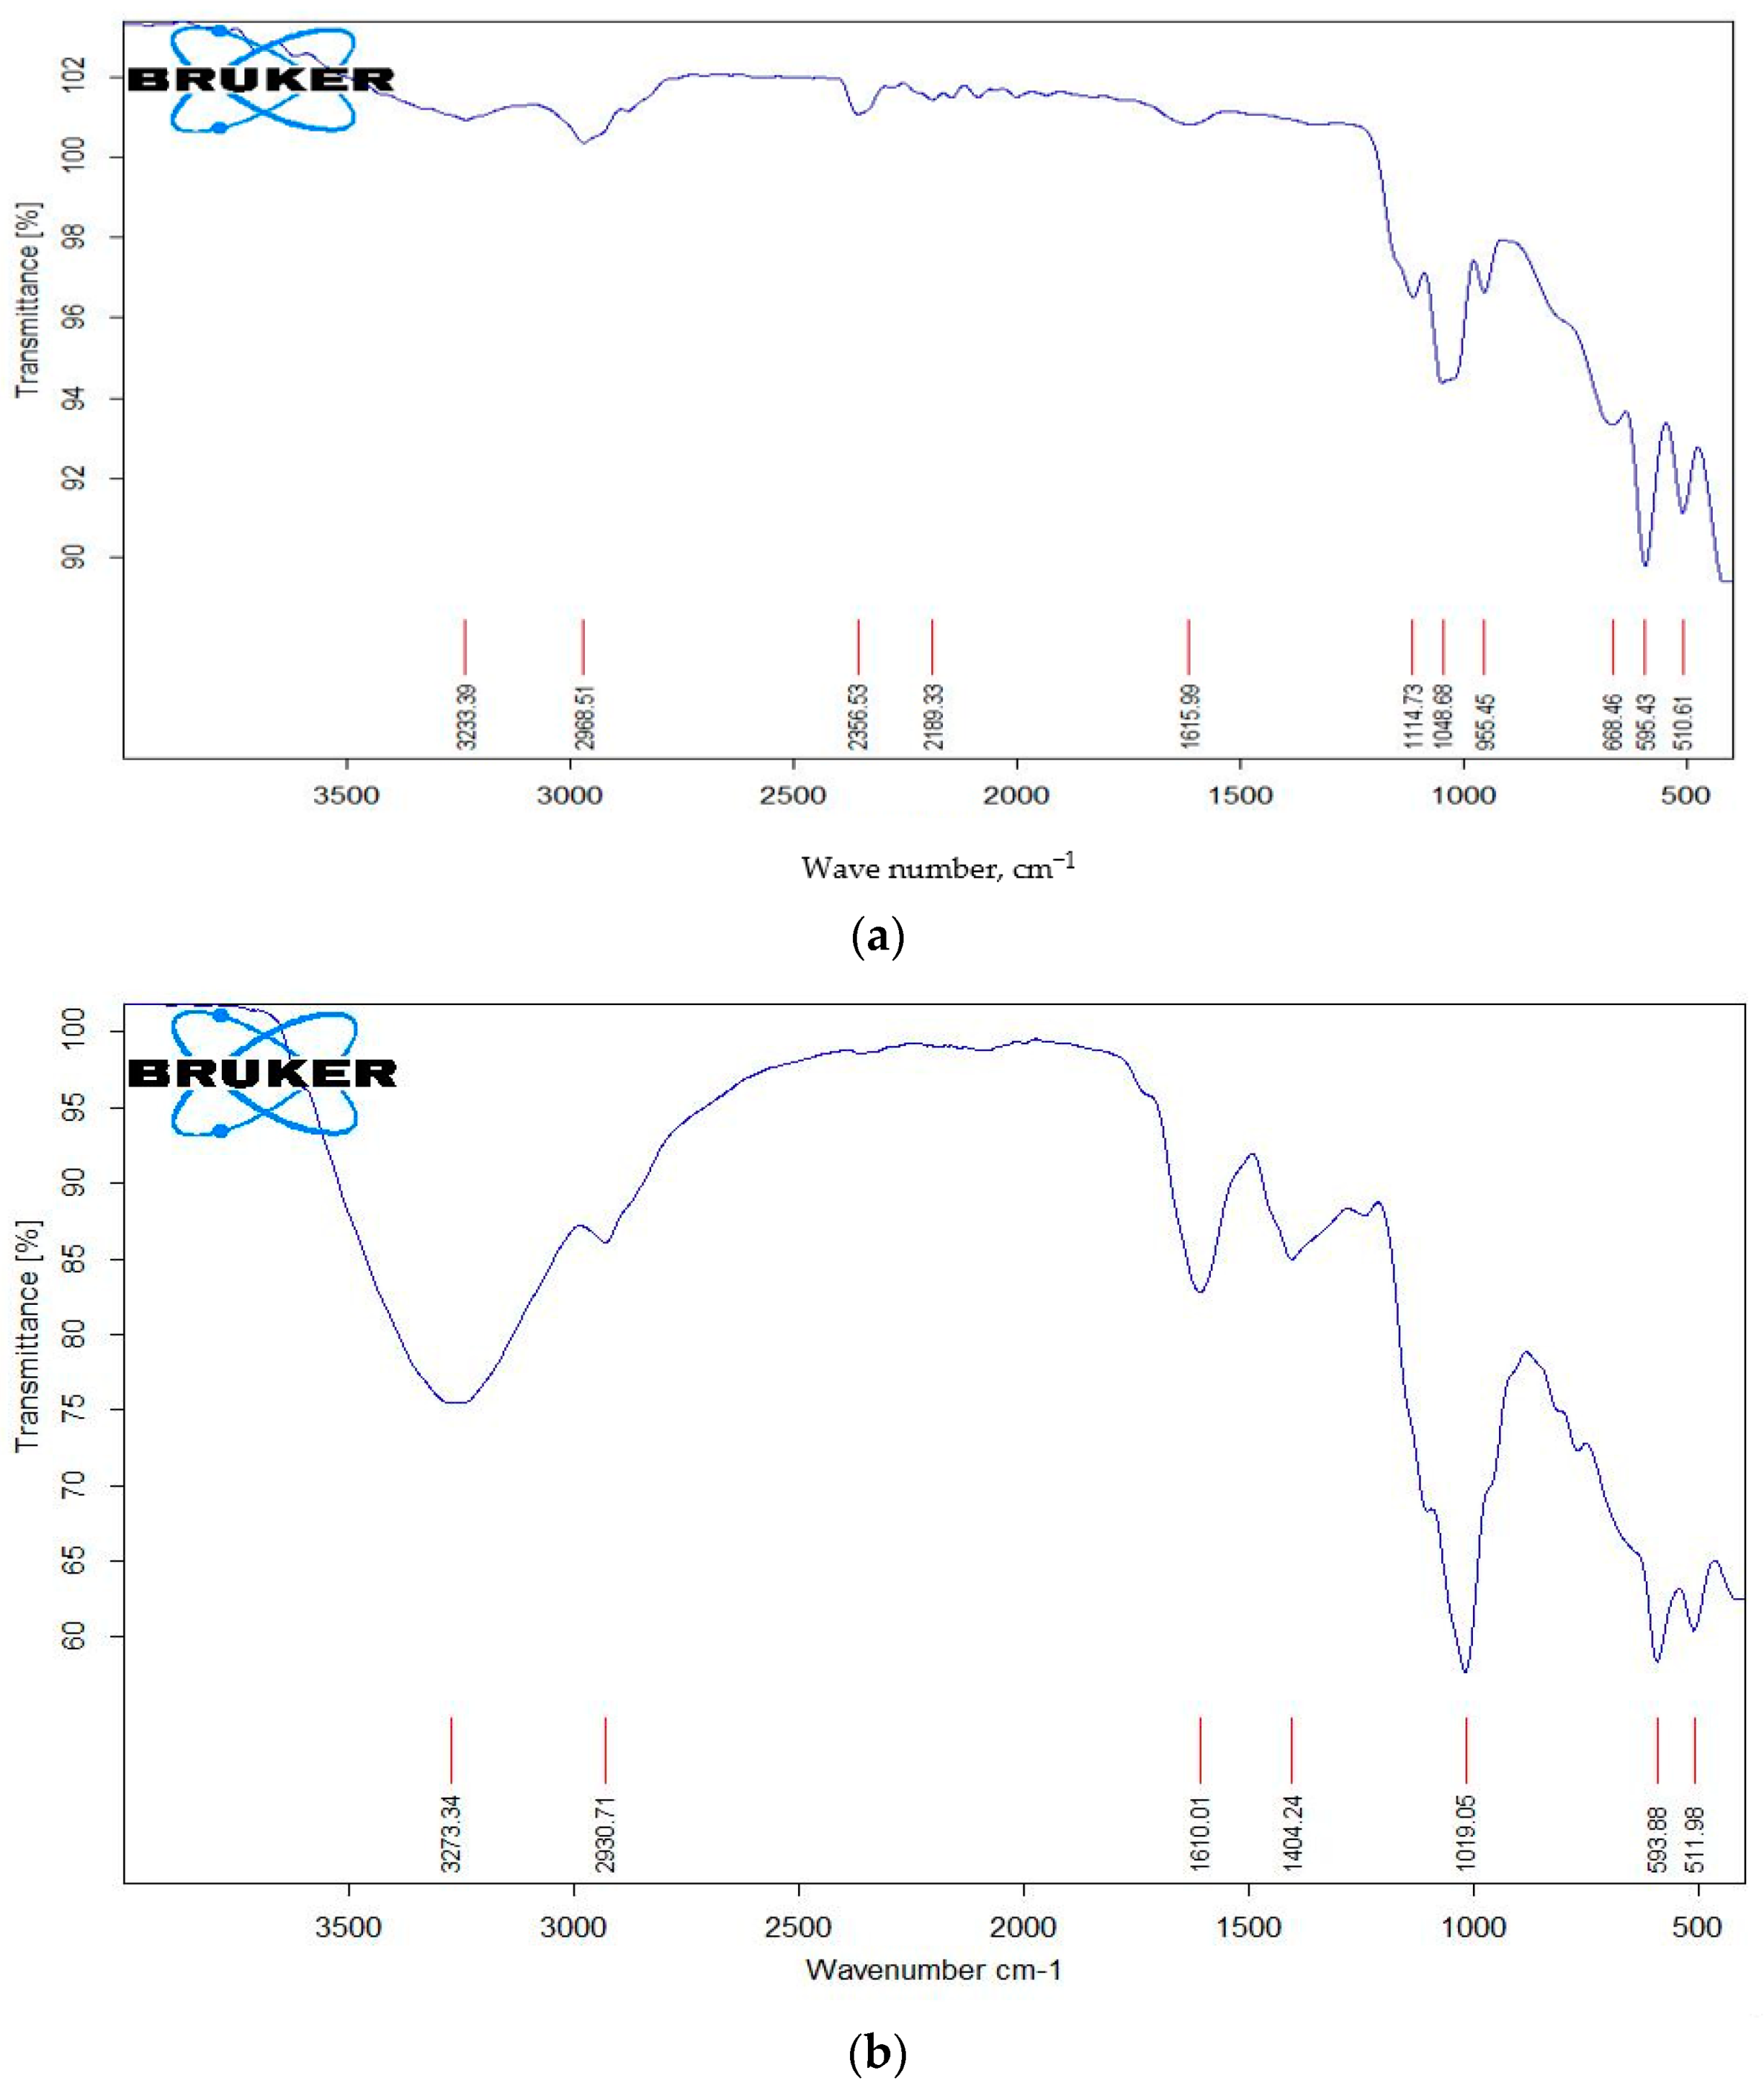
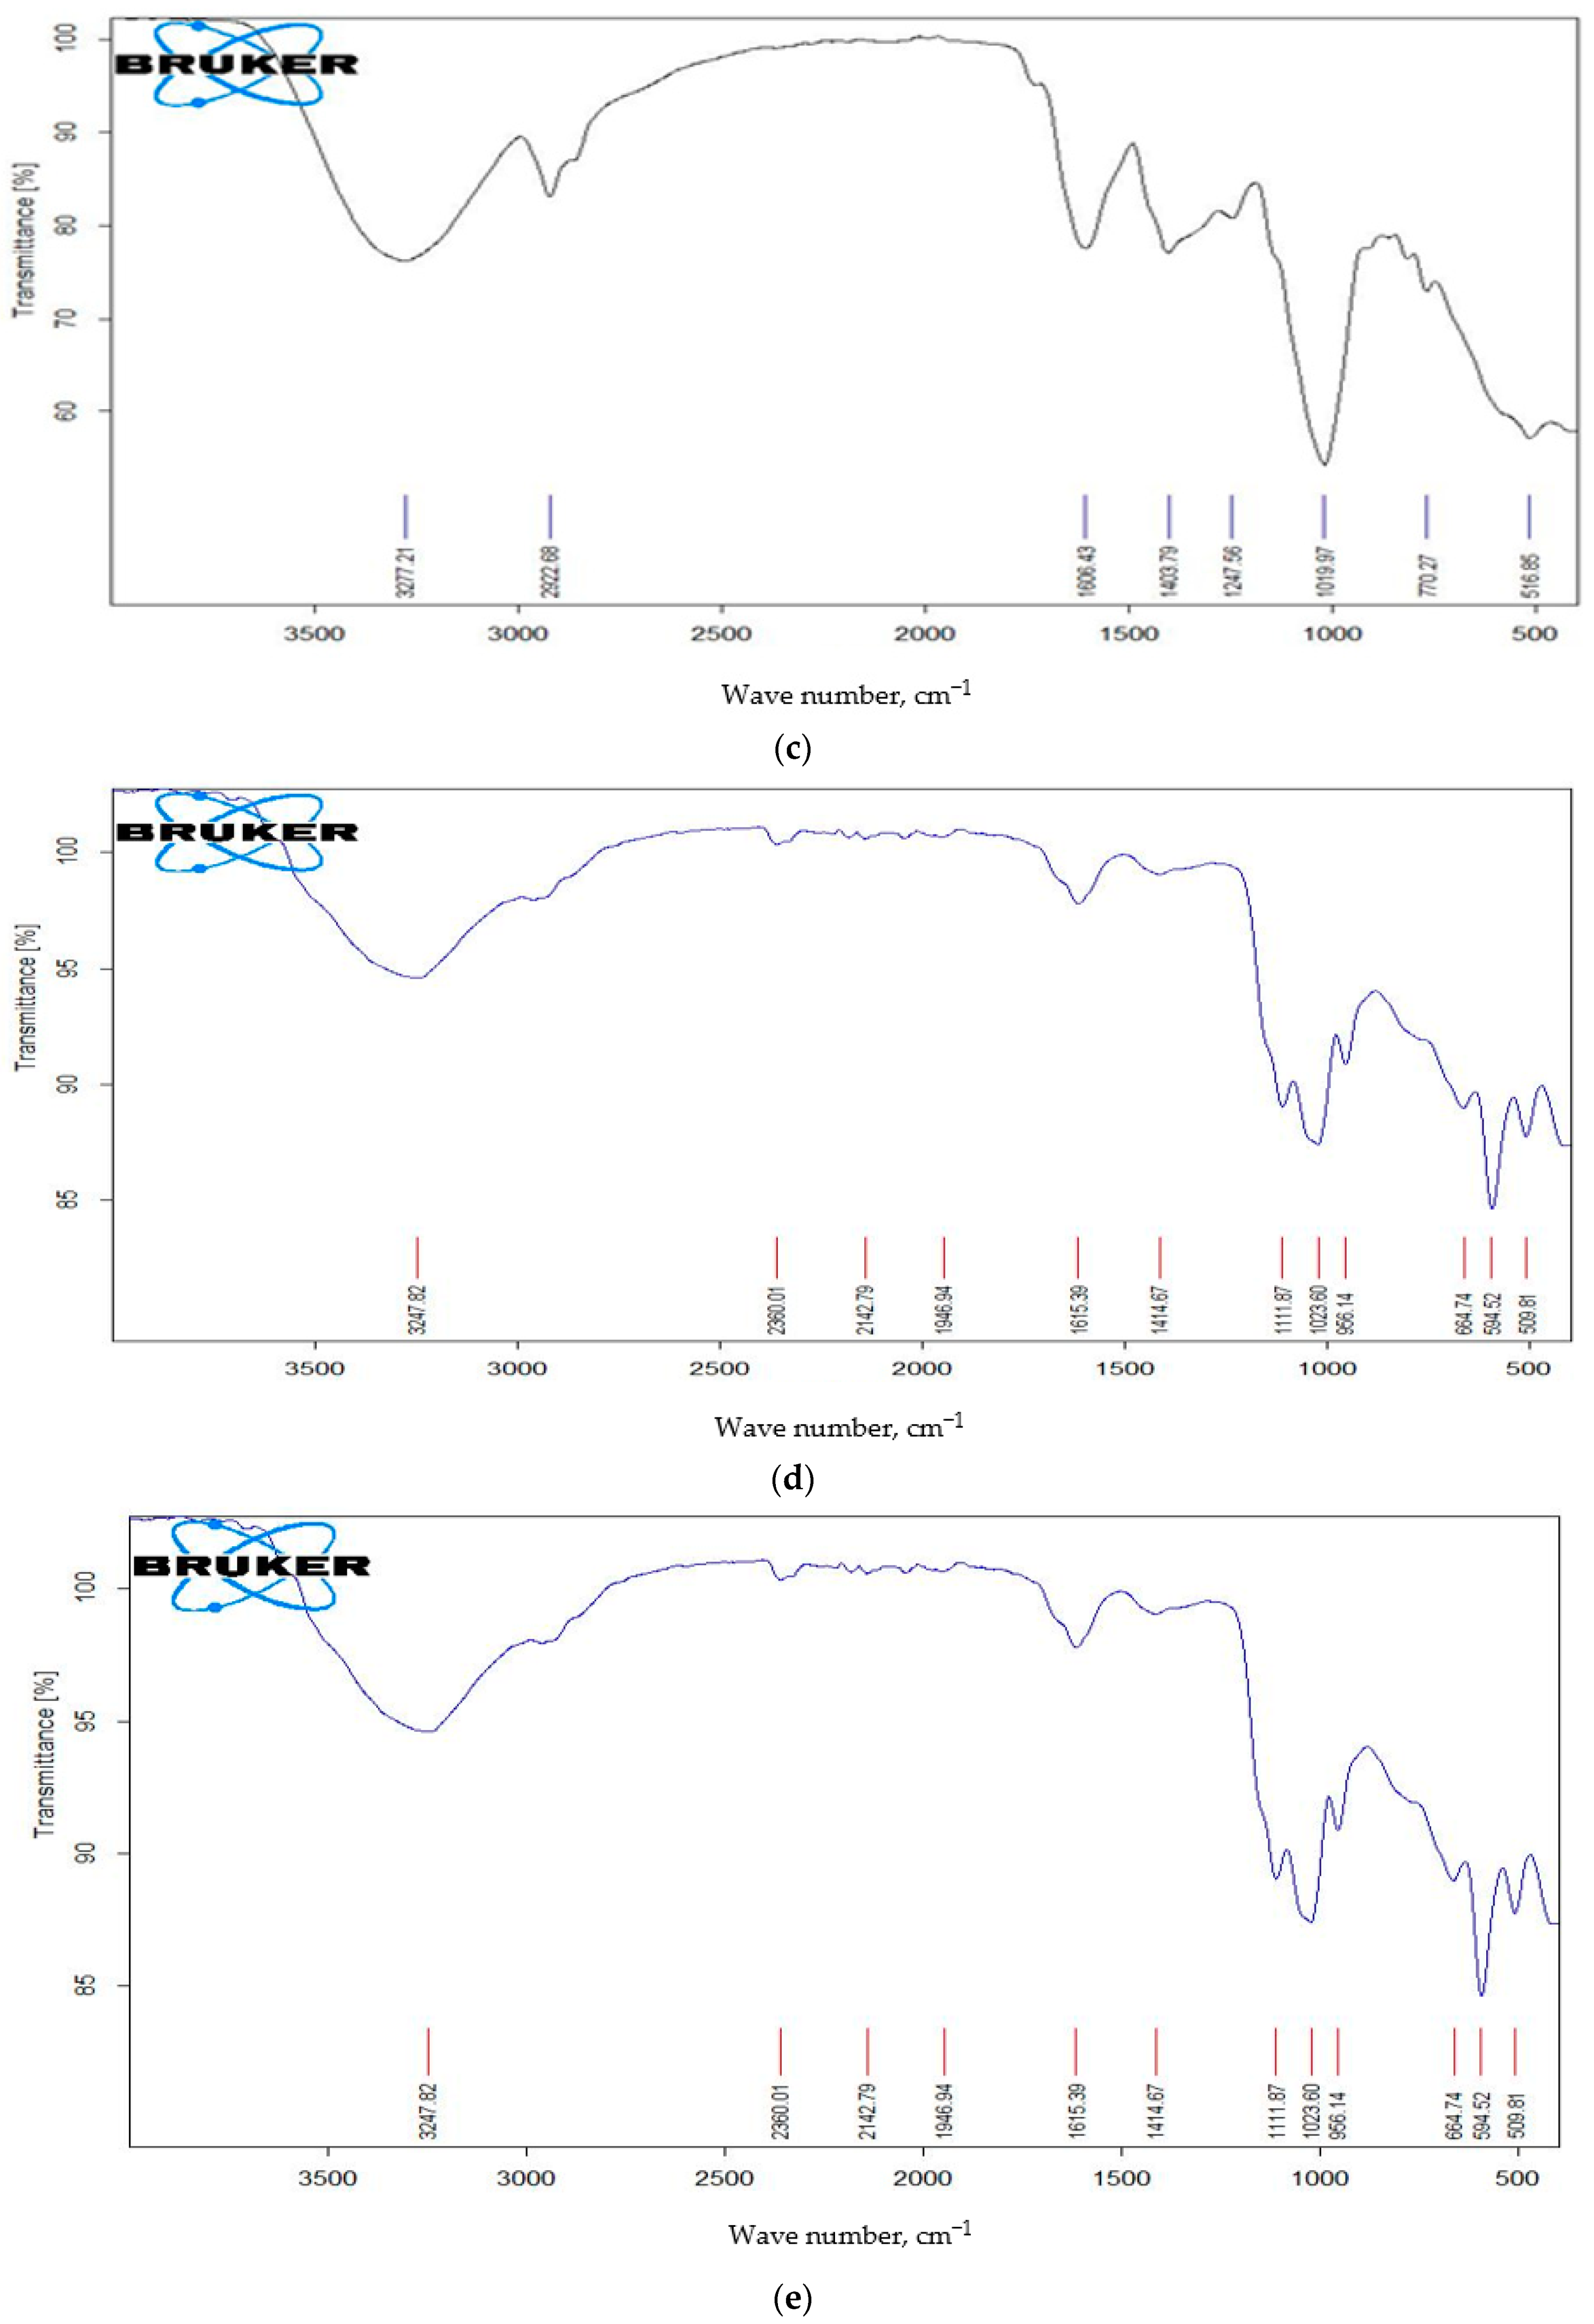
3.2. Fourier Transform Infrared (FT-IR) Analysis for GC and RC Dyes

The FT-IR device (IRPrestige21machine from Shimadzu, Japan) used to obtain the FT-IR spectrum of NZnO, RC dye, GC dye, RC dye with NZnO, and GC dye with NZnO at wave numbers ranging from 400–4000 cm−1, Figure 4, and the interpretation of the spectra appears in Table 1. The FT-IR spectrum of the ZnO nanoparticles (Figure 4a) includes the characteristic absorption bands at 510.61 cm−1 for NZnO, at 511.98 cm−1 for RC dye without NZnO, at 516.85 cm−1 for RC dye with NZnO, 516.54 for GC without NZnO, and 509.81 for GC dye with NZnO cm−1. The absorption band in the range of 3200–3500 cm−1 was assigned to the OH groups on the surface of the NZnO [60]. The spectra shown in Figure 3b,c corresponded to the functional groups of the dye extracted from the GC, as detailed in Table 1. The CH3 vibrations were observed in the range of 2930–2919 cm−1, and the C–H2 and C–N vibrations were observed at 2855 cm−1 and 2360 cm−1, respectively. Moreover, the vibrations associated with C=O stretching in esters appear at 1735 cm−1 and 1946 cm−1 in the GC, whereas the C=C vibrations appear in the ranges of 1604–1610 cm−1 and 1606–1615 cm−1 in the RC and the GC, respectively [61]. The C–O-C ether vibrations appear at 1019 cm−1 and 1021 cm−1 for the RC and at 1018 cm−1 and 1023 cm−1 for the GC. As observed from the functional groups of the dye extracted from the RC, detailed in Table 1, vibrations due to H-bonds in molecules appear in the range of 3249–3279 cm−1, and the C=C stretching vibrations appear in the range of 1604–1614 cm−1 for both the GC and the RC. The stretching vibrations of C–O ethers or of C–N bonds appear at 1019 cm−1 and 1021 cm−1 for the RC, and at 1018 cm−1, 1023 cm−1, and 1111 cm−1 for the GC. The band covering the range of 934–995 cm−1 indicates the presence of isomers of trans-oleic acid. The spectrum includes a strong broad band in the range of 3200–3700 cm−1, which characterises the hydrogen bond group [62,63].
The GC dyes contain a pigment called chlorophyll that absorbed sunlight in the red (long wavelength) domain and in the blue (short wavelength) domain of the visible light spectrum. The chlorophyll strongly absorbed blue and orange-red light. The RC dyes contain anthocyanin pigments that make them purple. These dyes also contain chloroplasts with chlorophyll, only in lesser quantities than the GC dyes. The absorption spectrum of the anthocyanin pigments (a carotenoid pigment) includes features in violet light and blue-green light. This is because red light has a longer wavelength and lower energy than violet light. Figure 5 and Table 1 indicate that GC dye has a longer wavelength compared to RC dye with a short wave length, so RC dye showed a higher electrical conversion of energy compared to the GC dye.

3.3. Scanning Electron Microscopy (SEM) Imaging of NZnO

The SEM images obtained for NZnO are shown at a high magnification in Figure 6. It can be seen that particles smaller than 20 nm formed. The image shows that the particles separated smoothly and were not significantly affected by agglomeration. The ZnO nanoparticles took the form of rectangles and triangles. Agglomerations of individual zinc nanoparticles can also be seen in the SEM images. The agglomerated lump showed the presence of several nanoparticle aggregates, while some individual crystals are also visible.

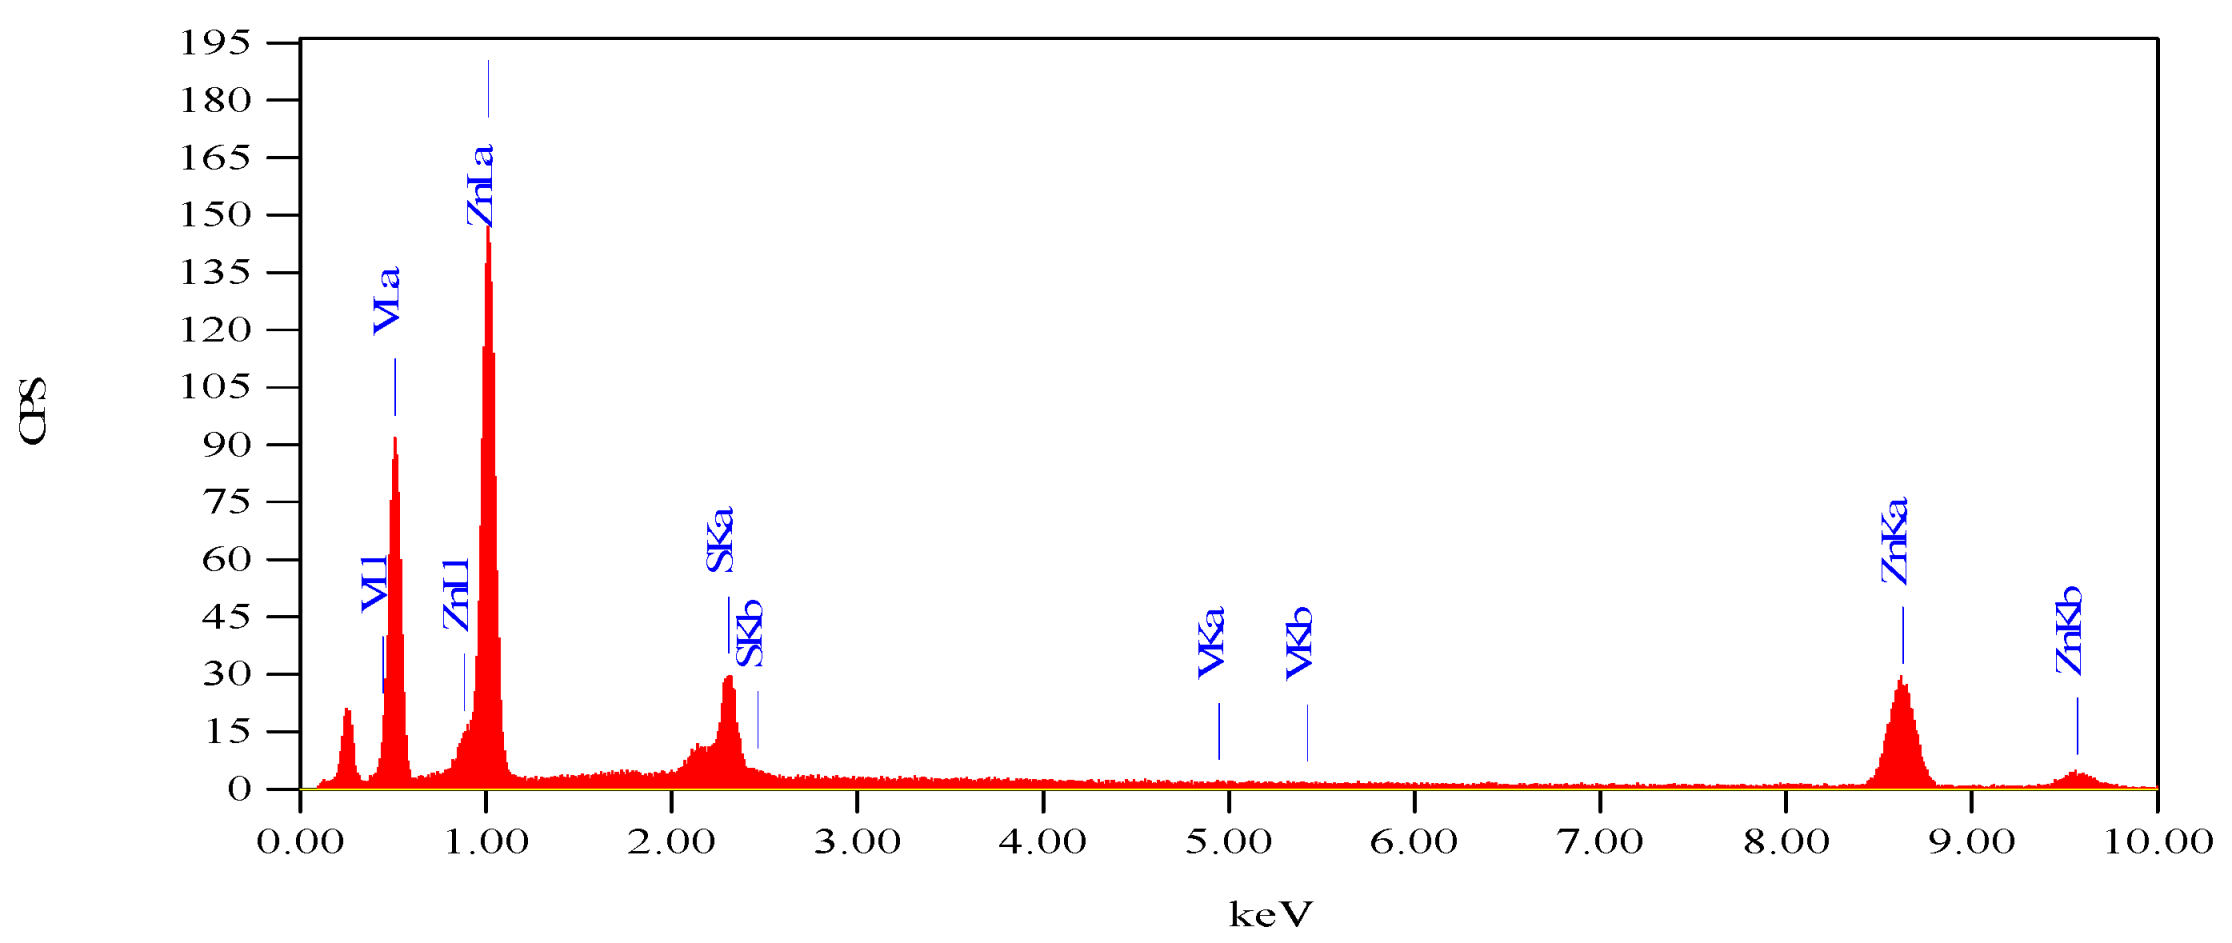
3.4. Energy Dispersive Spectroscopy (EDS) of NZnO

The EDS plots obtained for NZnO are illustrated in Figure 7. The ZnO nanoparticles’ optical absorption peaks were attributed to the surface plasmon resonance of the ZnO nanoparticles. The origin of these elements lies in the biological components, mostly aligning along with the ZnO nanoparticles and containing SKa, SKb VKa, VKb, and Zn, which provide chemical information of the synthesised NPs (Nanoparticles) in agreement with [63,64]. The values of S and V elements found in the EDS plots are traces from the aqueous solutions of zinc sulphate heptahydrate and sodium hydroxide that were combined drop-wise in a molar ratio of 1:2 to obtain NZnO as given in item 2.1. Preparation of NZnO.

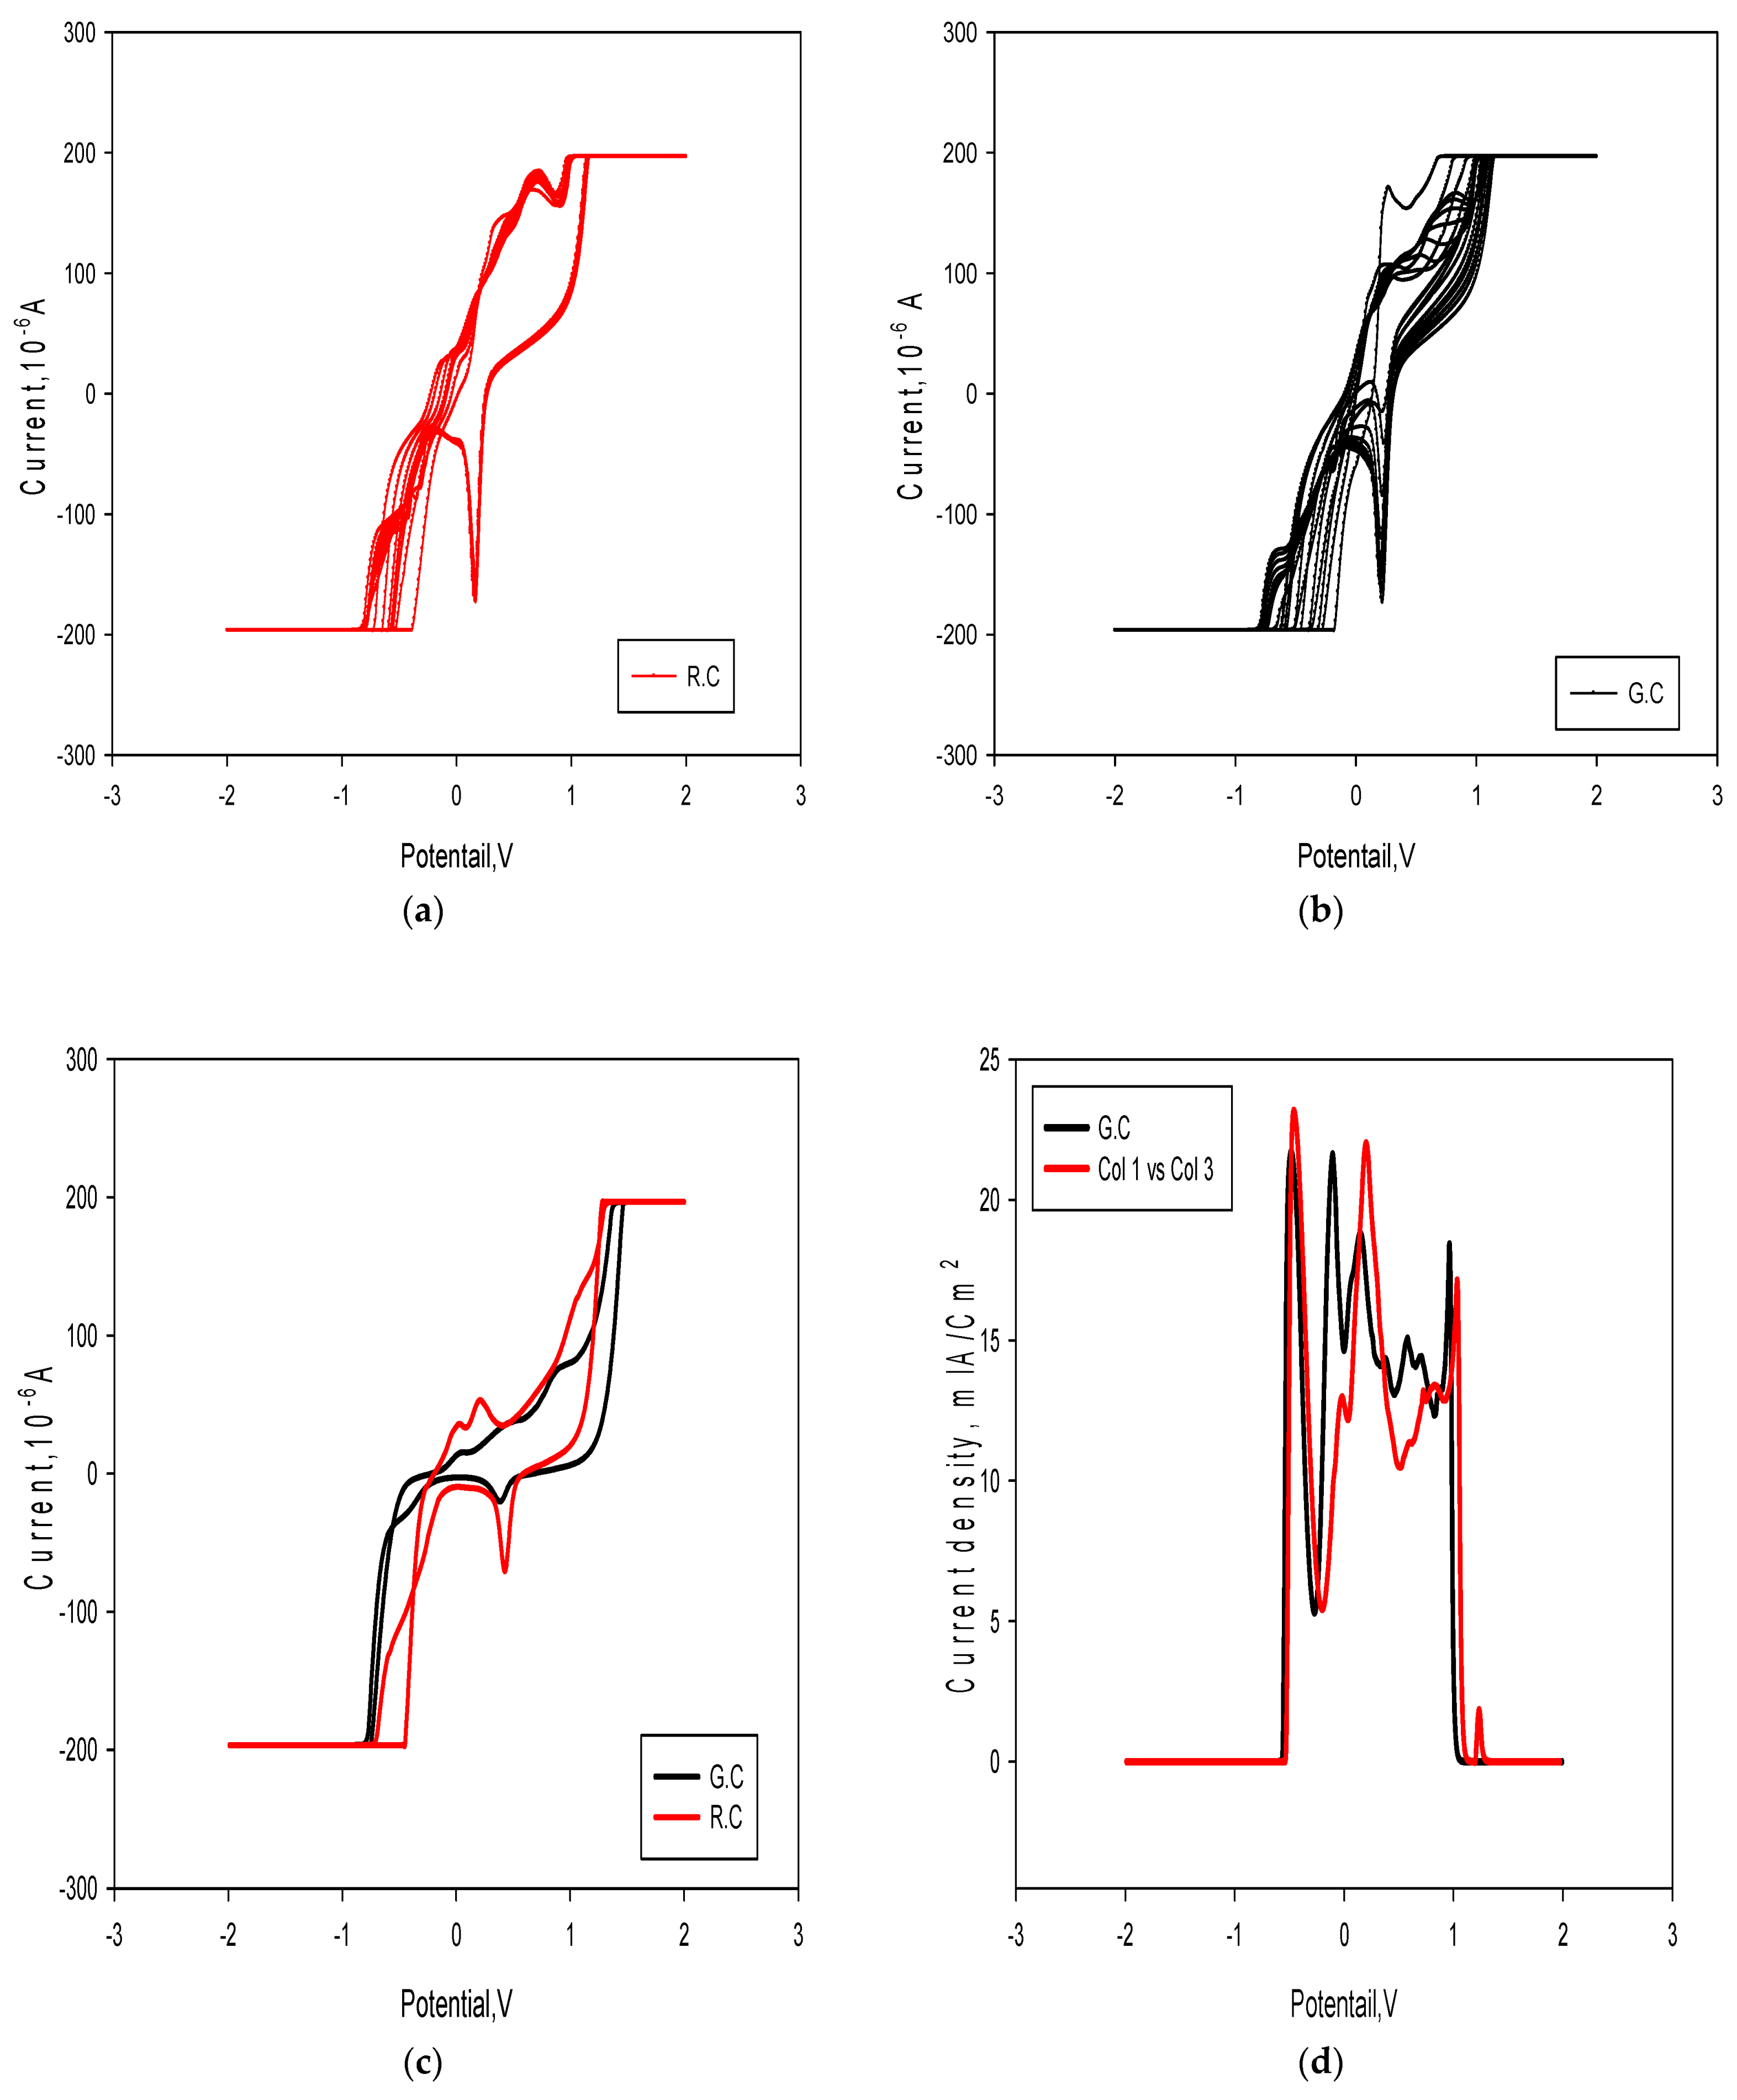
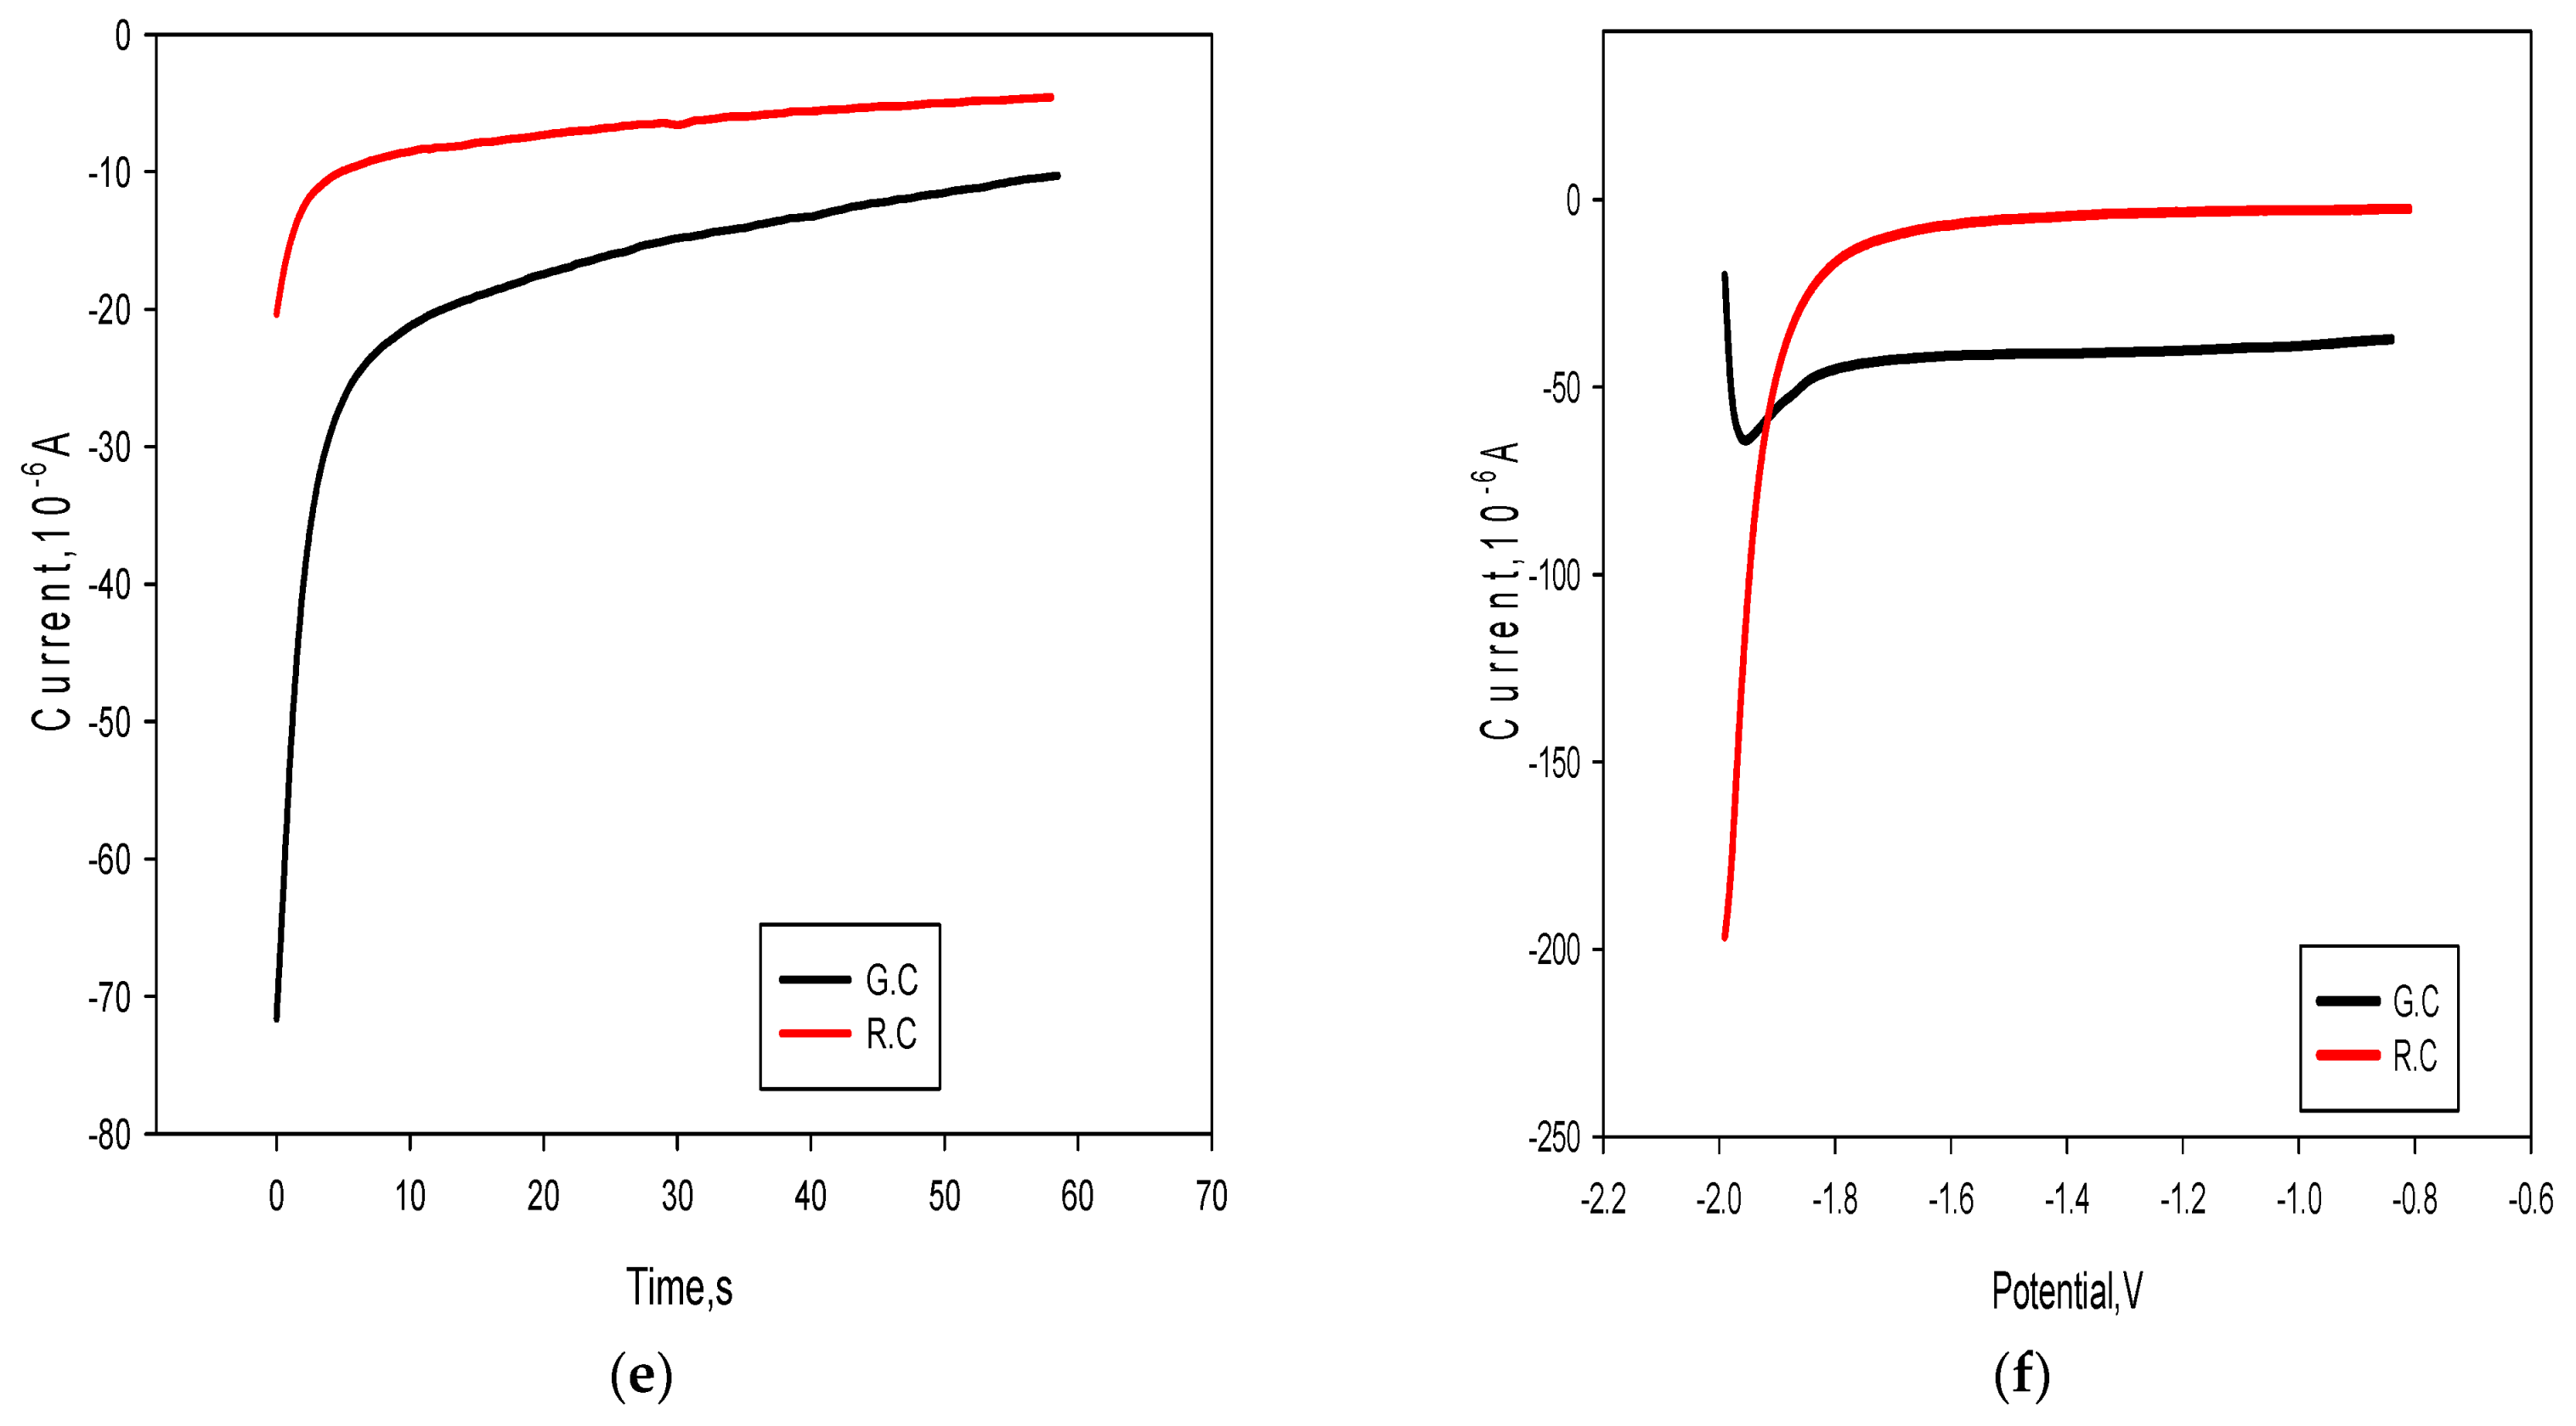
3.5. Electrochemistry of Red and Green Cabbage Extracts

The voltammogram curves for the RC and GC extracted films are shown in Figure 8a–f. The current-potential relations for the RC and GC extracts are shown individually in Figure 8a,b, respectively. For the RC, there were two anodic peaks: At 0.5 V with 0.19 mA and at 0.8 V with 0.21 mA, coupled with two cathodic peaks, at 0.2 V with −0.18 mA and at 0.17 V with 0.18 mA, respectively. For the GC, there were also two anodic peaks, at 0.2 V with 0.17 mA and 0.65 V with 0.195 mA, coupled with two cathodic peaks, at 0.3 V with −0.19 mA and at 0.15 V with 0.15 mA. The two cabbage extracts displayed higher reversibility and faster redox reactions due to the Faradaic pseudo capacitance (see Figure 8c). With an increase in the scan rate, the distances between the peaks increased for both the anode and the cathode, owing to the higher limit of the ion diffusion rate required to satisfy electronic neutralization during the redox reaction. The RC extract outperformed the GC extract (see Figure 8d). The CV curves have similar shapes for both extracts, implying that both the extracts possessed reversibility as well as faster redox reactions, which is consistent with the results in the literature [64,65,66].
The amperometric determination of the charge and discharge curves in terms of current and time for the RC and the GC is shown in Figure 8e,f, respectively. The nonlinear charge and discharge curves represent pseudo-capacitive processes, confirming the CV results. There were two charge trends: the first began at −0.02 mA and ended at −0.005 mA for the RC, and the second began at 0.079 mA and ended at −0.011 for the GC (see Figure 8e). The discharge profiles of the RC and GC are illustrated in Figure 8f, showing two sloping potential regions of −0.02 mA to −0.2 mA for the RC, and −0.02 mA to −0.05 mA for the GC.
These observations describe the near-surface layer storage charge pseudo-capacitance. The RC-derived cells possessed higher values of pseudo-capacitance, in agreement with previously reported results [67].

3.6. J/V Relation of GC and RC

Figure 9 illustrates the J/V relation of both GC and RC. Figure 9a shows the J/V relation of GC with the following values: Jsc GC, Voc GC, Jmax. GC, Vmax. GC of 0.223 mAcm2, 0.456 V, 0.157 mAcm2, and 0.416 V, respectively. Figure 9b showed the J/V relation of RC with the following values: Jsc GC, Voc GC, Jmax. GC, Vmax. GC of 0.797 mAcm2, 1.306 V, 0.531 mAcm2, and 0.59 V, respectively. Figure 9c illustrates the J/V relation of both GC and RC trends where the RC trend is shown to be higher than the GC trend, indicating the higher absorption of sun energy for RC compared to GC.

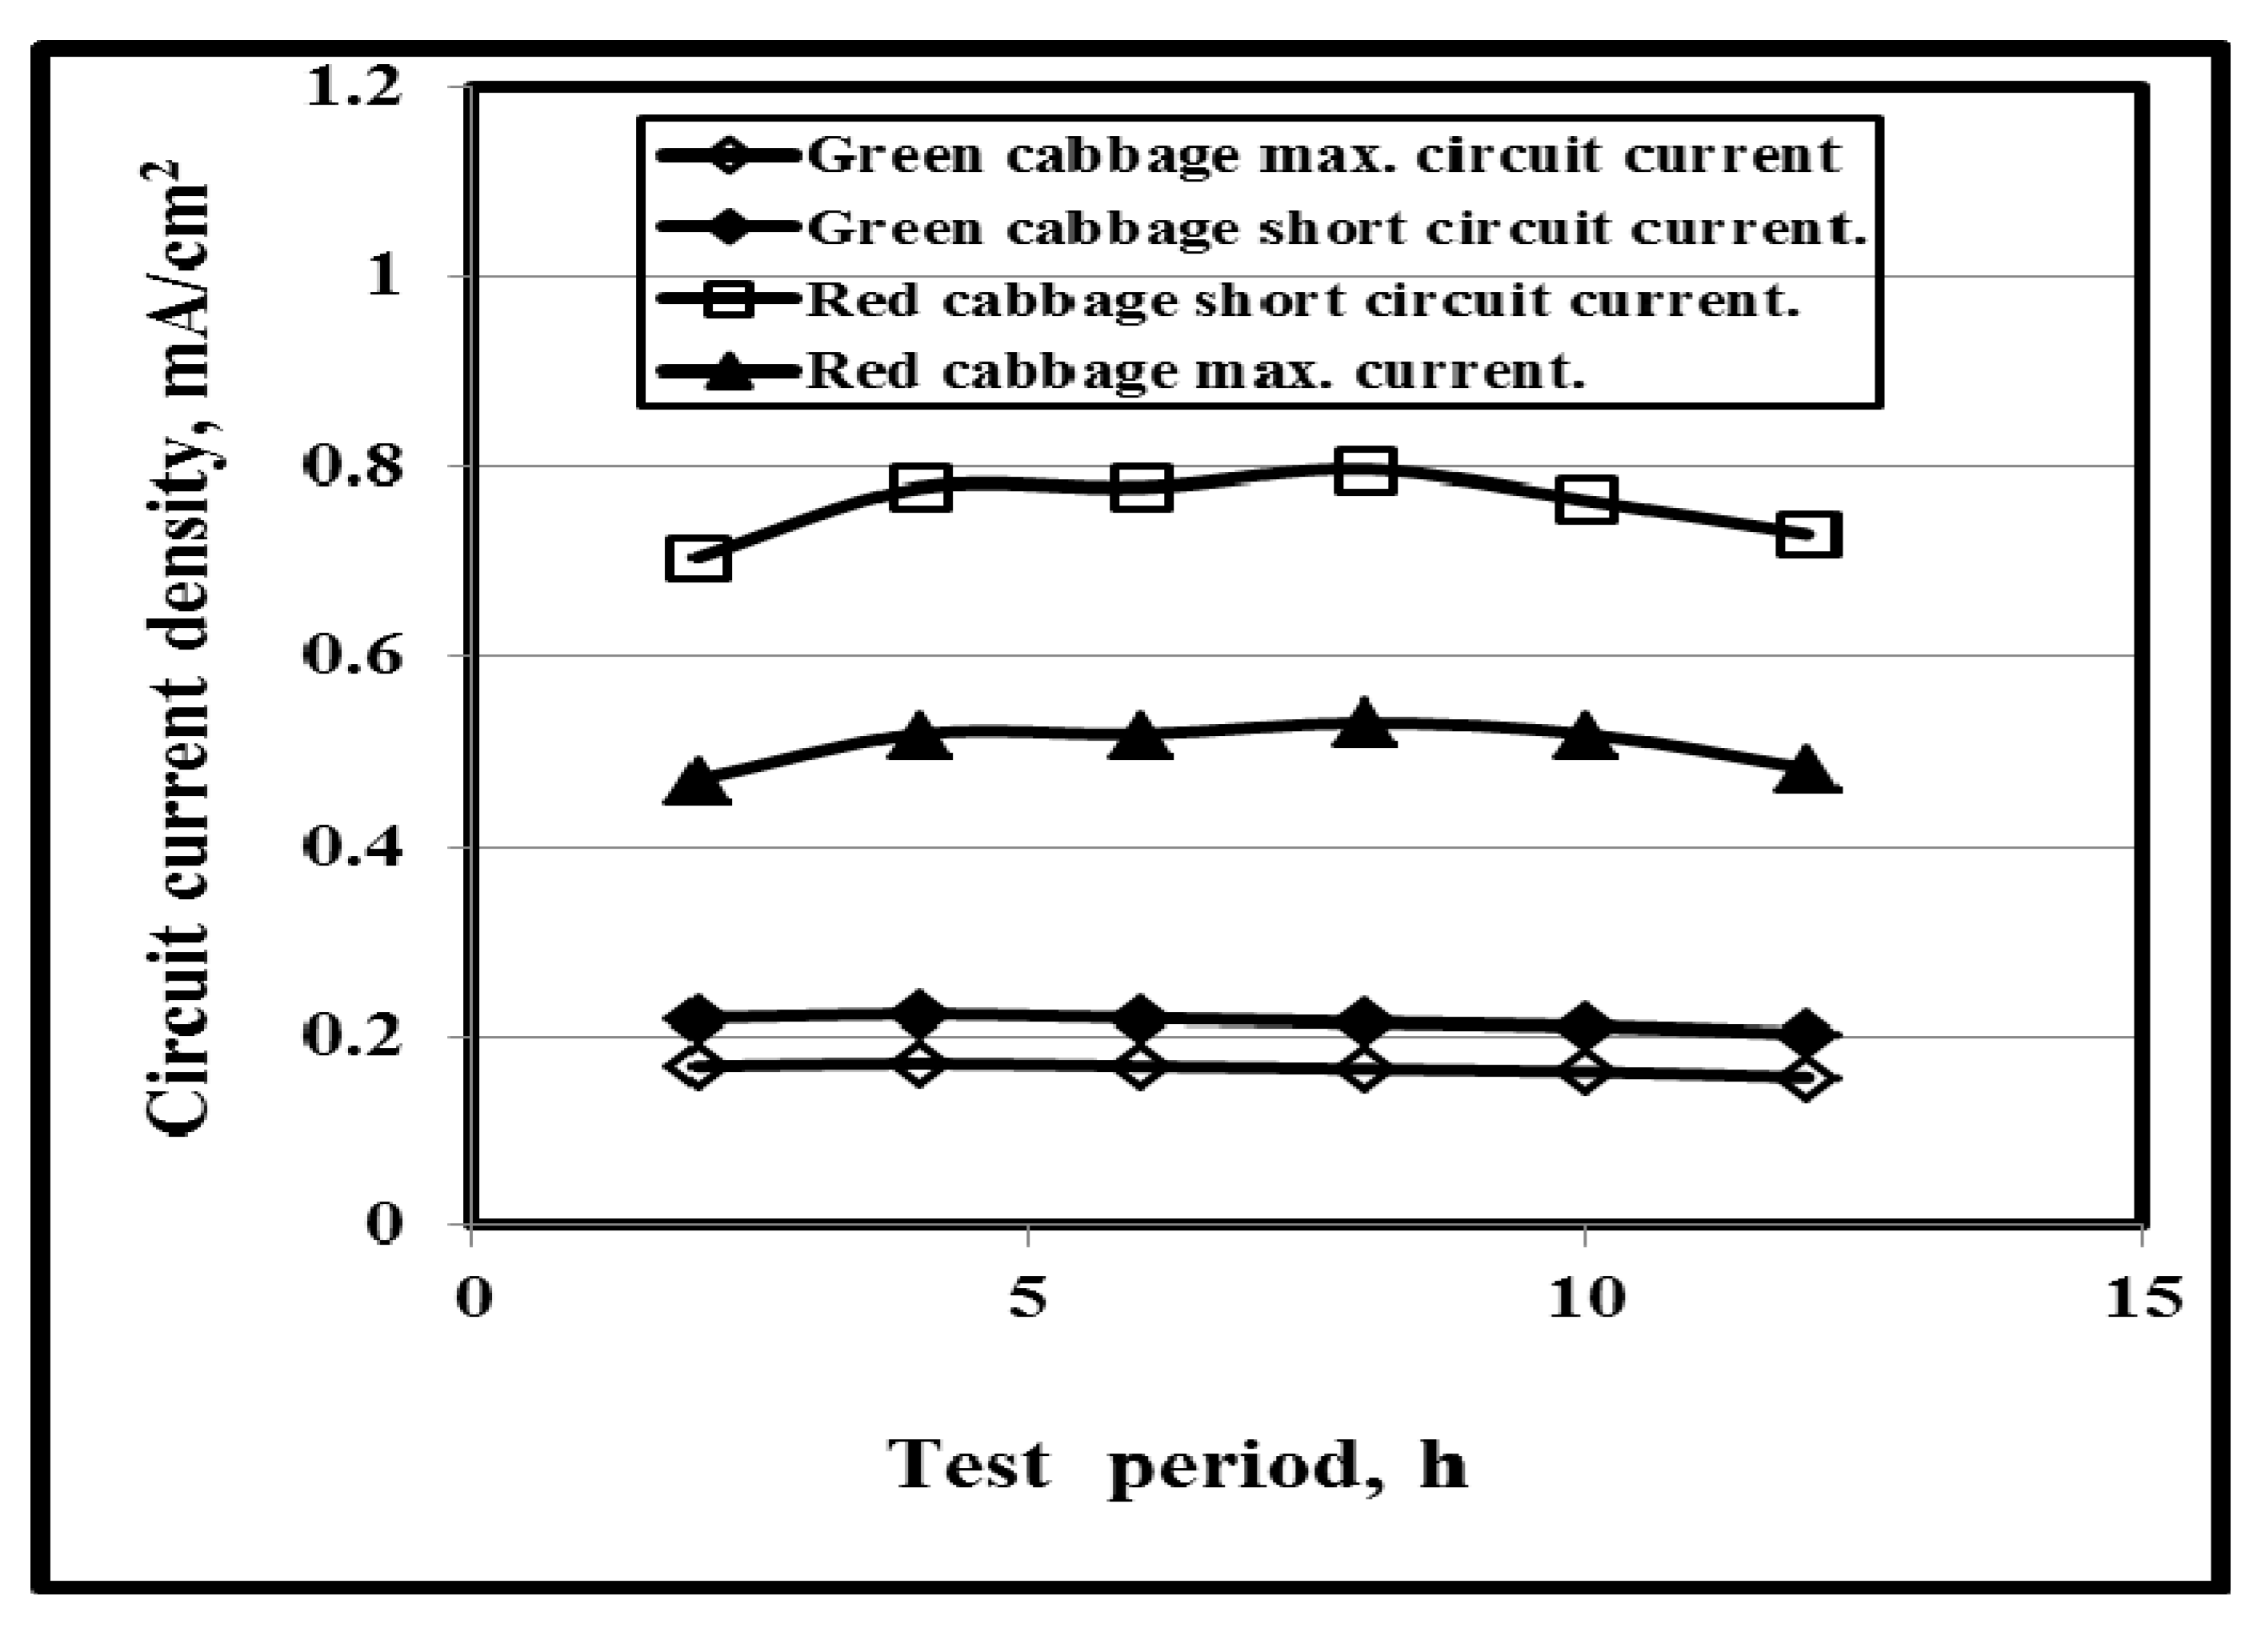
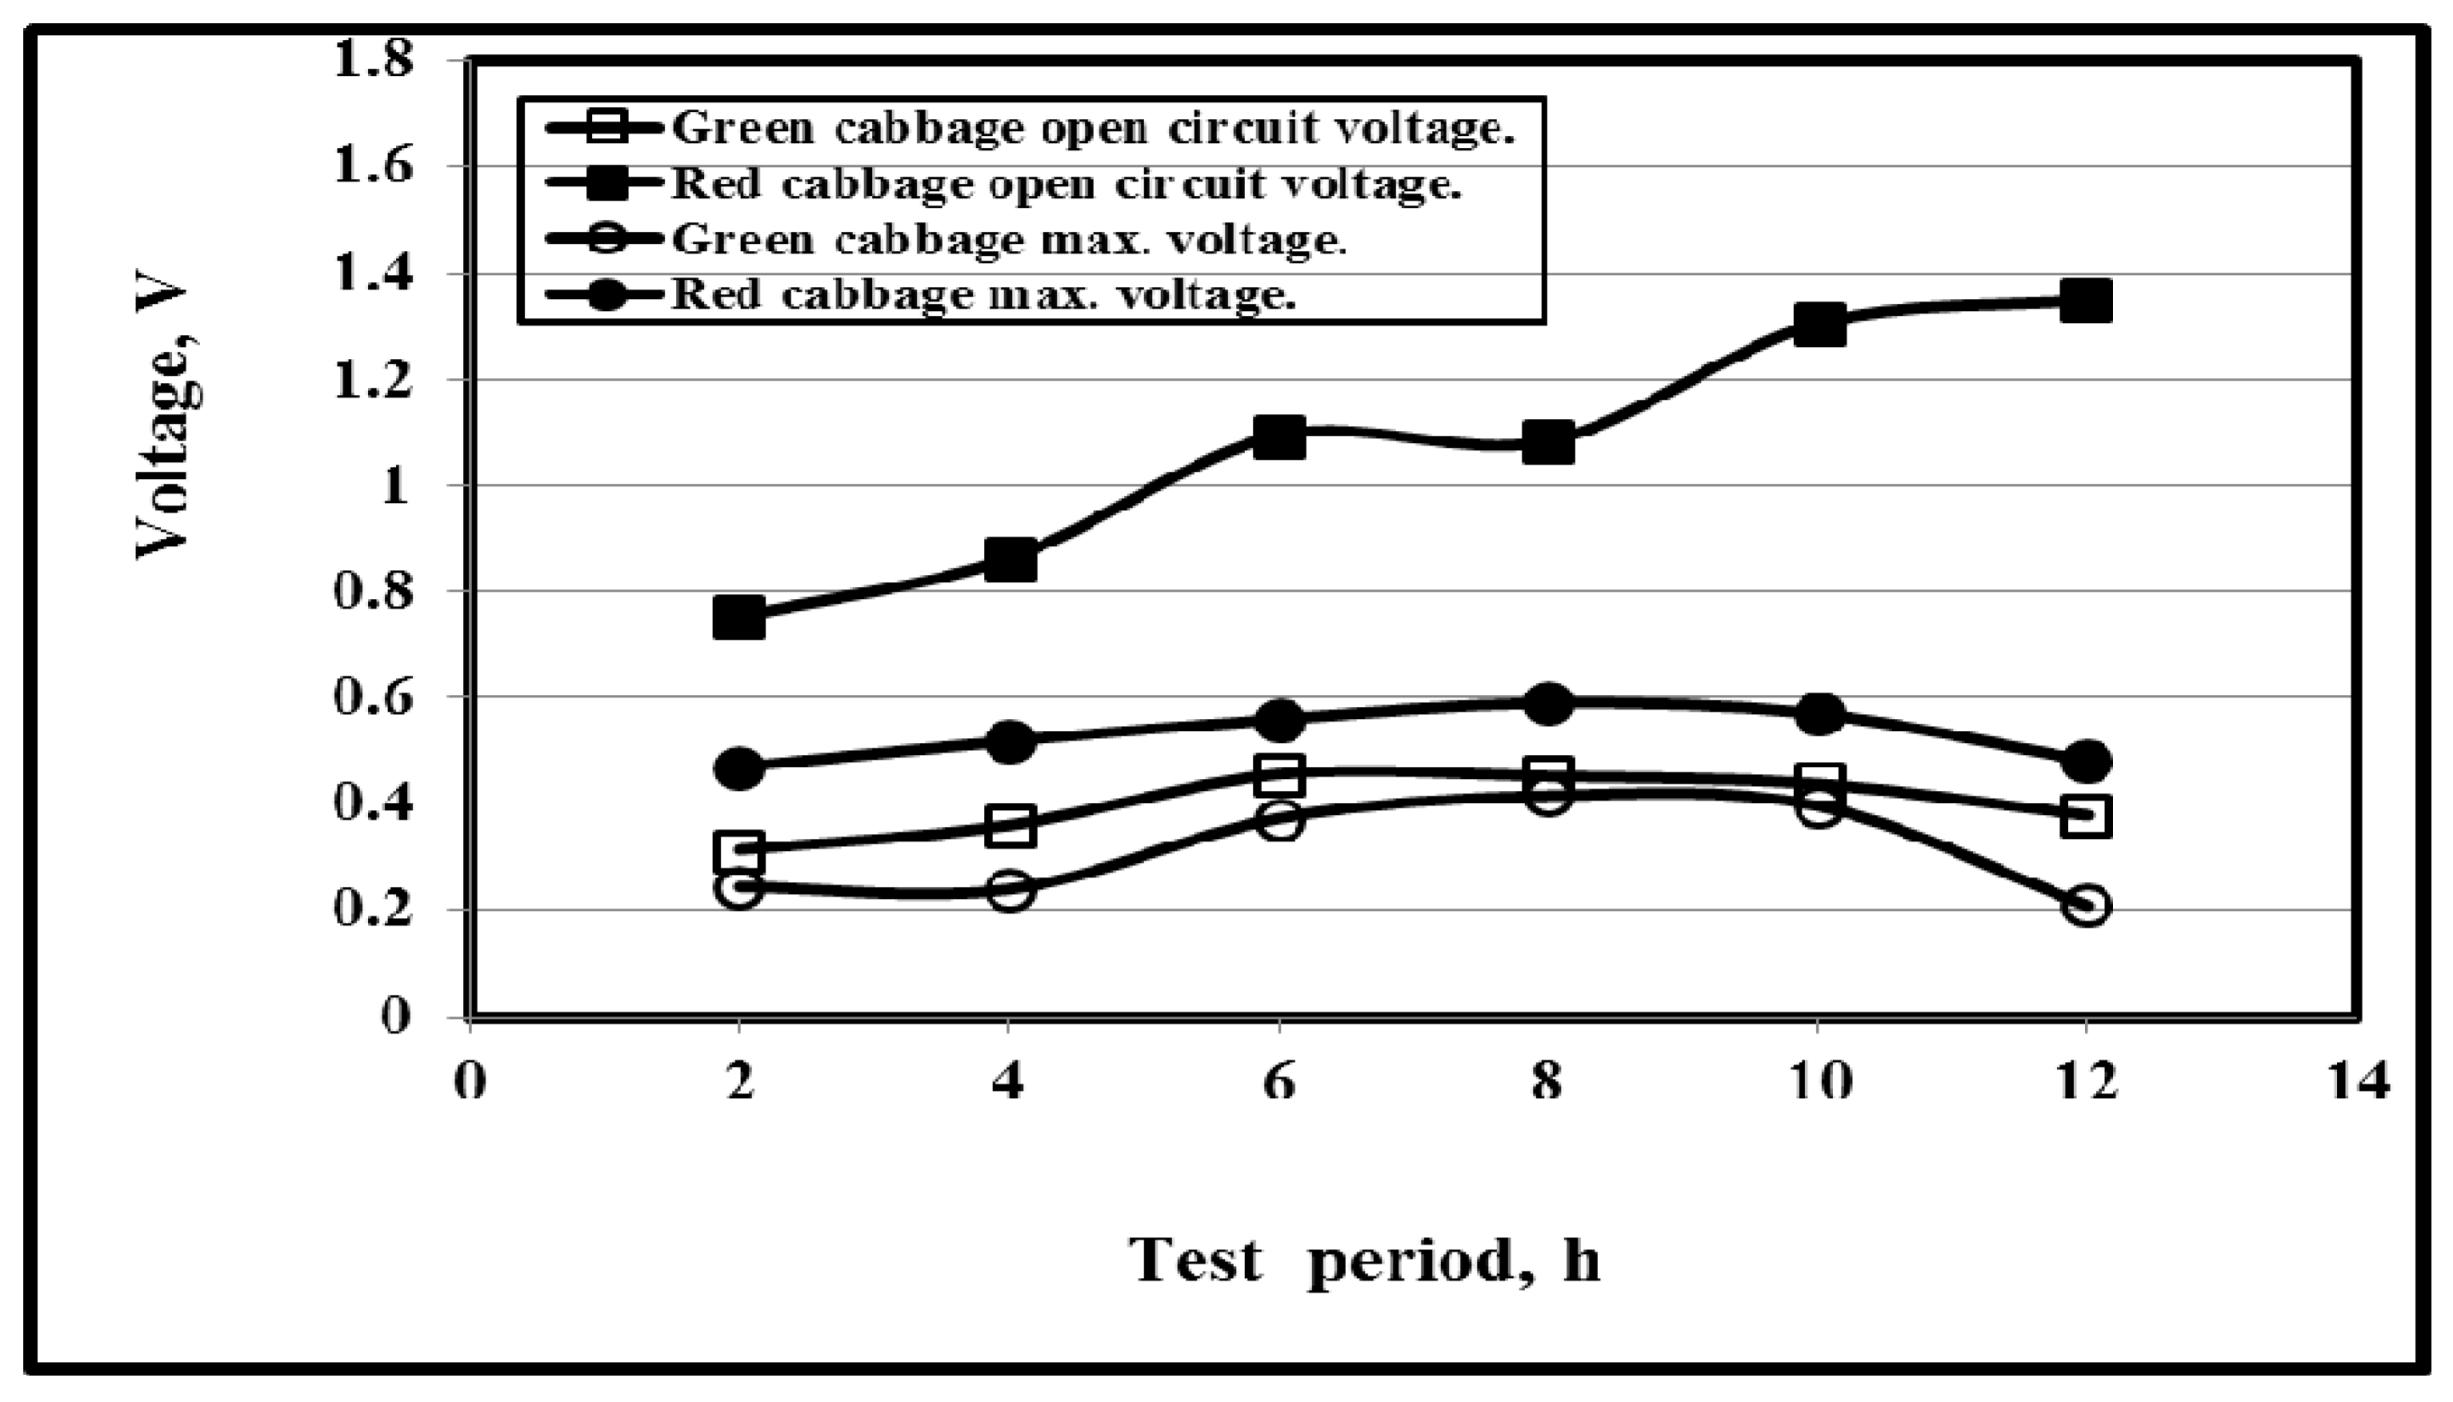
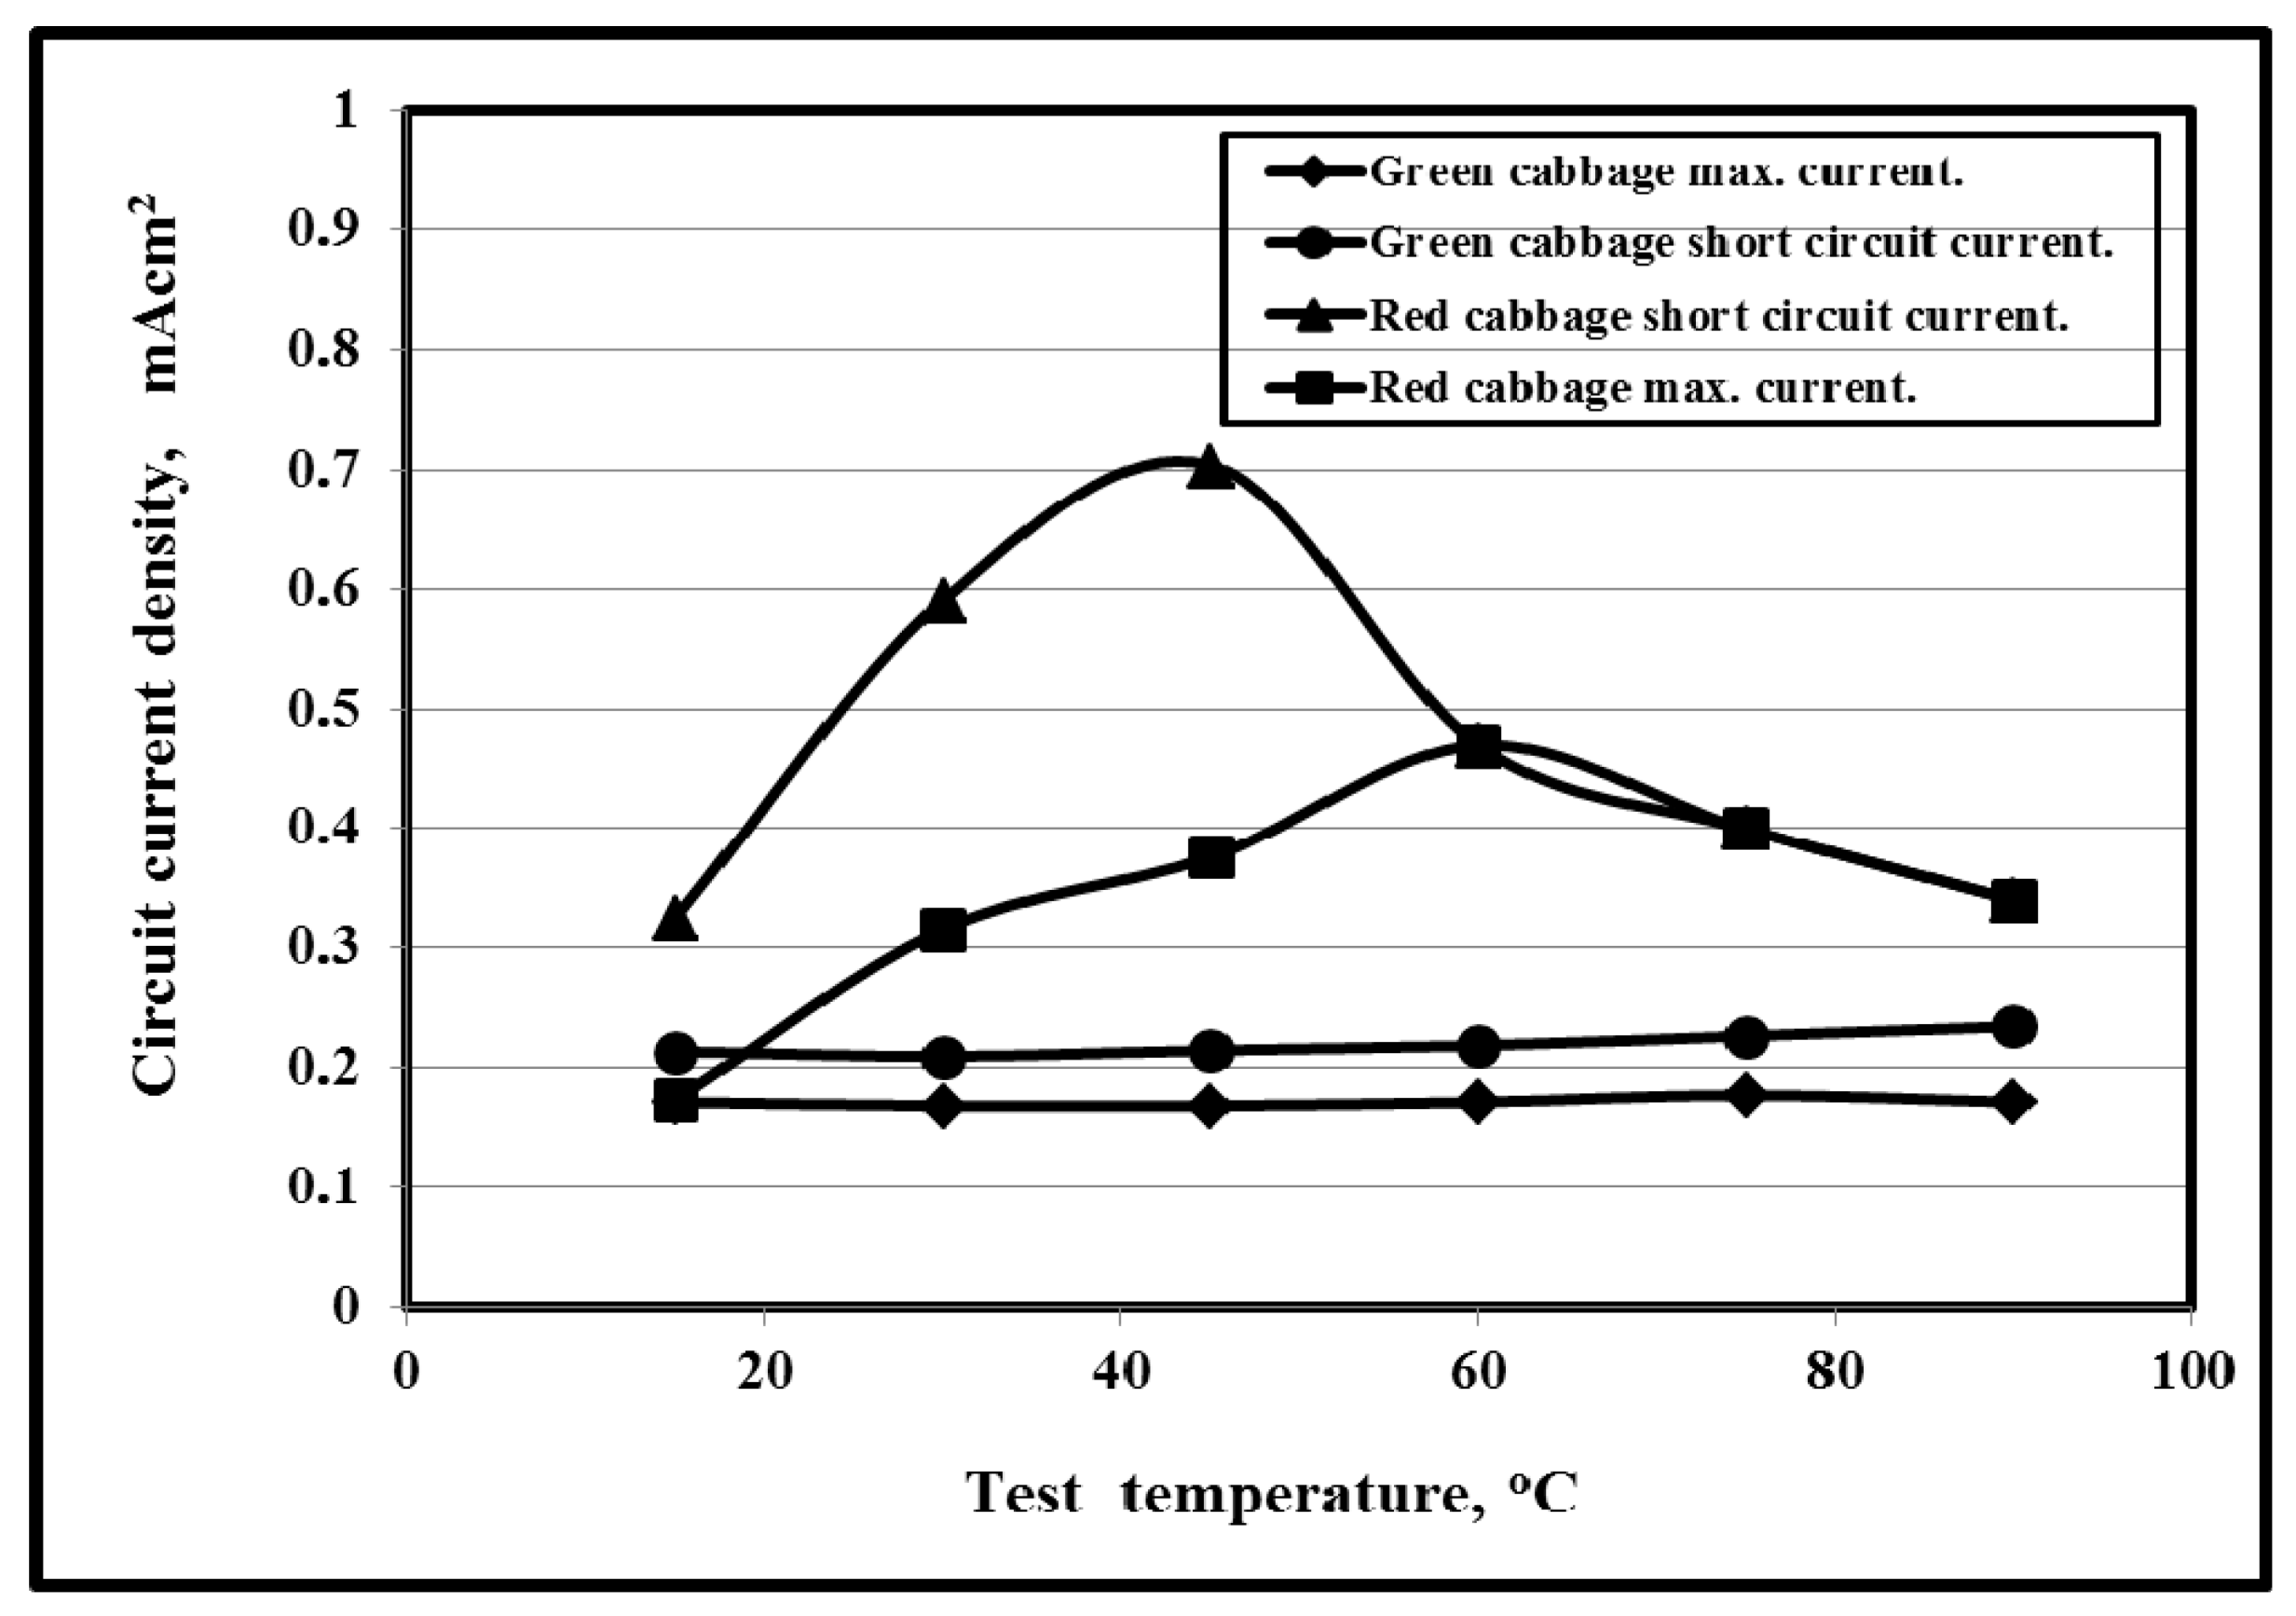
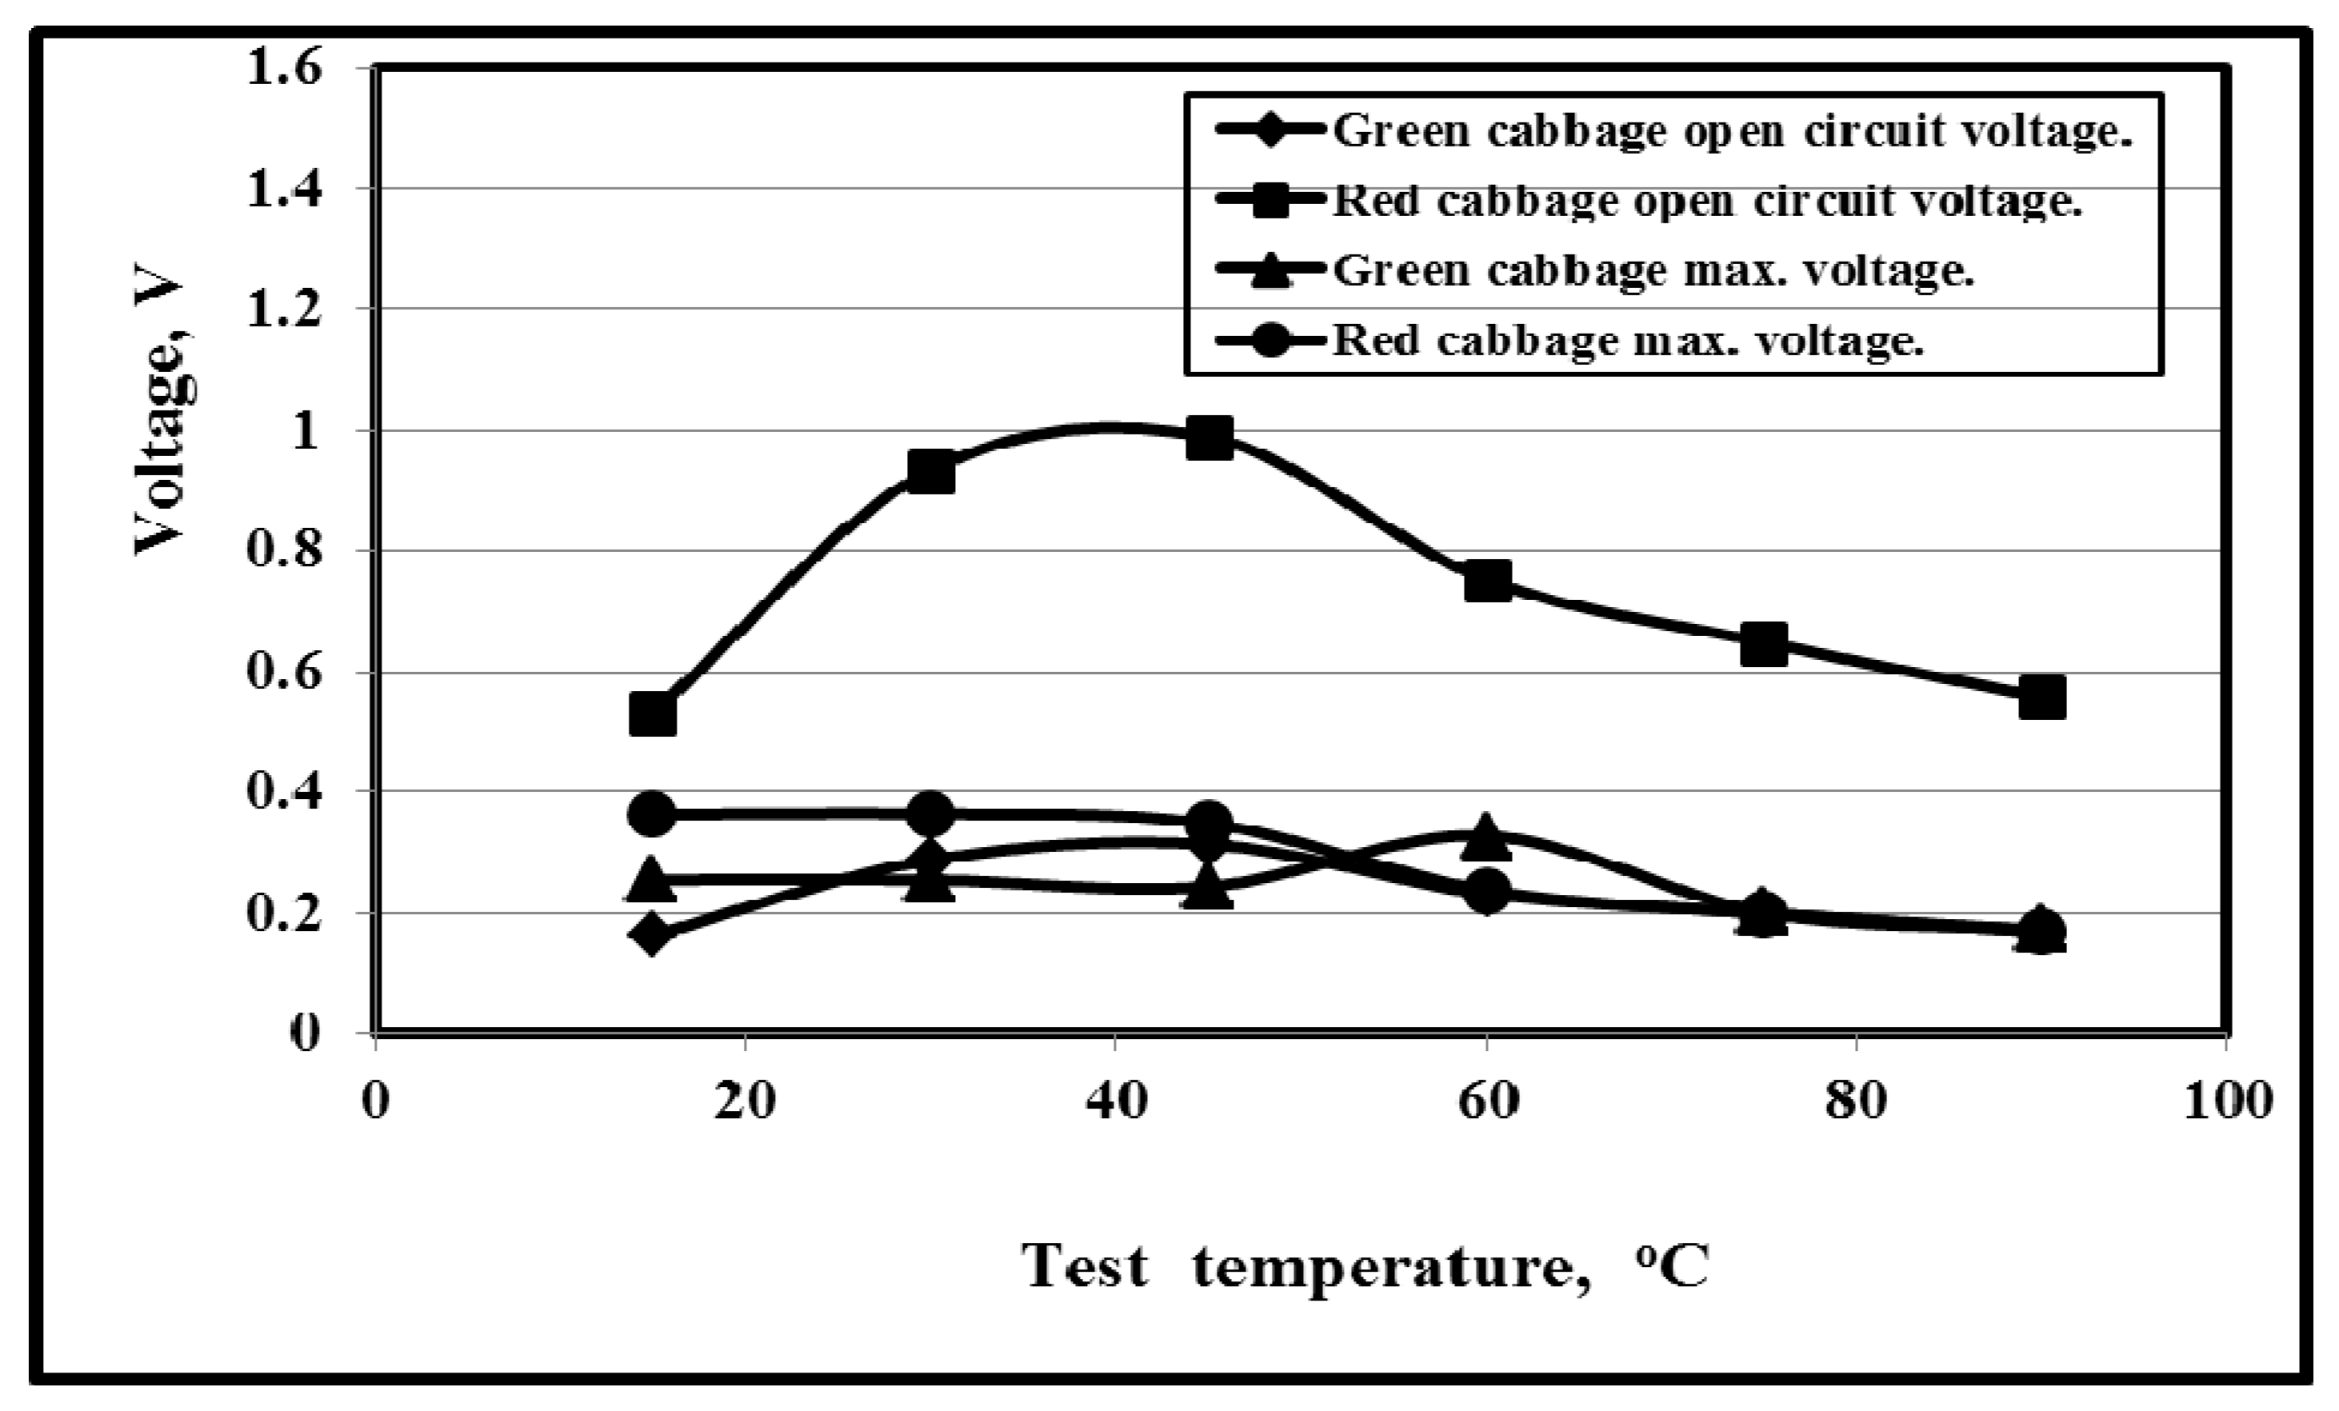
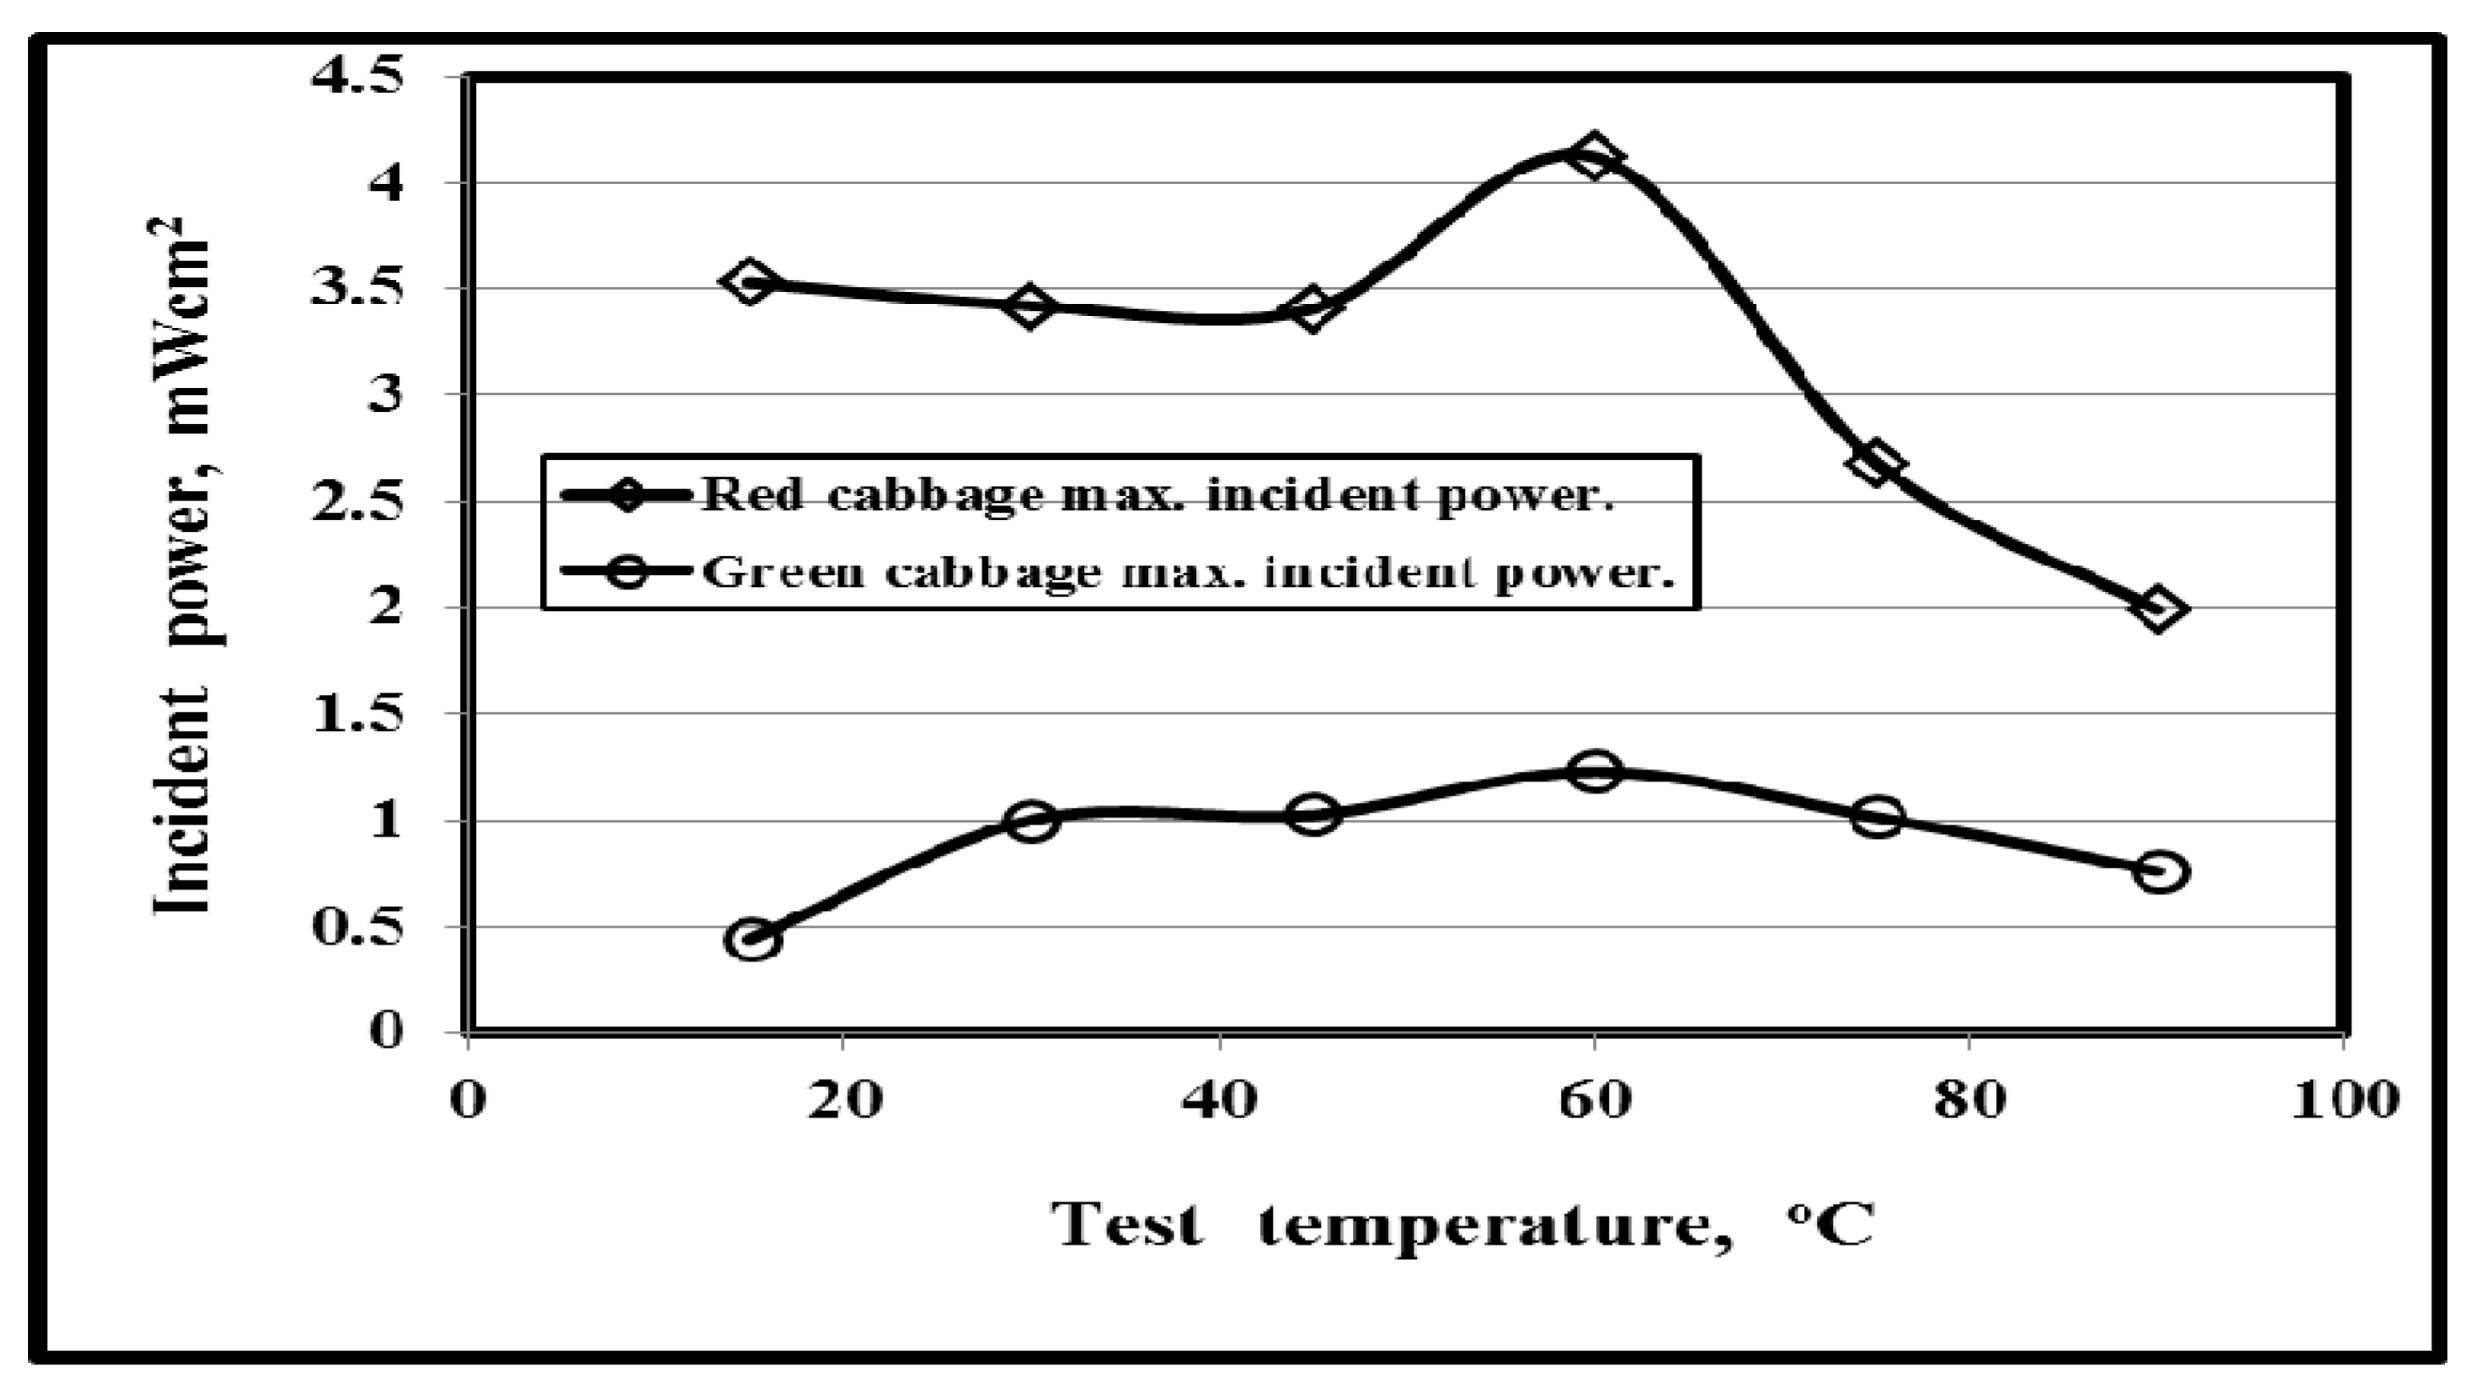
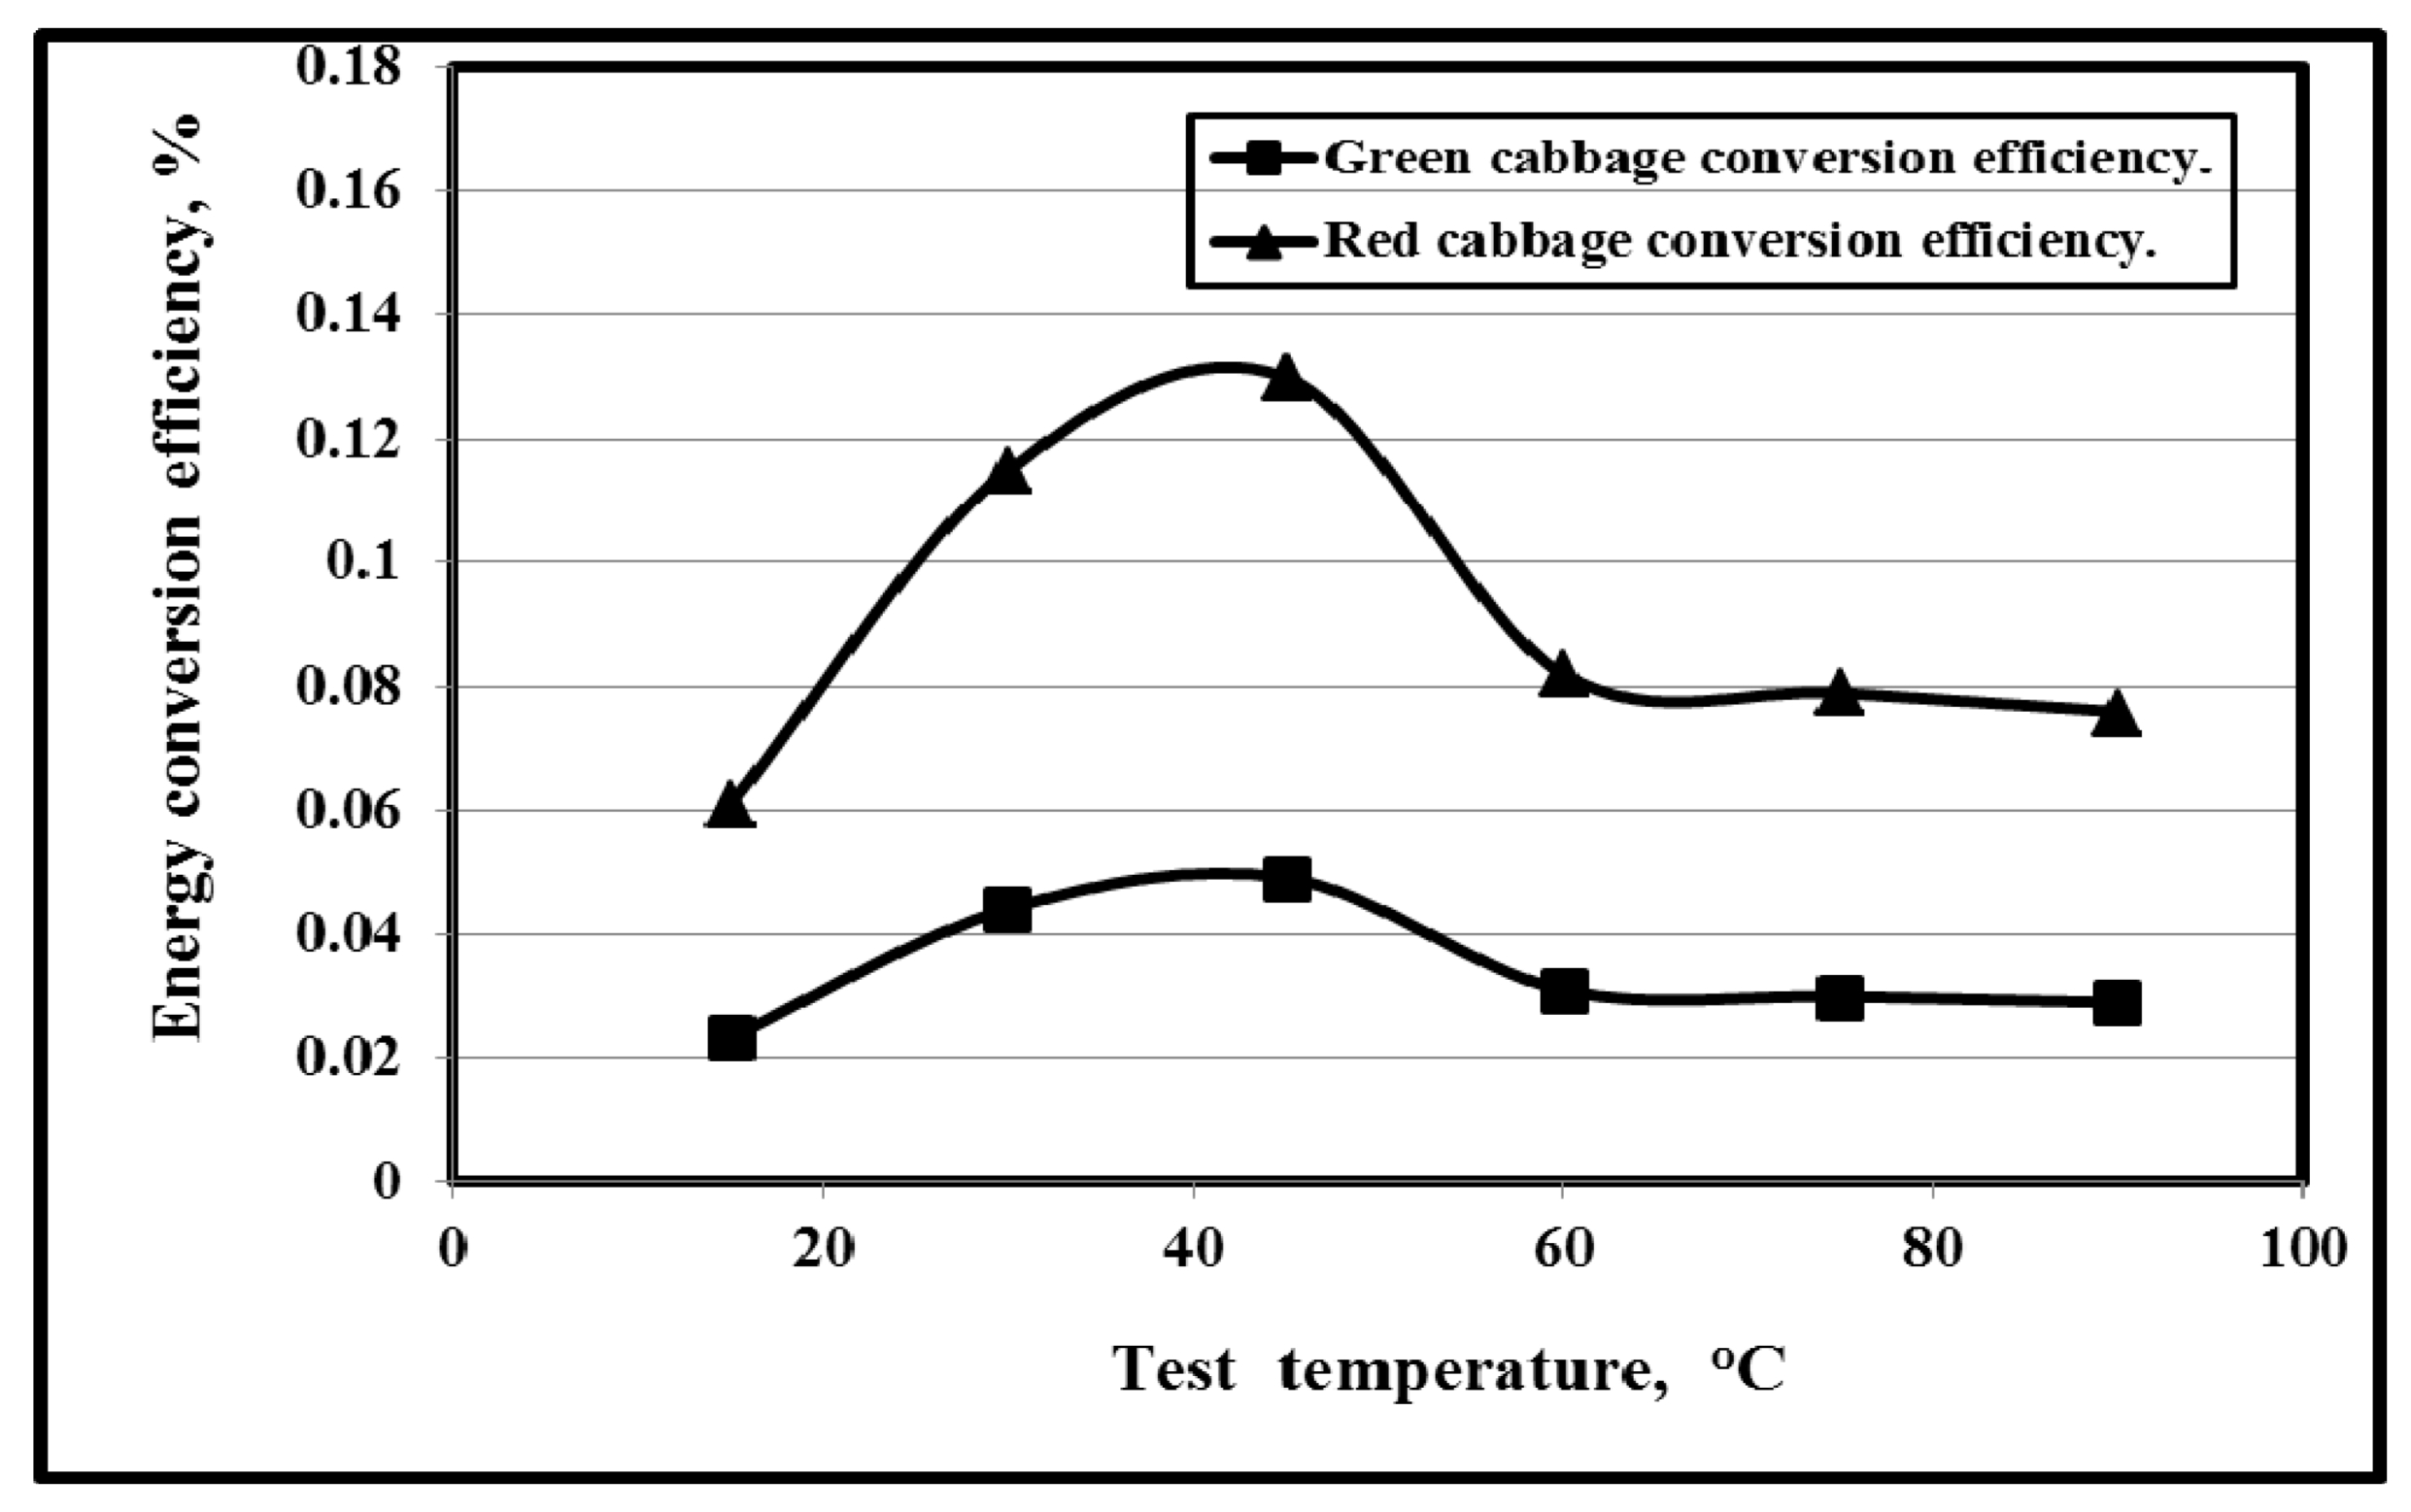
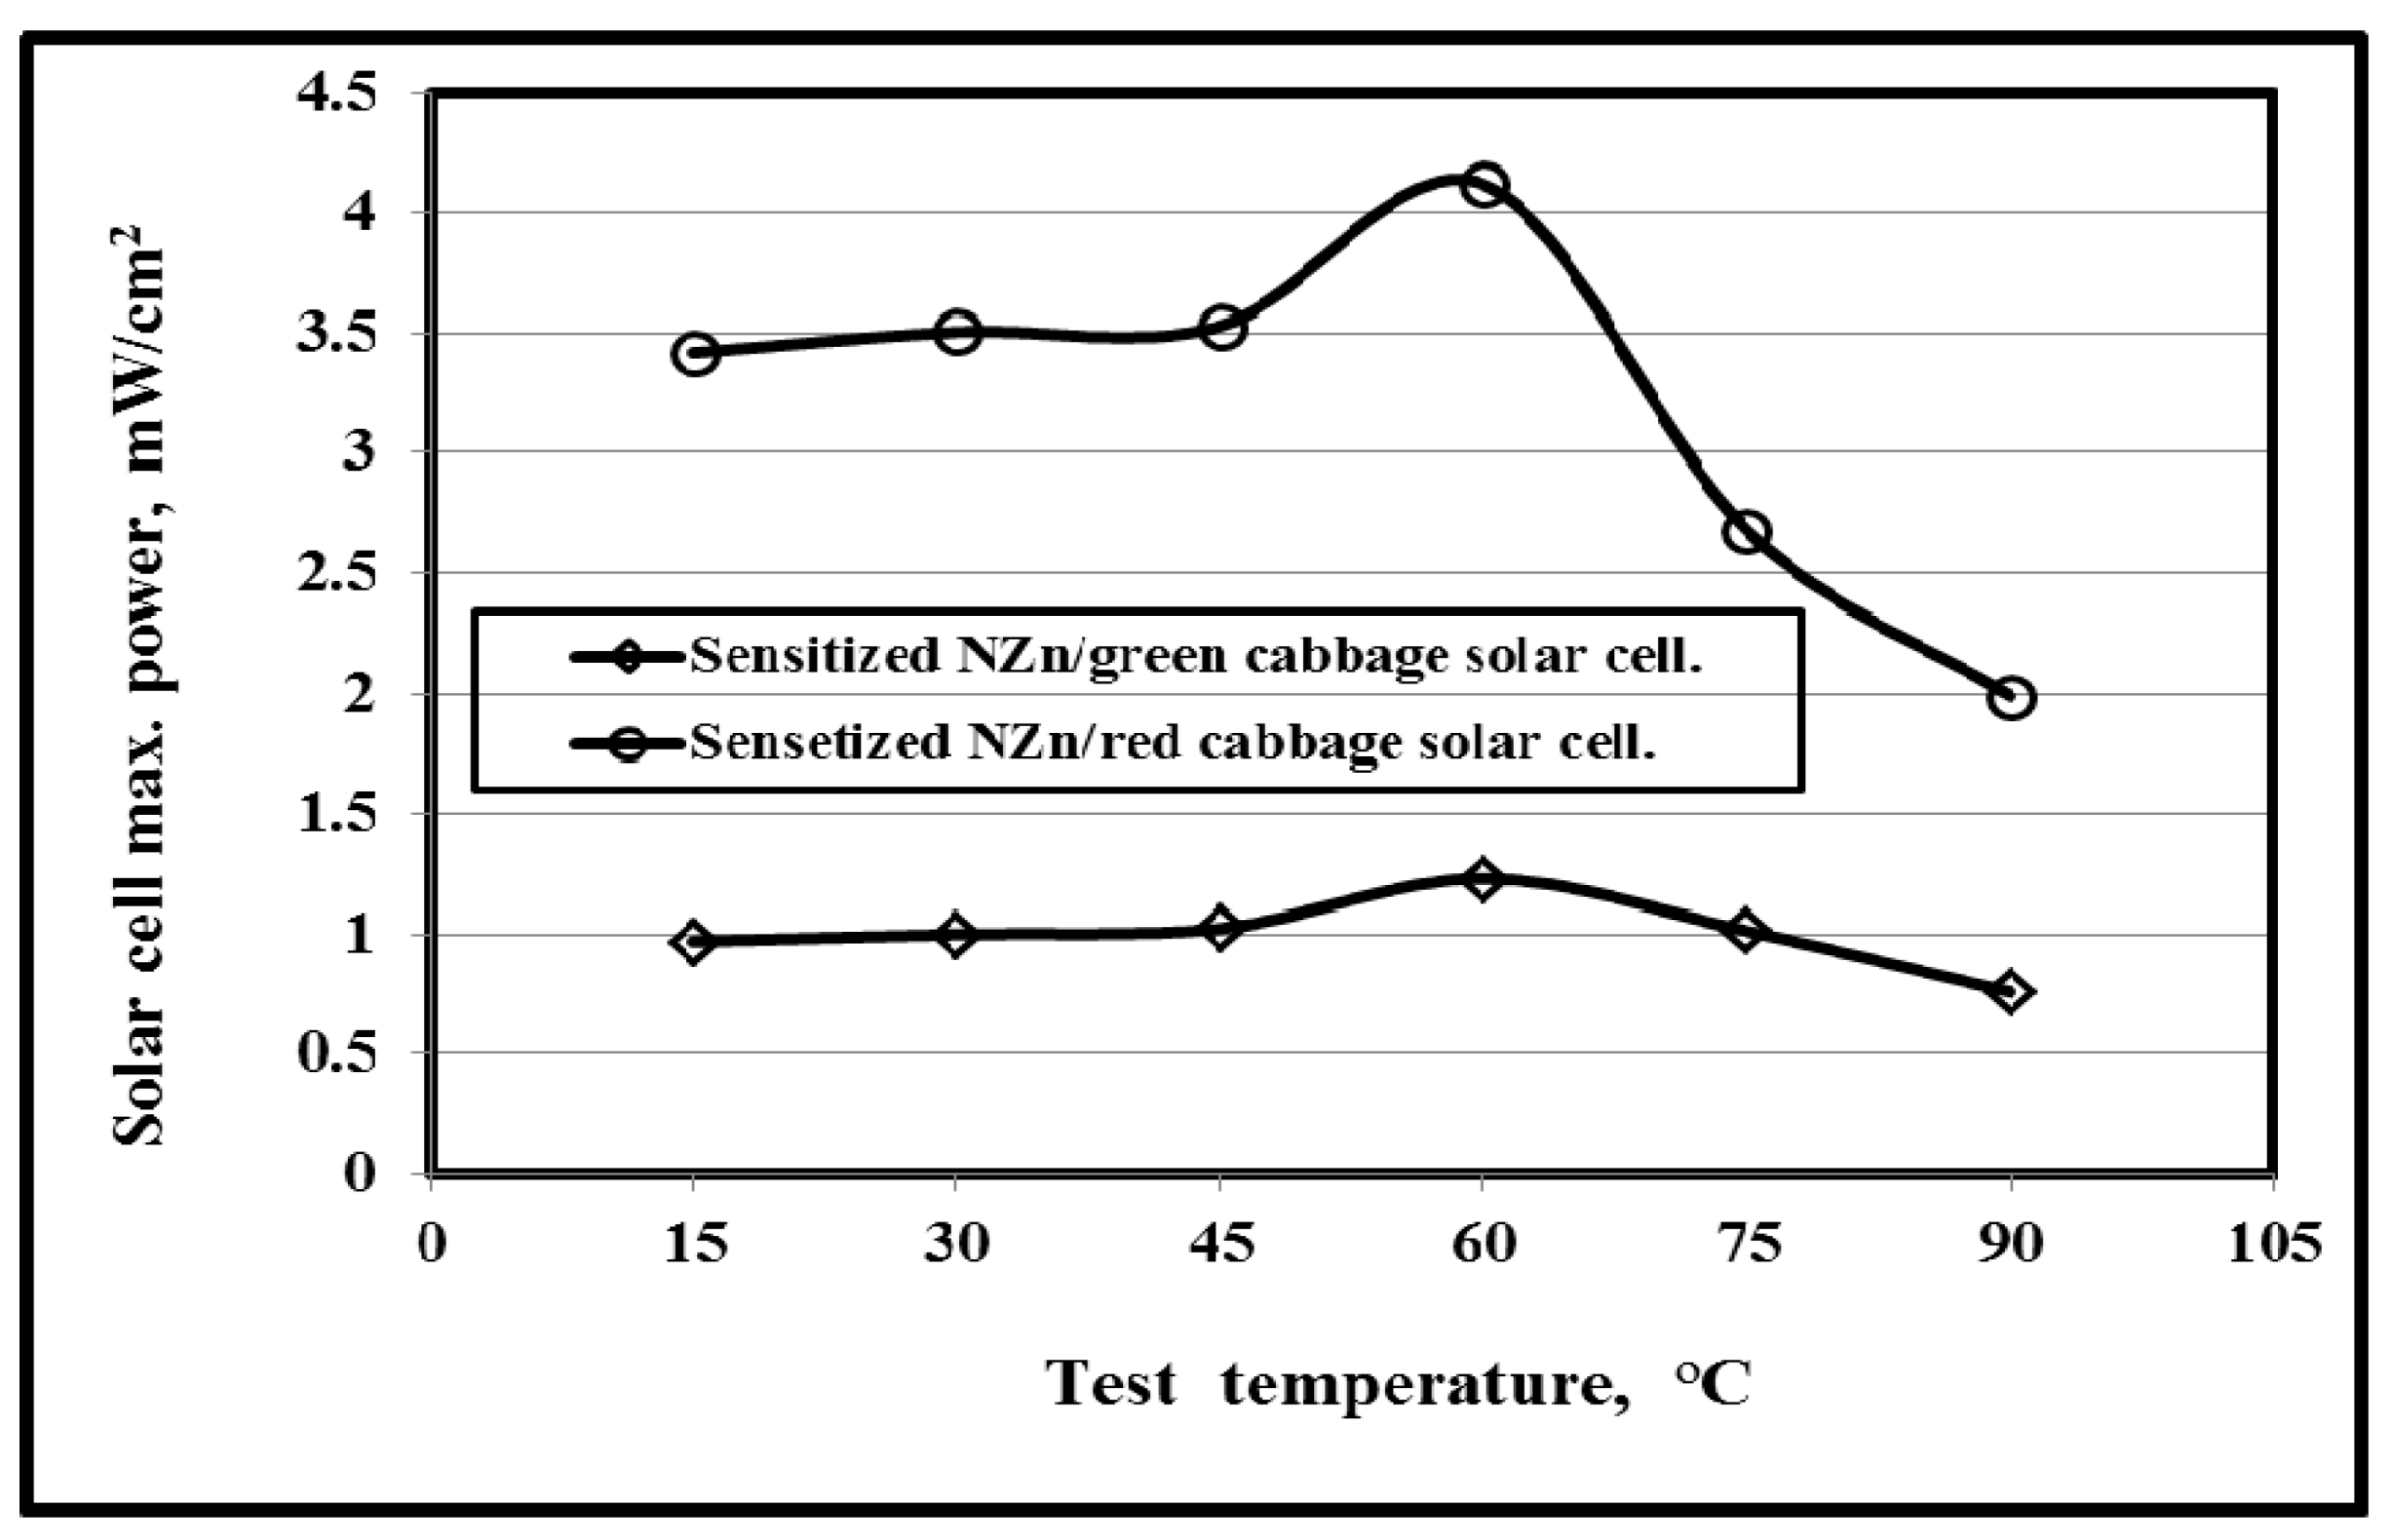
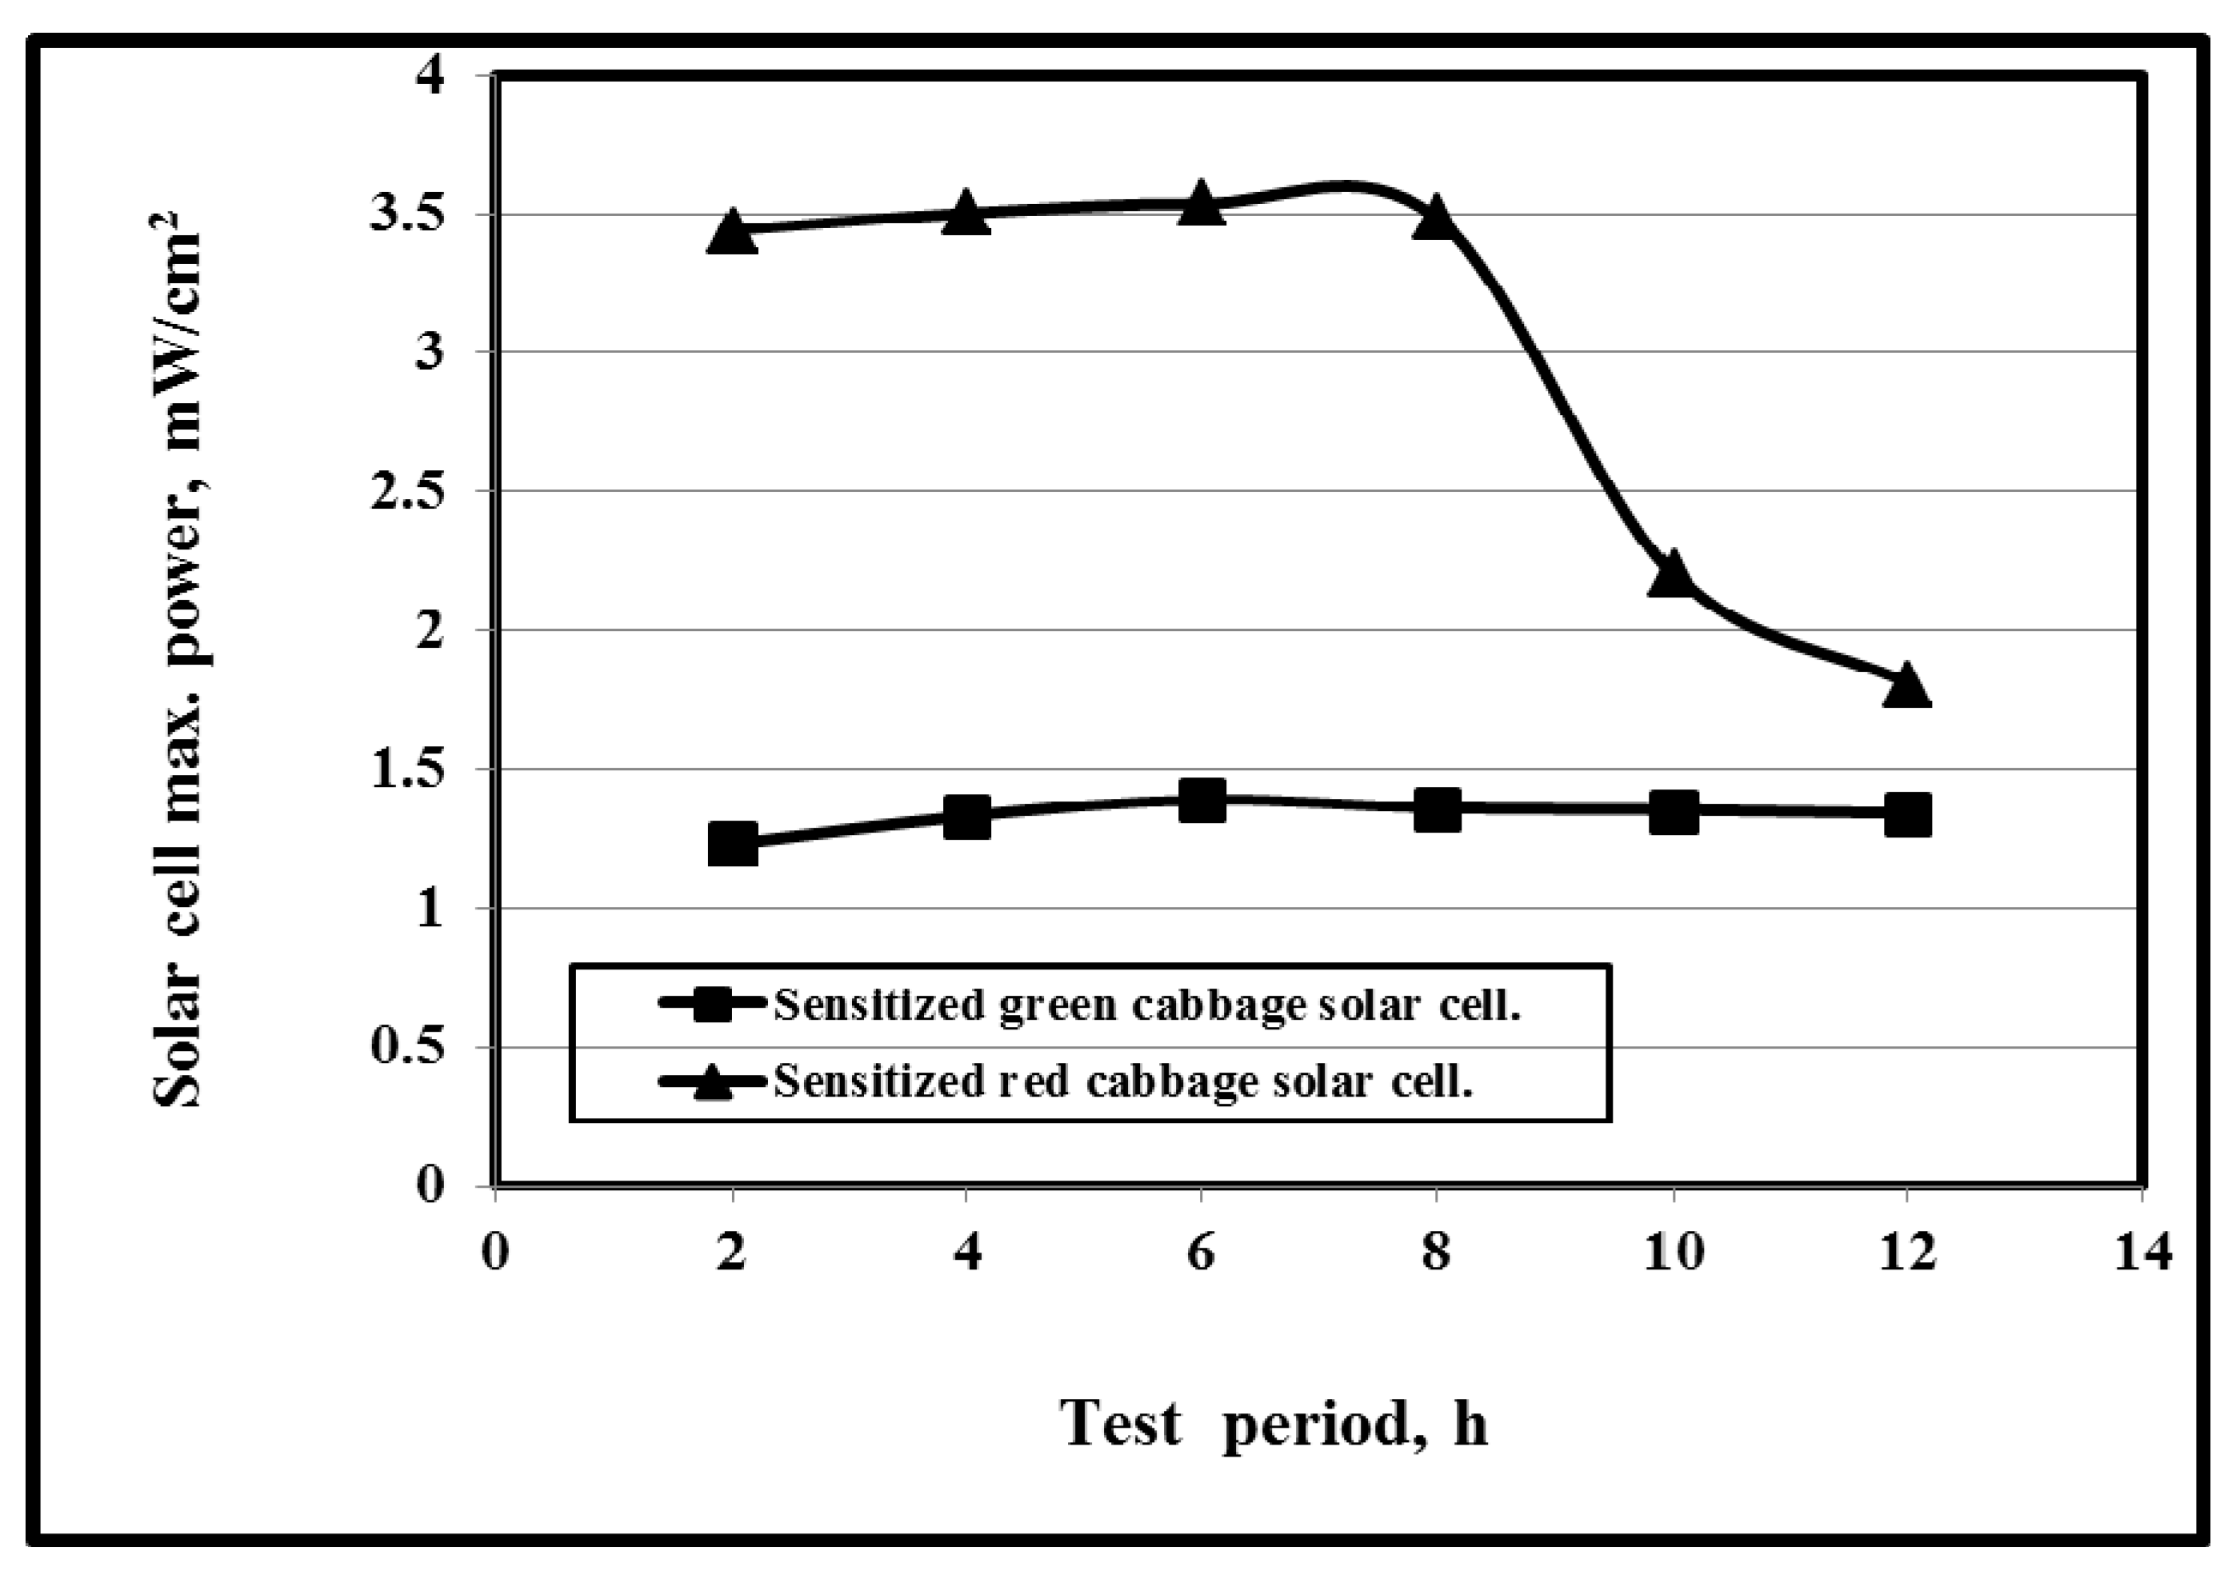
3.7. Effect of Test Temeratures and Periods on the Photovolatic Properties of GC and RC Solar Cells

The effects of temperature on both the short and open circuit current densities and the voltages of the RC and GC-based cells are shown in Figure 10 and Figure 11, respectively. It is shown that the RC-based cells’ short and maximum circuit current and open-circuit voltage trends are higher than those of the GC-based cells. This is attributed to the strong bonds between the dye and ZnO molecules through which electrons can be transported from the excited dye molecules to the nano ZnO film, which is opposite to the results reported in [16]. Also, the lower trends of the GC-based cells are due to the reduced stability of chlorophyll at higher temperatures, in agreement with previously reported results [66].
The relationships between circuit current density and voltage as functions of test periods and temperature are shown in Figure 12 and Figure 13 for the RC and GC-based solar cells. For both test periods and temperatures, the GC-based cells’ maximum current trends were higher than those of the RC-based cells. This was due to the presence of larger amount of the green matter necessary for photosynthesis in green cabbage than in red cabbage, which is in agreement with the results in previous reports [68].
The relations between the solar cell temperature, incident power, and the conversion energy efficiency are shown in Figure 14 and Figure 15. Although the incident power for the GC-based cells was higher than that of the RC-based cells, the energy conversion efficiency for the RC-based cells was higher, owing to the weak bonds between the dye and the nano-ZnO molecules in the GC-based cells, meaning the electrons could not be as readily transported from the excited dye molecules to the nano ZnO film [69].
The maximum power variations of the solar cells as functions of temperature and test periods are shown in Figure 15 and Figure 16. It is clear that the RC trends lie at higher values than the GC trends in both cases. This is because the RC carboxylic compounds exhibit a better anchoring between the dye and the nano ZnO surface, with an efficient dye regeneration indicating that the interaction between the sensitiser and the nano ZnO film is significant in enhancing the energy conversion efficiency of DSSCs. This is in agreement with the results reported previously [70]. Therefore, the DSSCs made from RC have fewer parasitic losses than the other tested cells, and can be considered as good-quality cells. Figure 15 and Figure 16 also show that the maximum solar cell power can be obtained at a temperature of 60 °C and a test period of 8 h for both RC and GC, which is in agreement with the results of the previous investigations [71,72].
In the present work: the measured values of maximum power (Pm), fill factor (FF), and efficiency (η) were 1.36 mW/cm2, 92.34%, and 0.161% for RC, and 0.349 mW/cm2, 44.19%, and 0.095% for GC, respectively (Figure 17). By comparison, Amadi et al. [72] produced the green cabbage’s greatest photoelectric conversion efficiency (η) at up to 0.1%, an open-circuit voltage (VOC) of 532 mV, and a short-circuit current density (Jsc) of 1.2 mA/cm2. Meanwhile, Pratiwi et al. [34] achieved a conversion efficiency of 0.024%, while the DSSC by combination dyes achieved a conversion efficiency of 0.054% by anthocyanin dye of red cabbage. Hamid et al. [39] found the efficiency of natural sensitisers for avocado peel, blueberry, and pomegranate to be 48.25 × 10./0%, 24.62 × 10./0%, and 15.75 × 10./0%, respectively. For natural dyes extracted from four different flowers, namely, Cassia surattensis, Cassia tora, Cassia alata, and Cassia occidentalis, Maurya et al. [44] found that: the short circuit current density (ISC) values ranged from 0.06 mA/cm2 to 0.20 mA/cm2; the open circuit voltage (VOC) varied from 0.292 V to 0.833 V; the fill factor (FF) from 0.7 to 0.9; and the efficiencies (η) from 0.013% to 0.15%.

4. Conclusions

Based on our findings, the following conclusions were obtained: (1) Red and green cabbage dyes are promising alternative sensitisers for DSSCs; (2) As the measured values of maximum power (Pm), fill factor (FF), and efficiency (η) were 1.36 mow/cm2, 92.34%, and 0.161% for RC, and 0.349 mow/cm2, 44.19%, and 0.095% for GC, respectively. Therefore, RC extract is better than GC extract as sensitiser for DSSCs; (3) Cyclic voltammetry and amperometry techniques can be used to analyse the spectrum absorption and power conversion of the prepared DSSCs; (4) Preparation of DSSCs using nanocrystalline ZnO and two local natural dyes extracted from red cabbage and green cabbage was feasible; (5) The test sensitisation temperatures and the test period had the most significant effect on the spectrum absorption at a temperature of 60 °C and a test period of 8 h; (6) The colour has the most marked effect on the light absorption; (7) The light absorption characteristics of both red cabbage and green cabbage exhibited a broad absorption with peak absorbances at 340 nm and 300 nm, respectively; and (8) The red cabbage and green cabbage extracts achieved solar energy conversion efficiencies of 0.161% and 0.082%, respectively, at a 60 °C extraction temperature and 8 h extraction time, which are higher than the values previously reported in the literature.

Funding

This work was supported by the Taif University Researchers Supporting Project grant number (TURSP-2020/266), of Taif University, Taif, Saudi Arabia.

Institutional Review Board Statement

The author confirms Institutional Review Board Statement.

Informed Consent Statement

The author confirms the Informed Consent Statement.

Data Availability Statement

The author confirms Data Availability Statement.

Conflicts of Interest

The author declares no conflict of interest.

References

  1. Aguilera, L.; Leyet, Y.; Peña-Garcia, R.; Padrón-Hernández, E.; Passos, R.R.; Pocrifka, L.A. Cabbage-like α-Ni(OH)2 with a good long-term cycling stability and high electrochemical performances for supercapacitor applications. Chem. Phys. Lett. 2017, 677, 75–79. [Google Scholar] [CrossRef]
  2. Kumar, A.; Richhariya, G.; Sharma, A.A. Energy sustainability through green energy; Sharma, S.A., Kar, S.K., Eds.; Springer: New Delhi, India, 2015; pp. 3–25. [Google Scholar] [CrossRef]
  3. Goodrich, A.; Hacke, P.; Wang, Q.; Sopori, B.; Margolis, R.; James, T.L.; Woodhouse, M. A wafer-based monocrystalline silicon photovoltaics road map: Utilizing known technology improvement opportunities for further reductions in manufacturing costs. Sol. Energy Mater. Sol. Cells 2013, 114, 110–135. [Google Scholar] [CrossRef]
  4. Tobnaghi, D.M.; Madatov, R.; Naderi, D. The effect of temperature on electrical parameters of solar cells. Int. J. Adv. Res. Elect. Electro Inst. Eng. 2013, 2, 6404–6411. [Google Scholar]
  5. Mingsukang, M.A.; Buraidah, M.H.; Arof, A.K. Third generation sensitized-solar cells. In Nanostructured Solar Cells; Das, N., Ed.; IntechOpen: London, UK, 2017; pp. 7–31. [Google Scholar] [CrossRef] [Green Version]
  6. Chang, H.; Kao, M.J.; Chen, T.L.; Chen, C.H.; Cho, K.C.; Lai, X.R. Characterization of natural dye extracted from wormwood and purple cabbage for dye-sensitized solar cells. Int. J. Photoenergy 2013, 159502, 1–9. [Google Scholar] [CrossRef]
  7. Ito, S.; Murakami, T.N.; Comte, P.; Liska, P.; Grätzel, C.; Nazeeruddin, M.K.; Grätzel, M. Fabrication of thin film dye sensitized solar cells with solar to electric power conversion efficiency over 10%. Thin Solid Films 2008, 516, 4613–4619. [Google Scholar] [CrossRef]
  8. Zheng, J.; Nagashima, K.; Parmiter, D.; de Cruz, J.; Patri, A.K.; McNeil, S. Methods in Molecular Biology; Humana Press: Totowa, NJ, USA, 2011; Volume 697, pp. 93–99. [Google Scholar] [CrossRef] [PubMed]
  9. Gómez-Ortíz, N.M.; Vázquez-Maldonado, I.A.; Pérez-Espadas, A.R.; Mena-Rejón, G.J.; Azamar-Barrios, J.A.; Oskam, G. Dye-sensitized solar cells with natural dyes extracted from achiote seeds. Sol. Energy Mater. Sol. Cells 2010, 94, 40–44. [Google Scholar] [CrossRef]
  10. Hardin, B.E.; Snaith, H.J.; McGehee, M.D. The renaissance of dye-sensitized solar cells. Nat. Photonics 2012, 6, 162–169. [Google Scholar] [CrossRef]
  11. Gomez, T.; Jaramillo, F.; Schott, E.; Perez, A.R.; Zarate, X. Simulation of natural dyes adsorbed on TiO2 for photovoltaic applications. Sol. Energy 2017, 142, 215–223. [Google Scholar] [CrossRef]
  12. Bai, Y.; Mora-Seró, I.; De Angelis, J.; Bisquert, P.; Wang, P. Titanium dioxide nanomaterials for photovoltaic applications. Chem. Rev. 2014, 114, 10095–10130. [Google Scholar] [CrossRef]
  13. Hagfeldt, A.; Boschloo, G.; Sun, L.; Kloo, L.; Pettersson, H. Dye-sensitized solar cells. Chem. Rev. 2010, 110, 6595–6663. [Google Scholar] [CrossRef]
  14. Nagata, T.; Murakami, H. Development of dye-sensitized solar cells. Ulvac Tech. J. 2009, 1–5. [Google Scholar]
  15. Zhou, H.; Wu, L.; Gao, Y.; Ma, T. Dye-sensitized solar cells using 20 natural dyes as sensitizers. J. Photochem. Photobiol. 2011, A219, 188–194. [Google Scholar] [CrossRef]
  16. Pham, H.D.; Do, T.T.; Kim, J.; Charbonneau, C.; Manzhos, S.; Feron, K.; Tsoi, W.C.; Durrant, J.R.; Jain, S.M.; Sonar, P. Molecular engineering using an anthanthrone dye for low-cost hole transport materials: A strategy for dopant-free, high-efficiency, and stable perovskite solar cells. Adv. Energy Mater. 2018, 8, 1703007. [Google Scholar] [CrossRef]
  17. Gokilamani, N.; Muthukumarasamy, N.; Thambidurai, M.; Ranjitha, A.; Velauthapillai, D. Utilization of natural anthocyanin pigments as photosensitizers for dye-sensitized solar cells. J. Sol-Gel Sci. Technol. 2013, 66, 212–219. [Google Scholar] [CrossRef]
  18. Krawczyk, S.; Zdyb, A. Electronic excited states of carotenoid dyes adsorbed on TiO2. Phys. Chem. 2011, C115, 22328–22335. [Google Scholar] [CrossRef]
  19. Wang, X.F.; Tamiaki, H.; Kitao, O.; Ikeuchi, T.; Sasaki, S. Molecular engineering on a chlorophyll derivative, chlorin e6, for significantly improved power conversion efficiency in dye-sensitized solar cells. J. Power Sources 2013, 242, 860–864. [Google Scholar] [CrossRef]
  20. Pratiwi, D.D.; Nurosyid, F.; Supriyanto, A.; Suryana, R.J. Optical properties of natural dyes on the dye-sensitized solar cells (DSSC) performance. J. Phys. Conf. Ser. 2016, 776, 1–6. [Google Scholar] [CrossRef]
  21. Sengupta, D.; Mondal, B.; Mukherjee, K. Visible light absorption and photo-sensitizing properties of spinach leaves and beetroot extracted natural dyes. Spectrochim. Acta Part A 2015, 148, 85–92. [Google Scholar] [CrossRef]
  22. Divya, C.; Janarthanan, B.; Chandrasekaran, J. Review on recent advances in titanium dye oxide nanoparticles for dye sensitized solar cell applications. Int. J. Adv. Res. 2017, 5, 76–85. [Google Scholar] [CrossRef] [Green Version]
  23. Vallejo, W.; Rueda, A.; D’az-Uribe, C.; Grande, C.; Quintana, P. Photocatalytic activity of graphene oxide–TiO2 thin films sensitized by natural dyes extracted from Bactris guineensis. Royal Soc. Open Sci. 2019, 6, 181824. [Google Scholar] [CrossRef] [PubMed] [Green Version]
  24. Harnchana, V.; Chaiyachad, S.; Pimanpang, S.P.; Saiyasombat, C.; Srepusharawoot, P.; Amornkitbamrung, V. Hierarchical Fe3O4-reduced graphene oxide nanocomposite grown on NaCl crystals for triiodide reduction in dye-sensitized solar cells. Sci. Rep. 2019, 9, 1–12. [Google Scholar] [CrossRef] [PubMed] [Green Version]
  25. Liu, F.; Hu, S.; Ding, X.; Zhu, J.; Wen, J.; Pan, X.; Chen, S.; Nazeeruddin, M.K.; Dai, S. Ligand-free nano-grain Cu2SnS3 as a potential cathode alternative for both cobalt and iodine redox electrolyte dye-sensitized solar cells. J. Mater. Chem. A 2016, 4, 14865–14876. [Google Scholar] [CrossRef]
  26. Sadasivuni, K.K.; Deshmukh, K.; Ahipa, T.N.; Muzaffar, A.; Ahamed, M.B.; Pasha, S.K.K.; Al-Maadeed, M.A.A. Flexible, biodegradable and recyclable solar cells: A review. Mater. Sci. Mater. Electron. 2019, 30, 951–974. [Google Scholar] [CrossRef]
  27. Bahman, H.; Gharanjig, K.; Rouhani, S. Environmentally friendly dye for dye-sensitized solar cells from roots and stems of Berberis vulgaris. Int. J. Environ. Sci. Technol. 2019, 16, 4019–4034. [Google Scholar] [CrossRef]
  28. Ahmad, I.; Kan, C. Visible-light-driven, dye-sensitized TiO2 photo-catalyst for self-cleaning cotton fabrics. Coatings 2017, 7, 192. [Google Scholar] [CrossRef] [Green Version]
  29. Liang, M.; Chen, J. Arylamine organic dyes for dye-sensitized solar cells. Chem. Soc. Rev. 2013, 42, 3453–3488. [Google Scholar] [CrossRef]
  30. Calogero, G.; Yum, J.H.; Sinopoli, A.; di Marco, G.D.; Grätzel, M.; Nazeeruddin, M.K. Anthocyanins and betalains as light-harvesting pigments for dye-sensitized solar cells. Sol. Energy 2012, 86, 1563–1575. [Google Scholar] [CrossRef]
  31. Salinas, M.; Ariza, M. Optimizing a simple natural dye production method for dye-sensitized solar cells: Examples for betalain (bougainvillea and beetroot extracts) and anthocyanin dyes. Appl. Sci. 2019, 9, 2515. [Google Scholar] [CrossRef] [Green Version]
  32. Narayan, M. Review: Dye sensitized solar cells based on natural photosensitizers. Renew. Sustain. Energy Rev. 2012, 16, 208–215. [Google Scholar] [CrossRef]
  33. Anbarasan, P.; Priyadharsini, C.; Sathiyapriya, R.; Hariharan, V.; Parabakaran, K.; Aroulmoji, V. Development of TiO2 nanomaterials and dyes selection (using dft) for dssc Applications—A stepwise review. Int. J. Adv. Sci. Eng. 2019, 6, 1326–1350. [Google Scholar] [CrossRef]
  34. Pratiwi, D.; Nurosyid, F.; Supriyanto, A.; Suryana, R. Efficiency enhancement of dye-sensitized solar cells (DSSC) by addition of synthetic dye into natural dye (anthocyanin). IOP Conf. Ser. Mater. Sci. Eng. 2017, 176, 1–7. [Google Scholar] [CrossRef] [Green Version]
  35. Sharma, K.; Sharma, V.; Sharma, S. Dye-sensitized solar cells: Fundamentals and current status. Nanoscale Res. Lett. 2018, 13, 2–46. [Google Scholar] [CrossRef]
  36. Muliani, L.; Nursam, N.; Hidayat, J. Performance of dye-sensitized solar cells based on gel electrolyte. Electron. Telekomun. 2013, 13, 14–17. [Google Scholar] [CrossRef] [Green Version]
  37. Prabavathy, N.; Shalini, S.; Balasundaraprabhu, R.; Velauthapillai, D.; Prasanna, S.; Muthukumarasamy, N. Enhancement in the photostability of natural dyes for dye-sensitized solar cell (DSSC) applications: A review. Int. J. Energy Res. 2017, 41, 1372–1396. [Google Scholar] [CrossRef]
  38. Krawczak, E. Dye photosensitizers and their influence on dssc efficiency: A review. IAPGOS 2019, 3, 86–90. [Google Scholar] [CrossRef]
  39. Hamid, N.; Suhaimi, S.; Yatim, N. Effect of natural dye sensitizers towards the improvement of dye-sensitized solar cell (DSSC) efficiency. AIP Conf. Proc. 2018, 1972, 030009. [Google Scholar] [CrossRef]
  40. Alami, A.H.; Faraj, M.; Aokal, K.; Hawili, A.A.; Tawalbeh, M.; Zhang, D. Investigating various permutations of copper iodide/fecu tandem materials as electrodes for dye-sensitized solar cells with a natural dye. Nanomaterials 2020, 10, 784. [Google Scholar] [CrossRef] [PubMed] [Green Version]
  41. Hosseinnezhad, M. Enhanced performance of dye-sensitized solar cells using perovskite/dsscs tandem design. J. Electron. Mater. 2019, 48, 5403–5408. [Google Scholar] [CrossRef]
  42. Shaikh, J.S.; Shaikh, N.S.; Mali, S.S.; Patil, J.V.; Pawar, K.K.; Kanjanaboos, P.; Hong, C.K.; Kim, J.H.; Patil, P.S. Nanoarchitectures in dye-sensitized solar cells: Metal oxides, oxide perovskites and carbon-based materials. Nanoscale 2018, 10, 4987–5034. [Google Scholar] [CrossRef] [PubMed]
  43. Kumar, R.; Sahajwalla, V.; Bhargava, P.B. Fabrication of a counter electrode for dye-sensitized solar cells (DSSCs) using a carbon material produced with the organic ligand 2-methyl-8-hydroxyquinolinol (Mq). Nanoscale Adv. 2019, 1, 3192–3199. [Google Scholar] [CrossRef] [Green Version]
  44. Maurya, I.C.; Singh, S.; Neetu; Gupta, A.K.; Srivastava, P.; Bahadur, L. Dye-sensitized solar cells employing extracts from four cassia flowers as natural sensitizers: Studies on dye ingredient effect on photovoltaic performance. J. Electron. Mater. 2018, 47, 225–232. [Google Scholar] [CrossRef]
  45. Ruhane, T.; Islam, M.T.; Rahaman, S.; Bhuiyan, M.M.H.; Islam, J.M.M.; Newaz, M.K.; Khan, K.A.; Khan, M.A. Photo current enhancement of natural dye sensitized solar cell by optimizing dye extraction and its loading period. Optic 2017, 149, 174–183. [Google Scholar] [CrossRef]
  46. Bandy, J.; Zhang, Q.; Cao, G. Electrophoretic deposition of titanium oxide nanoparticle films for dye-sensitized solar cell applications. Mater. Sci. Appl. 2011, 2, 1427–1431. [Google Scholar] [CrossRef] [Green Version]
  47. Kotta, A.; Ansari, S.; Parveen, N.; Fouad, H. Mechanochemical synthesis of melamine doped TiO2 nanoparticles for dye sensitized solar cells application. J. Mater. Sci. Mater. Electron. 2018, 29, 9108–9116. [Google Scholar] [CrossRef]
  48. Licklederer, M.; Cha, G.; Hahn, R.; Schmuki, P. Ordered nanotubular titanium disulfide (tis2) structures: Synthesis and use as counter electrodes in dye sensitized solar cells (DSSCs). J. Electrochem. Soc. 2019, 166, H3009–H3013. [Google Scholar] [CrossRef]
  49. Selvaraj, P.; Baig, H.; Mallick, T.K.; Siviter, J.; Montecucco, A.; Li, W.; Paul, M.; Sweet, T.; Gao, M.; Knox, A.R.; et al. Enhancing the efficiency of transparent dye-sensitized solar cells using concentrated light. Sol. Energy Mater. Sol. Cells. 2018, 175, 29–34. [Google Scholar] [CrossRef]
  50. Desai, M.A.; Vyas, A.N.; Saratale, G.D.; Sartale, S.D. Zinc oxide superstructures: Recent synthesis approaches and application for hydrogen production via photoelectrochemical water splitting. Int. J. Hydr. Energy 2018, 5, 1–37. [Google Scholar] [CrossRef]
  51. Le, C.H.; Nguyen, O.T.T.; Nguyen, H.S.; Pham, L.D.; Hoang, C.V. Controllable synthesis and visible-active photocatalytic properties of Au nanoparticles decorated urchin-like ZnO nanostructures. Curr. Appl. Phys. 2017, 17, 1506–1512. [Google Scholar] [CrossRef]
  52. Habibi, M.; Mikha, M.; Zendehdel, M.; Habibi, M. Influence of nanostructured zinc titanate, zinc oxide or titanium dioxide thin film coated on fluorine doped tin oxide as working electrodes for dye-sensitized solar cell. Int. J. Electrochem. Sci. 2012, 7, 6787–6798. [Google Scholar]
  53. Solano, R.; O-Ruiz, D.; Herrera, A. Preparation of modified paints with nano-structured additives and its potential applications. Nanomater. Nanotechnol. 2020, 10, 184798042090918. [Google Scholar] [CrossRef]
  54. Susanti, E.; Wicaksana, S. Potential of purple cabbage (brassica oleracea var. capitata f.) and duwet fruit (eugenia cumini) as sensitizers in dye sensitized solar cell (DSSC). IOP Conf. Ser. Mater. Sci. Eng. 2019, 546, 072008. [Google Scholar] [CrossRef]
  55. Zhou, W.; Yang, H.; Fang, Z. A novel model for photovoltaic array performance prediction. Appl. Energy 2007, 84, 1187–1198. [Google Scholar] [CrossRef]
  56. Mbonyiryivuze, A.; Omollo, I.; Ngom, B.D.; Mwakikunga, B.; Dhlamini, S.M.; Park, E.; Maaza, M. Natural dye sensitizer for grätzel cells: Sepia Melanin. Phys. Mater. Chem. 2015, 3, 1–6. [Google Scholar]
  57. Roxy, M.S.; Ananthu, A.; Sumithranand, V.B. Synthesis and characterization of undoped and magnesium doped zinc oxide nanoparticles. Int. J. Sci. Res. Sci. Eng. Technol. 2021, 8, 134–139. [Google Scholar]
  58. Saleh, H. Dye-sensitized solar cell using natural vegetable dyes based on anatase phase. Aust. J. Basic Appl. Sci. 2018, 12, 17–23. [Google Scholar]
  59. Saleh, H. Synthesis and characterization of nano zinc oxide by using red cabbage (Brassica Oleraceae) Extract. Int. Res. J. Innov. Eng. Technol. 2019, 3, 36–42. [Google Scholar]
  60. Anzlovar, A.; Orel, Z.; Kogej, K.; Zigon, M.J. Synthesis, properties, and applications of polymeric nanocomposites. J. Nanomater. 2012, 2012, 1–9. [Google Scholar] [CrossRef] [Green Version]
  61. Listyanda, R.F.; Wildan, M.W.; Ilman, M.N. Preparation and characterization of cellulose nanocrystal extracted from ramie fibers by sulfuric acid hydrolysis. Heliyon 2020, 6, e05486. [Google Scholar] [CrossRef]
  62. Chen, Y.W.; Tan, T.H.; Lee, H.V.; Hamid, S.B.A. Easy fabrication of highly thermal-stable cellulose nanocrystals using cr(no3)3 catalytic hydrolysis system: A feasibility study from macroto nano-dimensions. Materials 2017, 10, 42. [Google Scholar] [CrossRef]
  63. Sangeetha, V.H.; Varghese, T.O.; Nayak, S.K. Isolation and characterisation of nanofibrillated cellulose from waste cotton: Effects on thermo -mechanical properties of polylactic acid/MA-g-SEBS blends. Iranian Polym. J. 2019, 28, 673–683. [Google Scholar] [CrossRef]
  64. Pal, K.; Mohan, M.L.N.M.; Zhana, B.; Wang, G. Design, synthesis and application of hydrogen bonded smectic liquid crystal matrix encapsulated ZnO nanospikes. J. Mater. Chem. C 2015, 3, 11907–11917. [Google Scholar] [CrossRef]
  65. Hoyle, C.H.V.; Santos, J.H. Cyclic voltammetric analysis of antioxidant activity in citrus fruits from Southeast Asia. Int. Food Res. J. 2010, 17, 937–946. [Google Scholar]
  66. Çeşme, M.; Eskalen, H. Green synthesis of carbon quantum dots from sumac: Characterization and investigation with cyclic voltammetry technique. Cumhuriyet Sci. J. 2020, 41, 808–814. [Google Scholar] [CrossRef]
  67. Tang, W.; Wu, J. Amperometric determination of organophosphorus pesticide by silver electrode using an acetylcholinesterase inhibition method. Anal. Methods 2014, 6, 924–929. [Google Scholar] [CrossRef]
  68. Pamain, A.; Pogrebnaya, T.; King’ondu, C.K. NATURAL dyes for solar cell application: Uv-visible spectra and outdoor photovoltaic performance. Res. J. Eng. Appl. Sci. 2014, 3, 332–336. [Google Scholar]
  69. Dawoud, A.M.S. Natural pigments extracted from plant leaves as photosensitizers for dye-sensitized solar cells. Thesis, Islamic University of Gaza, Gaza City, Gaza. 2016. Available online: https://iugspace.iugaza.edu.ps/bitstream/handle/20.500.12358/21481/file_1.pdf?sequence=1 (accessed on 30 July 2021).
  70. Chang, H.; Wu, H.M.; Chen, T.L.; Huang, K.D.; Jwo, C.S.; Lo, Y.J. Dye-sensitized solar cell using natural dyes extracted from spinach and ipomoea. J. Alloys Compd. 2010, 495, 606–610. [Google Scholar] [CrossRef]
  71. Calogero, G.; Bartolotta, A.; di Marco, G.; di Carlo, A.; Bonaccorso, F. Vegetable-based dye-sensitized solar cells. Chem. Soc. Rev. 2015, 44, 3244–3294. [Google Scholar] [CrossRef]
  72. Amadi, L.; Jenny, S.S.; Ahmed, A.; Brown, N.; Yadav, S.; Brown, D.; Ghann, W.; Gayrama, A.; Jiru, M.; Uddin, J. Creation of natural dye sensitized solar cell by using nanostructured titanium oxide. Nanosci. Nanoeng. 2015, 3, 25–32. [Google Scholar] [CrossRef] [Green Version]
Figure 1. Current-voltage characteristics for solar cells, [35].
Coatings 11 01057 g001
Figure 2. Preparation of RC and GC sensitisers. (a) GC fine powder (b) RC fine powder (c) GC in in ethyl alcohol (d) RC in ethyl alcohol (e) GC and RC Natural Sensitizers.
Coatings 11 01057 g002
Figure 3. Assembling a Complete Dye-sensitised Solar Cell. (a) ZnO paste on FTO coated slide (b) FTO slide with carbon soot (c) ZnO coated slide placed over carbon slide and over cathode slide (d) Binder clips sandwiched anode coated slide (e) Testing the solar cell’s voltage using a multi-meter (f) Schematic drawing of a DSSC together with simplified electron transfer processes.
Coatings 11 01057 g003
Figure 4. (a) FT-IR spectrum of NZnO. (b) FT-IR spectrum of RC dye without NZnO. (c) FT-IR spectrum of RC dye with NZnO. (d) FT-IR spectrum of GC dye without NZnO. (e) FT-IR spectrum of GC dye with NZnO.
Coatings 11 01057 g004aCoatings 11 01057 g004b
Figure 5. Variation of visible absorbance with the wavelength for red and green cabbage dyes.
Coatings 11 01057 g005
Figure 6. SEM image of NZnO.
Coatings 11 01057 g006
Figure 7. EDS plot of NZnO.
Coatings 11 01057 g007
Figure 8. Cyclic voltammetry curves of GC and RC extracts. (a) Current/potential of RC extract (b) Current/potential of GC extract (c) higher reversibility and faster redox reactions of GC and RC extracts (d) Effect of scan rate increment on GC and RC extracts (e) Amperometric charge curves of GC and RC extracts (f) Amperometric discharge curves GC and RC extracts.
Coatings 11 01057 g008aCoatings 11 01057 g008b
Figure 9. J/V relation of Green cabbage and Red cabbage, (a) J/V GC, (b) J/V RC, and (c) J/V Rc and GC.
Coatings 11 01057 g009
Figure 10. Im and Isc/test period for RC and GC solar cells.
Coatings 11 01057 g010
Figure 11. Vm and Voc/ test period relation for RC and GC solar cells.
Coatings 11 01057 g011
Figure 12. Im and Isc/temp. relation for RC and GC solar cells.
Coatings 11 01057 g012
Figure 13. Vm and Voc/temp. relation for RC and GC solar cells.
Coatings 11 01057 g013
Figure 14. Incident power/temp. relation for RC and GC.
Coatings 11 01057 g014
Figure 15. Conversion η/temp. relation for RC and GC.
Coatings 11 01057 g015
Figure 16. Max. power/temp. relation for RC and GC.
Coatings 11 01057 g016
Figure 17. Max. power/test period relation for RC and GC.
Coatings 11 01057 g017
Table 1. GC and RC wave numbers and their functional groups.
Red CabbageGreen Cabbage
Without NZnOWith NZnOWithout NZnOWith NZnO
Wave number (cm−1)Functional groupWave number (cm−1)Functional groupWave number
(cm−1)
Functional groupWave number
(cm−1)
Functional group
3276.19OH stretching: NH stretching.3273.34OH stretching: NH stretching.3279.77OH stretching: NH stretching.3249.82OH stretching: NH stretching.
2924.87CH3 symmetric stretching2930.71CH3 symmetric stretching2919.98CH3 symmetric stretching2360.01–2142.79C=N Nitride group
1604.24C=C
stretching (non-conjugated)
1610.61C=C stretching
(non-conjugated)
2855.79CH2 symmetric stretching--
----1735.49C=O stretching
(esters)
1946.94C=O
stretching
(esters)
----1606.20C=C
stretching (non-conjugated)
1615.39C=C
stretching (non-conjugated
1400.86CH2 andCH3 symmetric deformation1404.24CH2 and
CH3 symmetric deformation
1405.53CH2 andCH3 symmetric deformation1414.67CH2 andCH3 symmetric deformation
1246.4PO2−1246.4PO2−1241.05PO21111.87C–O stretching (ether)
1021.25C–O stretching (ether)1019.05C–O stretching (ether)1018.32C–O stretching (ether)1023.60C–O stretching (ether)
770.08saccharides593.88-768.83saccharides956.14C=O bending
515.75-511.98-516.54-664.74-
------594.52–509.81-
Publisher’s Note: MDPI stays neutral with regard to jurisdictional claims in published maps and institutional affiliations.

