3.1. Variation of Carrier and Shielding Gas Flow
The carrier gas flow is used to transport the powder particles to the process zone where they interact with the laser beam and—after solidification—form the clad geometry. Regarding powder efficiency, as the share of powder that is melted by the laser beam, for example, may vary [
26,
27], pronounced attention has to be given to the interaction volume of laser and powder. Under the assumption that no powder is lost during transportation from the powder feeder to the nozzle and that friction losses along the transportation may be neglected, a change in carrier gas flow can be directly correlated with additional particle velocity at the nozzle outlet based on the continuity equation of fluid mechanics [
28].
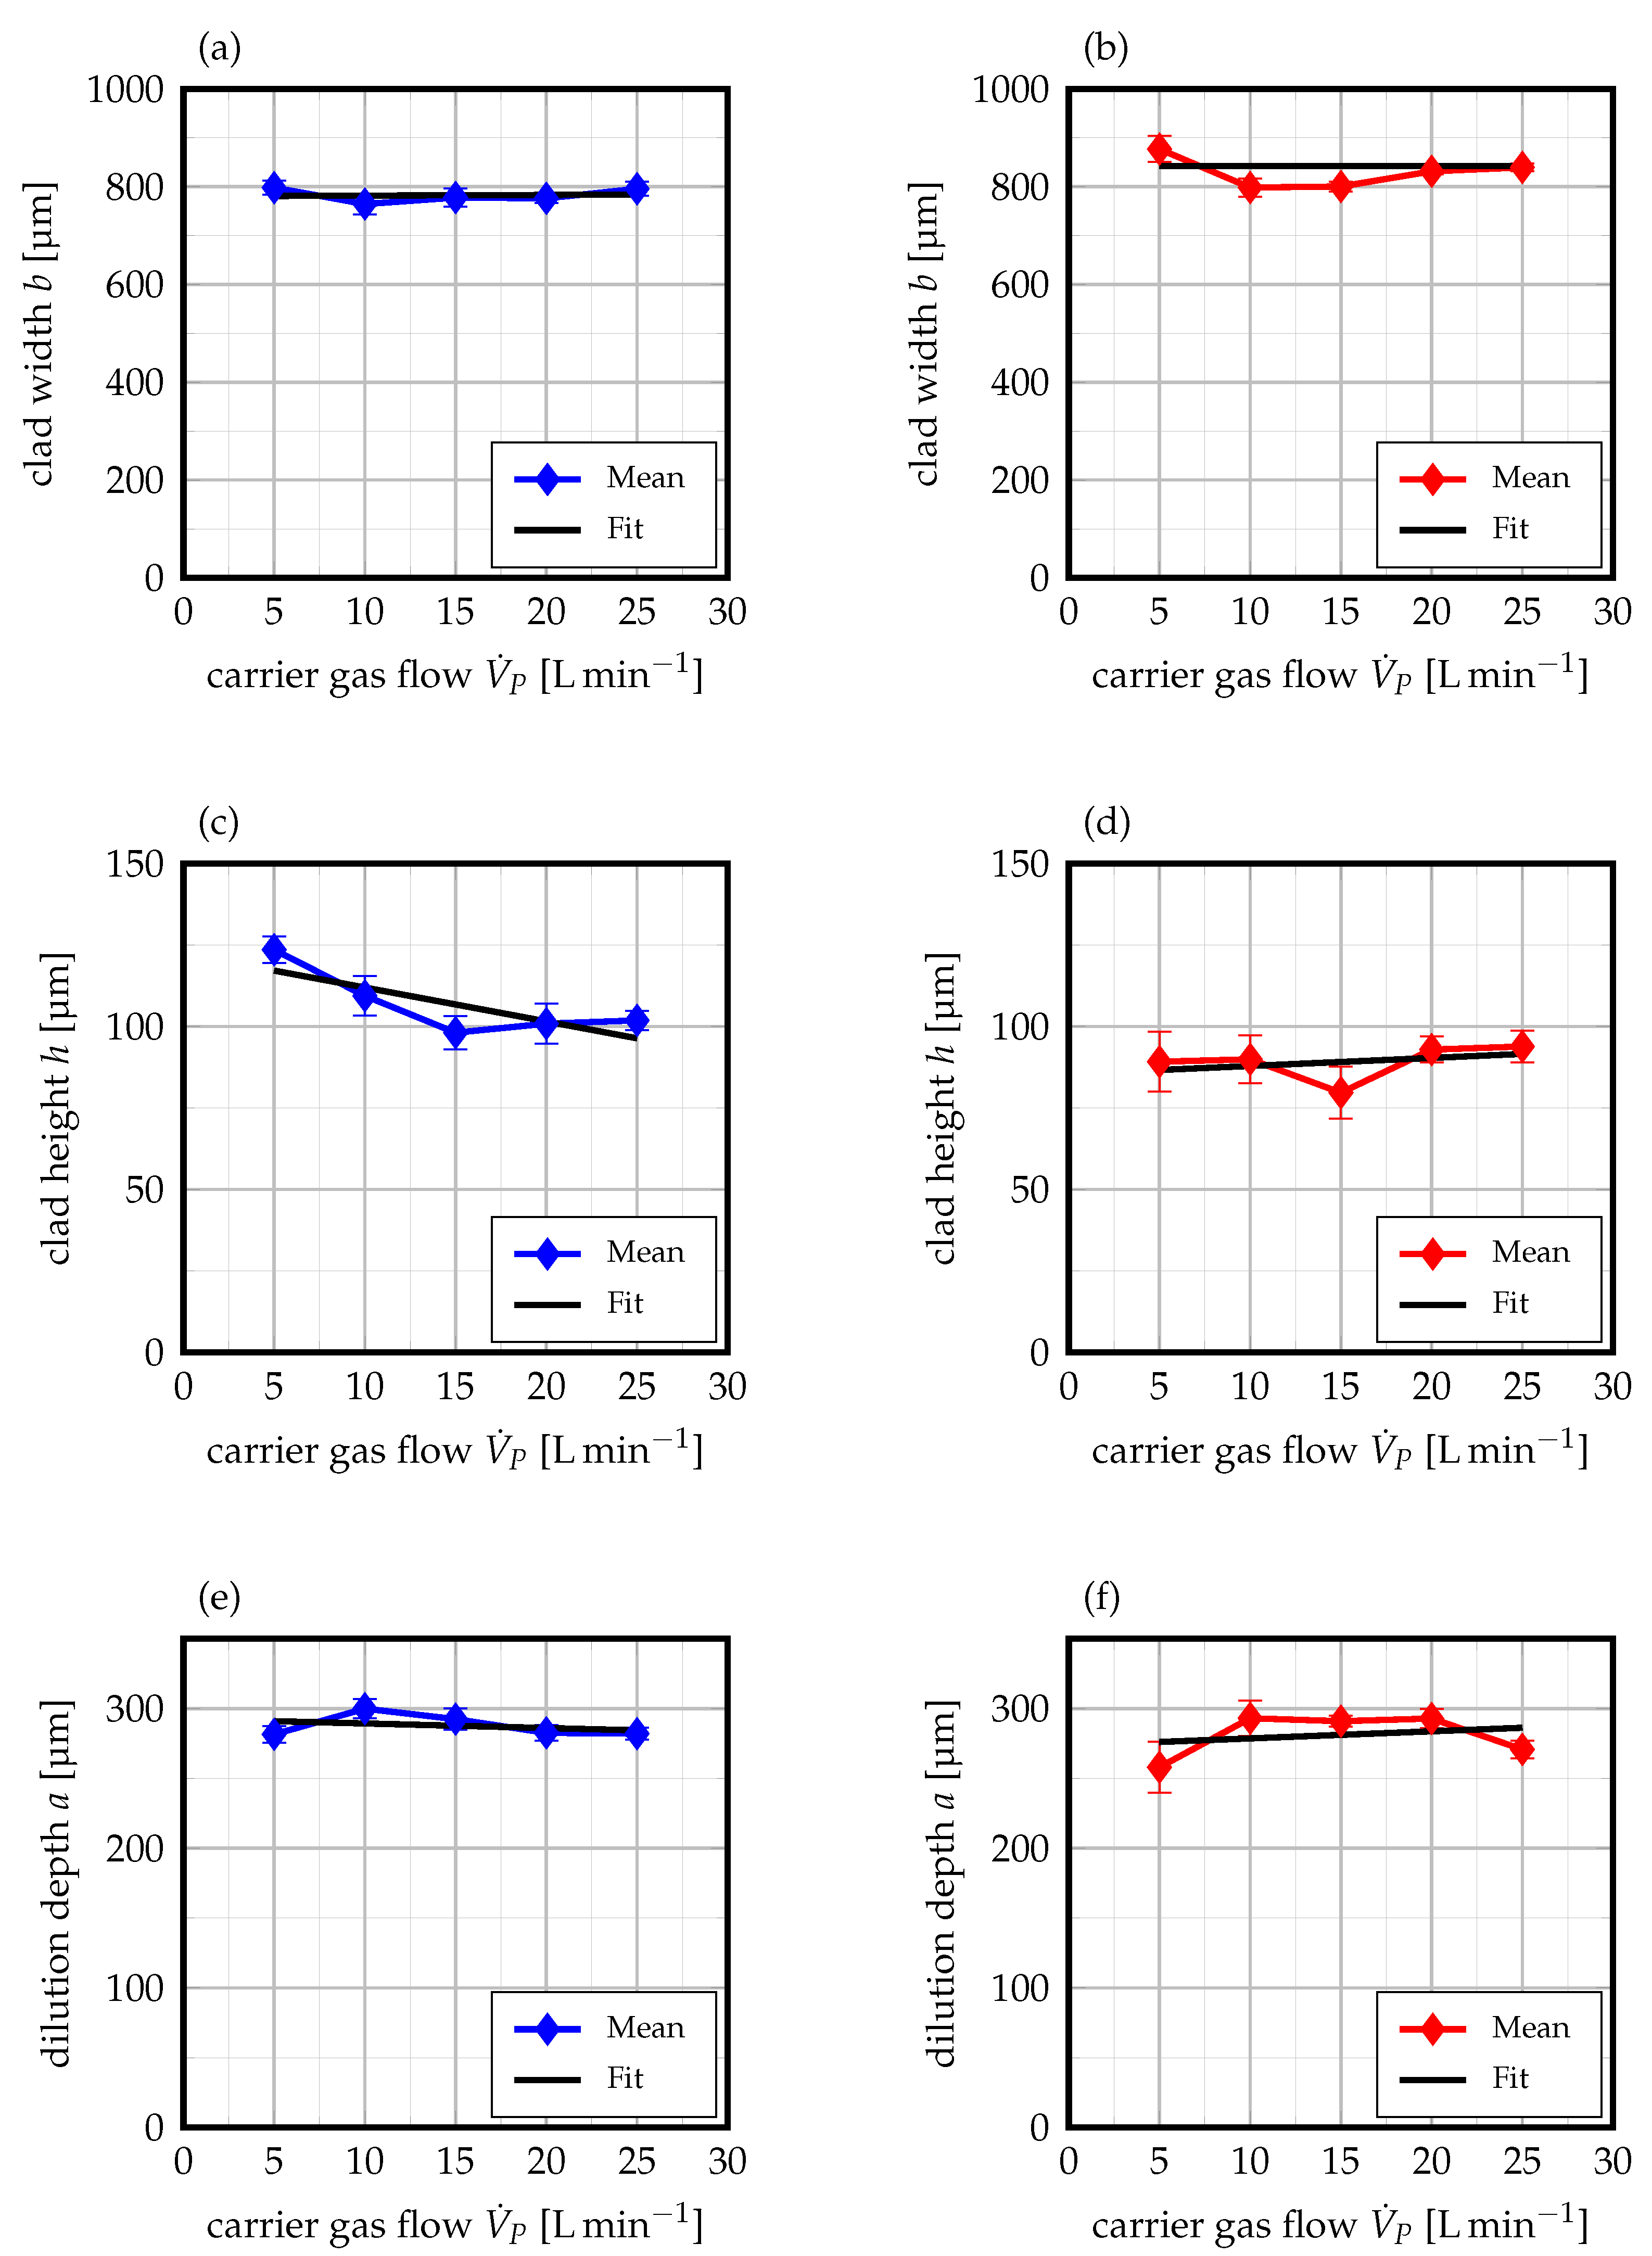
The results of studies on the influence of carrier gas flow are depicted in
Figure 3 and give an overview on the interdependencies of the latter and the clad geometry. The underlying experimental plan can be found in
Table A2.
Figure 3a,b demonstrate that the influence of carrier gas flow on clad width is negligible for a constant shielding gas flow, as both particle size distributions exhibit only minimal changes and an almost constant width along increasing carrier gas flow. Thus, it can also be concluded that the particle velocity at the nozzle outlet and, hence, the interaction time between the powder particle and laser beam only has a minimal influence on clad width. For both investigated particle size distributions, the clad width is represented by the laser beam diameter in good approximation, for which the laser beam diameter appears to be the relevant process parameter for clad widths, albeit changes in carrier gas flow.
This effect is constrained with regard to clad height (cf.
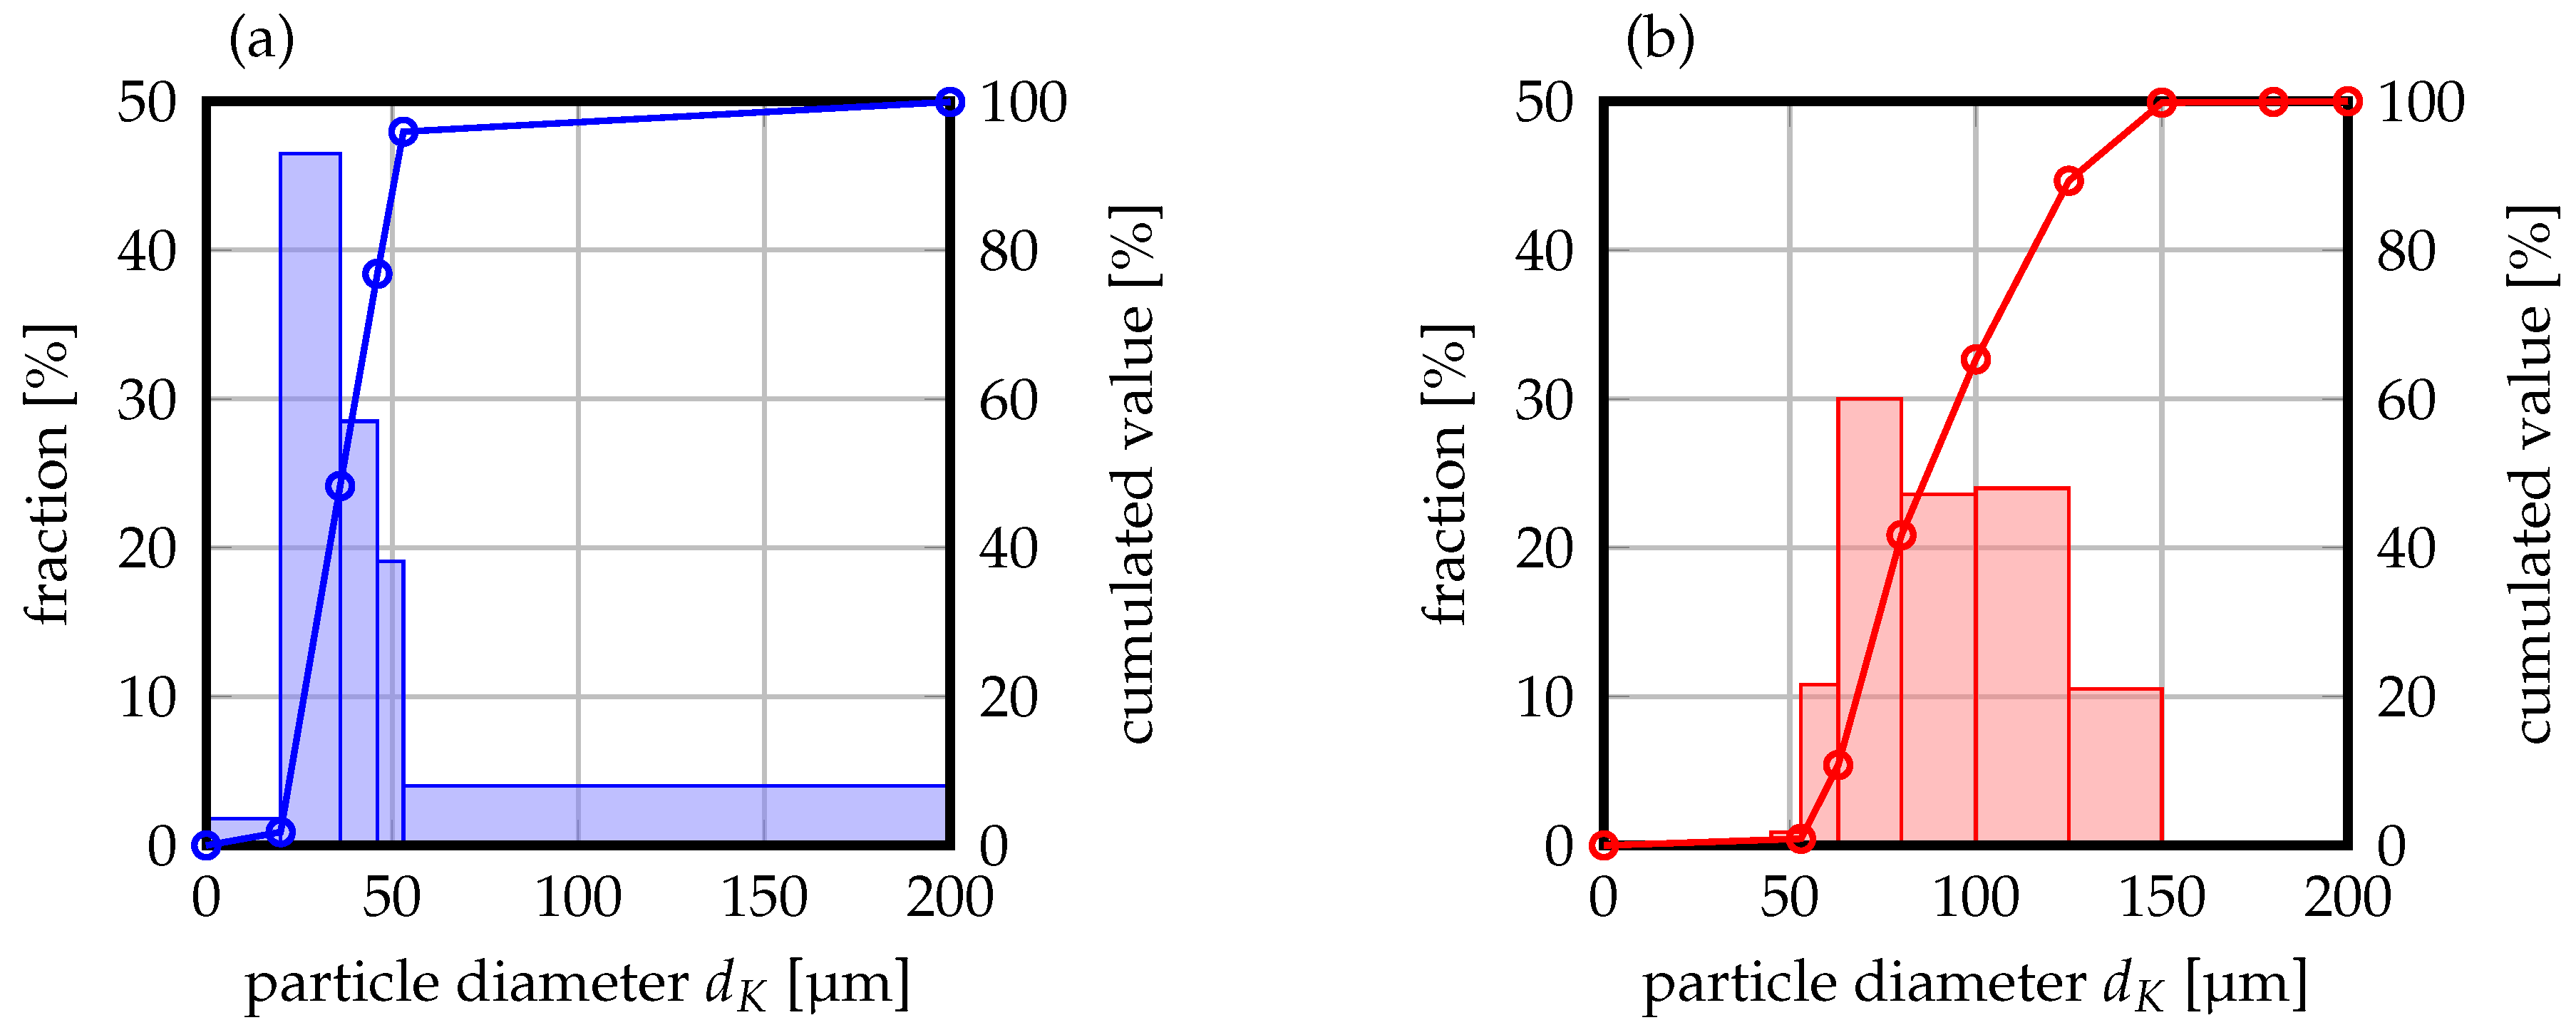
Figure 3c,d). Firstly, it is to be observed that the particle size distribution exhibits a significant influence on clad height, as clads of the 50–150
distribution are characterized by a reduced height when compared to the distribution of 20–53
. This phenomenon can be attributed to the correspondingly higher packing density in a finer particle size distribution, such as 20–53
, for a constant mass flow and the incumbent amplification of laser absorption in the interaction zone. Additionally, an increase in carrier gas flow corresponds to a decrease of clad height within the distribution of 20–53
, which further supports the aforementioned findings. Obviously, the interaction times of the powder particle and laser beam pose a significant influence on phenomena of reflection and absorption when such fine powder materials are used. For a rather coarse powder, such as 50–150
, the influence of carrier gas flow on clad height is negligible. Hence, an increased interaction time of the particles and laser beam does not allow for higher clads when such coarse powders are used.
Additionally, the dilution depth during laser cladding of thin-sheet substrates is characterized by interdependencies to carrier gas flow, as
Figure 3e,f visualizes. For both powder size distributions, the dilution depth is minimal for a carrier gas flow of 5
and subsequently increased by more carrier gas flow. Finally, the dilution depth is decreased again for high flow rates of 25
. As the dilution depth directly corresponds to the depth of the melt pool, the results shown indicate that an increase of carrier gas flow furthers a deeper melt pool until a certain threshold is reached. The authors propose that, from this threshold onwards, the increase in carrier gas flow accounts for additional turbulence of the particle stream for which the melt pool and dilution depth are decreased again. Similar findings were presented by Zhong et al. [
29] who proposed that particle velocity was the dominant factor for melt pool penetration depth when using a three-jet nozzle. Moreover, Shah et al. [
30] reported an increase of melt pool depth for increasing carrier gas flows. Thus, it appears to be appropriate to conclude that these findings concur with the ones in the present investigation, for which they can be transferred to laser cladding of thin-sheet substrates.
As it was described in the preceding section, shielding gas is fed through the coaxial outlet of the powder-nozzle to prevent oxidation of the clad. Under the previous section’s analogue assumption that no shielding gas is lost during its feed through the optics, an increased shielding gas flow rate corresponds to a higher flow speed at the coaxial nozzle outlet. Further, the shielding gas flow is therefore directed towards the interaction zone of powder and laser focus, where it may manipulate the interaction of the latter, as it was proposed by Segerstark [
7]. For this reason, it was to be investigated whether an increase of shielding gas flow had an influence on the target values for a given constant of carrier gas flow. Based on the prior results, carrier gas flows of 5
and 10
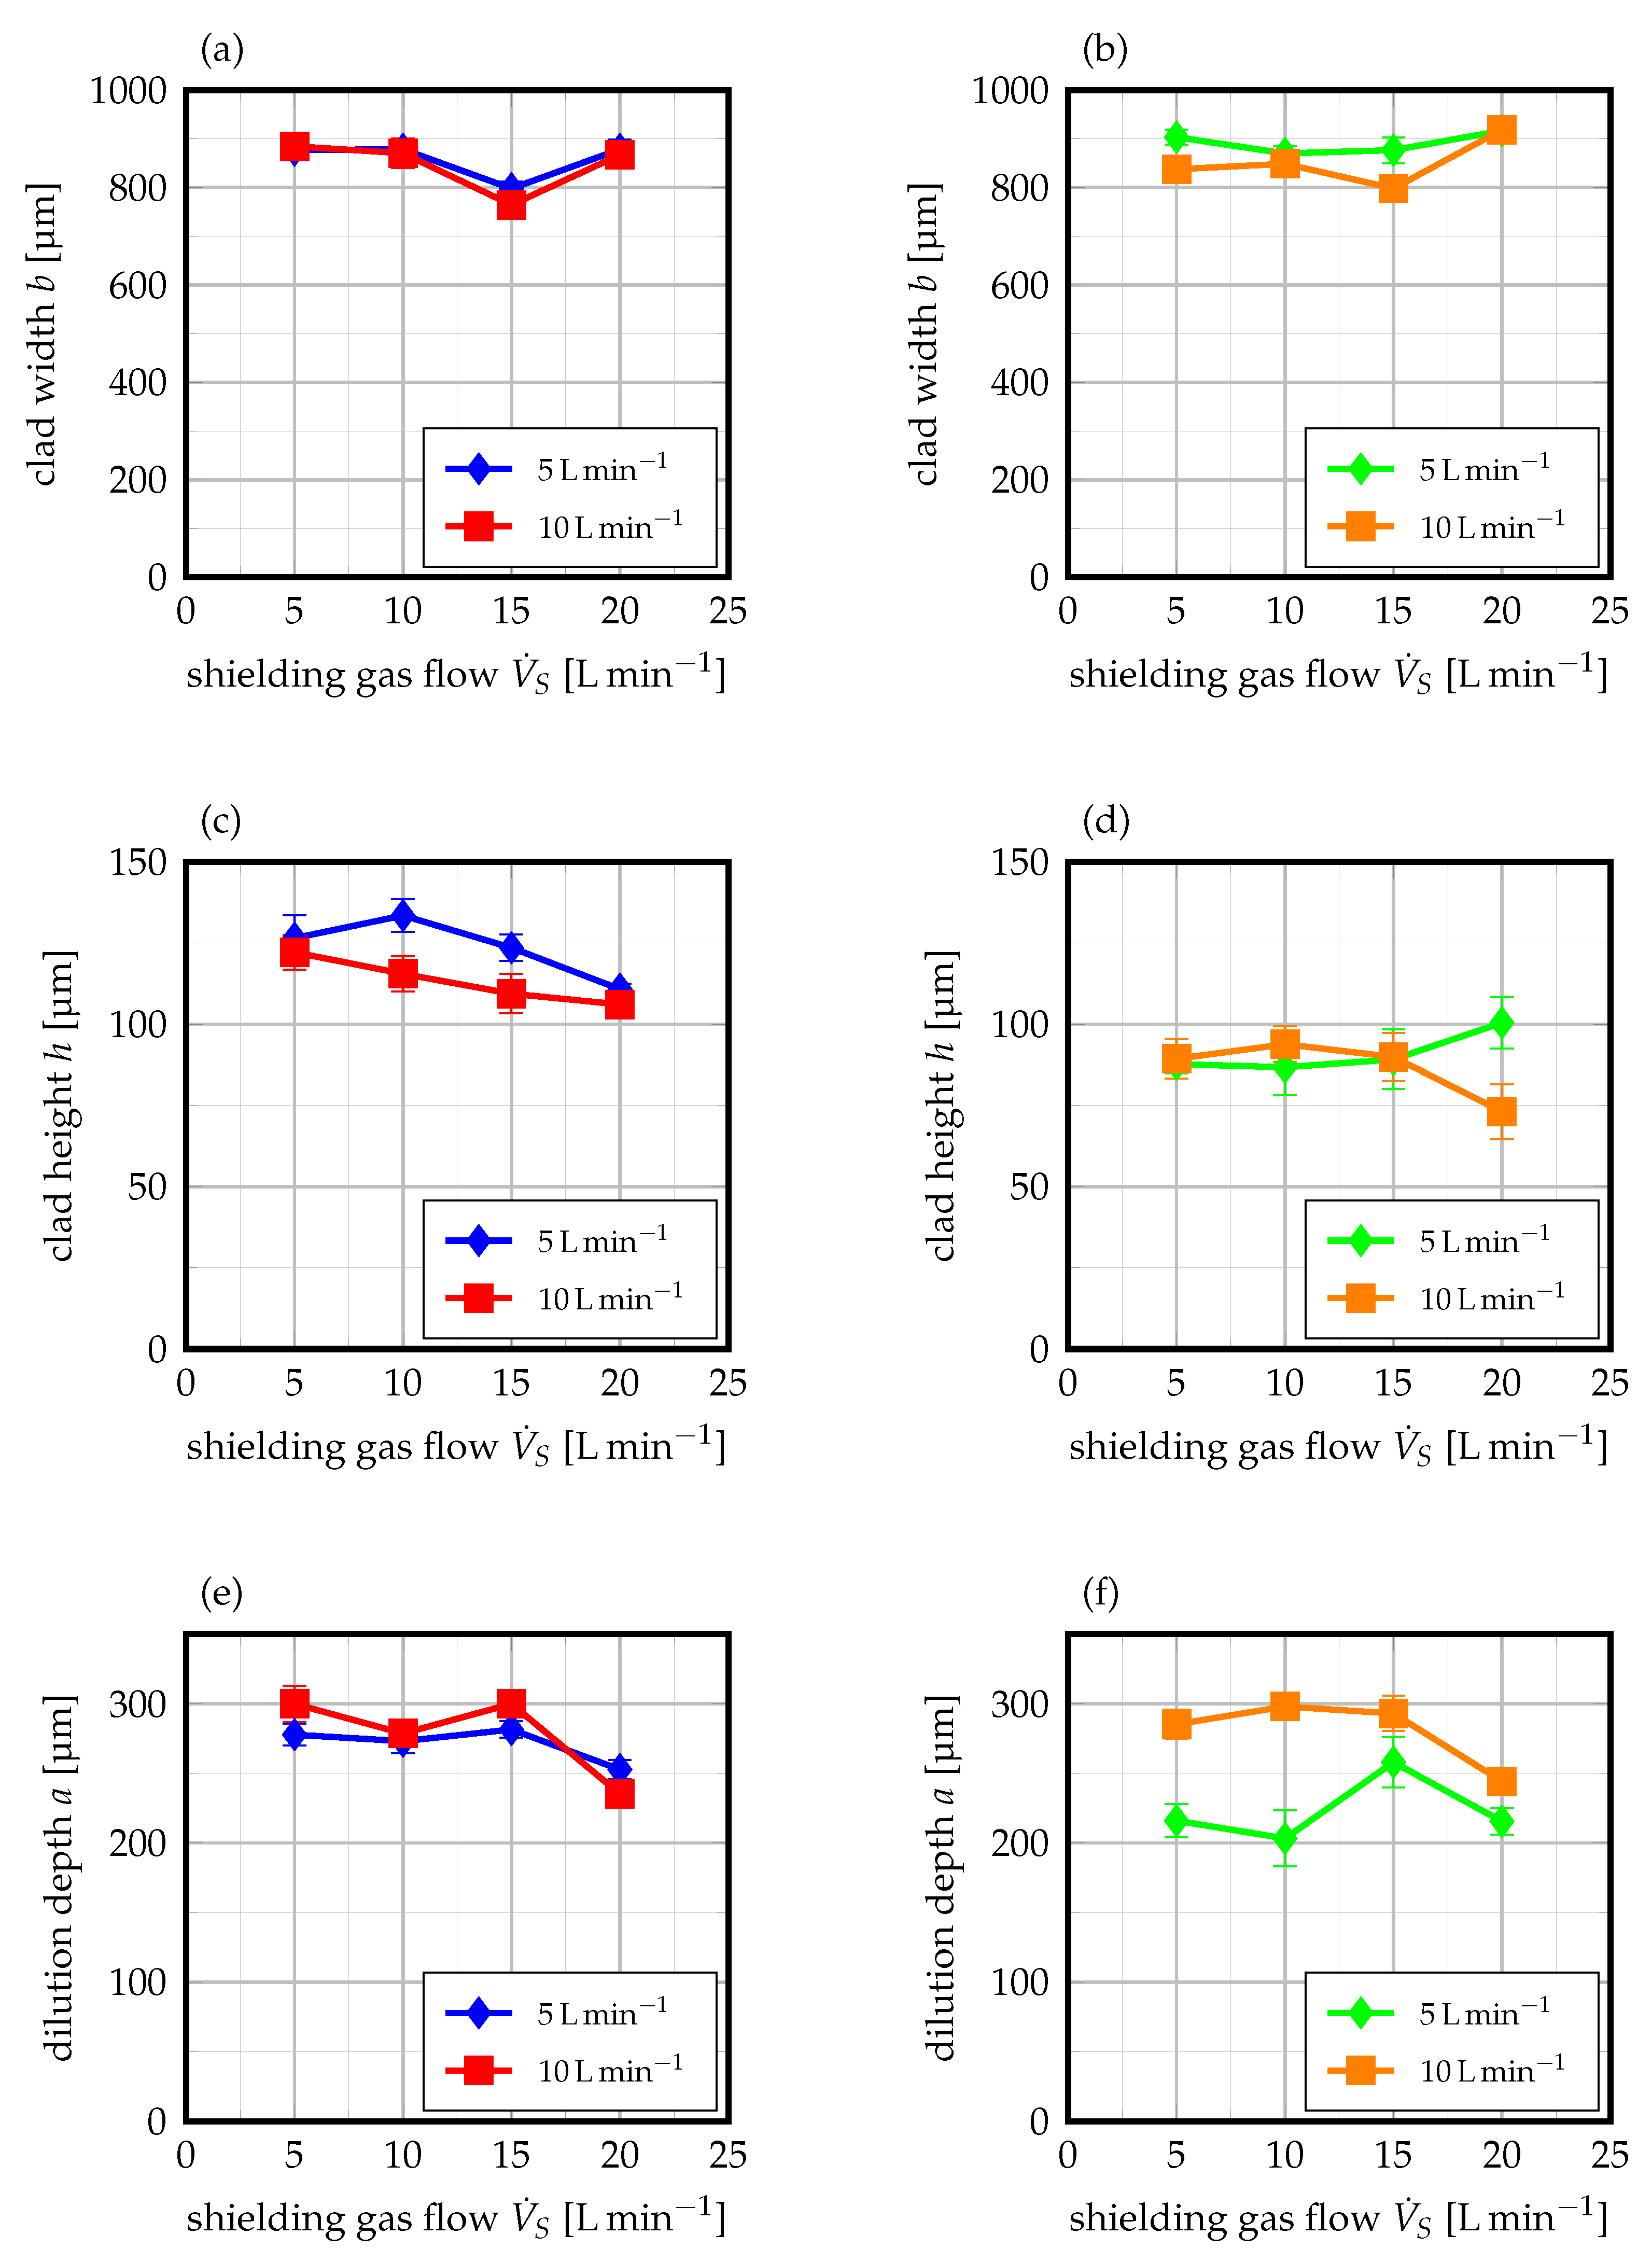
were further considered with variable shielding gas flows. The results of the investigation are depicted in
Figure 4. As can be derived from
Figure 4b, the clad width is insignificantly affected by an increase of shielding gas flow when coarse powder particles of 50–150
and a carrier gas flow of 5
are used. Yet, when higher carrier gas flows and, thus, higher particle velocities in the interaction zone are employed, shielding gas flow does exhibit an influence on clad width for particles of 50–150
. While the clad width is somewhat constant for shielding gas flows to a threshold of 15
, a sudden increase is observed afterwards. As a possible explanation, it is proposed that an increase in shielding gas flow may lead to turbulence, diversion of in-flight powder particles, and may therefore widen the powder focus. Finer powder particles of size 20–53
also exhibit a threshold-value of 15
after which the clad width is increased again with more shielding gas flow.
For a smaller particle diameter range of 20–53
, the clad height is reduced with increasing shielding gas flow for both investigated carrier gas flows. Based on the fact that clad height is strongly dependent on the interaction time between lasers and powders, this can be seen as support of the preceding proposition that the shielding gas flow may interact with the carrier gas flow. Similar results can be identified for larger particle diameters of 50–150
, even if the overall clad height is lower (cf.
Figure 4d). Yet, for low carrier gas flows of only 5
, a sudden increase in clad height can be observed when using 20
of shielding gas flow.
With regard to dilution depth, somewhat similar results could be obtained for both particle size distributions. Firstly, lower dilution depths are obtained for lower carrier gas flows which undergirds the previous findings when varying carrier gas flow. Moreover, an increase in shielding gas flow leads to a reduction of dilution. Apparently, the use of larger shielding gas flow rates facilitates a shallower melt pool. In correlation with the previously seized suggestions of Zhong et al. [
29], it can be concluded that an increase in shielding gas flow leads to increased interaction and, thus, turbulence with the carrier gas flow, for which the powder particles cannot penetrate the melt pool as deeply as before.
Based on the given particle-beam interaction during high-speed laser cladding of thin-sheet substrates, which was evaluated using varying carrier and shielding gas flows, further characterization was performed with a static shielding and carrier gas flow of 10 and 5 , respectively.
3.2. Influence of Laser Power and Mass Flow
The use of full-factorial plans with regard to laser power
and mass flow
for each laser beam diameter yielded the establishment of process maps for high-speed laser cladding of thin-sheet substrates with a thickness of
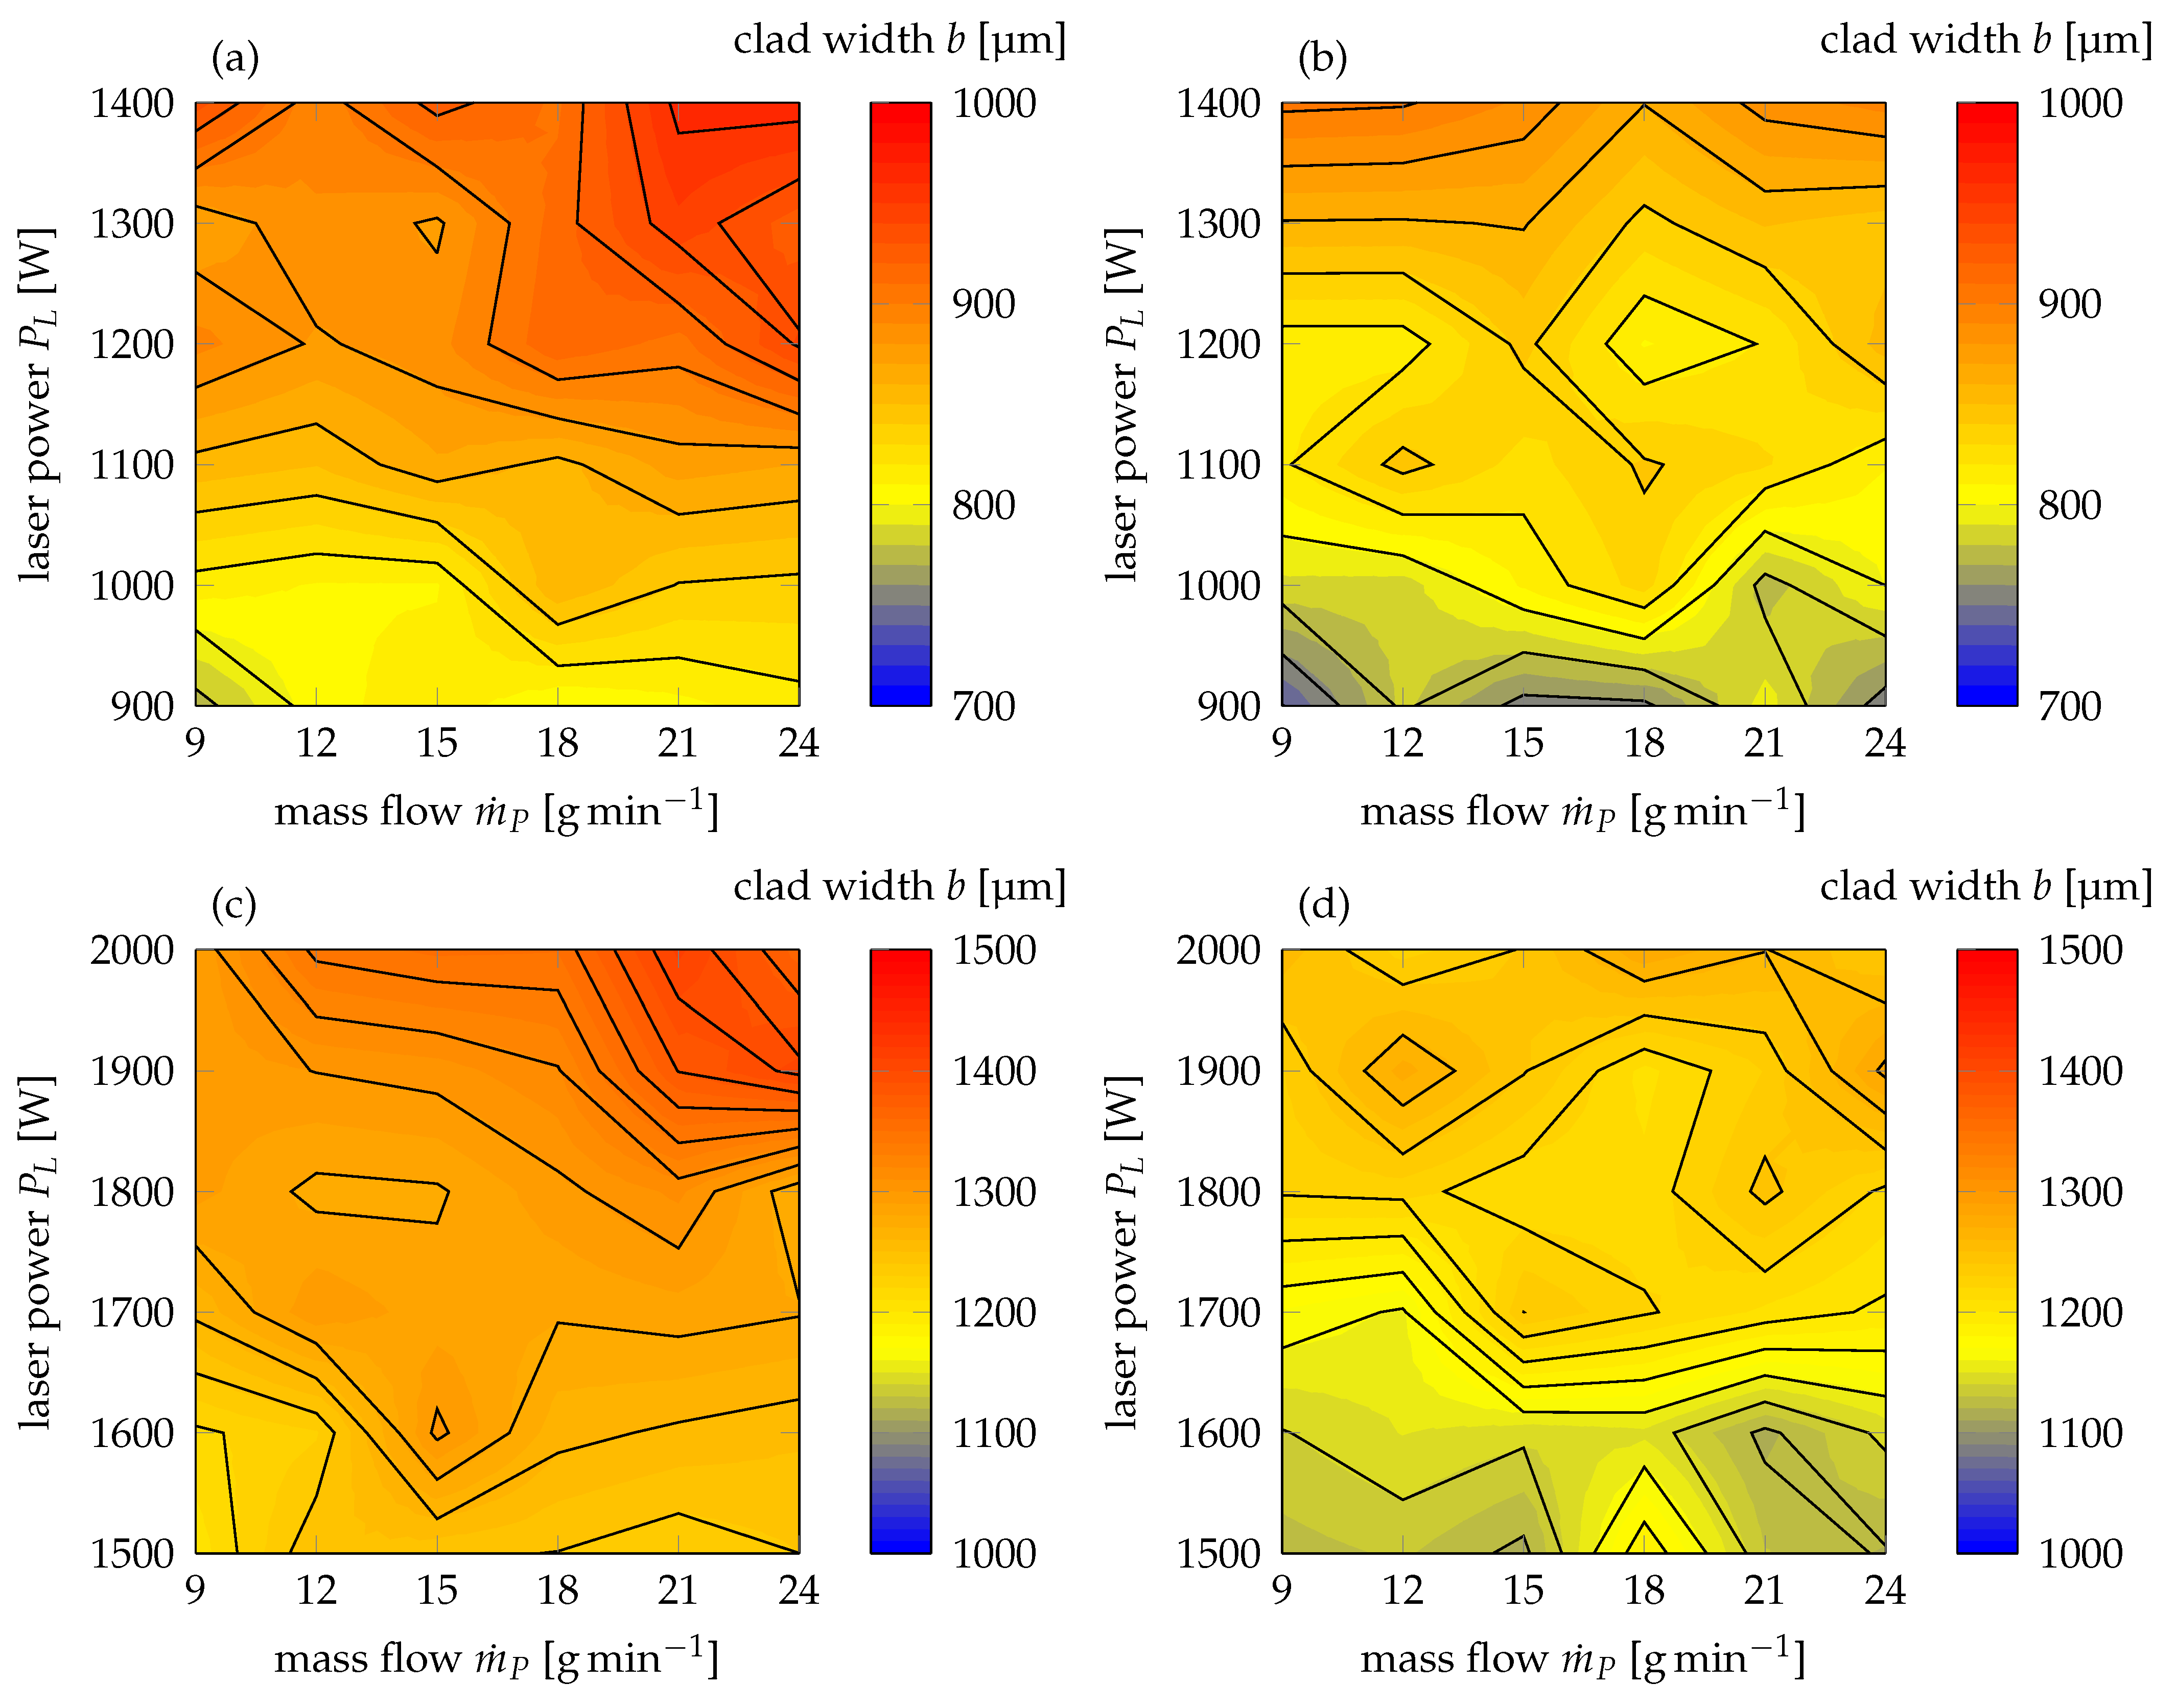
. As can be derived from
Figure 5a,b, the clad width for a constant laser beam diameter of
ranges from 740
to 960
depending on the utilized powder size distribution. The contour lines of a specific clad height can be approximated by constant ratios of laser power and mass flow. In this context, it is to be noted that for all given combinations of laser power and mass flow, the achievable clad width is higher for powder with a diameter of 20–53
than for 50–150
. Obviously, the finer powder particles lead to enhanced absorption during laser cladding of thin-sheets as phenomena, such as multiple reflection and, thus, absorption is promoted due to the higher packing density of the powder within the interaction volume. Additionally, the clad width extends farther as the laser beam diameter on the workpiece for both particle size distributions, for which heat conduction effects can be attributed. While for maximum laser power and mass flow of 1400
and 24
, respectively, a clad width of 966
can be obtained for particles of size 20–53
, the clad width only reaches 893
for 50–150
. As a result of this observation, the authors propose that the finer powder particles lead to pronounced re-reflection and absorption of laser light, for which the interaction zone on the workpiece, and, subsequently, the clad width are widened. In addition to that, it shall be noted that for very low laser powers of 900
, the clad width is reduced to values below the actual laser beam diameter, albeit changes in mass flow for a powder size of 50–150
. Obviously, this marks a threshold value for which insufficient melting of the substrate surface is reached. This observation is further supported by the results of the ANOVA in
Table A7. The computed
p-values of
and
(No. 1.1 and 1.3) with respect to laser power for a particle size distribution of 20–53
and 50–150
, respectively, emphasize that the laser power has a significant impact on clad width.
In order to maintain comparable intensities on the work piece, the range of investigated laser powers was adopted to 1500
to 2000
for a laser beam diameter of
. Corresponding results of the clad width measurements are to be found in
Figure 5c,d, from which it can be deduced that the achievable clad width during high-speed laser cladding of thin-sheet substrates with a laser beam diameter of
ranges from 1116
to 1413
, depending on the utilized particle size distribution. Similar to a beam diameter of
, the contour lines of clad height can be approximated by almost constant ratios of laser power and mass flow. Additionally, the clad width is higher for all investigated combinations of laser power and mass flow when a finer particle size distribution of 20–53
is used. For a maximum laser power of 2000
and a mass flow of 24
, a clad width of 1365
and 1240
can be obtained for particles of size 20–53
and 50–150
, respectively. This supports the proposition of the preceding paragraph that finer particles lead to increased reflection and absorption phenomena within the interaction volume of a laser beam and powder stream. Notably, the threshold values of laser power, under which the clad width falls below the laser beam diameter, lies around 1700
for particles of size 50–150
, while it does not fall short of the laser beam diameter for a size distribution of 20–53
. In consideration of the identical behavior for a beam diameter of
, it can be concluded that the larger particles obviously lead to increased shading, for which somewhat limited amounts of laser light reach the substrate surface. Hence, it is proposed that the melt pool width on the surface and, thus, achievable clad width are reduced. Additionally, the computed p-values of the ANOVA (cf.
Table A8 No. 1.1 and 1.3) affirm the significance of laser power for clad width, rather than mass flow.
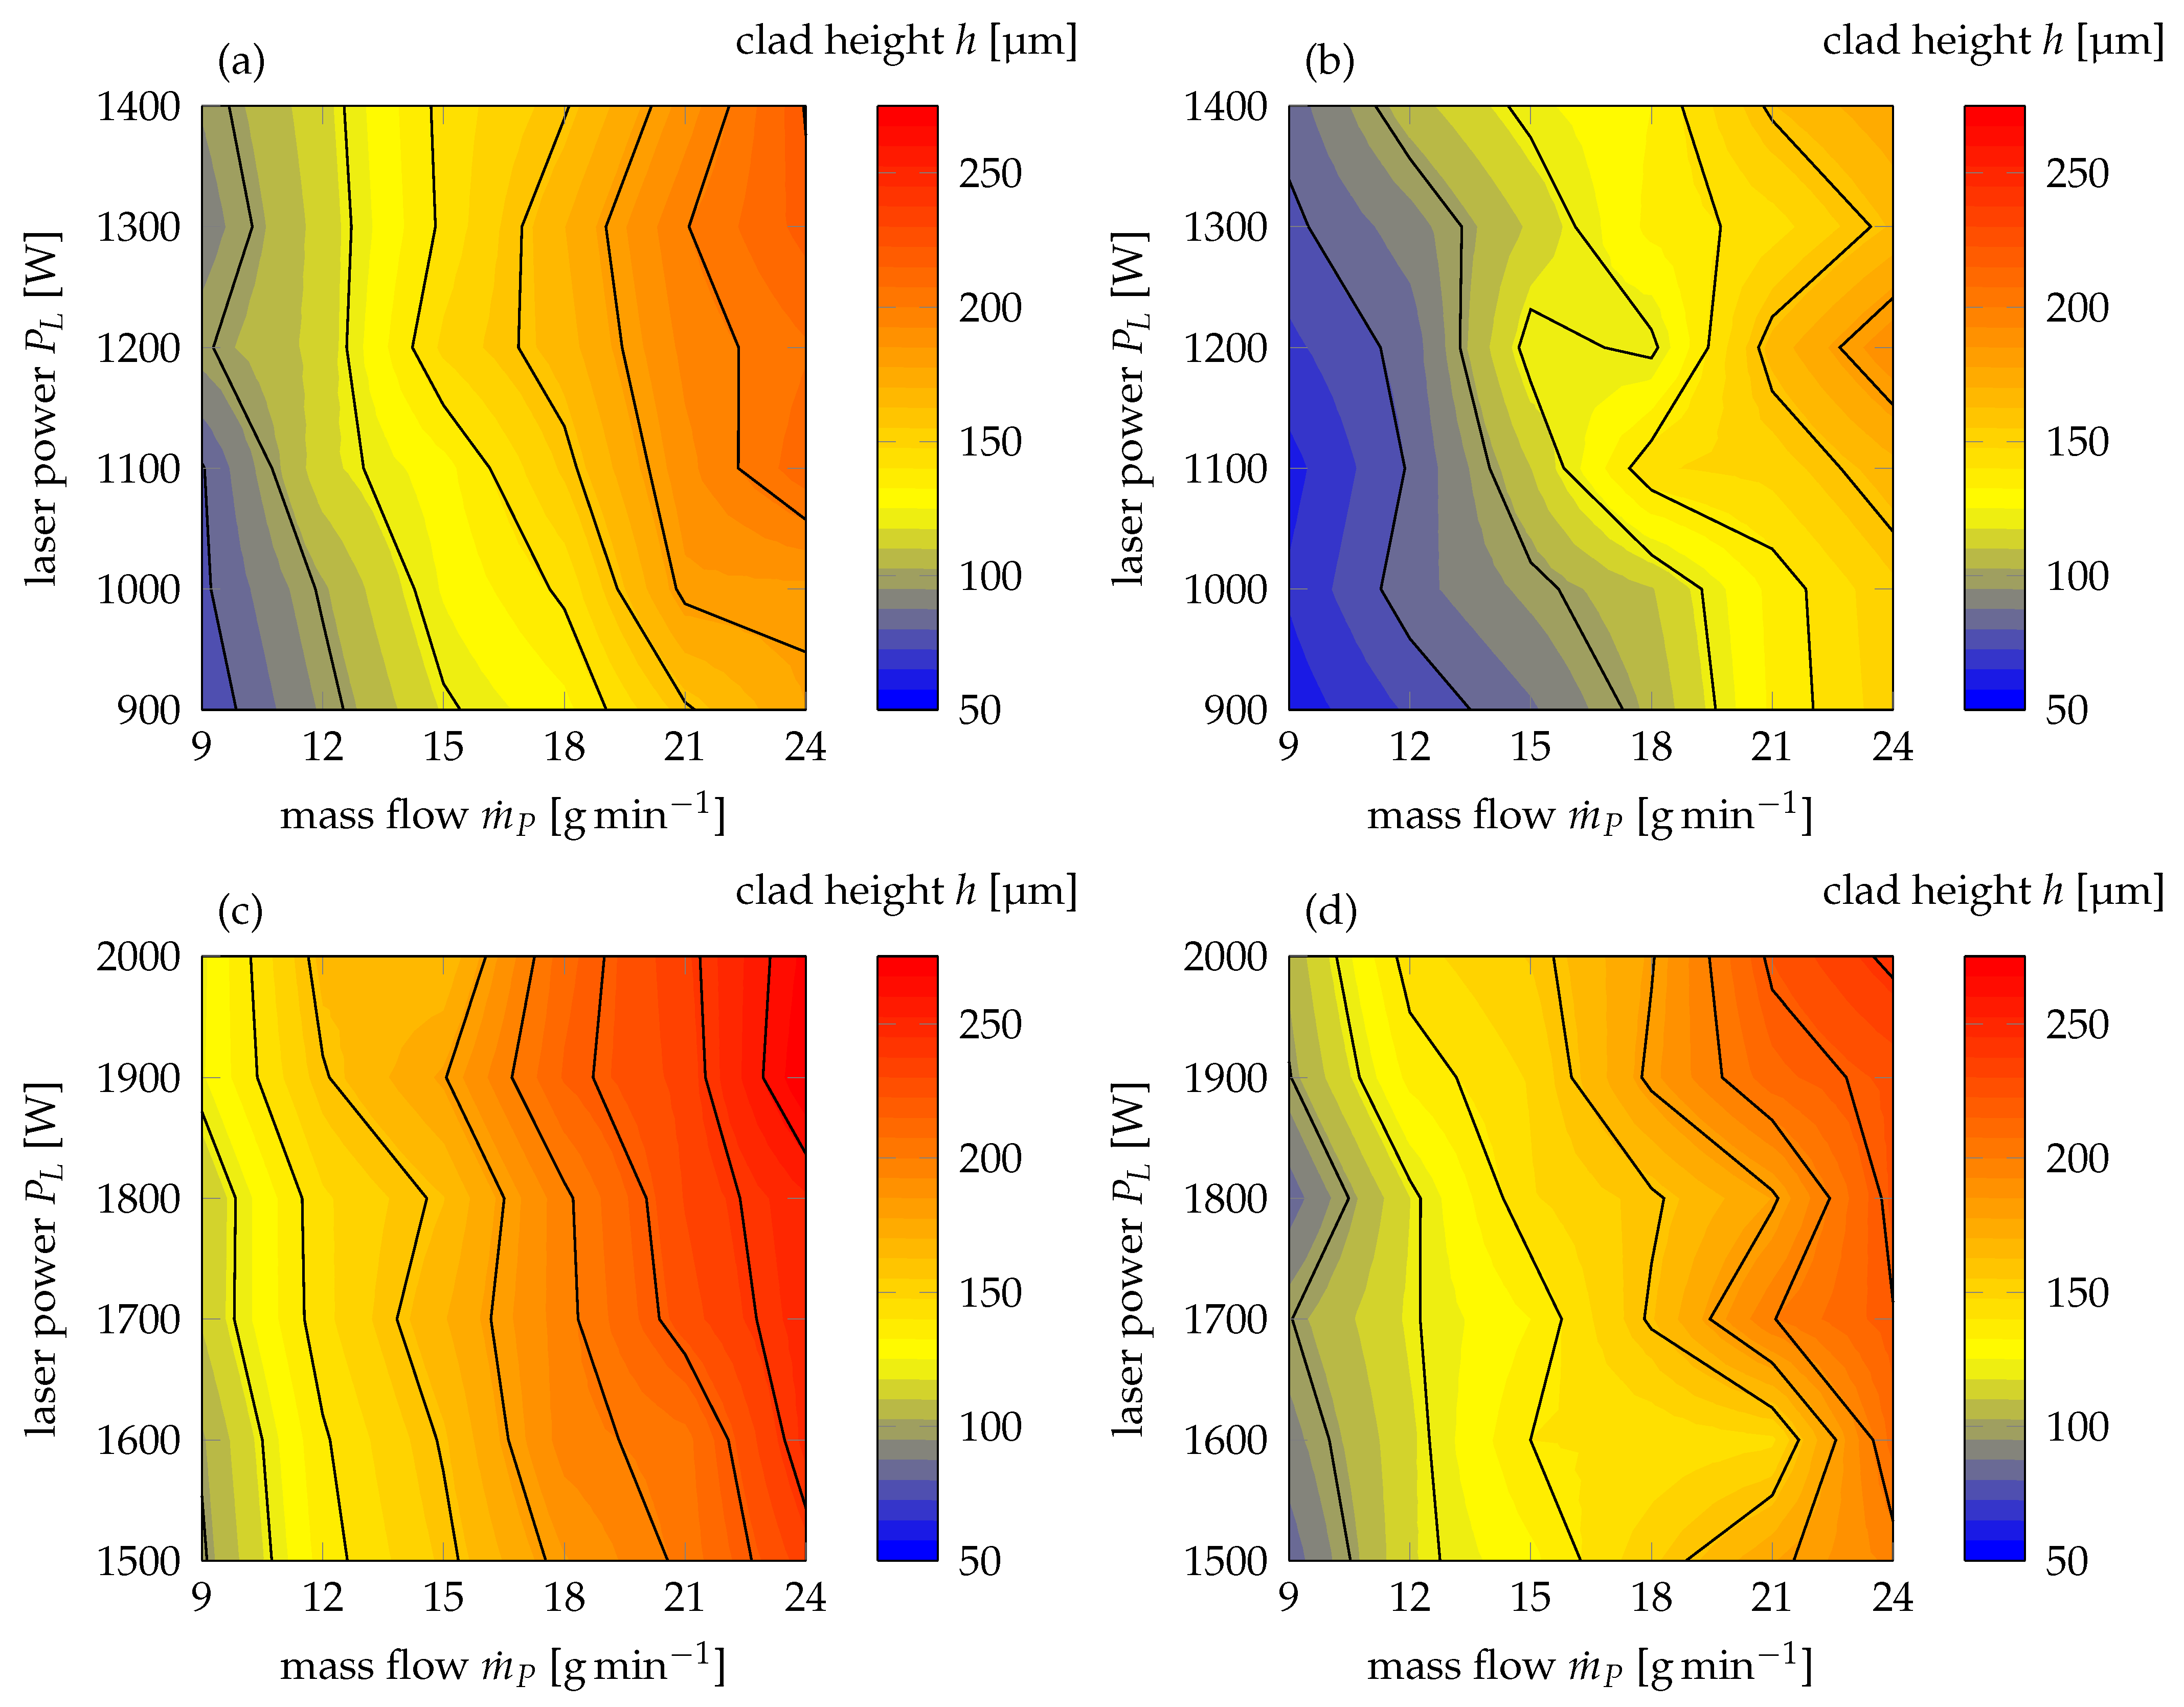
The clad height, on the other hand, exhibited different characteristics for a beam diameter of
, as can be deduced from
Figure 6a,b. Clad heights ranging from 60
to 220
can be obtained during high-speed laser cladding of thin-sheet substrates in dependence on the powder size distribution employed. In contrast to the previous findings though, the contour lines of clad height within the established maps of laser power and mass flow proceed parallel to increasing laser power and perpendicular to an increase in mass flow. Hence, it is evident that powder mass flow is the dominant factor for achieving a desired clad height during high-speed laser cladding of thin-sheet substrates. This conclusion can also be supported by results of the ANOVA where
p-values of mass flow are substantially below the significance level of 0.05 for all investigated particle size distributions (cf.
Table A7 No. 2.2 and 2.4). Nonetheless, it can also be derived that for all given combinations of laser power and mass flow, the finer particle size of 20–53
yields higher clads. Exemplary, the clad height for a laser power of 1200
and a mass flow of 24
is 191
, when a powder size of 50–150
is employed. When a finer particle size distribution is used, a clad height of 220
can be achieved using the otherwise unchanged boundary conditions. For this reason, it can be concluded that the use of a finer particle size distribution amplifies the absorption of laser light and, thus, increases the clad height for which at a constant mass flow, the powder efficiency is obviously also enhanced.
Similar results can be obtained when a laser beam diameter of 1200
is used, as
Figure 6c,d illustrates. These observations can also be supported by the outcome of the ANOVA (cf.
Table A8 No. 2.2 and 2.4).
p-values of
and 4.1007 ×
emphasize the importance of powder mass flow for clad height during high-speed laser cladding of thin-sheet substrates. While the contour lines therefore feature an identical orientation as the ones observed for a beam diameter of 800
, the overall achievable height is higher as compared to the smaller beam diameter for both investigated particle size distributions. An increase of clad width when using a larger laser beam diameter during high-speed laser cladding of thin-sheet substrates was to be expected on the basis of an elementary beam-matter interaction. Yet, the aforementioned findings also indicate that a larger beam diameter yields increased clad heights for all given mass flows independently of the laser power employed. From this, it can be derived that an increase of laser beam diameter not only increases the effective interaction volume perpendicular, but also parallel to the laser beam propagation direction, for which larger quantities of powder can be melted and, subsequently, form a higher clad. Through the utilization of a beam diameter of 1200
, clad heights of up to 274
at a laser power of 1900
and a powder mass flow of 24
can be achieved when using a powder size distribution of 20–53
.
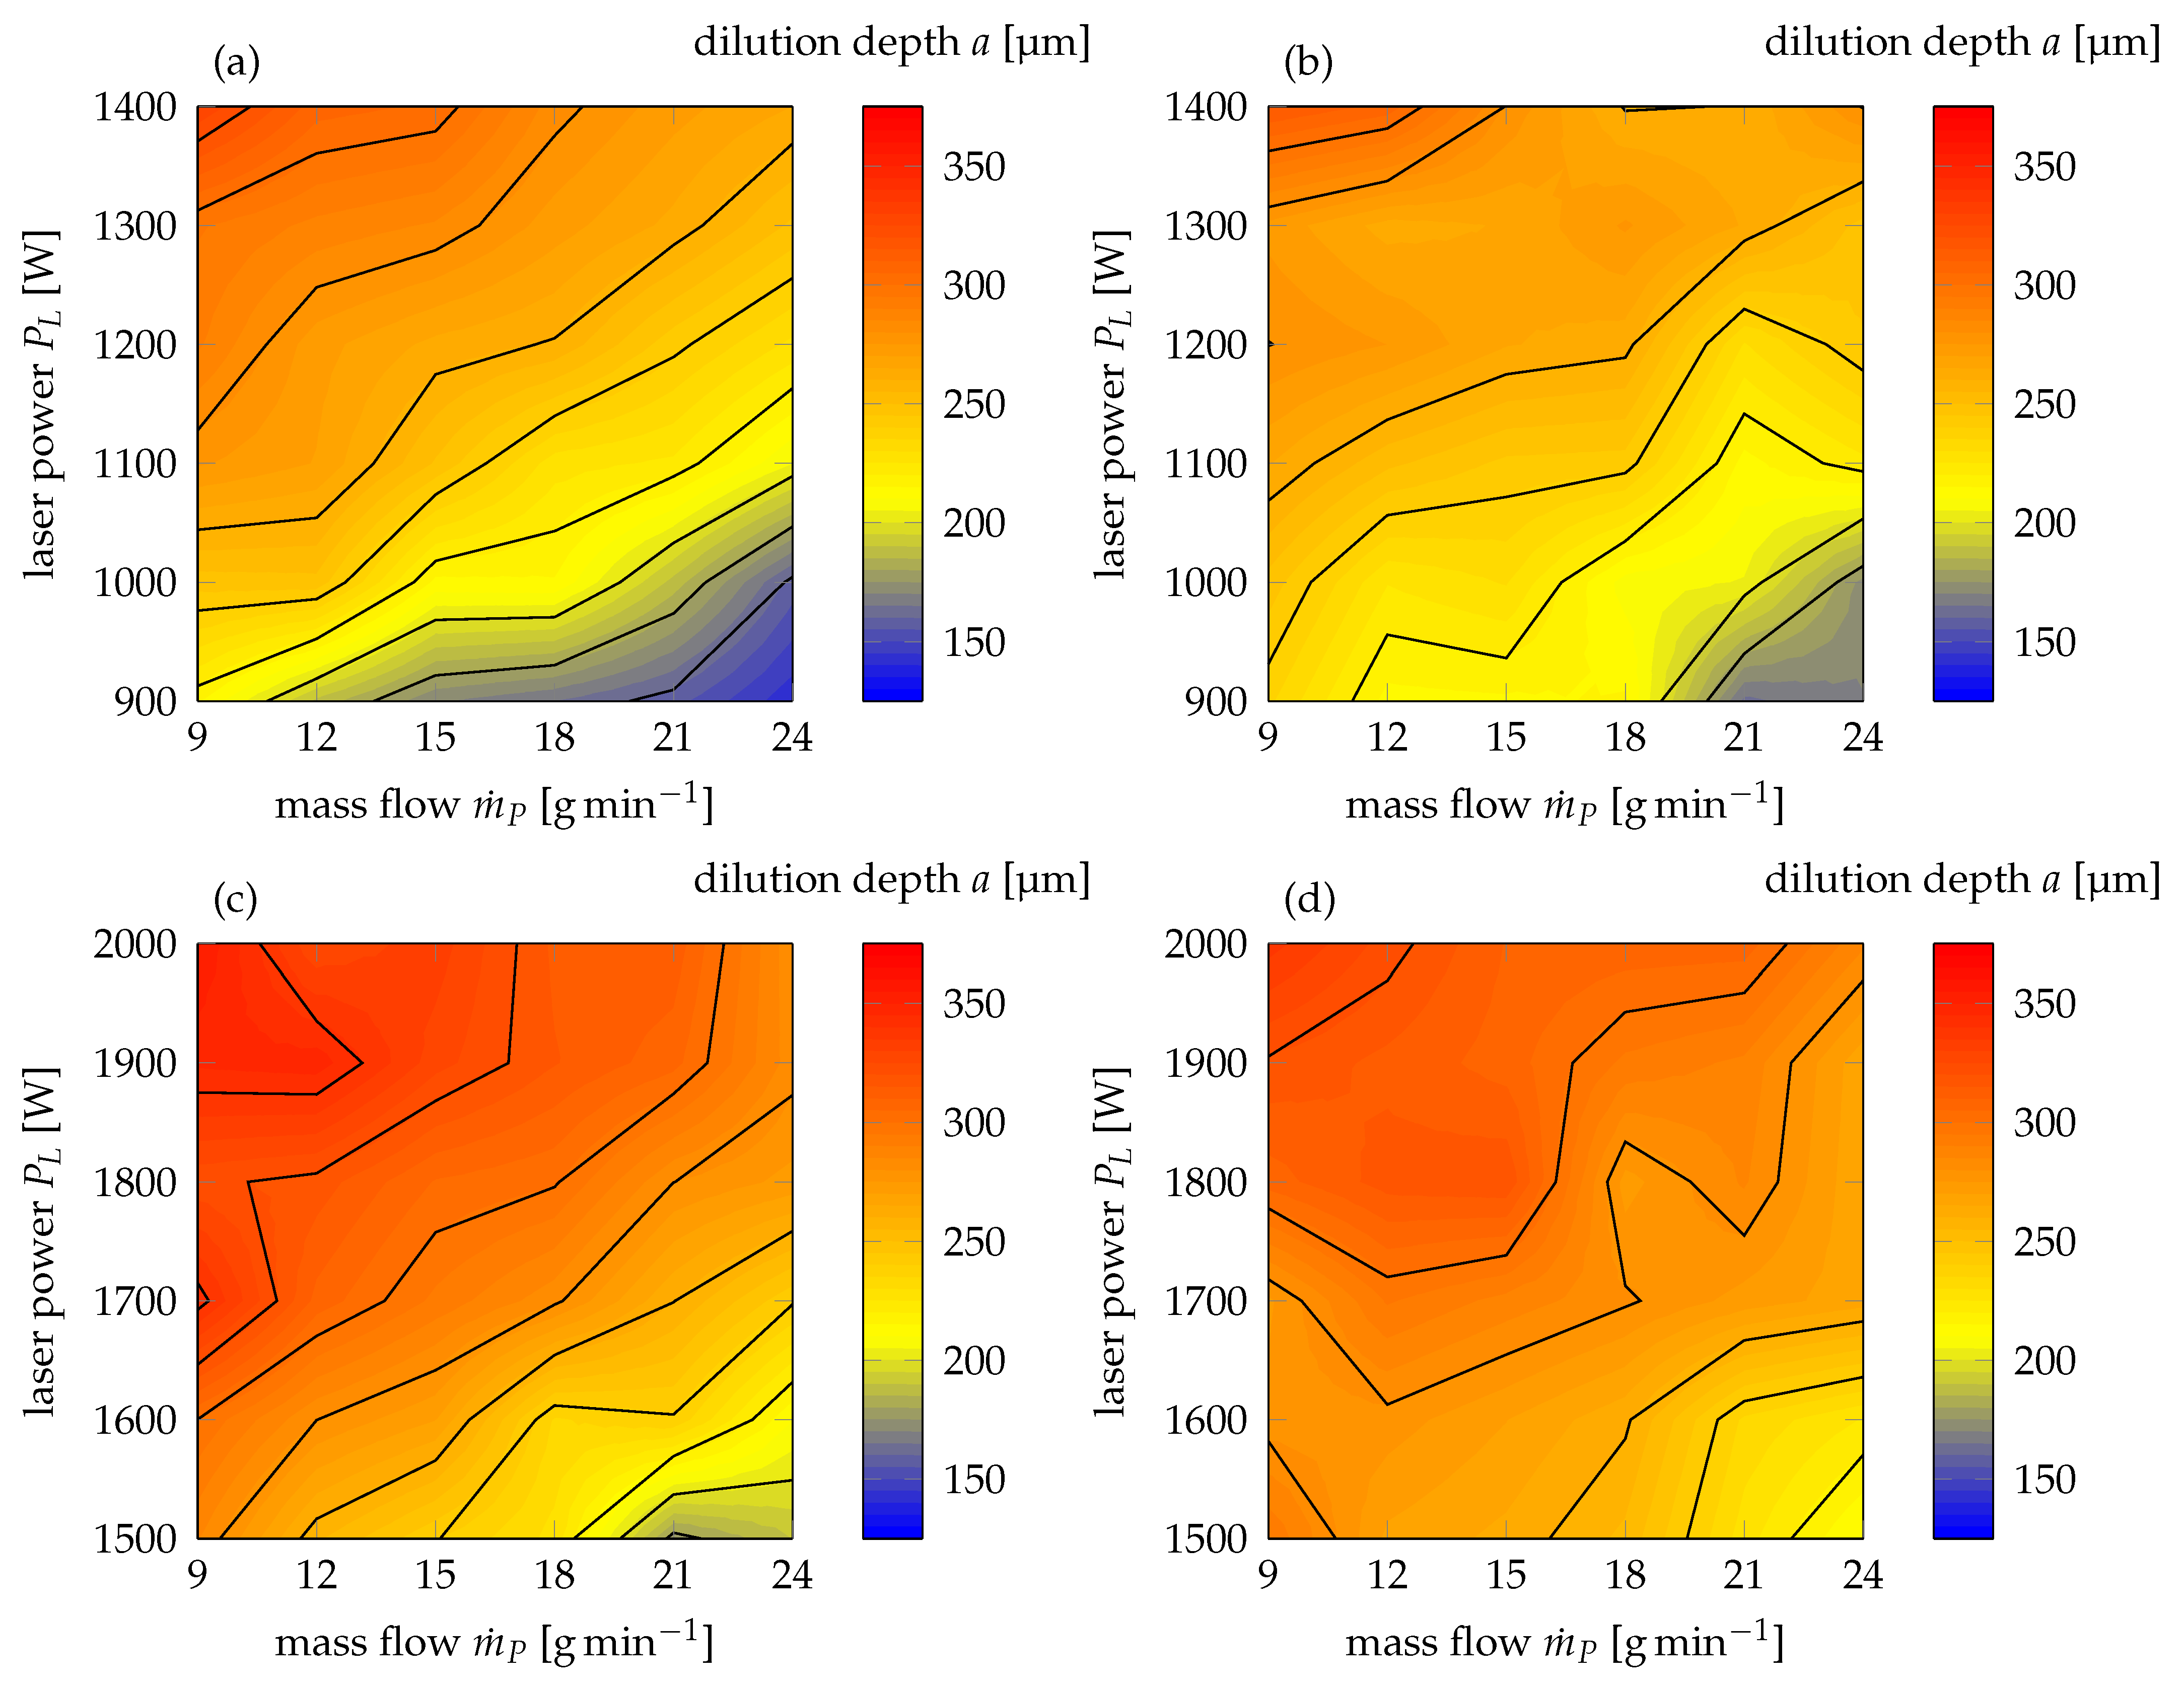
On the basis of the results illustrated in
Figure 7a,b, the dilution depth during high-speed laser cladding of thin-sheet substrates is strongly dependent on both laser power and mass flow, as reachable values vary between 141
and 330
. From the orientation of the contour lines, the interdependencies of dilution depth, laser power and mass flow can be observed as counterpart to the interrelationships of the latter with clad width, which have been discussed before. Here, the contour lines proceed perpendicular to the contour lines of clad width, as well as perpendicular to constant ratios of laser power and mass flow. Interestingly,
p-values of the ANOVA are below a significance level of 0.05 for laser power (cf.
Table A7; No. 3.1 and 3.3) while ranging slightly above the significance level for mass flow (cf.
Table A7; No. 3.2 and 3.4). Based on the ANOVA for mass flow, the interdependency of dilution depth and mass flow may be described as insignificant. Yet, when results of a laser beam diameter of 1200
are taken into account as well (cf.
Table A8 No. 3.2 and 3.4), it is evident that the mass flow does possess a significant influence on dilution depth as p-values reach 0.0142 and 0.0173. For that, it is to be summarized that if dilution is to be kept constant for a desired application, an increase in laser power should also incorporate a further increase of mass flow. Remarkably, the findings at the outmost parameter combinations within the process maps exhibit substantial differences with regard to the particle size distribution that is employed during cladding. As such, for a laser power of 1400
and a mass flow of 9
, the dilution depth is maximized for powder particles of 20–53
at 330
. Yet, at the given laser power and mass flow, the usage of a powder size distribution of 50–150
yields a dilution depth of 315
. Contrary to this, when the laser power is minimal at 900
and mass flow is maximized at 24
, the particle size distribution of 20–53
only exhibits a dilution depth of 141
as opposed to 163
for a size of 50–150
. As dilution depth directly correlates with laser power on the substrate surface for a constant mass flow, the observed differences can only be attributed to varying reflection and absorption phenomena in the interaction volume. For a comparatively low mass flow of 9
and a particle size of 20–53
, a larger number of powder particles is available to reflect the incoming laser light, for which multiple reflection to the substrate surface is amplified. On the contrary, as particle size is larger, a lesser number of surfaces is available to reflect the incident light. Further, as smaller powder particles heat up faster [
26], additional residual laser energy is available to melt the substrate surface. When the mass flow is raised to 24
, the packing density of a finer particle size distribution, such as 20–53
, is substantially increased within the interaction volume for which a larger number of surfaces is available to reflect and re-absorb incident laser light as compared to particle sizes of 50–150
. Therefore, the dilution depth is higher for a larger particle size distribution of 50–150
at the maximum mass flow and minimal laser power investigated.
For a larger laser beam diameter of , dilution varies between 176 and 355 for a powder size distribution of 20–53 , as well as 208 and 337 for a particle size of 50–150 . As can be derived from these results, the dilution depth is slightly increased as compared to a beam diameter of , which may be attributed to the greater laser powers employed for this specific beam diameter. As the beam-powder interaction volume is increased by the larger beam diameter, which could also be demonstrated by an increased clad height, a larger effective number of surfaces is available to initiate re-reflection and absorption phenomena. Thus, the effects described in the preceding paragraphs are amplified.
From the different process maps for high-speed laser cladding of thin-sheet substrates, it can be derived that clads with a maximum width of 1413 , a maximum height of 274 , and a minimal dilution of up to 141 can be obtained depending on the laser beam diameter and powder size distribution employed. However, it needs to be concluded that for a maximum of the laser power and powder mass flow, the usage of finer 20–53 powders yields better results than the use of 50–150 powders due to enhanced powder efficiency. Therefore, further characterization with regard to powder and laser defocussing, which is discussed in the following paragraph, shall be undertaken using the powder size distribution of 20–53 .
3.3. Effects of Powder and Laser Defocussing
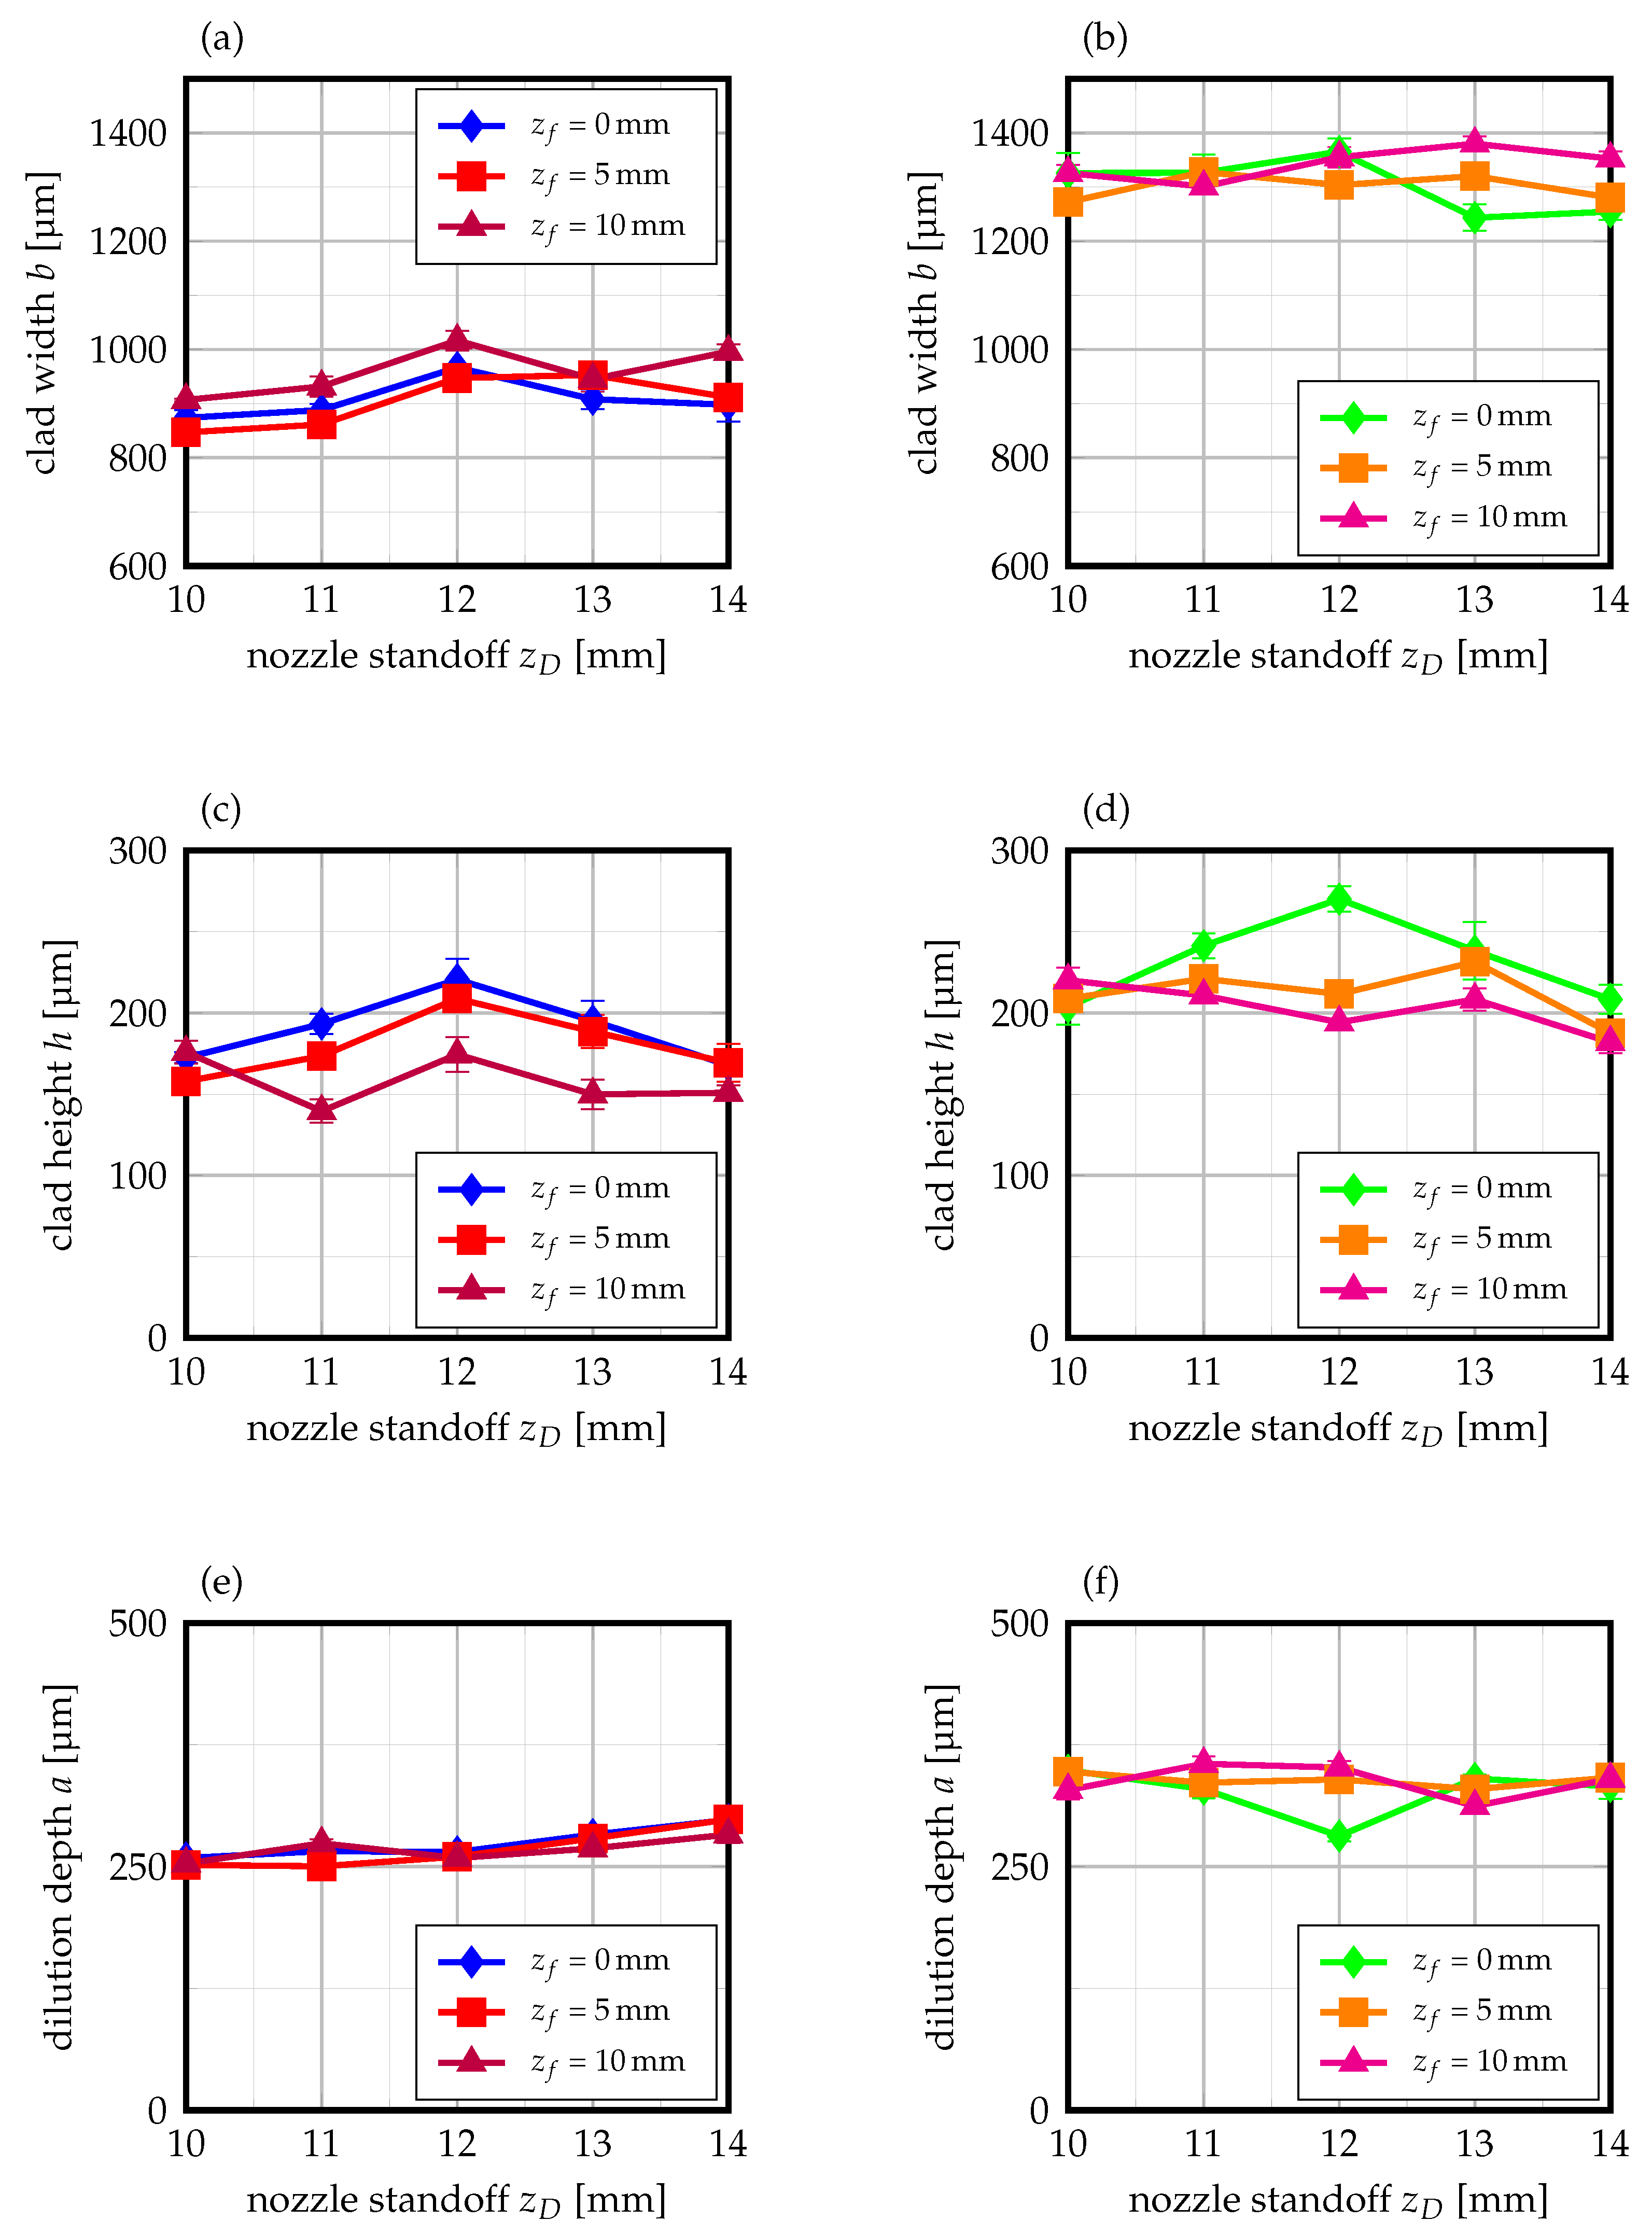
Through the utilization of a nozzle with an adaptive standoff distance and focussing optics with interchangeable lenses, defocussing of the powder stream and laser beam could be realized in order to study their effects on clad geometry and dilution independently from one another. The results of this investigation are presented in
Figure 8. Here, a reduced nozzle standoff represents a shorter distance from the nozzle outlet to the substrate surface. The default standoff distance of the employed three-jet, coaxial-nozzle is 12
. Consequently, the focal offset
describes the distance from the laser beam focus to the substrate surface, which was level for all previous investigations. In this study, an increased focal offset can be associated with the laser beam focus moving upward from the substrate surface, hence widening the near-Gaussian beam again, for which the diameter on the workpiece is increased.
As can be derived from
Figure 8a,b, the clad width and nozzle standoff exhibit different interrelationships for the varying beam diameters and focal offset employed. With a beam diameter of
, the highest clad widths are obtained for a nozzle standoff of 12
, whereby the powder focus is level with the substrate surface. This observation applies for all focal offsets, whereas it has to be mentioned that a focal offset of 10
yields the highest clad width. Given the fact that the beam diameter is widened once the laser is defocussed, these findings appear to be appropriate. Yet, when the nozzle standoff is changed, the clad width is reduced. In particular, a reduction of nozzle standoff, which corresponds to a powder focus below the substrate surface, is detrimental to clad width of thin-sheet substrates. For a laser beam diameter of
, similar phenomena can be observed. For a focal offset of 0
, the highest clad width is achieved for a nozzle standoff of 12
. A reduction or increase of the nozzle standoff yields lower clads widths again. Interestingly, a focal offset of 5
cannot increase the clad width when the nozzle standoff is set below the default value of 12
. Only when the nozzle standoff is increased above the default value, such as when the powder focus is lifted above the substrate surface, higher clad widths than for a focal offset of 0
are obtained. A similar trend can also be identified for a focal offset of 10
, which leads to highest clad widths when the nozzle standoff is raised above its default value. Obviously, the defocussing of the beam facilitates an increase of effective diameters on surface, for which the clad width is increased. Nonetheless, the reader has to bear in mind that the Raygleigh length is two times as high for a focal length of 300
when compared to a focal length of 200
(cf.
Table 3), for which widening of the laser beam at a given focal offset is not as pronounced as with a focal length of 200
due to the correspondingly smaller aperture [
23].
With regard to clad height, the interrelationships of nozzle standoff and focal offset are similar for both beam diameters investigated, as can be derived from
Figure 8c,d. In both cases, the highest clad is obtained by a focal offset of 0
and a nozzle standoff distance of 0
, for which the powder and laser focus are level on the substrate surface. As the nozzle standoff is either reduced or increased, the clad height is decreased. As it has been found in the preceding paragraphs, the clad height is highly dependent on powder utilization. On the basis of the present findings, it can thus be concluded that powder defocussing obviously leads to decreased powder efficiency and, thus, lower clad heights during high-speed laser cladding of thin-sheet substrates. Hence, the propositions of Segerstark et al. [
7] and Zhu et al. [
31] can be confirmed for high-speed laser cladding of thin-sheet substrates as well. Moreover, the effects of a laser focal offset are detrimental to clad height for both investigated beam diameters. Under consideration that the multi-mode intensity-profile of the fiber laser employed during the experiments is only obtained in the focal plane (
= 0
) and alleviated at its slopes when a focal offset is used [
7], the identified observations can be explained. Obviously, the laser defocussing leads to a substantial change in its intensity distribution on the basis of which the interaction of the laser beam and powder stream is reduced. Thus, a decreased clad height is obtained when a defocussed laser beam is used for high-speed laser cladding of thin-sheet substrates.
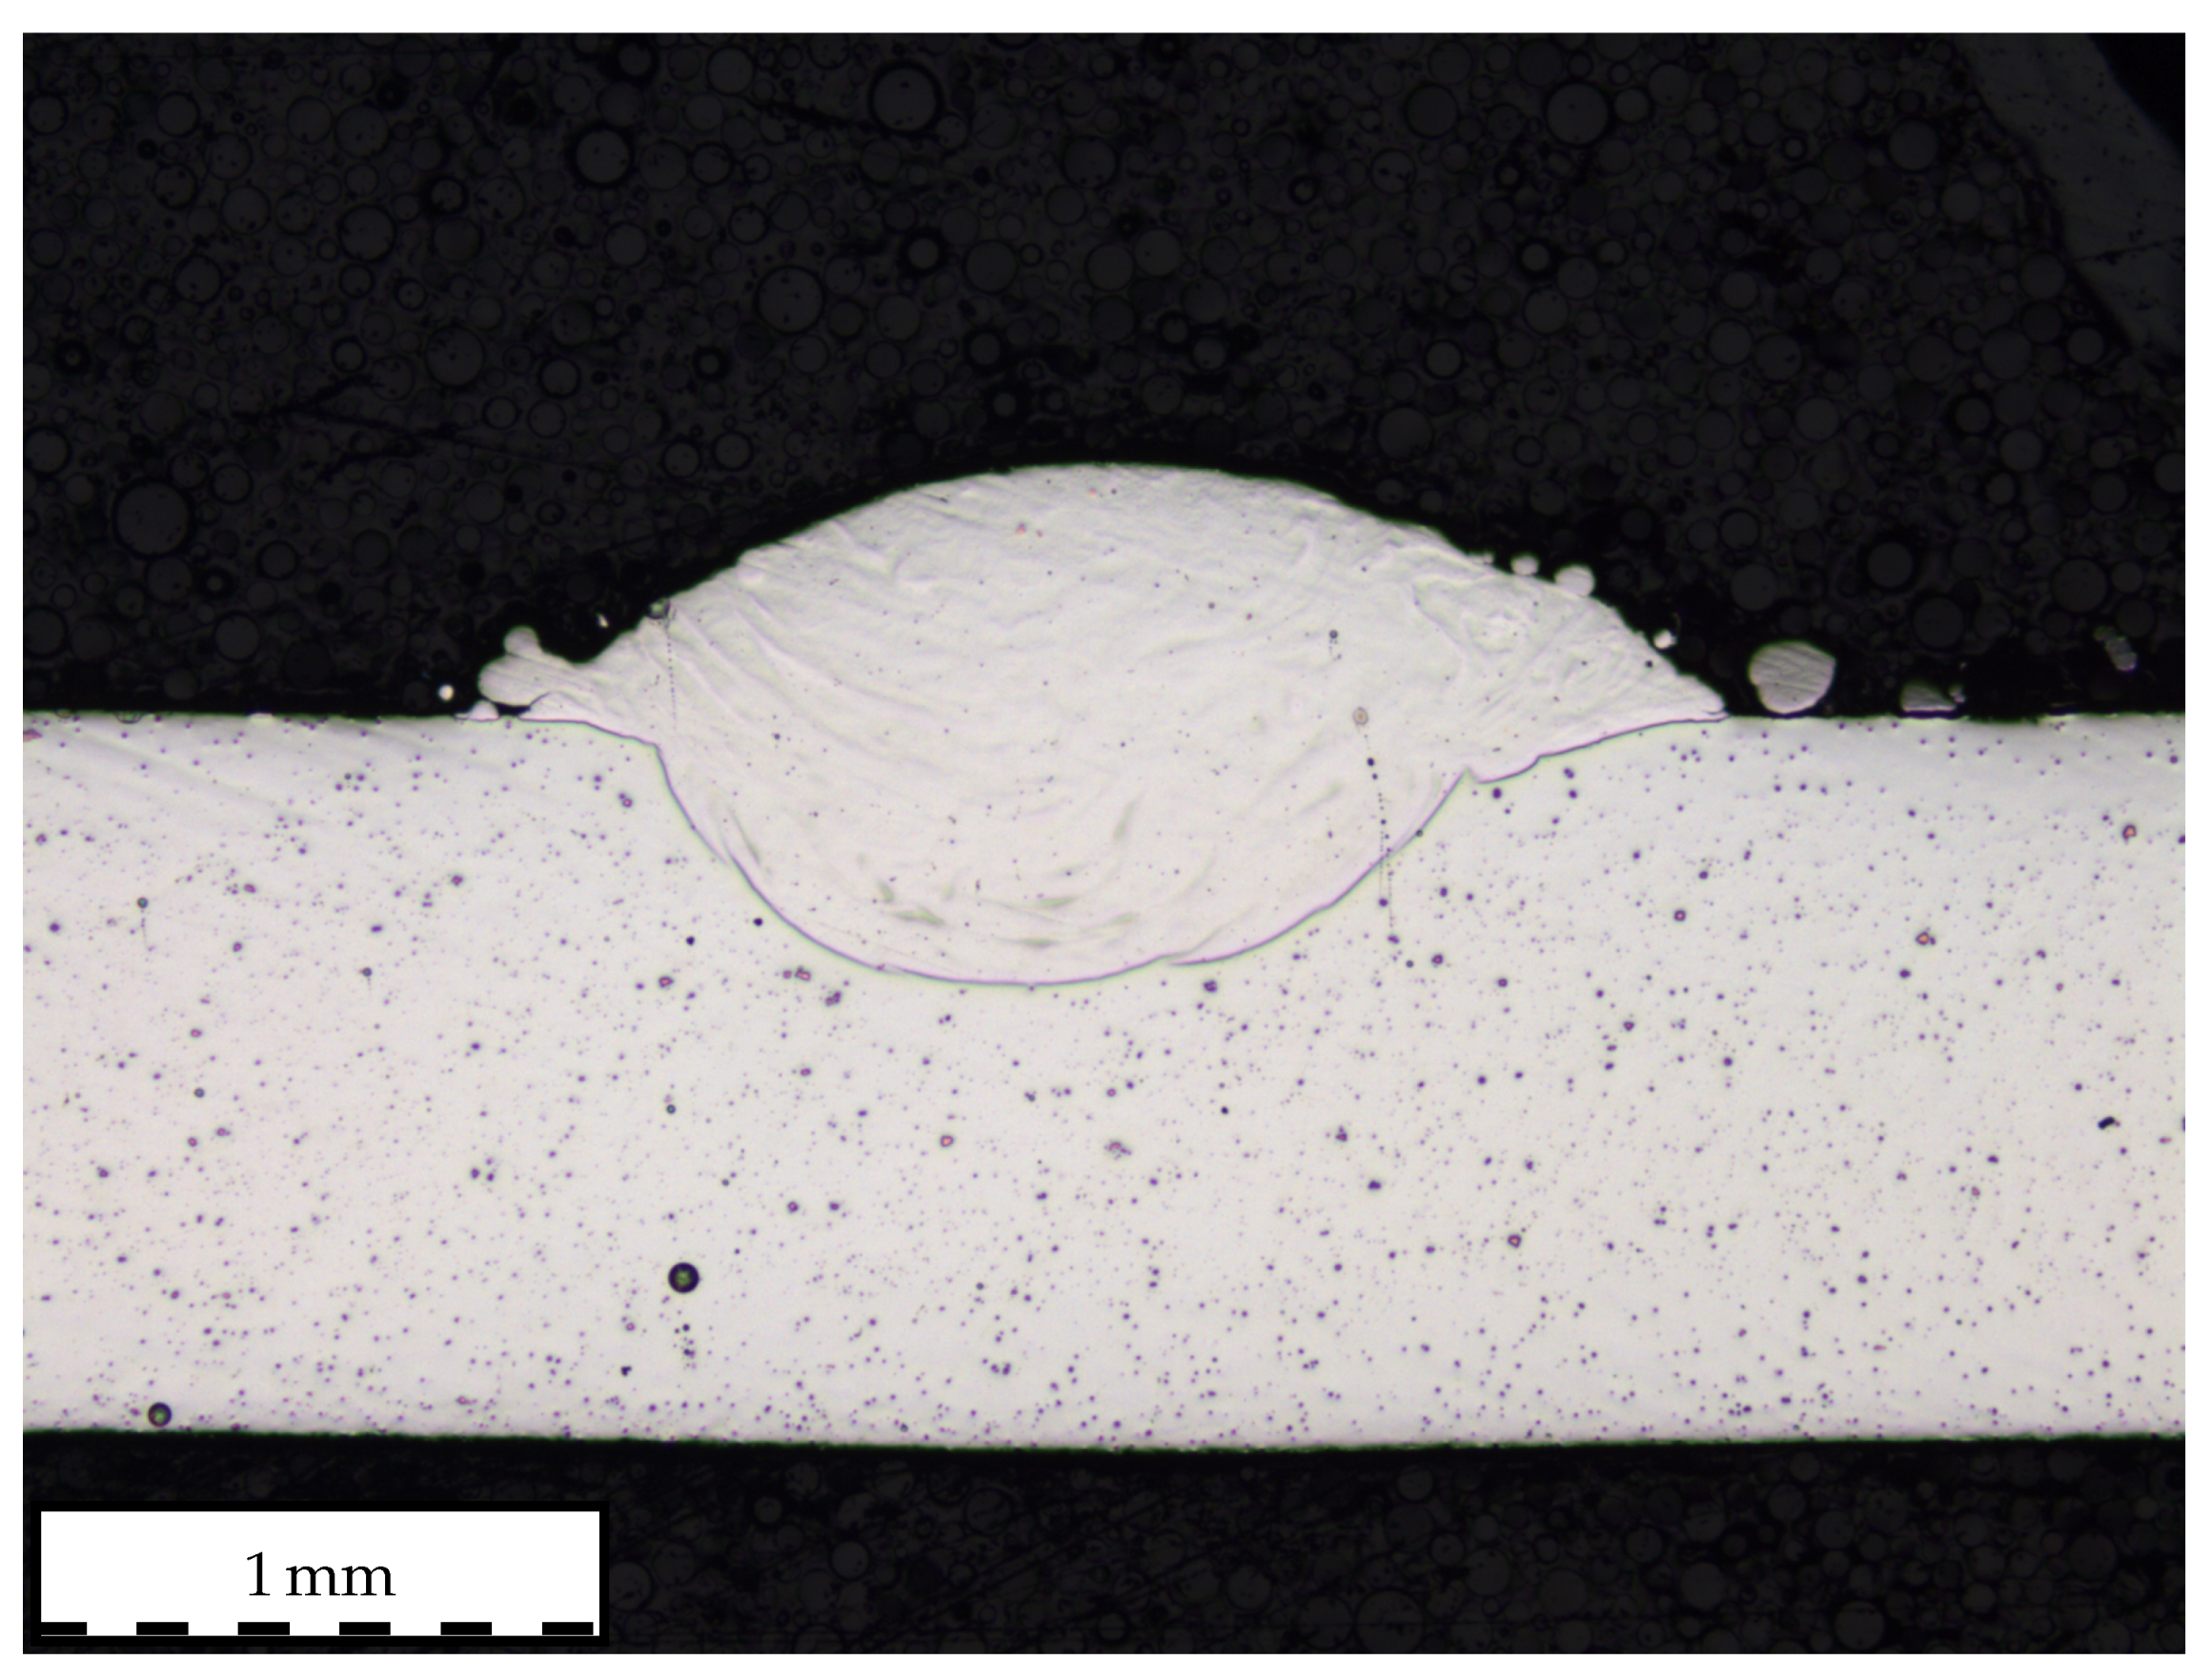
These findings also possess direct implications on the interrelationships of powder and laser defocussing on dilution depth, as can be deduced from
Figure 8e,f. Here, dilution depth is minimal for a default nozzle standoff of 12
and a focal offset of 0
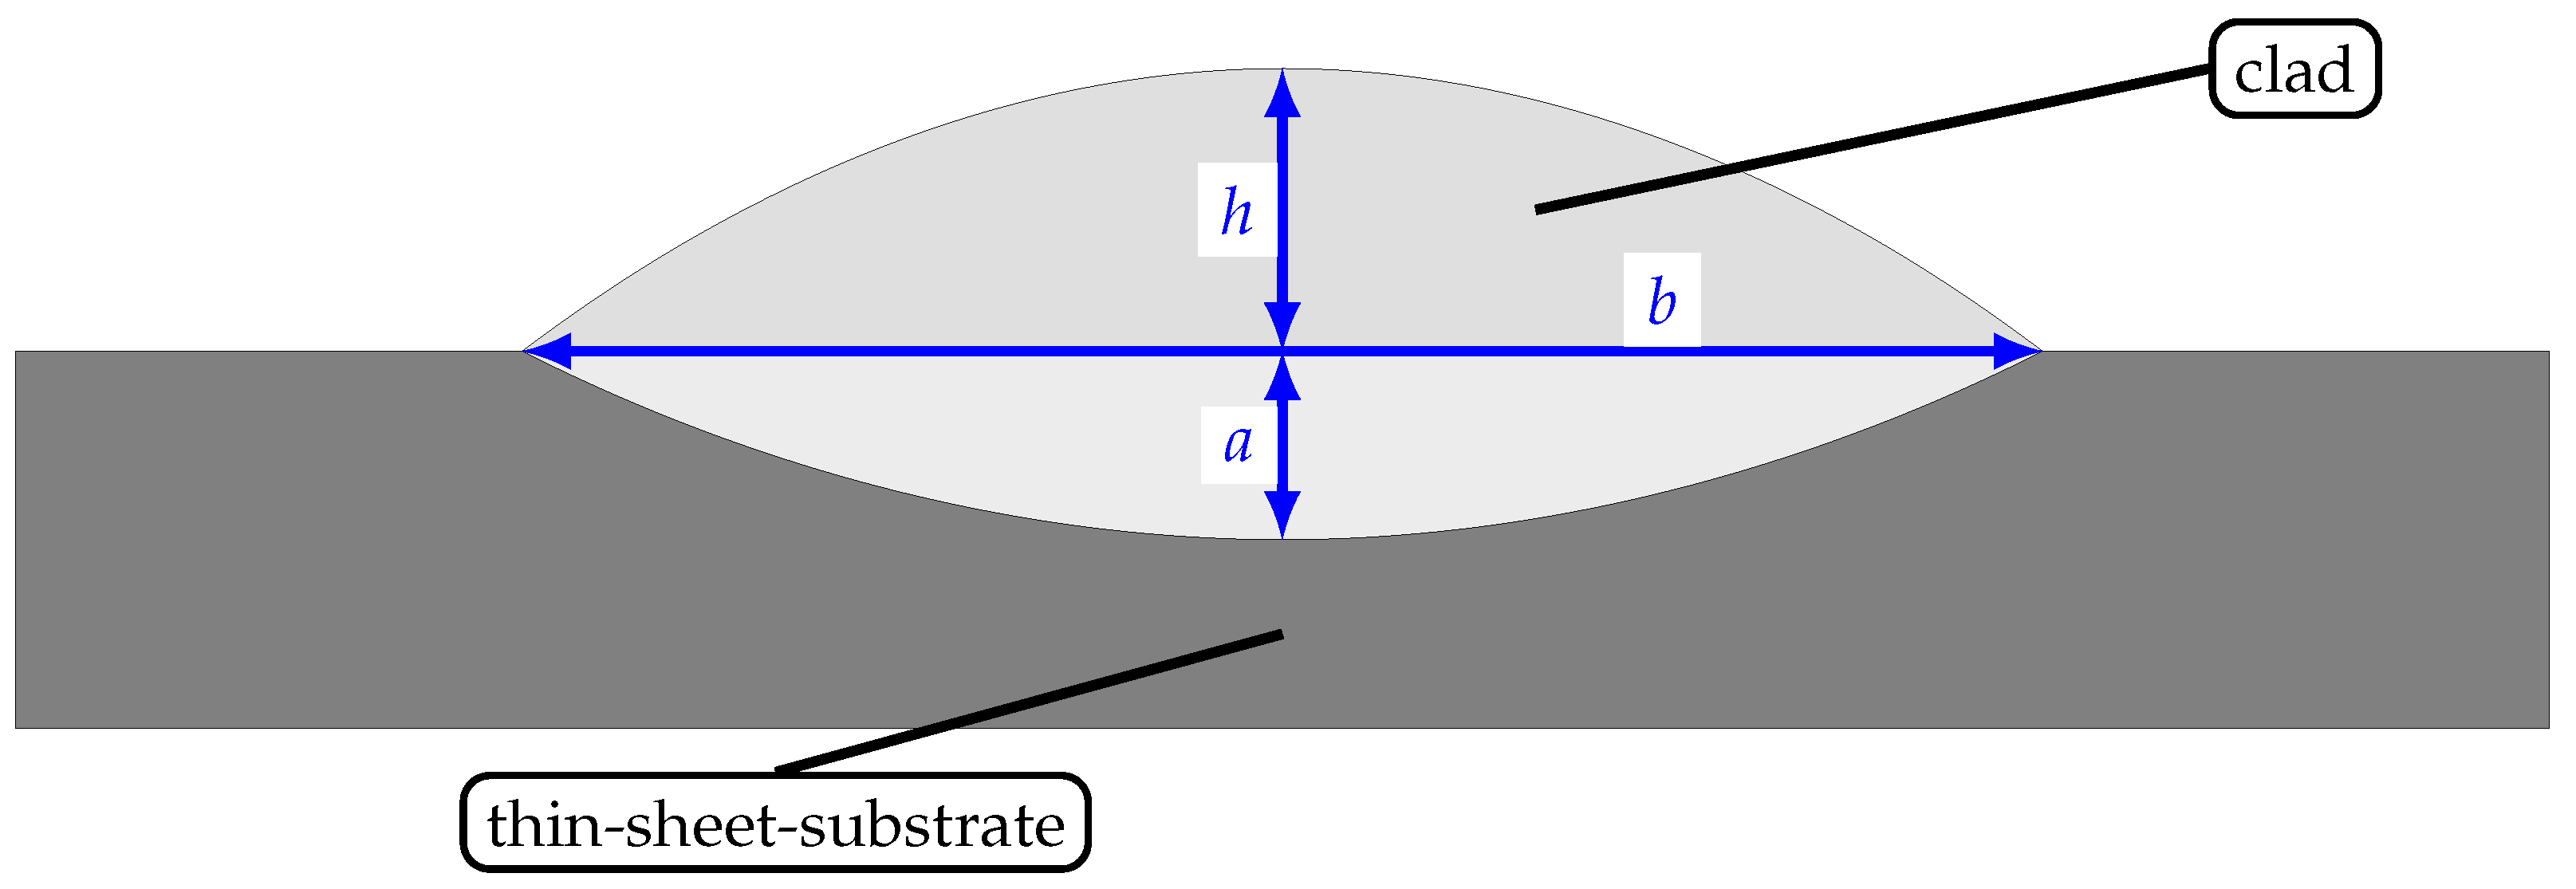
, which very well corresponds to the previous findings where clad height and, subsequently, powder utilization were maximized for analogue settings. Hence, it can be derived that laser and powder defocussing is also detrimental to dilution depth based on the explanations given in the preceding paragraph. As the interaction of laser beams and powder streams is mitigated through the incumbent change of intensity distribution, more laser light can effectively reach the substrate surface, cause increased melting and, thus, dilution depth. An example of one obtained clad geometry during high-speed laser cladding of thin-sheet substrates is depicted in
Figure 9.


