Article

Design of Novel Photocatalytic Films for the Protection of Architectural Surfaces via the Incorporation of Green Photocatalysts

by
Dimitrios Stefanakis
1,
Themis Krasoudaki
1,
Anastasios-Ioannis Kaditis
1,
Asterios Bakolas
2 and
Pagona-Noni Maravelaki
1,*
1
Laboratory of Materials of Cultural Heritage and Modern Building, School of Architecture, Technical University of Crete, 73100 Chania, Greece
2
School of Chemical Engineering, National Technical University of Athens, 15780 Athens, Greece
*
Author to whom correspondence should be addressed.
Coatings 2021, 11(8), 934; https://doi.org/10.3390/coatings11080934
Submission received: 8 July 2021 / Revised: 26 July 2021 / Accepted: 31 July 2021 / Published: 4 August 2021
(This article belongs to the Special Issue Advanced Coatings for Cultural Heritage Preservation)

Abstract

:
In conservation science the demand of multifunctional green materials displaying water repellency, consolidation, resistance to organic pollutants and pigments is constantly increasing. This research developed a green nanocomposite exhibiting photocatalytic, hydrophobic, consolidation and self-cleaning properties. This was achieved by synthesizing a TiO2 photocatalyst enriched with carbon dots (C-dots) and successfully incorporated into a tetraethoxysilane nanocomposite modified with nano-calcium oxalate and polydimethylsiloxane. The TiO2/C-dots that were prepared with a simple, low temperature, cost-effective and large-scale procedure were assessed via analytical and spectroscopic techniques and were resulted in anatase structure ranging in size from 10 to 40 nm. Photooxidation measurements displayed that TiO2/C-dots nanoparticles could photodegrade completely Methyl Orange (MO) under UV and visible irradiation after 120 min. The photocatalytic performance of the nanocomposite with TiO2/C-dots resulted promising under UV after longer irradiation time. The degradation of MO was faster on bulk xerogels containing the TiO2/C-dots than the corresponding ones with TiO2. The treatment of concrete, limestone and lime mortars with the nanocomposite proved to be compatible with the substrates in terms of aesthetical aspects. This study demonstrates encouraging potential for large-scale production of a multifunctional protective composite that offers hydrophobicity, self-cleaning properties and consolidation to architectural surfaces.

1. Introduction

Nanotitania (TiO2) is among the highest widely used photocatalytic material due to its semiconductor characteristics [1]. The basic principle of TiO2’s photocatalytic action involves the absorption of electromagnetic radiation; afterwards, an electron is excited from the valence band and transferred to conduction band, generating a positive electron deficiency in the valence band. The existence of TiO2 nanoparticles generates electrons and holes that consequently participate to chemical reactions. TiO2 is polymorphous, existing in three fundamental crystal forms: (a) brookite, (b) rutile and (c) anatase [2]. Nanotitania has gained considerable attention due to its scientific and technological importance, in a broad range of fields, including solar cells, environmental remediation, photocatalysis, sensors and clean energy production [3]. Titania nanoparticles offer significant advantages including non-toxicity, chemical stability, low-cost production, and biocompatibility [4].
However, TiO2 suffers from several disadvantages, limiting its practical efficiency in photocatalysis. Among them, the large band energy gap and relative slow reaction rate of TiO2 considerably limits the utilization of solar energy as a sustainable source. This leads to quite slow photocatalytic degradation rates of the desired chemical transformations and poor solar efficiency. With the aim of increasing the photocatalytic characteristics of nanotitania, the extension range of light absorption to the visible region, as well as the reduction of photoinduced charge carriers’ recombination is crucial. The coupling of TiO2 with other narrow band gap semiconductors is necessary for the improvement of photocatalytic activity.
An effective strategy considers the photo-activation of nanotitania under solar radiation energy. In this case, the semiconductor enhancement is obtained under longer wavelengths corresponding to the visible region. This can be achieved by doping TiO2 with various elements, metal and non-metal that increase its photocatalytic activity, through the development of new energy states near to the conduction band [5,6].
In the present study, carbon dots (denoted C-dots) were incorporated into TiO2 nanoparticles in order to increase the photocatalytic activity in the UV and mainly in the visible light region. C-dots were classified as a relatively new category of photoluminescent nanocarbon materials and have been considered as upcoming for a wide range of applications in recent years [7]. The innovation of these materials relies on the strong wavelength-dependent photoluminescence [8]. Moreover, some attractive properties of C-dots include their nanosize, surface functionality and absence of toxicity [9]. In contrast to quantum dots (QDs), which contain heavy metals, C-dots display remarkable biocompatibility [10]. In addition, the cost effective, simple and favorable synthetic -process of C-dots allow their production in large scale from various raw materials. Due to all these unique characteristics, C-dots have drawn the attention with their widespread practical applications in catalysis, biosensing, energy, bioimaging and drug delivery [11].
Until today, there is a limited number of reports about the use of C-dots on TiO2, in which the methodology of syntheses often involves complex and harmful processes. In particular, a facile study was reported for the fabrication of TiO2 by utilizing C-dots of citric acid, urine and glycerol [12]. However, the usage of Teflon lined stainless steel autoclave is considered as a limiting factor for large scale production. Another work involves the decoration of TiO2 matrix with silica—C-dots from rice husk, in order to reduce the limitations of TiO2 [13]. Nevertheless, the methodology is particularly demanding, including heating at 700 °C under nitrogen atmosphere. Carbon quantum dots/TiO2 nanocomposites were developed by a convenient hydrothermal procedure [14]. This study revealed that the anchored C-dots could improve the light absorption and as a result enhance their antimicrobial and catalytic properties. On the other hand, there are some issues concerning this study, including a puzzling preparation method of electrospinning, autoclave and calcination at 600 °C [14]. Carbon quantum dots with titanium dioxide nanostructures were also prepared exhibiting remarkable photocatalytic dye degradation under UV; nevertheless, no reference exists under visible light [15]. In another study, titania nanocomposites doped with carbon quantum dots were synthesized by a sol–gel process for photocatalytic degradation of cefradine and Rhodamine B [16]. However, the synthesis of particular C-dots requires a complicate process and the utilization of corrosive and harmful compounds like acetic acid and hydrogen peroxide. Luo et al. have taken TiO2 with nitrogen-doped C-dots as a model semiconductor system [17]. The disadvantage of this study relates to specialized equipment, such as Teflon-sealed autoclave and centrifuges, as well as complex procedures like calcination at 500 °C and spin coating method, which are restrictive for large scale production.
Another important matter is the utilization of the photocatalysts in coatings in order to create self-cleaning surfaces. Self-cleaning coatings are widely applied in the textile industry, the automobile and aerospace industry, solar modules, paints, air and water purification and the building industry [18,19]. Especially, the development of multifunctional photocatalytic construction materials or coatings that are compatible with already existing architectural structures, is of great interest. The ability of the photocatalysts and especially of TiO2 to decompose efficiently liquid and gaseous, organic and inorganic pollutants has raised the interest towards its use in self-cleaning surface applications the last decades. Furthermore, there is a tendency towards the development of multifunctional protective coatings that combine various properties such as consolidation, water repellency, along with reduction of polluting molecules, stain resistance and self-sterilization. Towards this goal, various studies have explored the potential of embedding the photocatalyst into the bulk of construction materials, such as mortars and concrete [20], or incorporating it in already existing organic and inorganic binders and coatings [21,22,23]. The major concerns regarding these applications are the maintenance of the photocatalysis yield and the eventual deterioration of the substrate.
In this research study, two simple and low-cost chemical compounds, citric acid and hydroxylamine, were utilized as precursors for the synthesis of C-dots. Subsequently, a simple and large-scale synthesis of TiO2 was carried out in the presence of C-dots yielding the TiO2/C-dots. Both C-dots and TiO2/C-dots were physicochemically characterized by a variety of techniques, including spectroscopies, SEM and TEM microscopies, and X ray diffraction (XRD). Finally, the ability of TiO2/C-dots to produce reactive radicals was studied via the photodegradation of an organic dye, Methylene Orange (MO). The innovation of this work is related to the facile and convenient synthesis of the enriched TiO2 with C-dots, as well as the effective degradation of MO after radiation in visible region. Moreover, this study manages to incorporate the developed photocatalyst into a novel protective/consolidation agent previously designed in the laboratory named FX-C and tested on limestone, lime mortar and concrete specimens [24].
FX-C is an innovative material used to consolidate and protect monumental surfaces. Its main components are tetraethoxysilane (TEOS), polydimethyl siloxane (PDMS) and nano calcium oxalate (nano-CaOx). Silicon compounds, such as TEOS, are used as consolidants on architectural surfaces, due to their ability as oligomers to penetrate deeply into the surface and polymerize into its pores. The silicon-oxygen groups form strong bonds with the substrates that contain hydroxyl groups [25,26]. PDMS is a hydrophobic agent and, as an organosilane, develops chemical bonds with TEOS forming a protective silica network, contributing to the prevention of cracking of the treated surface. FX-C performance is also enhanced with nano-CaOx, which is found as a component of patina layer onto monumental surfaces, formed by the degradation of previously applied protective treatments and/or biological corrosion [27]. The nano-CaOx increases the chemical affinity between the protective agent and treated surface and simultaneously performs as an extra protective layer. The sol product derived from a one pot synthesis can be easily applied onto architectural surfaces, enhancing their mechanical properties and forming a hydrophobic film [24]. The dispersion of photocatalysts into FX-C intends to deliver self-cleaning properties to the protective film, thus contributing to the decomposition of organic stains and pollutants. The photocatalytic properties of the nanocomposite were studied, as above, via the photodegradation of MO. The results break new ground for the development of green smart building materials and protective coatings for the improvement of air quality as well as for disinfection purposes, taking into consideration the excellent antifungal and antibacterial properties of TiO2 against a broad range of microorganisms [28].

2. Materials and Methods

2.1. Chemical Materials

Titanium (IV) Isοprοpοxide (TTIP, ≥97.0%), Ethanol (EtOH, ≥99.8%), Citric acid (monohydrate, ≥99.0%), Hydroxylamine Hydrochloride (99%) were obtained from Sigma-Aldrich.

2.2. Synthesis of C-Dots

C-dots were prepared by modifying an already published method [29]. Briefly, citric acid and hydroxylamine, at a molar ratio of 1:3, were dissolved into 5 mL ultrapure water. The solution was inserted into a 50 mL round-bottom flask and was boiled in a preheated oven at 200 °C for 5 min. During this procedure, the colorless solution rapidly begins to boil and finally evaporates leaving a dark brown solid on the bottom of the flask. An appropriate amount of water is added to the round-bottom flask of the reaction in order to form a yellow-cοlοred suspension. Finally, the product was filtered with 0.2 μm filter to remove the aggregates and the supernatant liquid was collected.

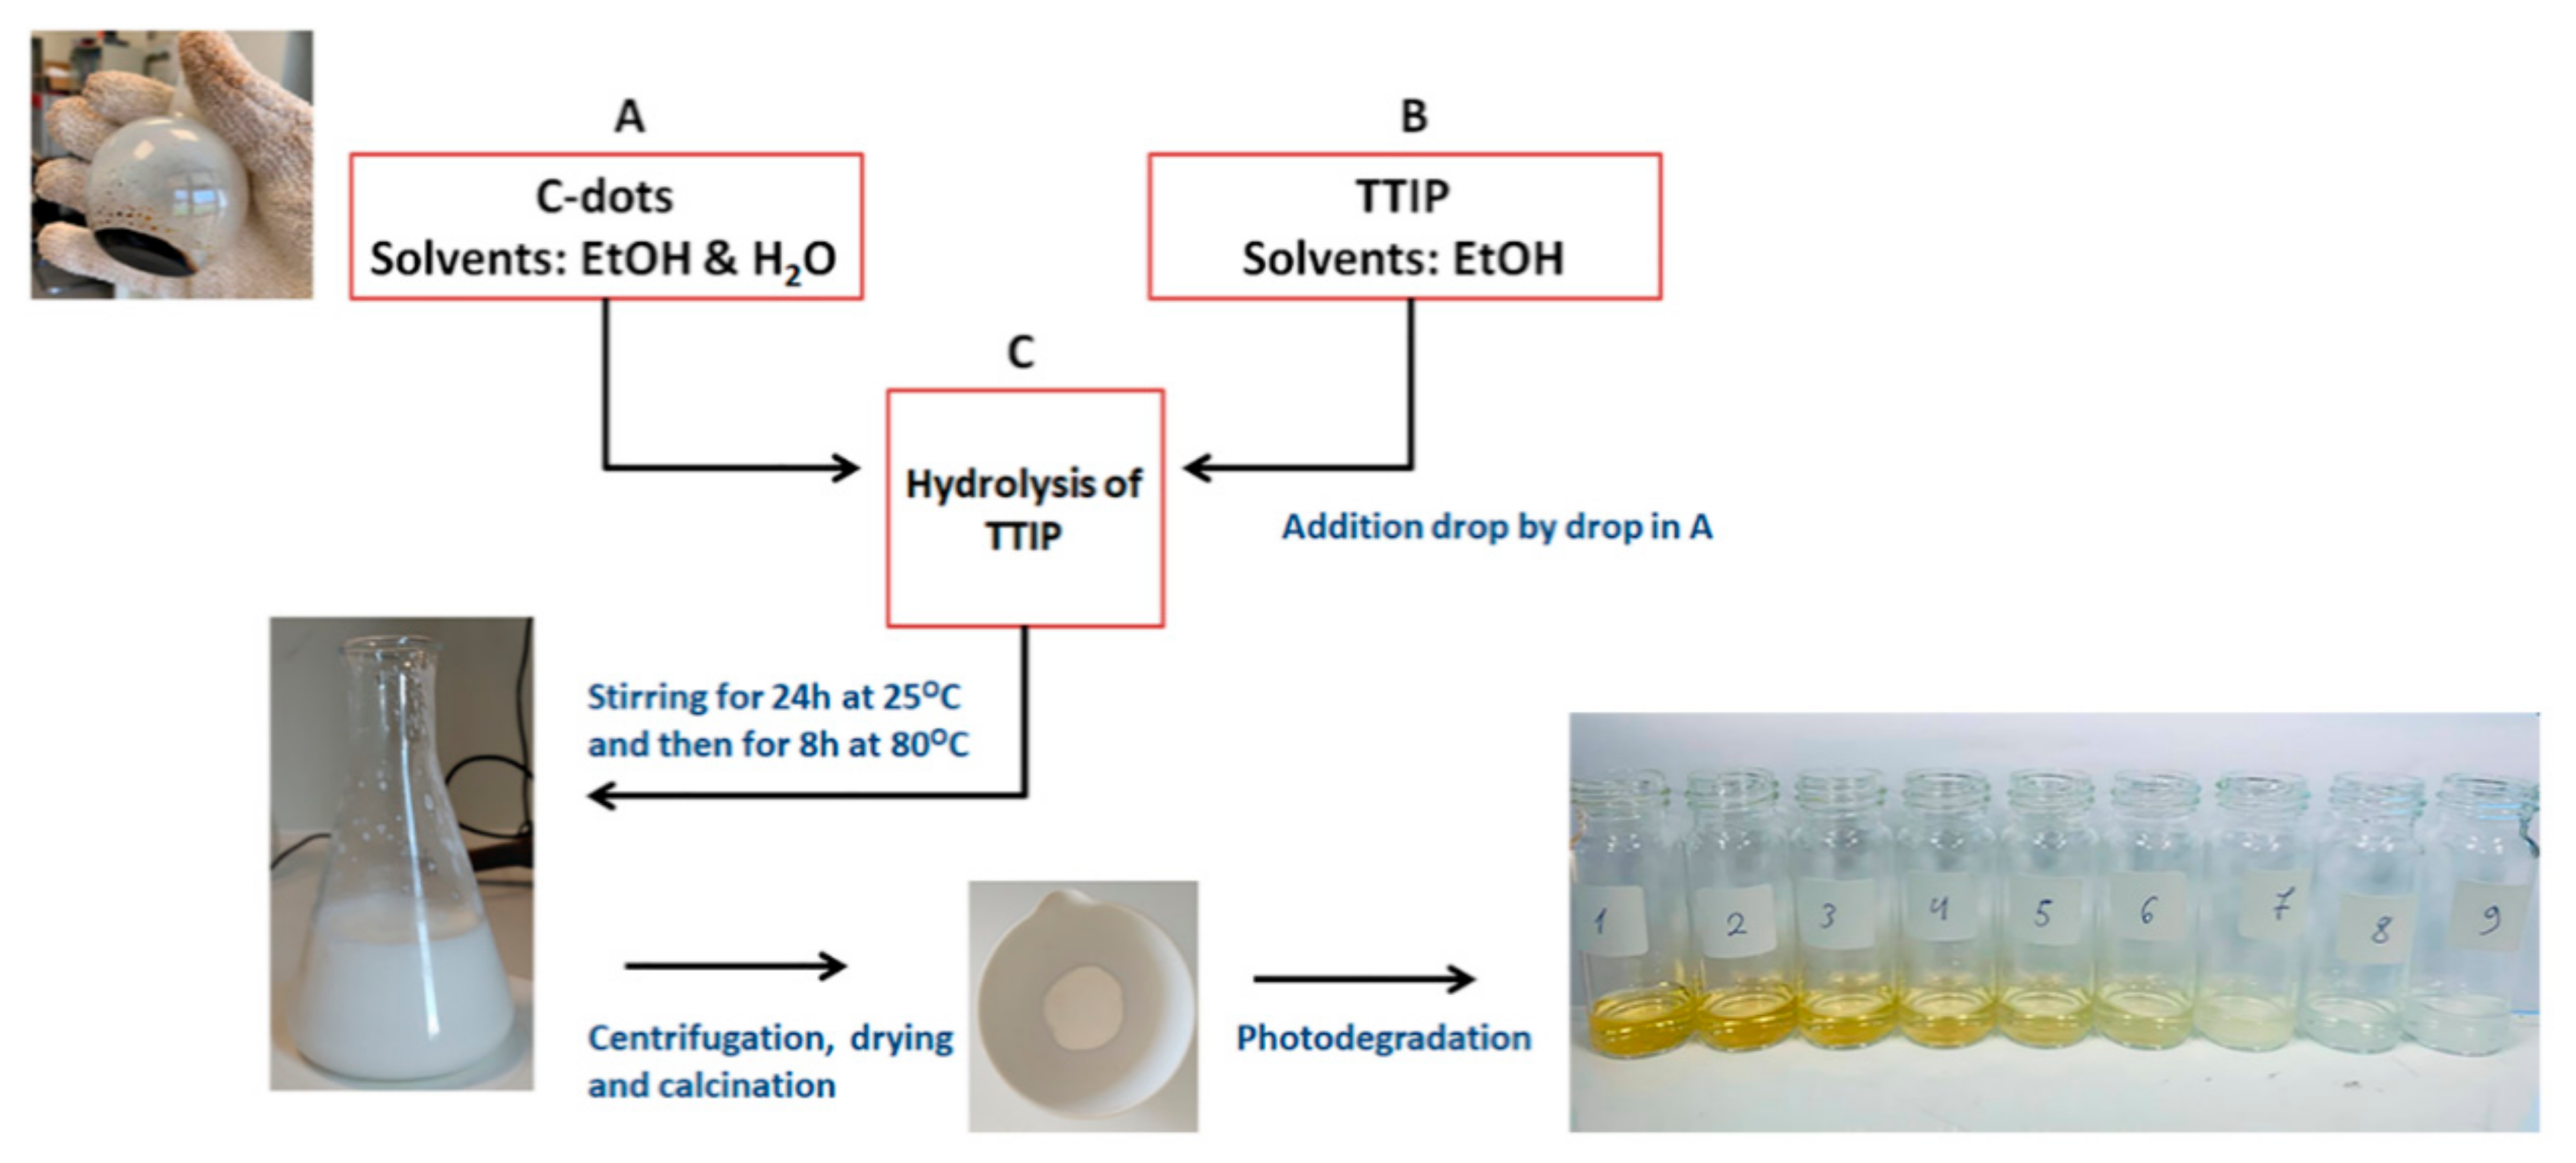
2.3. Synthesis of TiO2/C-Dots and Pure TiO2

A solution of 200 mg/mL C-dots was added into a solution of ethanol and nanopure water (1:1) (designated as Sol A). The adjustment of pH close to 2.5 was carried out with drops of sulfuric acid. Next, TTIP was dissolved in ethanol, producing solution B, following by drop-by-drop addition into Sol A. The solution was incubated overnight at room temperature, producing solution C. In the next step, solution C was heated for 8 h at 80 °C, so as the hydrolysis of TTIP and the disaggregation procedure of the prepared nanotitania to be carried out. Afterwards, the mixture of TiO2 with incubated C-dots was separated after centrifugation. The precipitate was dried at 80 °C and powdered. Eventually, the pulverized material was heated for 120 min at 200 °C to develop the functional TiO2/C-dots nanoparticles. The prepared product displays a slightly yellow color (Figure 1).
The same procedure was followed for the synthesis of TiO2 without the addition of C-dots (control). TTIP dissolved in ethanol was added into a solution of ethanol and nanopure water, drop-by-drop and incubated overnight under magnetic stirring. Afterwards, the mixture of TiO2 was heated for 8 h at 80 °C under reflux conditions. In the next step, the prepared TiO2 nanoparticles were separated with centrifugation and washed with water. The precipitate was dried at an oven and powdered. Finally, this powder was heated for 120 min at 200 °C to produce TiO2 nanoparticles.

2.4. Incorporation of Photocatalysts into the Protective Agent

The prepared photocatalysts were dispersed into the protective agent FX-C that was previously synthesized in the laboratory and stored in the form of sol. The concentration of the photocatalyst into the protective agent is 3.33% w/w.

2.5. Application of Photocatalytic Films onto Substrates

In order to evaluate the performance of the novel photocatalytic films in conservation applications, the protective agents were applied onto three different types of building materials: (a) porous biomicritic limestone, called Alfas, with a porosity ranging from 25 to 35% and pore size distribution from 1 to 10 μm; (b) concrete samples that were prepared with coarse calcareous and fine siliceous aggregates and (c) lime mortars prepared with natural hydraulic lime (NHL), metakaolin, coarse carbonaceous and quartz aggregates and carbonaceous sand ranging in diameter from 0.4 mm. Further information on the mix design of the treated specimens can be found in Table S1. The protective agent was brushed gently onto the specimens’ surface until saturation. The amount of the protective agent used for each specimen is presented in Table S2. The aesthetic modification of the substrates’ surface was evaluated by colorimetric analysis using a portable Konica Minolta spectrophotometer CM-2600d.

2.6. Characterization

High-resolution TEM images of C-dots and TiO2/C-dots were obtained on a JEOL JEM-2100 Transmission Electron Microscope (JEOL Ltd, Tokyo, Japan), operated at 80 and 200 kV, respectively. TEM sample preparation includes the evaporation of sample suspension after drop-casting on Formvar/Carbon coated TEM grids (Analytical Instruments S.A. Thane, India). Statistical size-distribution histograms were determined by using transmission electron microscope, upon counting and measuring the diameter distribution, utilizing the ImageJ software (Version 1.46r). The interlayer distance of TiO2 planes was estimated with Digital Micrograph (Gatan Inc., Pleasanton, CA, USA). SEM images were recorded according to standard procedure. TiO2/C-dots nanoparticles were sprinkled on a two-sided carbon tape, coated with 100 Å gold utilizing a BAL-TEC SCD 050 Sputter Coater (BAL-TEC, Los Angeles, CA, USA). Samples were examined by using a JEOL JSM-6390LV Scanning Electron Microscope (JEOL Ltd, Tokyo, Japan), at 20 kV electron voltage. The determination of the chemical structure and composition of the prepared photocatalysts, TiO2 and TiO2/C-dots, and enhanced protective films were obtained via the Fourier Transform Infrared Spectroscopy (FTIR) (Thermo Fisher ScientificWaltham, MA, USA) absorption spectra. The spectra were recorded with a Thermo iS50 FTIR spectrometer (Thermo Fisher Scientific, Waltham, MA, USA), in the spectral range from 4.000 to 400 cm−1. Raman measurements were recorded utilizing an equipped Raman module in the sample compartment of the Scientific Nicolet iS50 spectrometer (Thermo Fisher Scientific, Waltham, MA, USA) operating with a laser at 1064 nm. Powder XRD patterns of the TiO2/C-dots nanoparticles were recorded on a D8 Advance X-Ray Diffractometer (Bruker, Billerica, MA, USA), with Cu Ka radiation at 35 mA and 35 kV and a Bruker Lynx Eye strip silicon detector Bruker, Billerica, MA, USA. Photoluminescence spectroscopic measurements were carried out on a Jobin-Yvon Horiba, Fluoro Max-P (SPEX) (Horiba, New York, NY, USA), with a CW Xenon arc lamp excitation source at 300 nm, with an emission range 290–700 nm. The UV–VIS diffuse reflectance spectra (DRS) of the photoactive TiO2 nanoparticles were obtained in the range of 200–800 nm utilizing UV–VIS Perkin-Elmer Lambda 35 spectrophotometer (Perkin Elmer, Waltham, MA, USA) equipped with a Labsphere RSA-PE 20. Optical bandgap energy was determined by analogous Tauc plots.

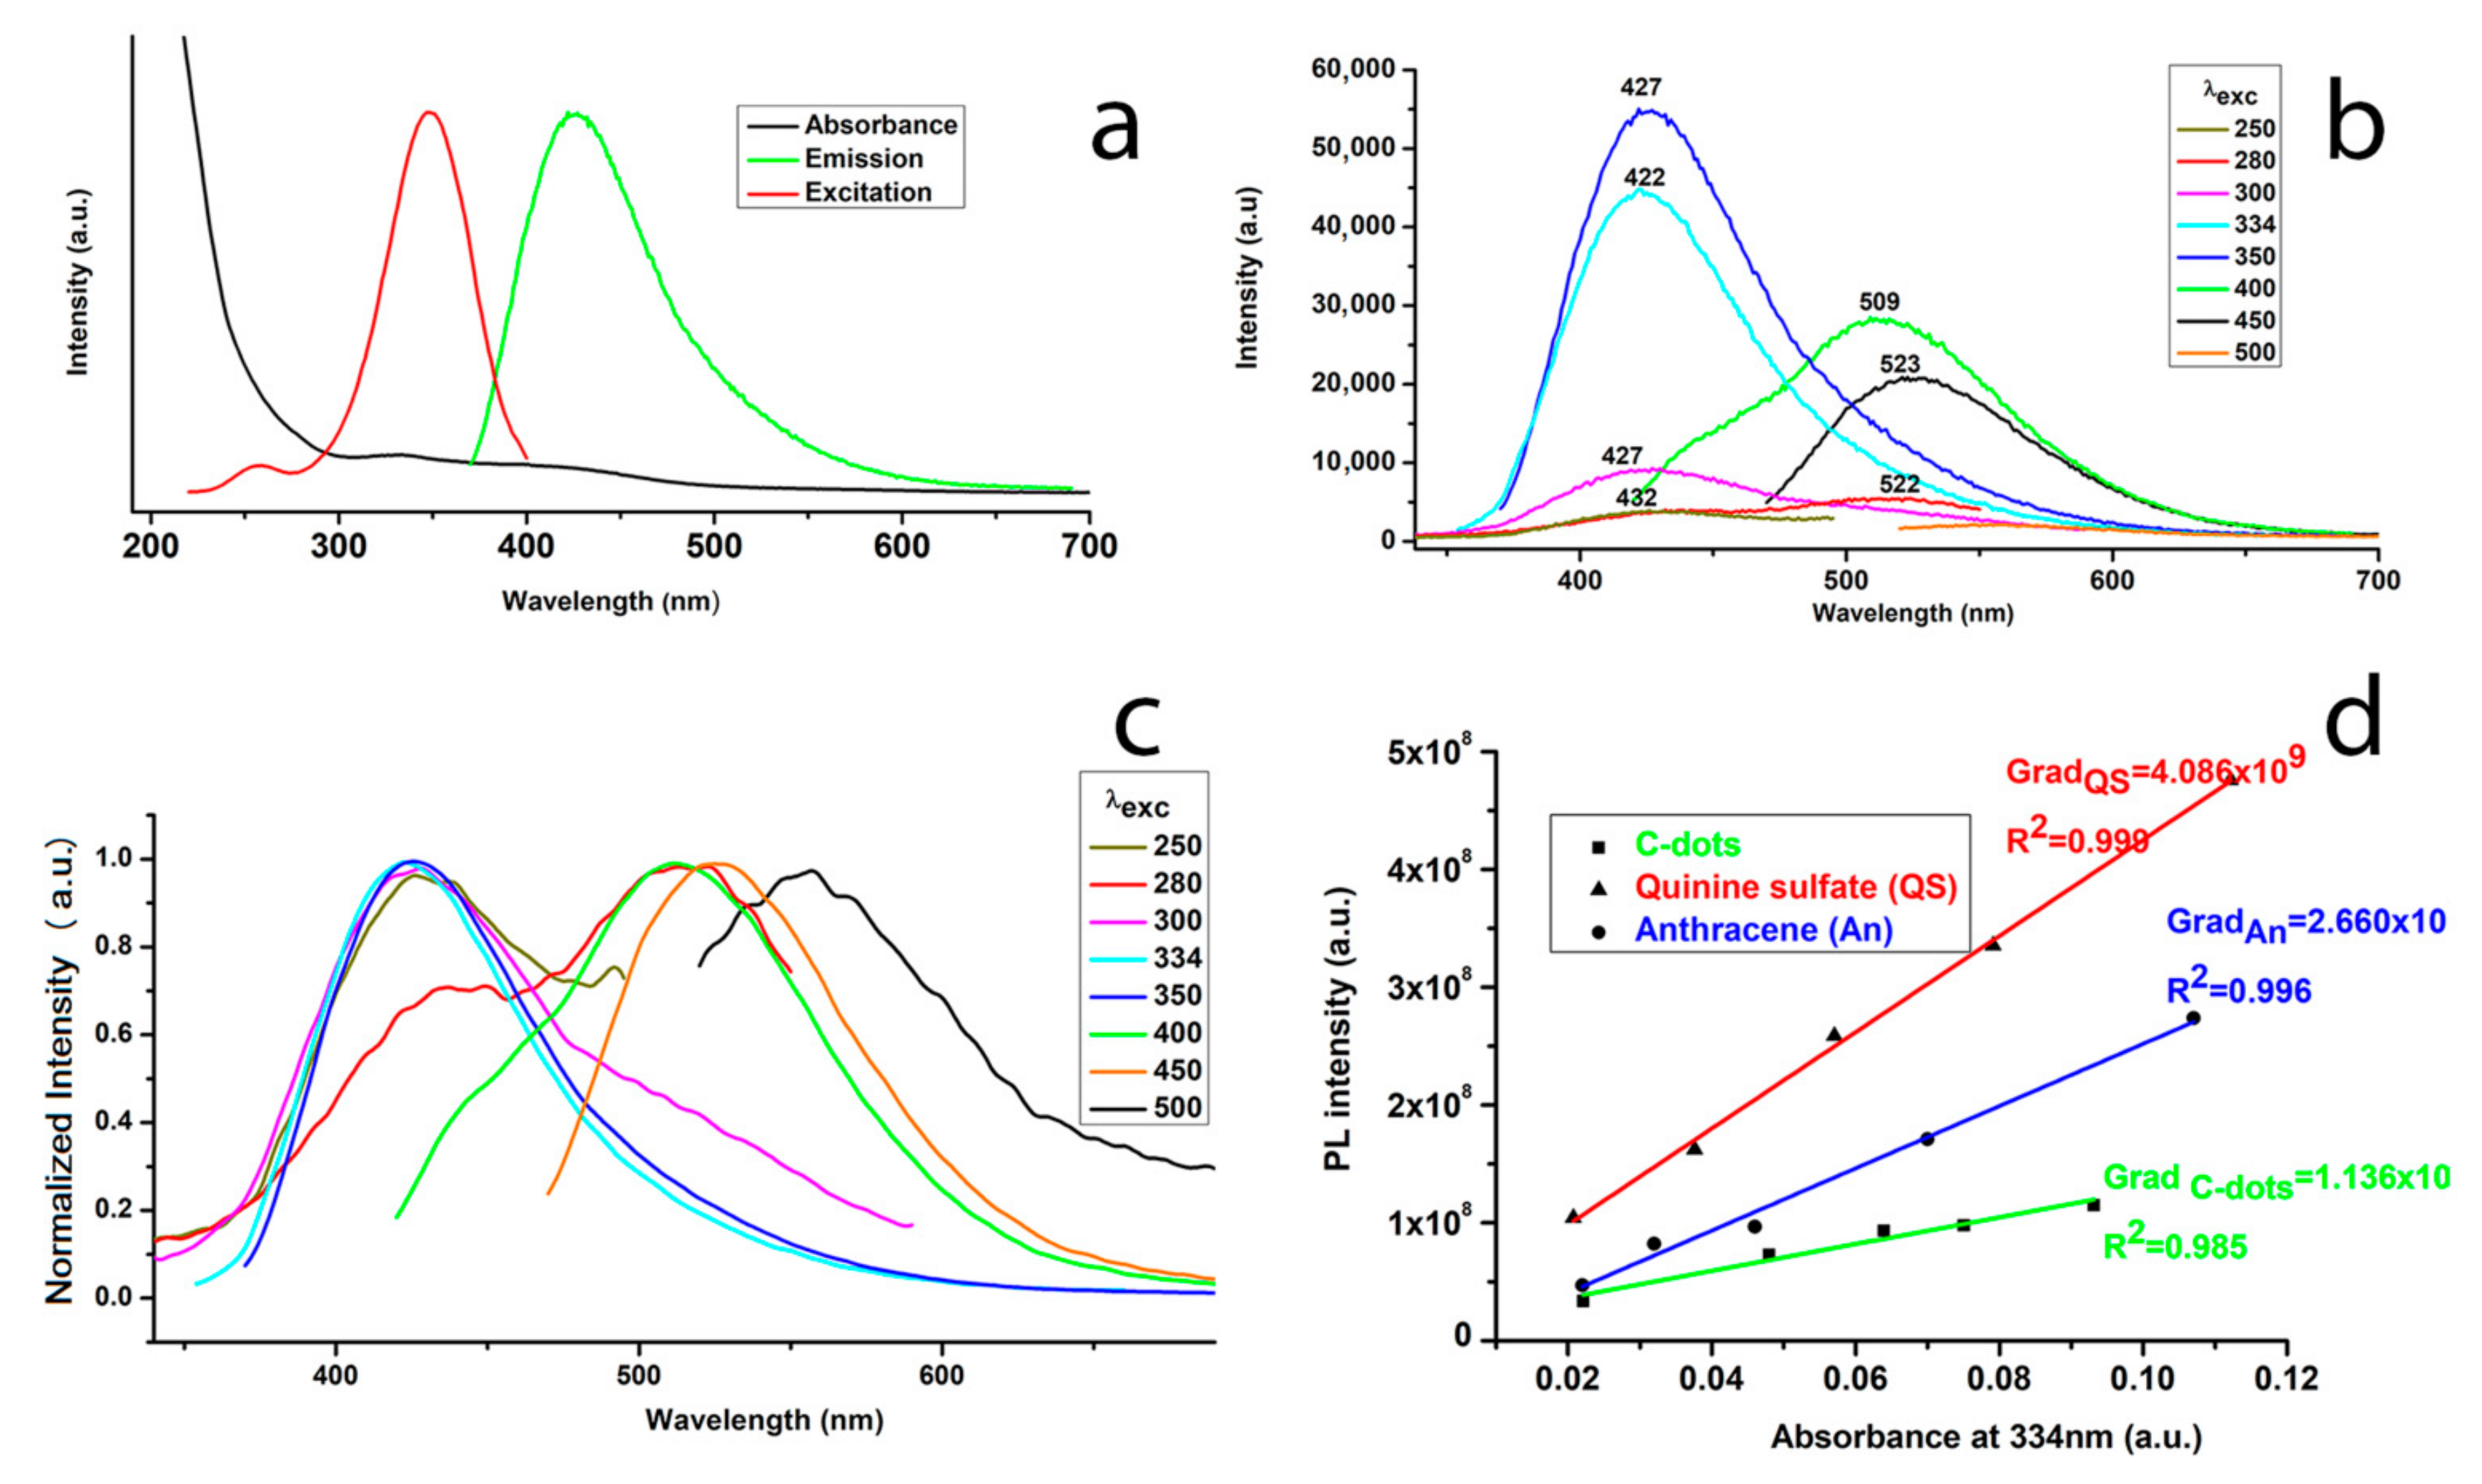
2.7. Quantum Yield Measurements

The photoluminescence quantum yield (Φ) of C-dots solution was calculated by comparing the integrated photoluminescence emission intensity against two reference fluorophores: anthracene (An) (λexc: 340 nm) and quinine sulphate (QS) (λexc: 348 nm). Anthracene (literature Φ = 0.27) was dissolved in ethanol (refractive index, n = 1.360). Quinine sulphate (literature Φ = 0.54) was dissolved in 0.1 M H2SO4 (refractive index, n = 1.333 [29]. C-dots were dissolved in distilled water (n = 1.333). The photoluminescence quantum yield was calculated using the following equation:
ΦX = ΦST·(GradX/GradST)·(n2X/n2ST)
where ST and X represent the standard and analyte, respectively. Φ: photoluminescence quantum yield, Grad: the slope of the line fitting integrated photoluminescence intensity vs. solution absorbance, n: refractive index of the solvent [30].
Absorbance values of solutions were maintained below 0.10 at the excitation wavelengths (340, 348 nm) in order to avoid absorption effects. Typically, a 10 mm optical path length cuvette was utilized. Excitation and emission slit widths were set such that excitation and emission bandwidths were 1.0 and 5.0 nm, respectively, when recording the photoluminescence emission spectra.

2.8. Photocatalytic Activity of TiO2/C-Dots Nanoparticles

The photocatalytic properties of TiO2 and TiO2/C-dots samples (photocatalysts) were studied for their ability to degrade aqueous solution of MO. The photodegradation of MO was carried out through simulation of solar radiation. As a light source, a 150 W Xenon lamp was utilized (solar simulator, Oriel-Newport 96000, Newport, Irvine, CA, USA) for the photocatalysis measurements. A filter with wavelength cut-off lower than 420 nm was utilized to sever UV light. During the photodegradation experiment, TiO2 was dispersed in 50 mL of MO aqueous solution (5 ppm), giving a concentration of TiO2 nanoparticles (with or without C-dots) equal to 0.8 mg/mL Before dye degradation experiment, the mixture of TiO2 with MO was incubated in the absence of light for 0.5 h to reach the adsorption–desorption equilibrium between MO and TiO2 samples. Finally, a beaker with a dispersion of MO with the photocatalyst was irradiated under the solar lamp at a distance of 10 cm. Periodically, the dispersion sample was collected and analyzed by UV–VIS spectroscopy.

2.9. Photocatalytic Activity of Protective Films

In the first place, the photocatalytic properties of the enhanced protective films were measured via the same method described above. The quantity of the enhanced protective films was selected accordingly, in order to keep the photocatalysts concentration in the aqueous MO solution equal to 0.8 mg/mL. The xerogel was grinded to thin powder, and the ability of the incorporated photocatalyst to generate radicals that decompose MO was tested under simulation of UV and solar radiation.
In addition, a supplementary experiment was carried out in order to determine the photocatalytic ability of the bulk xerogel. A thicker xerogel was formed by letting 3 gr of sol to solidify, and a drop of MO was placed onto its surface. The photocatalytic degradation of the drop was determined macroscopically and spectrophotometrically with a portable Konica Minolta spectrophotometer CM-2600d adapted with a D65 illuminant at 8-degree viewing, in wavelength range from 360 to 740 nm. Specifically, the decolorization of the applied drop was monitored by measuring differences in color of the spotted area with the passage of time. These differences were expressed as values of the CIELab color space: a*, b* and L*. The positive a* and b* values represent red and yellow, respectively, whereas the negative a* and b* values represent green and blue, accordingly. The L* value represents the luminance and ranges between 0, that corresponds to black, and 100, that corresponds to white. The color difference can be then calculated as follows [31]:
Δ E = Δ L * 2 + Δ a * 2 + Δ b * 2

3. Results

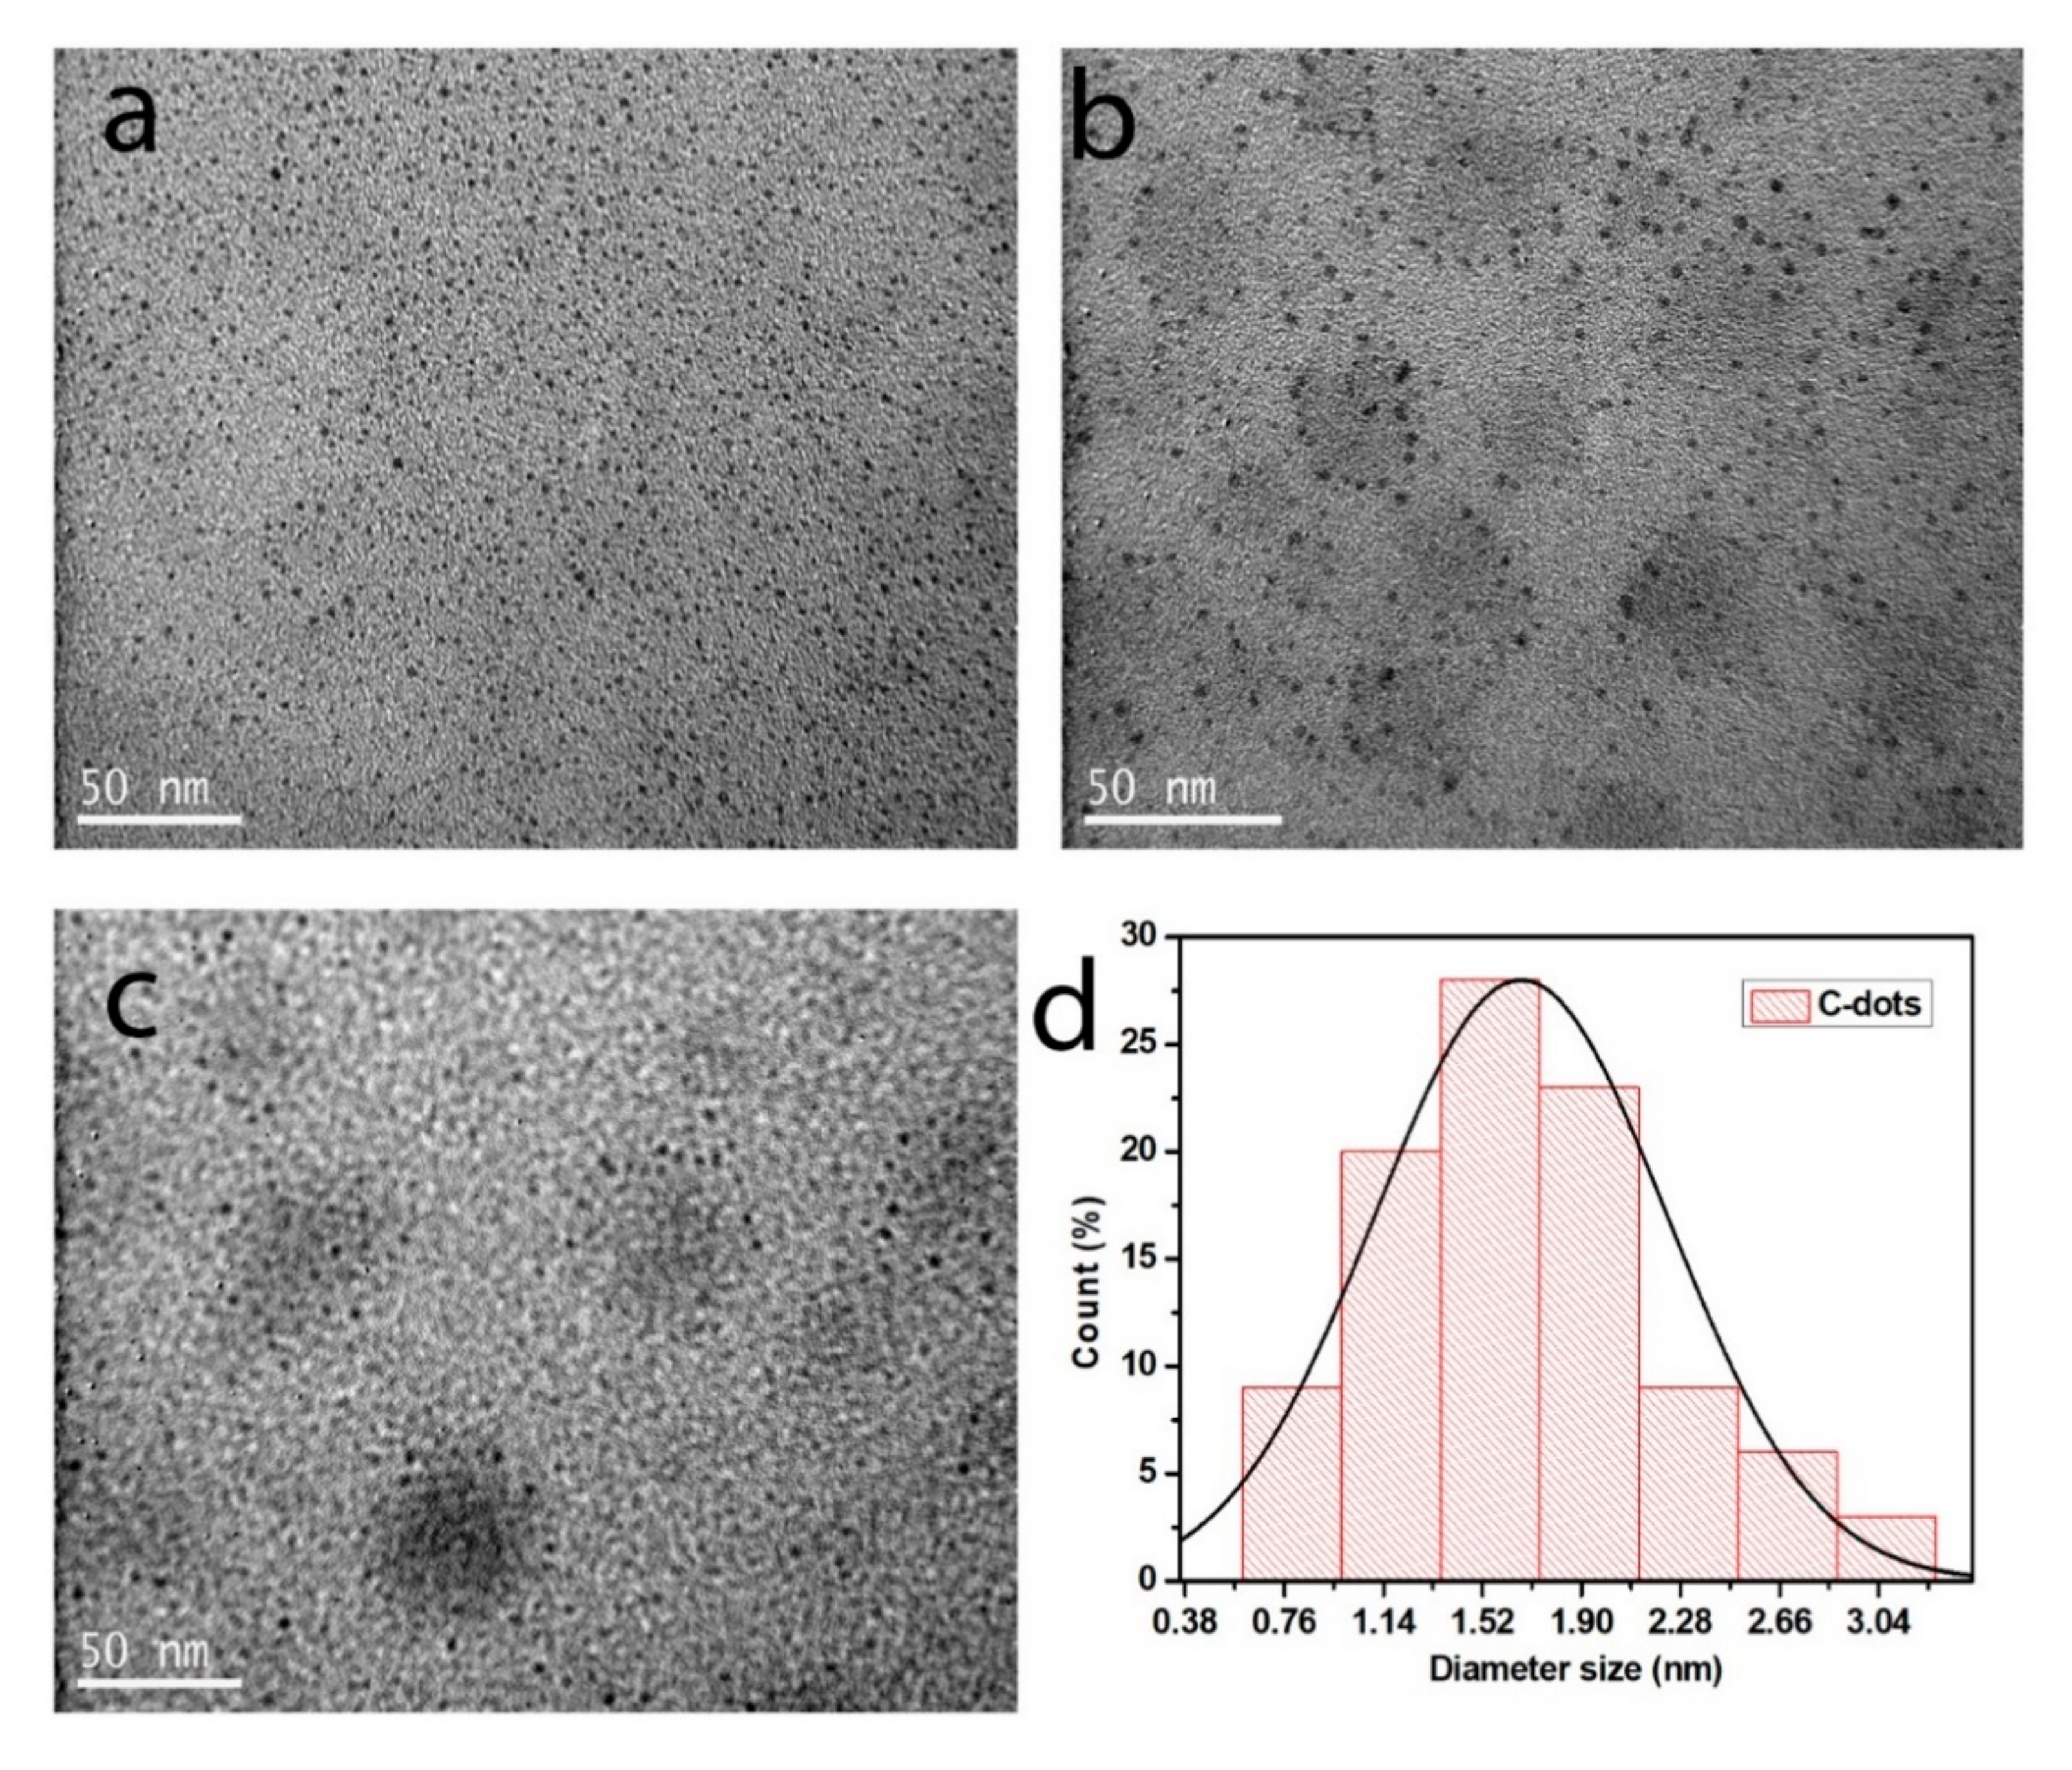
3.1. TEM and Optical Characterization of C-Dots

As displayed in Figure 2, the UV–VIS absorption spectrum of the aqueous C-dots solution was broad with a weak absorption maximum at 334 nm that corresponds to n-π* (C = O/C = N) transitions [32]. The photoluminescence spectra of the same C-dots solution exhibit the most robust emission and excitation at approximately 425 and 348 nm, respectively (Figure 2a). Figure 2b,c illustrates the photoluminescence spectra of C-dots, in which the emission peaks of C-dots are observed to be excitation-independent, especially for the wavelength range 250–400 nm, which is attributed to a single transition mode. On the contrary, when C-dots are excited above 400 nm, a typical behavior of C-dots is observed, emitting a red-shifted photoluminescence, ranged from the visible into the near-infrared (NIR) [11].
The photoluminescence quantum yield (Φ) of C-dots was estimated comparing the results of Equation (1) to both anthracene and quinine sulfate. It was calculated to be around 13%, undergoing excitation at 335 nm (Figure 2d). The fluorescence spectra of TiO2/C-dots is displayed in Figure S1.
Transmission electron microscope (TEM) images showed a uniform dispersion of the C-dots in water (Figure 3). As expected, C-dots exhibit quasi-spherical, discrete nanoparticles with sizes below 10 nm. C-dots form a stable suspension in water, and typically exhibit disk-shaped structures. TEM images reveal that the as-synthesized C-dots are uniform and monodisperse. Statistical evaluation of the size distribution revealed that the average size of the C-dots is 1.67 nm, ranged from 0.7 to 3.2 nm. The majority of the C-dots has sizes in the range of 1.0–2.1 nm.

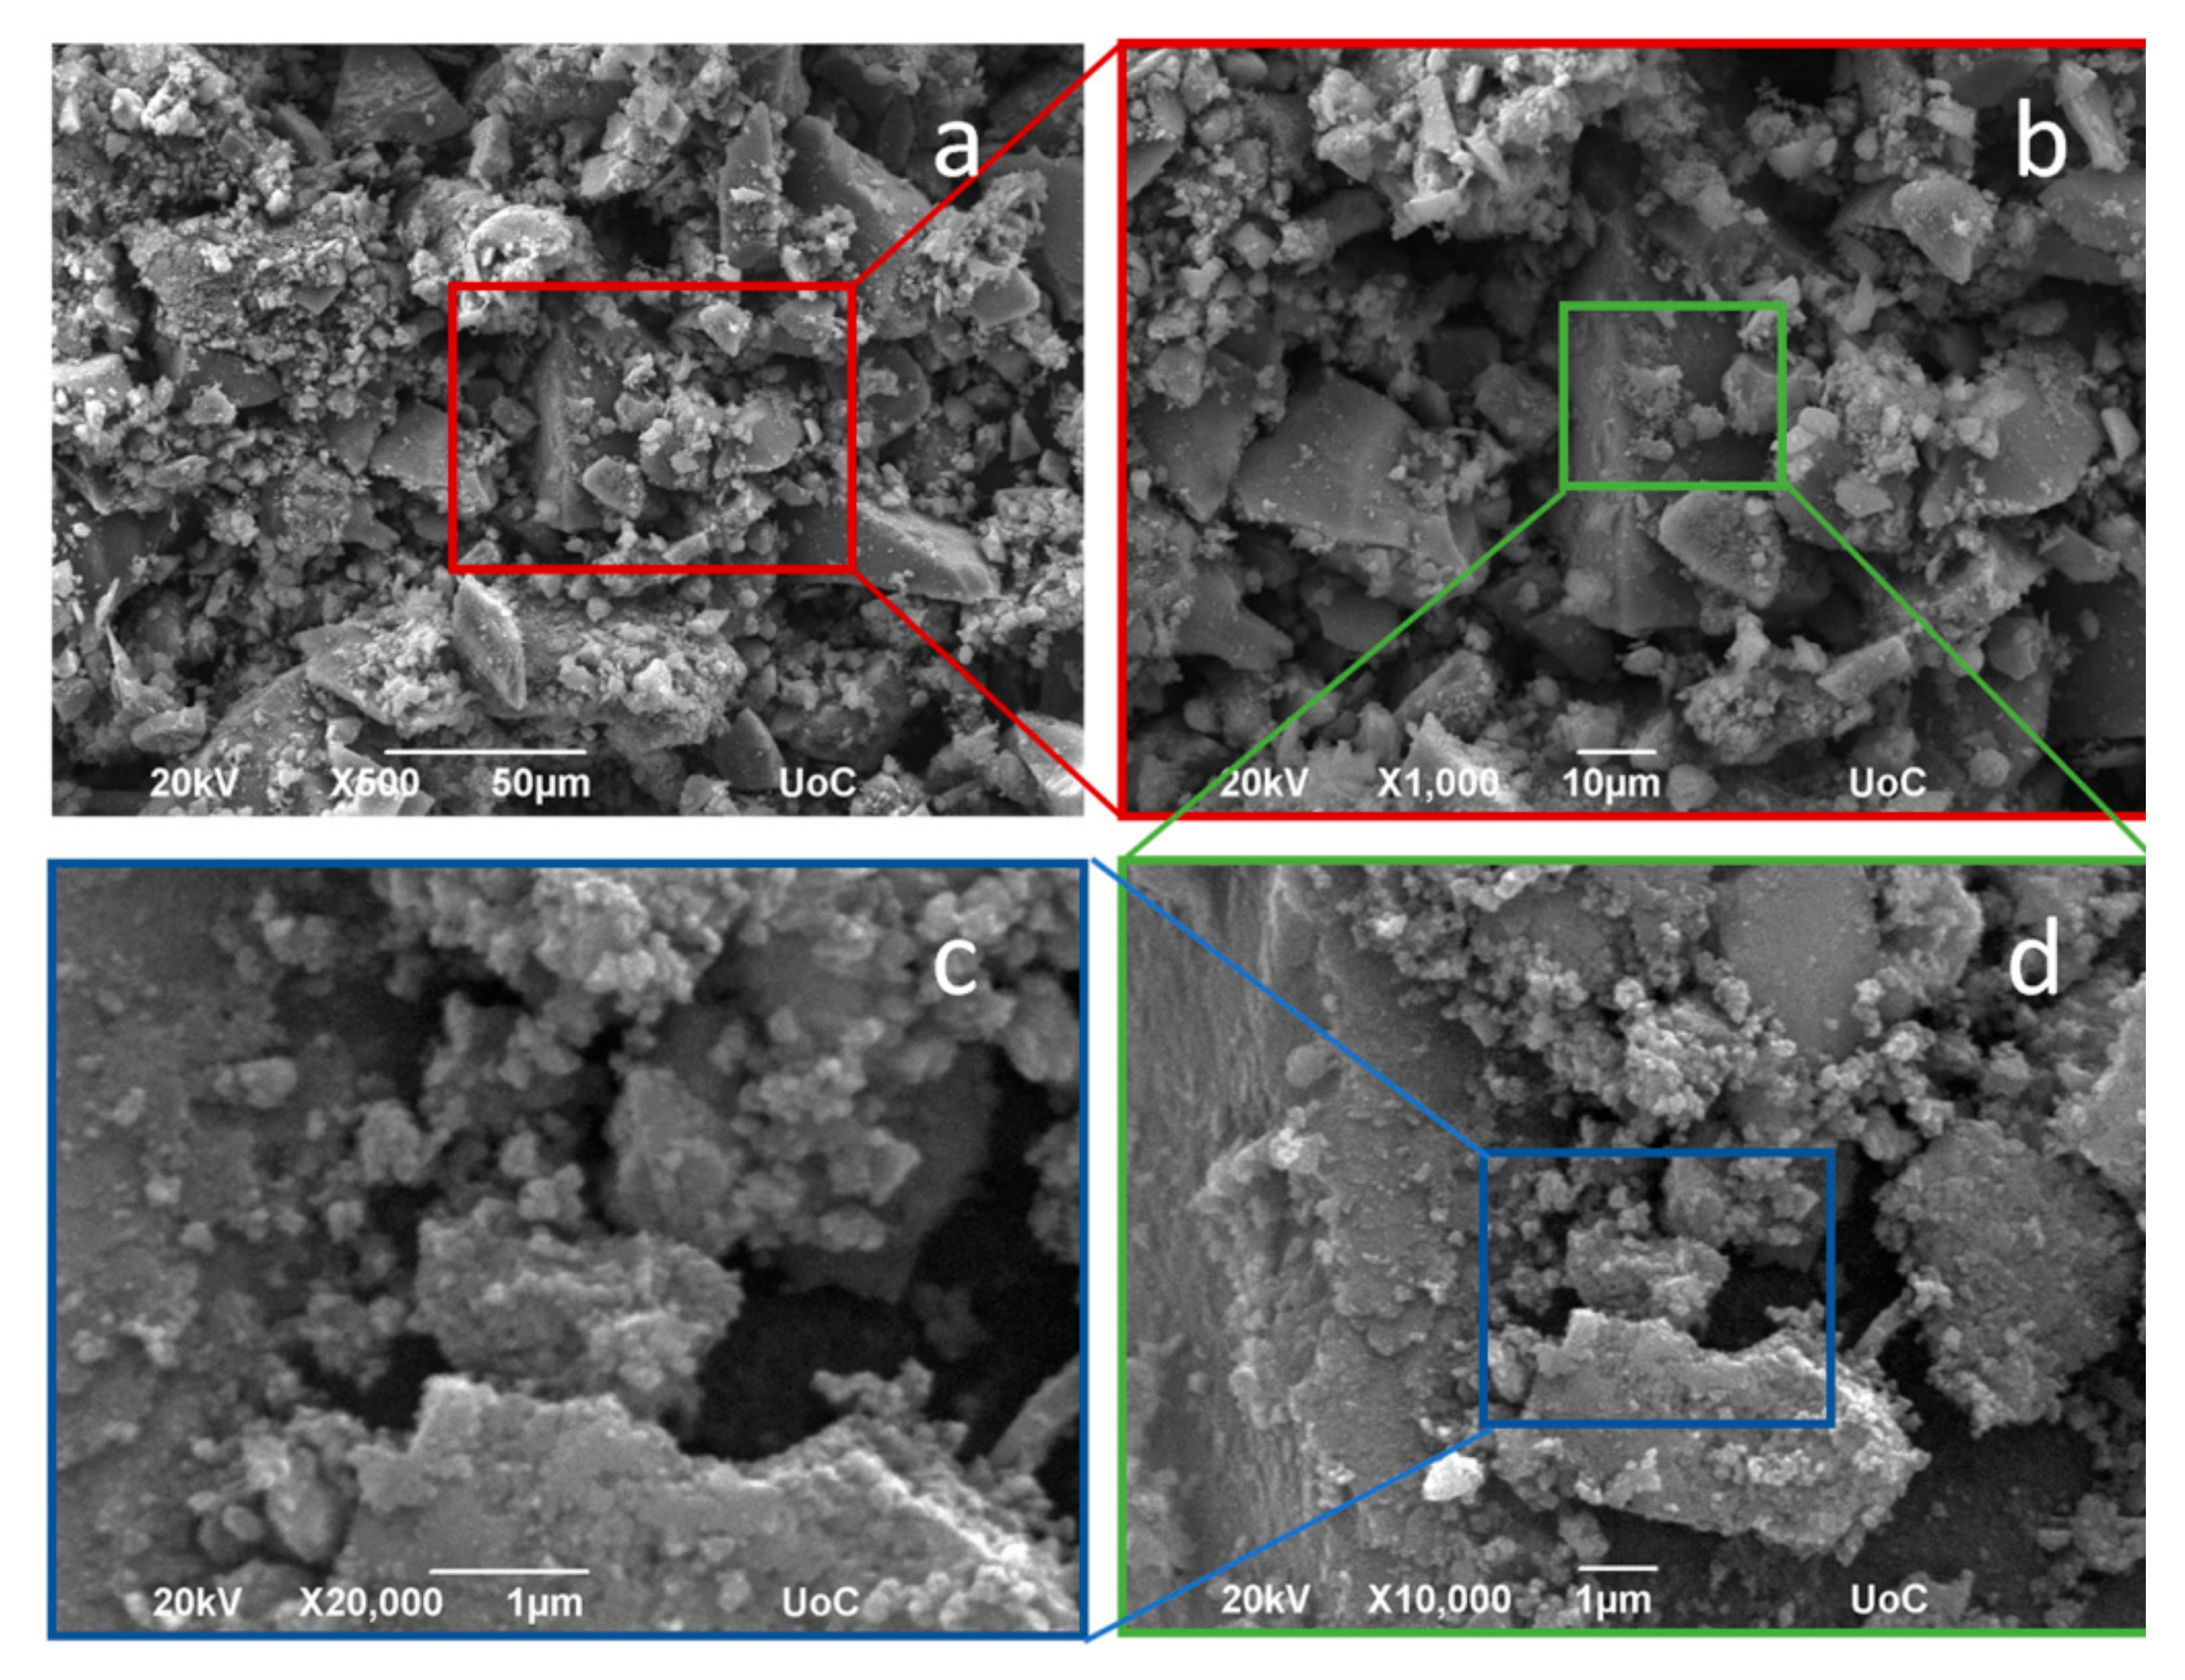
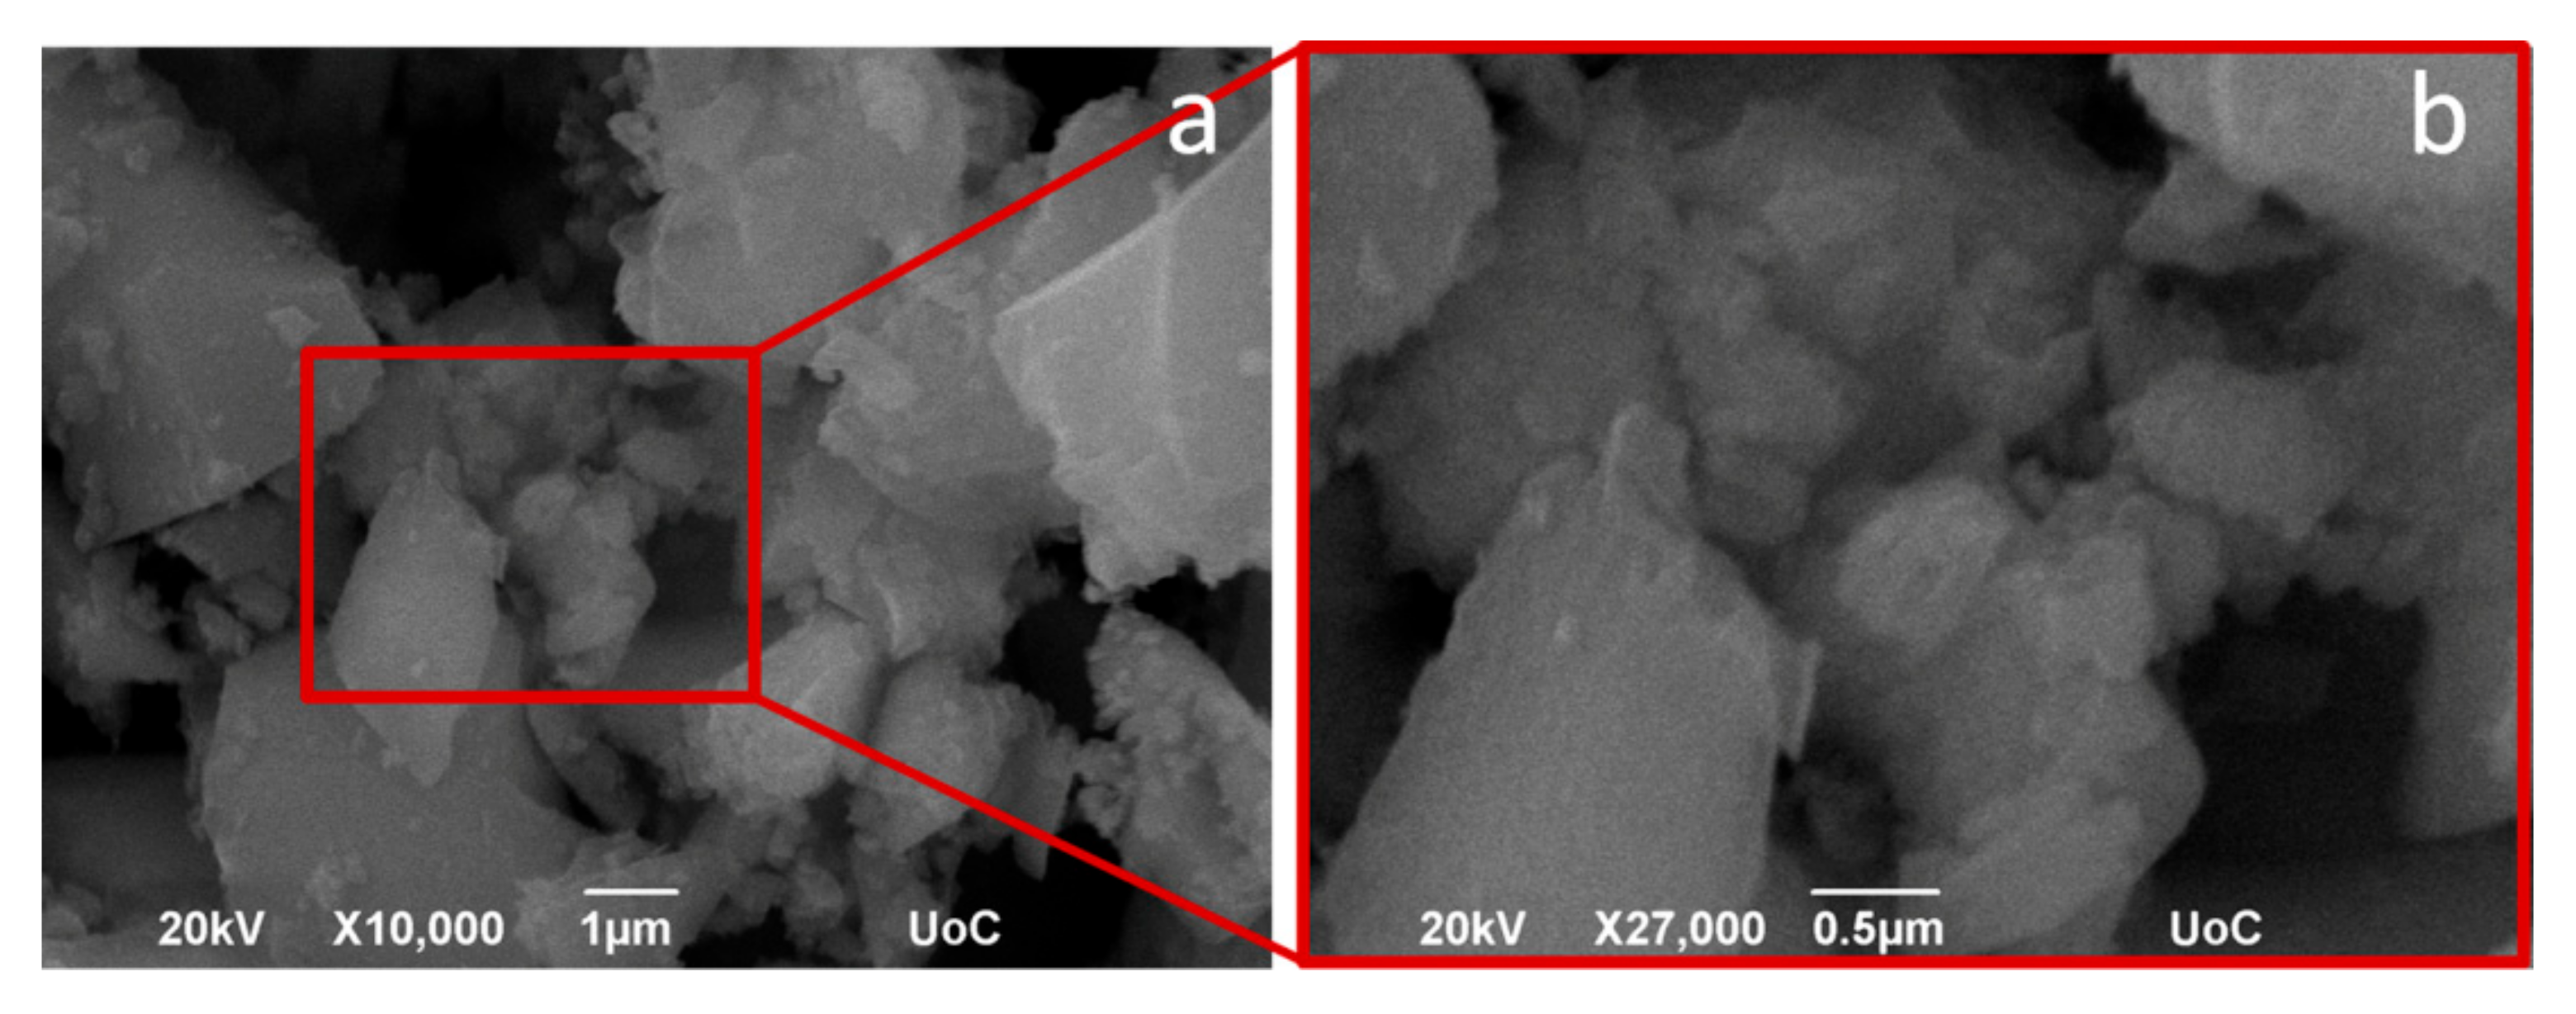
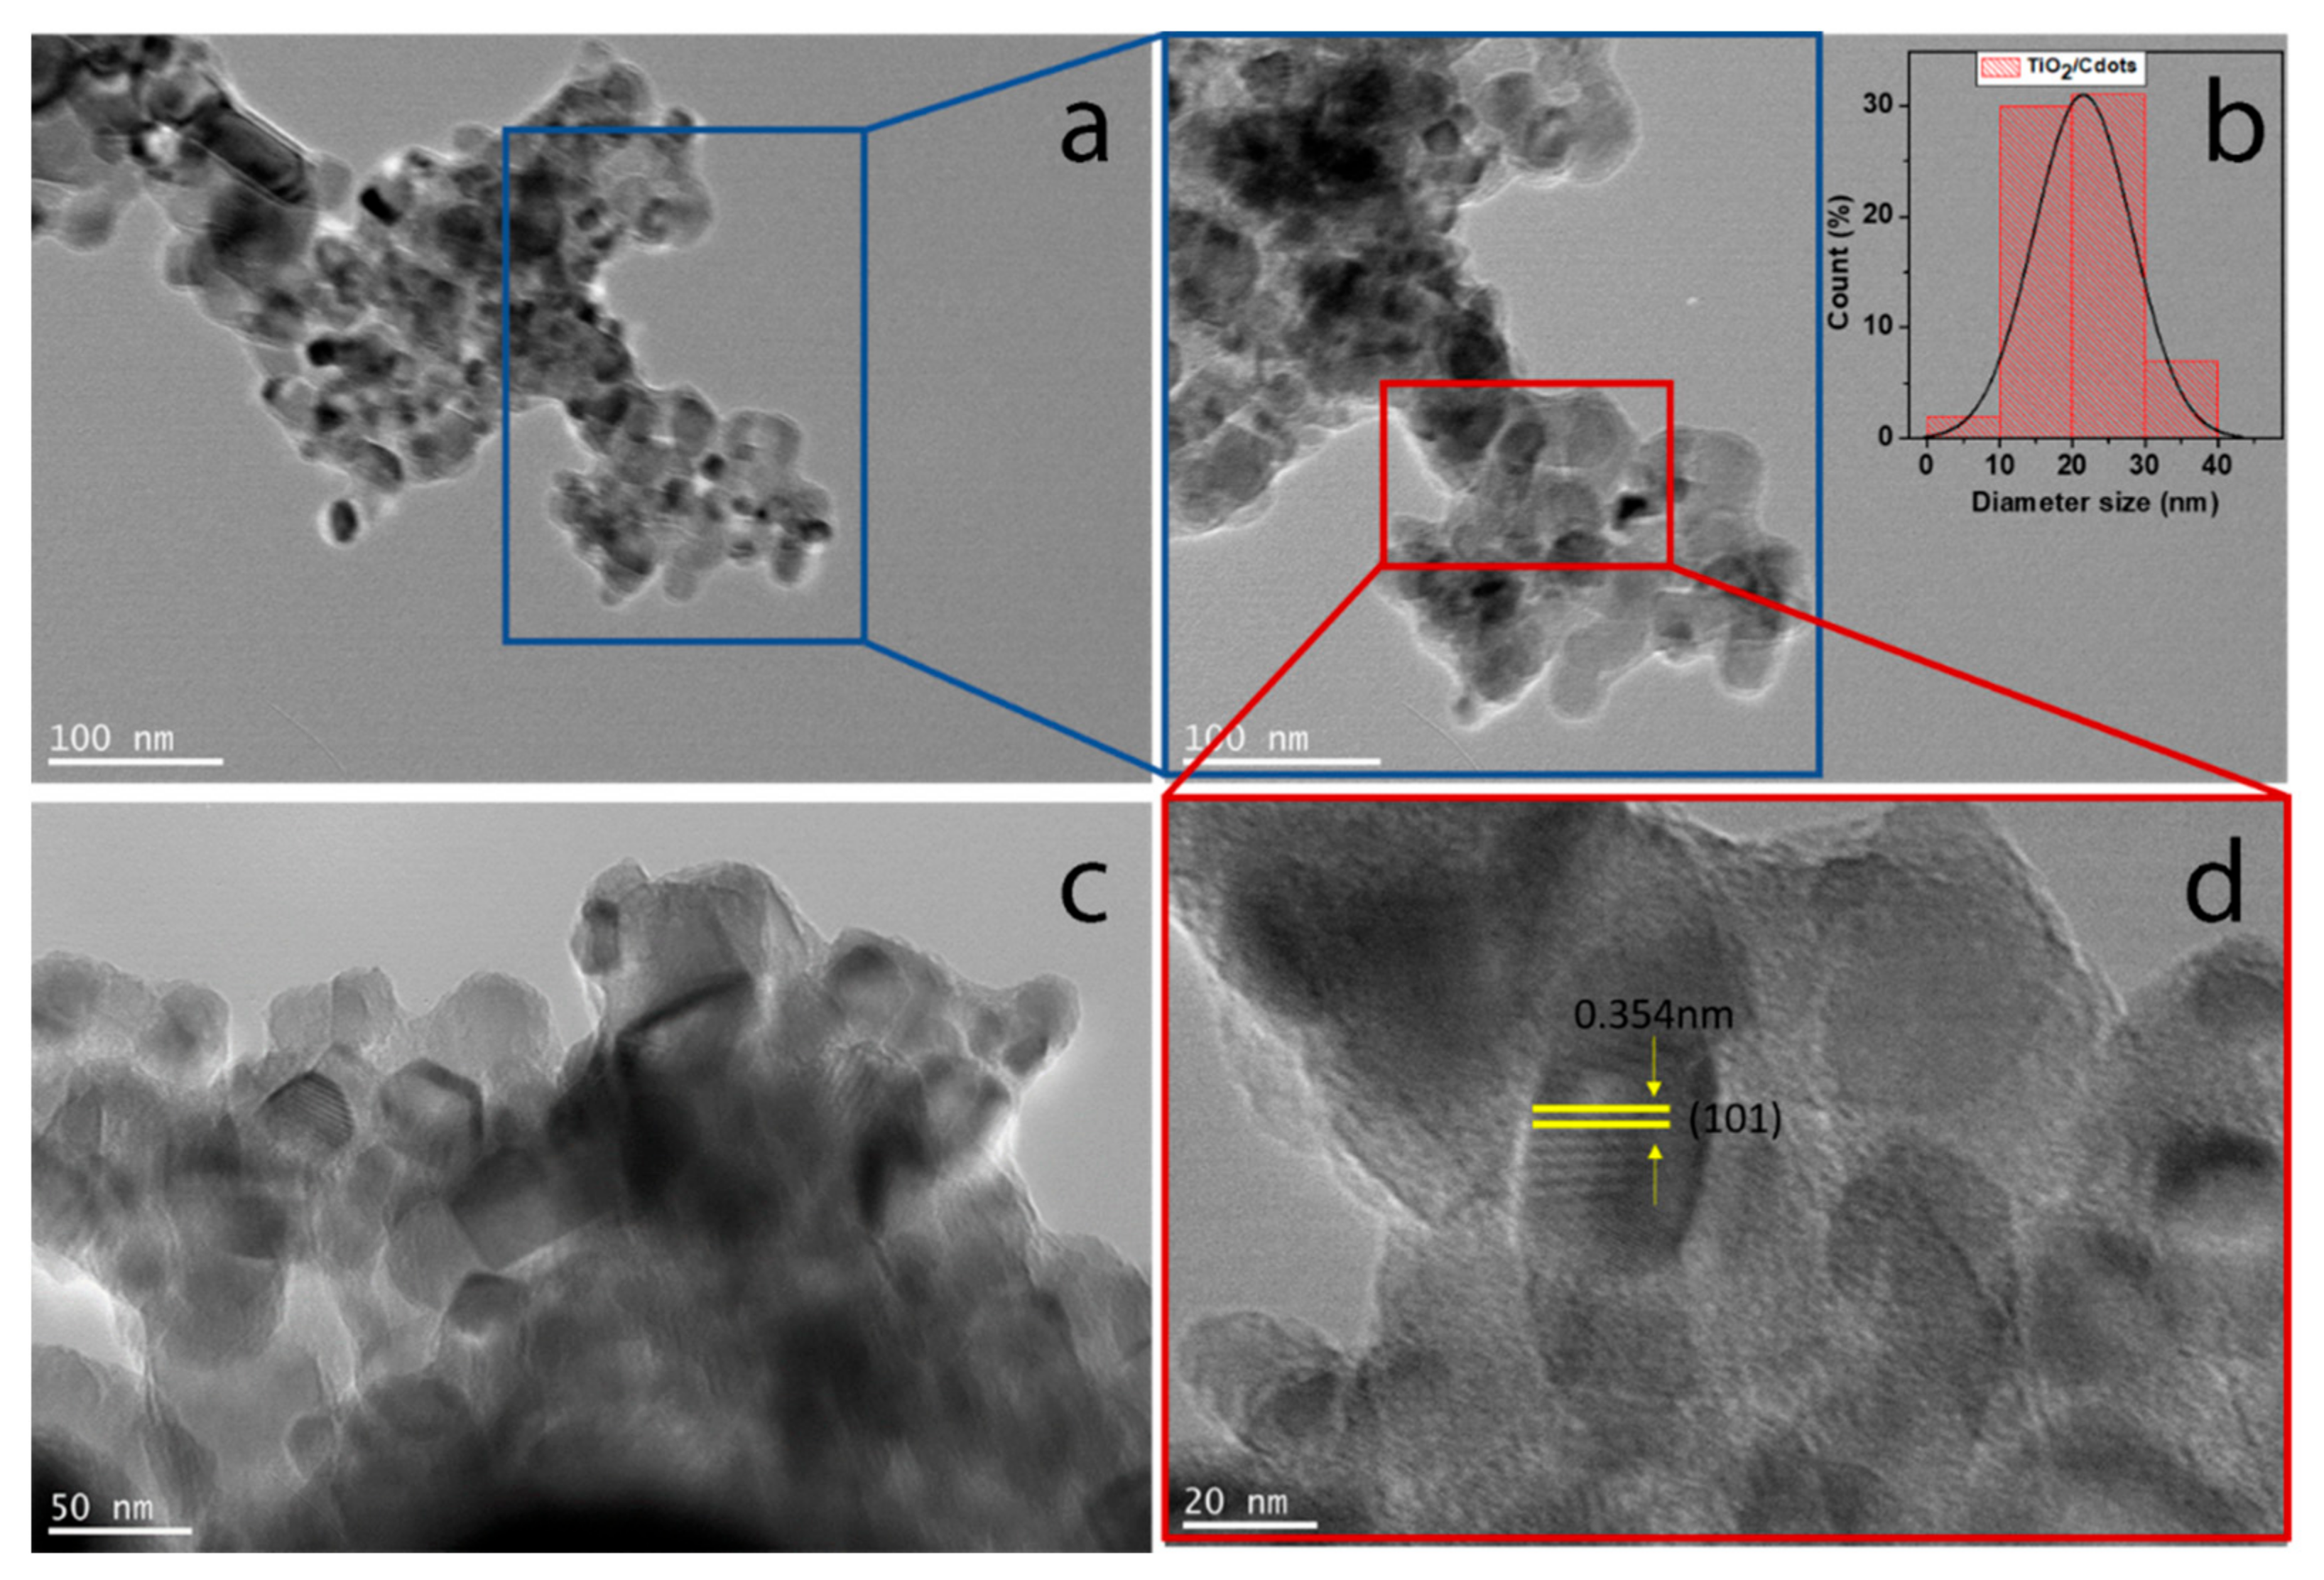
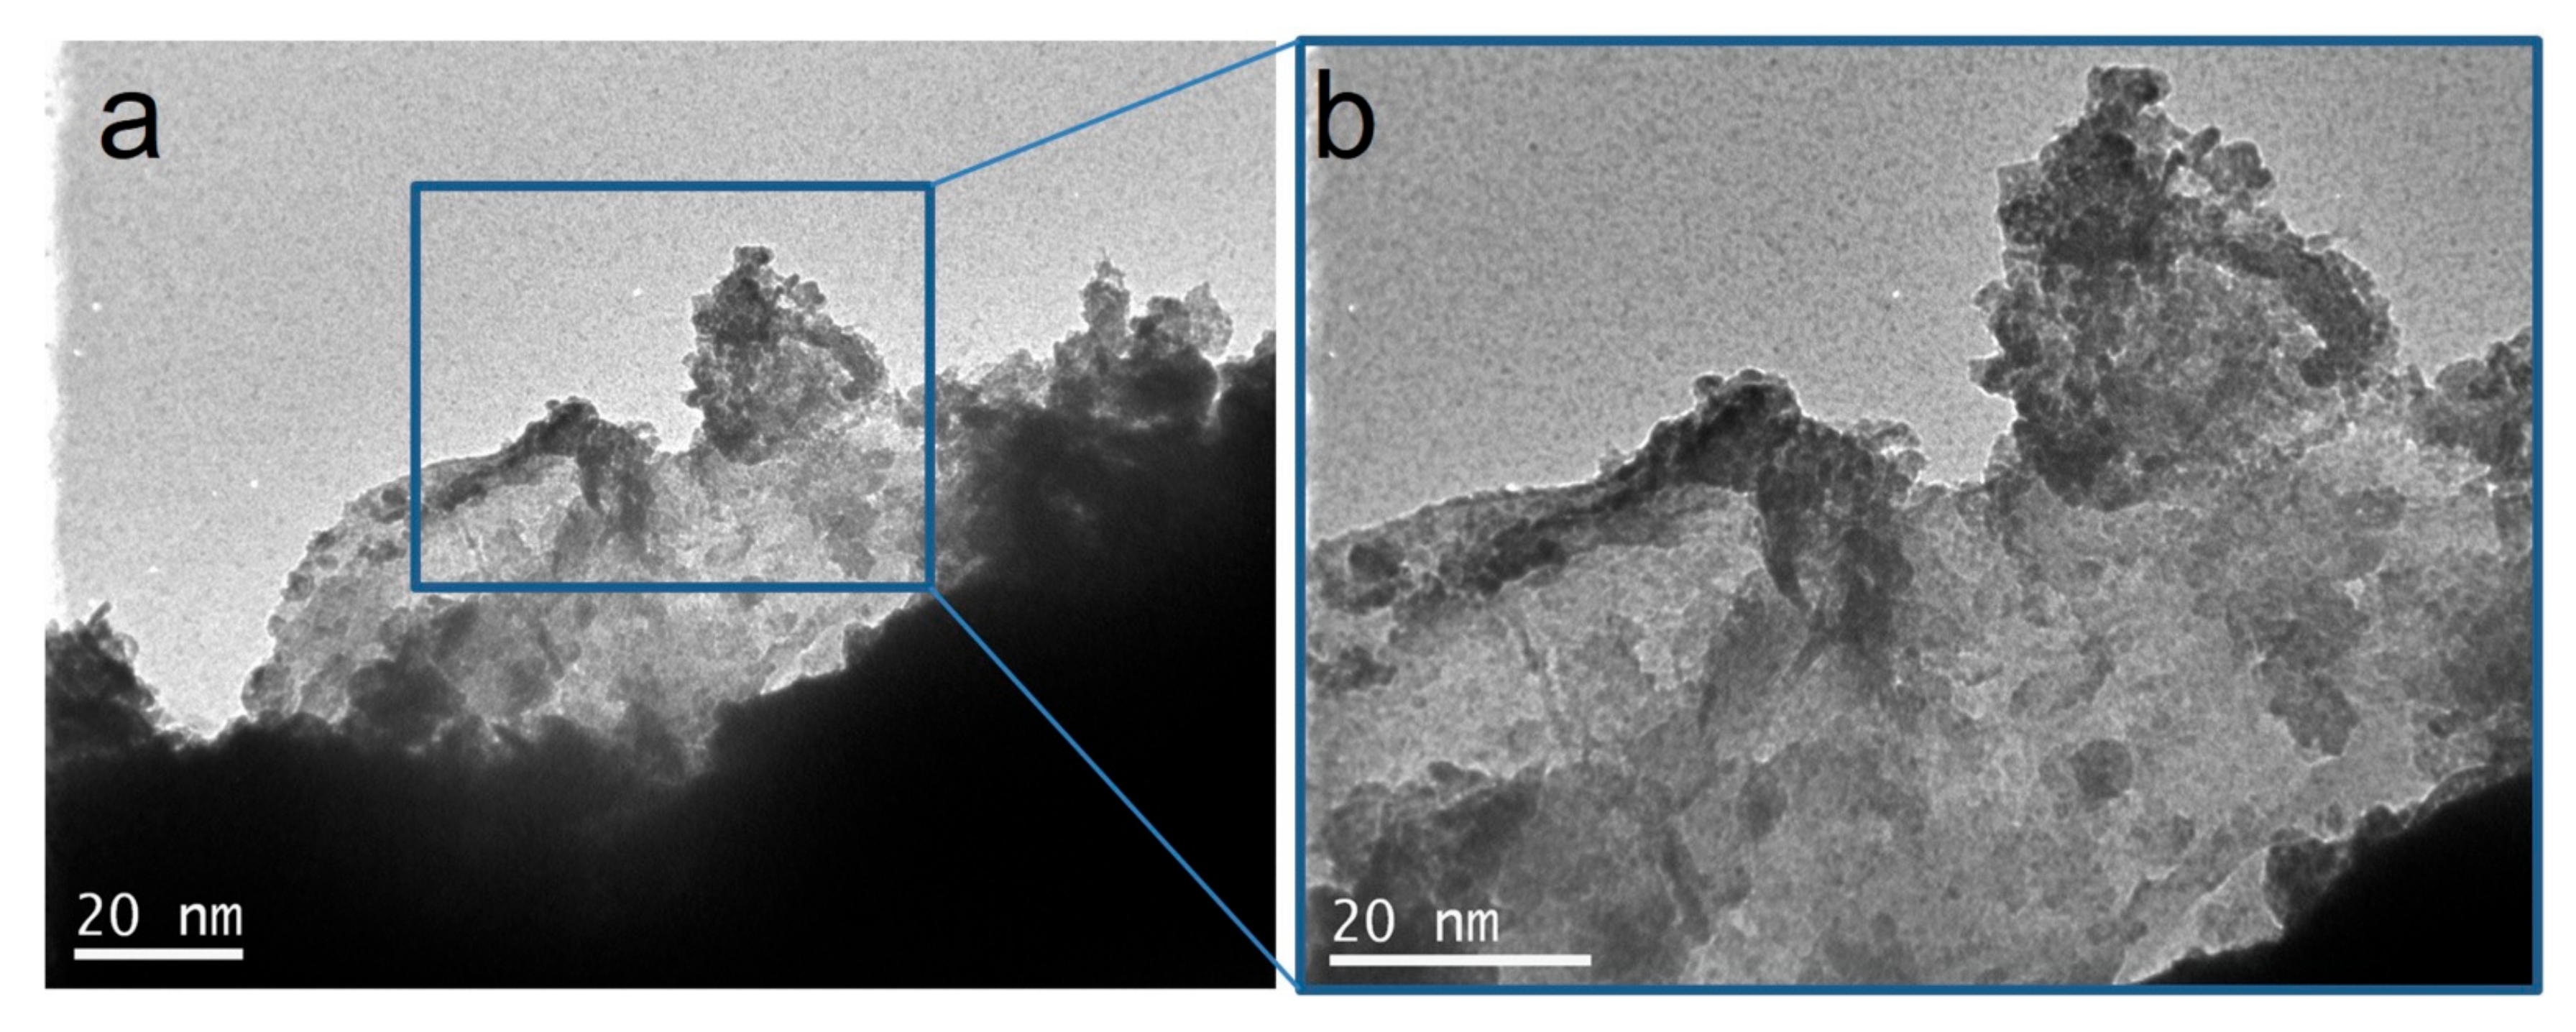
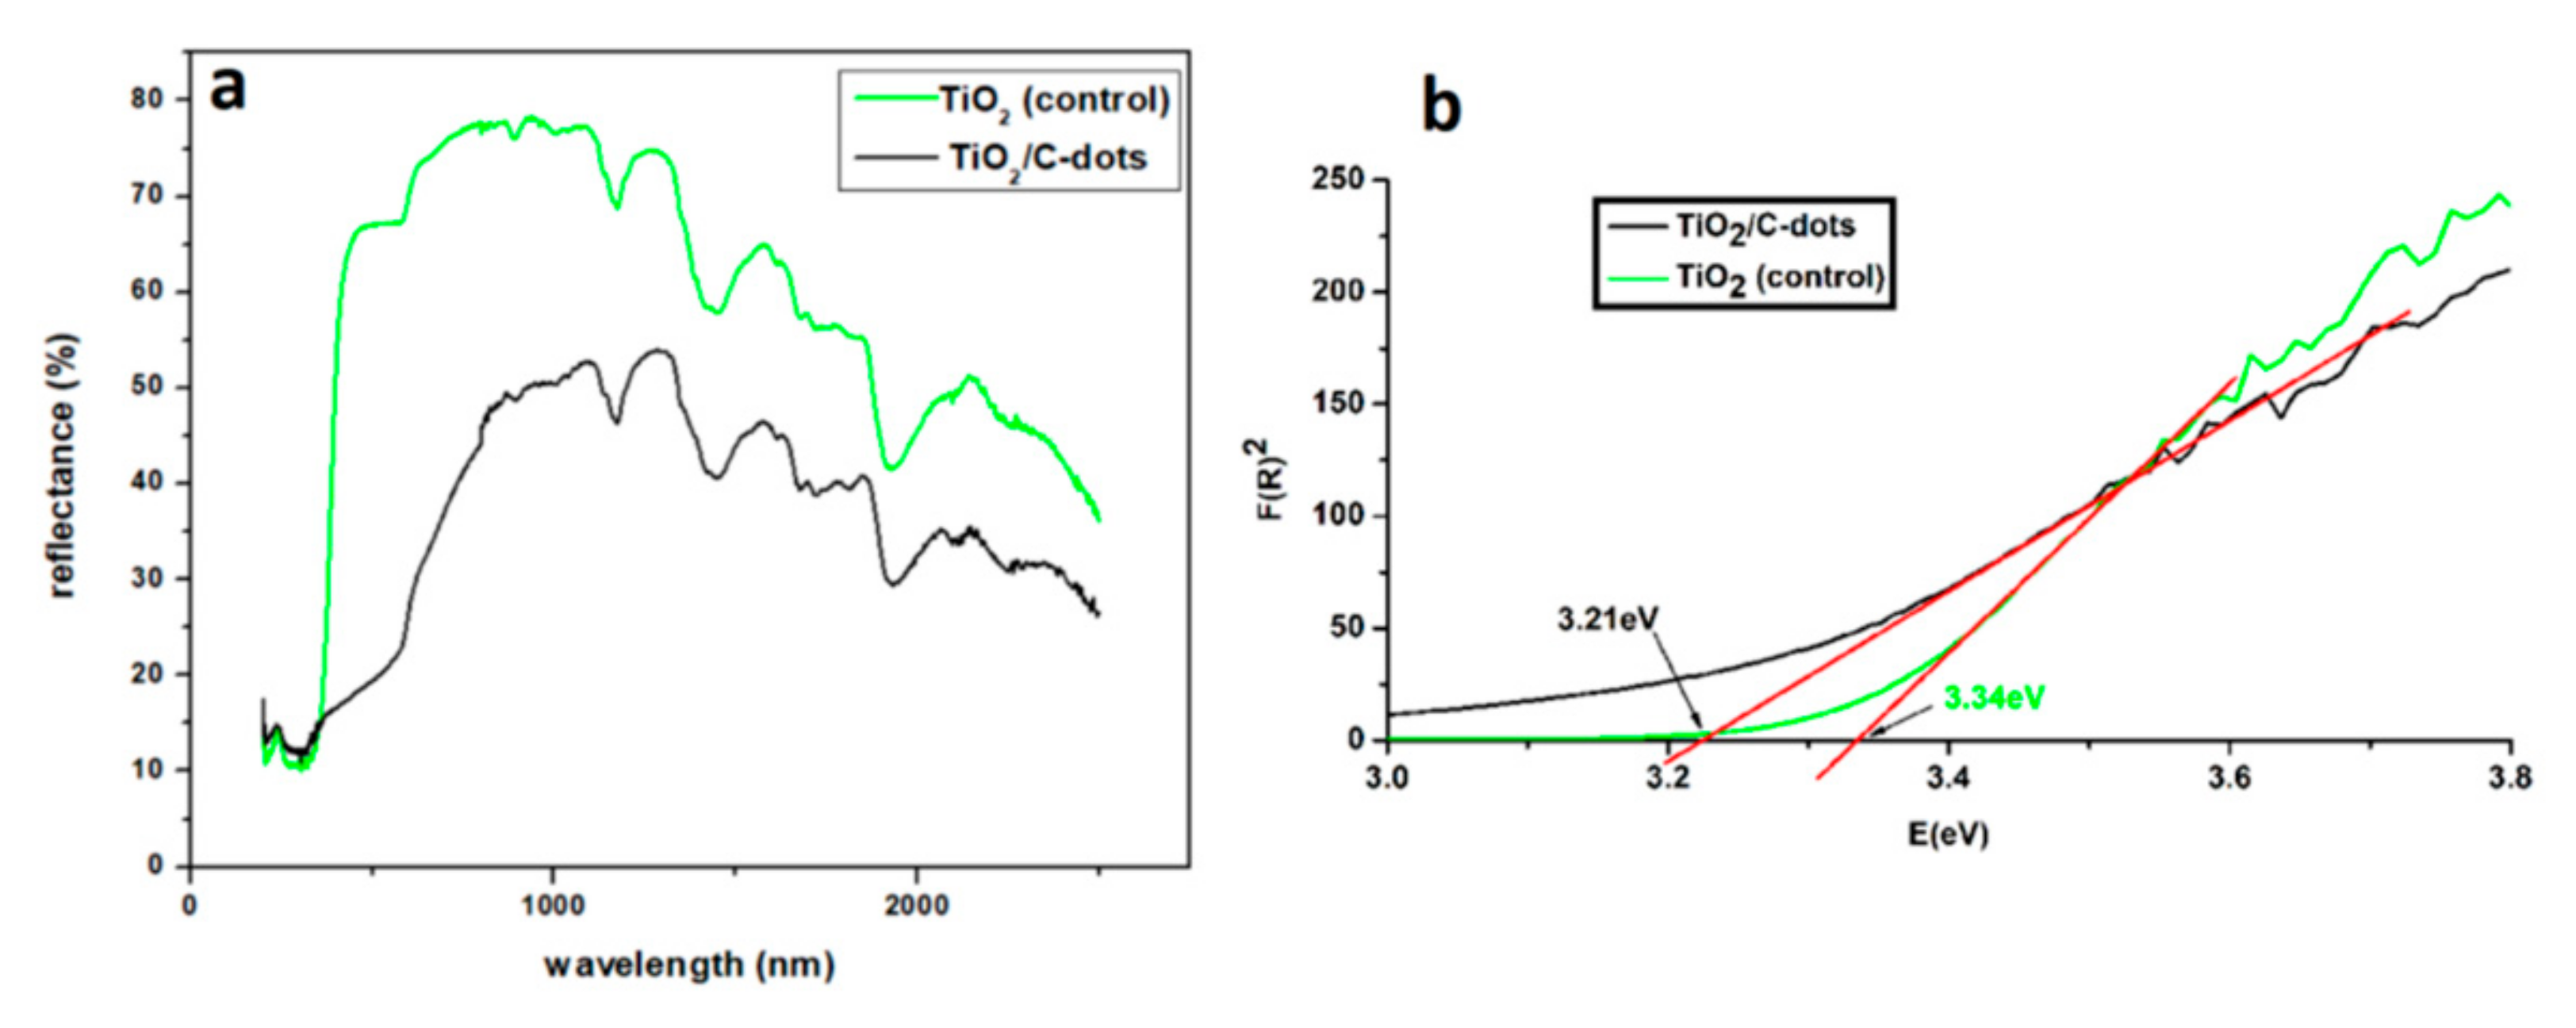
3.2. Structure and Morphology of TiO2/C-Dots

The X-ray diffraction pattern of the synthesized TiO2/C-dots nanoparticles is shown in Figure 4. The XRD pattern of TiO2/C-dots reveals that the major crystalline structure of TiO2 consists of anatase crystal form. Indeed, the diffraction peaks at 25.1°, 37.9° and 47.8° correspond to anatase lattice parameter (101), (004) and (200), respectively [33]. The specific form of TiO2 usually exhibits higher photocatalytic activity and has attracted the interest in photocatalytic procedures [34]. Moreover, anatase form is considered more stable than the rutile structure [35]. The XRD pattern of pure TiO2 displays a low order material exhibiting non range order, as it is shown in Figure 4. It should be noted that this almost amorphous material is the result of the particular synthesis methodology. Therefore, it should not be confused with conventional TiO2 photocatalysts.
The scanning electron micrographs of powdered TiO2/C-dots illustrated in Figure 5. SEM images display size and morphological analysis of the prepared composite, with their observation to reveal irregular agglomerates and their size ranges from nanometres scale up to several tens of micrometres, as a result of the drying process. TiO2/C-dots nanoparticles are in spherical shape (Figure 5d), and the morphology of agglomerates was characterized by a rough and compact surface. Similarly, pure TiO2 particles exhibit dense agglomeration of particles with irregular in shape form (Figure 6).
Figure 7 shows TEM images of the TiO2/C-dots, which exhibited relatively uniform size nanoparticles, with their size distribution ranging approximately from 10 to 40 nm (index Figure 7b). TEM analysis displays that the nanoparticles are in a highly quality crystalline form. The nanoparticles appeared to have a shape partly irregular, although tetragonal shape is the predominant. The main crystallographic phases were confirmed to be anatase, according to crystal lattice. Crystal planes are obviously visible, in the TEM images (Figure 7d), displaying the lattice fringes from TiO2/C-dots nanoparticles with an interlayer distance of 0.354 nm perfectly compared to the 0.352 nm lattice spacing of the (101) planes in anatase TiO2 [36]. TEM images confirm the synthesis of highly crystalline TiO2 at a relative low temperature, assisted by C-dots. Traditionally, the synthesis of pure anatase requires calcinations at 500 °C within several hours [37]. TEM images of pure TiO2 (Figure 8) are totally differentiated. Aggregates of a wide variety of size are observed in contrast to TiO2/C-dots; pure TiO2 does not display crystal planes or any organized structure.
As shown in Figure 9a, the FTIR spectrum of C-dots confirms the presence of amide functional groups. In particular, the characteristic absorption band of the primary amide I stretching band of C = O is observed at 1697 cm−1. A single broad band is observed at about 1584 cm−1 due to the overlapping of amide II band with asymmetric vibration of COO– one. Furthermore, the peak appearing at 1401 cm−1 is assigned to symmetric stretching vibration of COO−. The peaks at 3131 and 3038 cm−1 can be attributed to CH3 asymmetric and symmetric stretching vibrations, respectively. The band at 2810 cm−1 corresponds to the C−H (alkyne) stretching mode [38,39]. In addition, a sharp band at 1176 cm−1 is attributed to the stretching vibration bands of C−O of the carboxylic group [40]. FTIR spectrum of TiO2/C-dots displays 3 distinct bands at 1224, 1382 and 1608 cm−1, which are attributed to C–O, symmetric and asymmetric carboxylate stretch modes, respectively. Given that the FTIR spectrum of TiO2 shows a wide band at around 3300 and a small one at 1640 cm−1 corresponding to the stretching and bending vibration of O–H of the absorbed water (see Figure S1), the results of FTIR spectra prove the incorporation of C-dots into TiO2.
It could be considered that the TiO2 crystal face consists of anatase phase after treatment with C-dots, which is also confirmed by Raman spectroscopy (Figure 9b) [41]. In particular, the Raman spectrum of TiO2/C-dots shows the bands of anatase at 152, 404, 513, 634 cm−1; these fundamental phonons are attributed to the (a) Eg, (b) B1g, (c) combination of A1g and B1g, and (d) Eg modes, respectively [42,43]. Indeed, the intensity of photoluminescence is very low (Figure S1). On the contrary, it was not possible to collect Raman spectra of C-dots, probably due to their photoluminescence.
The energy gap value of the TiO2/C-dots nanoparticles was calculated from the measurement of the diffuse reflectance of powder sample by Tauc’s plot [44]. The band gap of the TiO2/C-dots was determined to be 3.21 eV (Figure 10b). This value is very close to the band gap of anatase. In particular, the majority of authors reported that TiO2 anatase has only an indirect band gap of 3.23 eV as opposed to the rutile, which has a direct band gap of 3.06 eV and an indirect one of 3.10 eV [45,46].

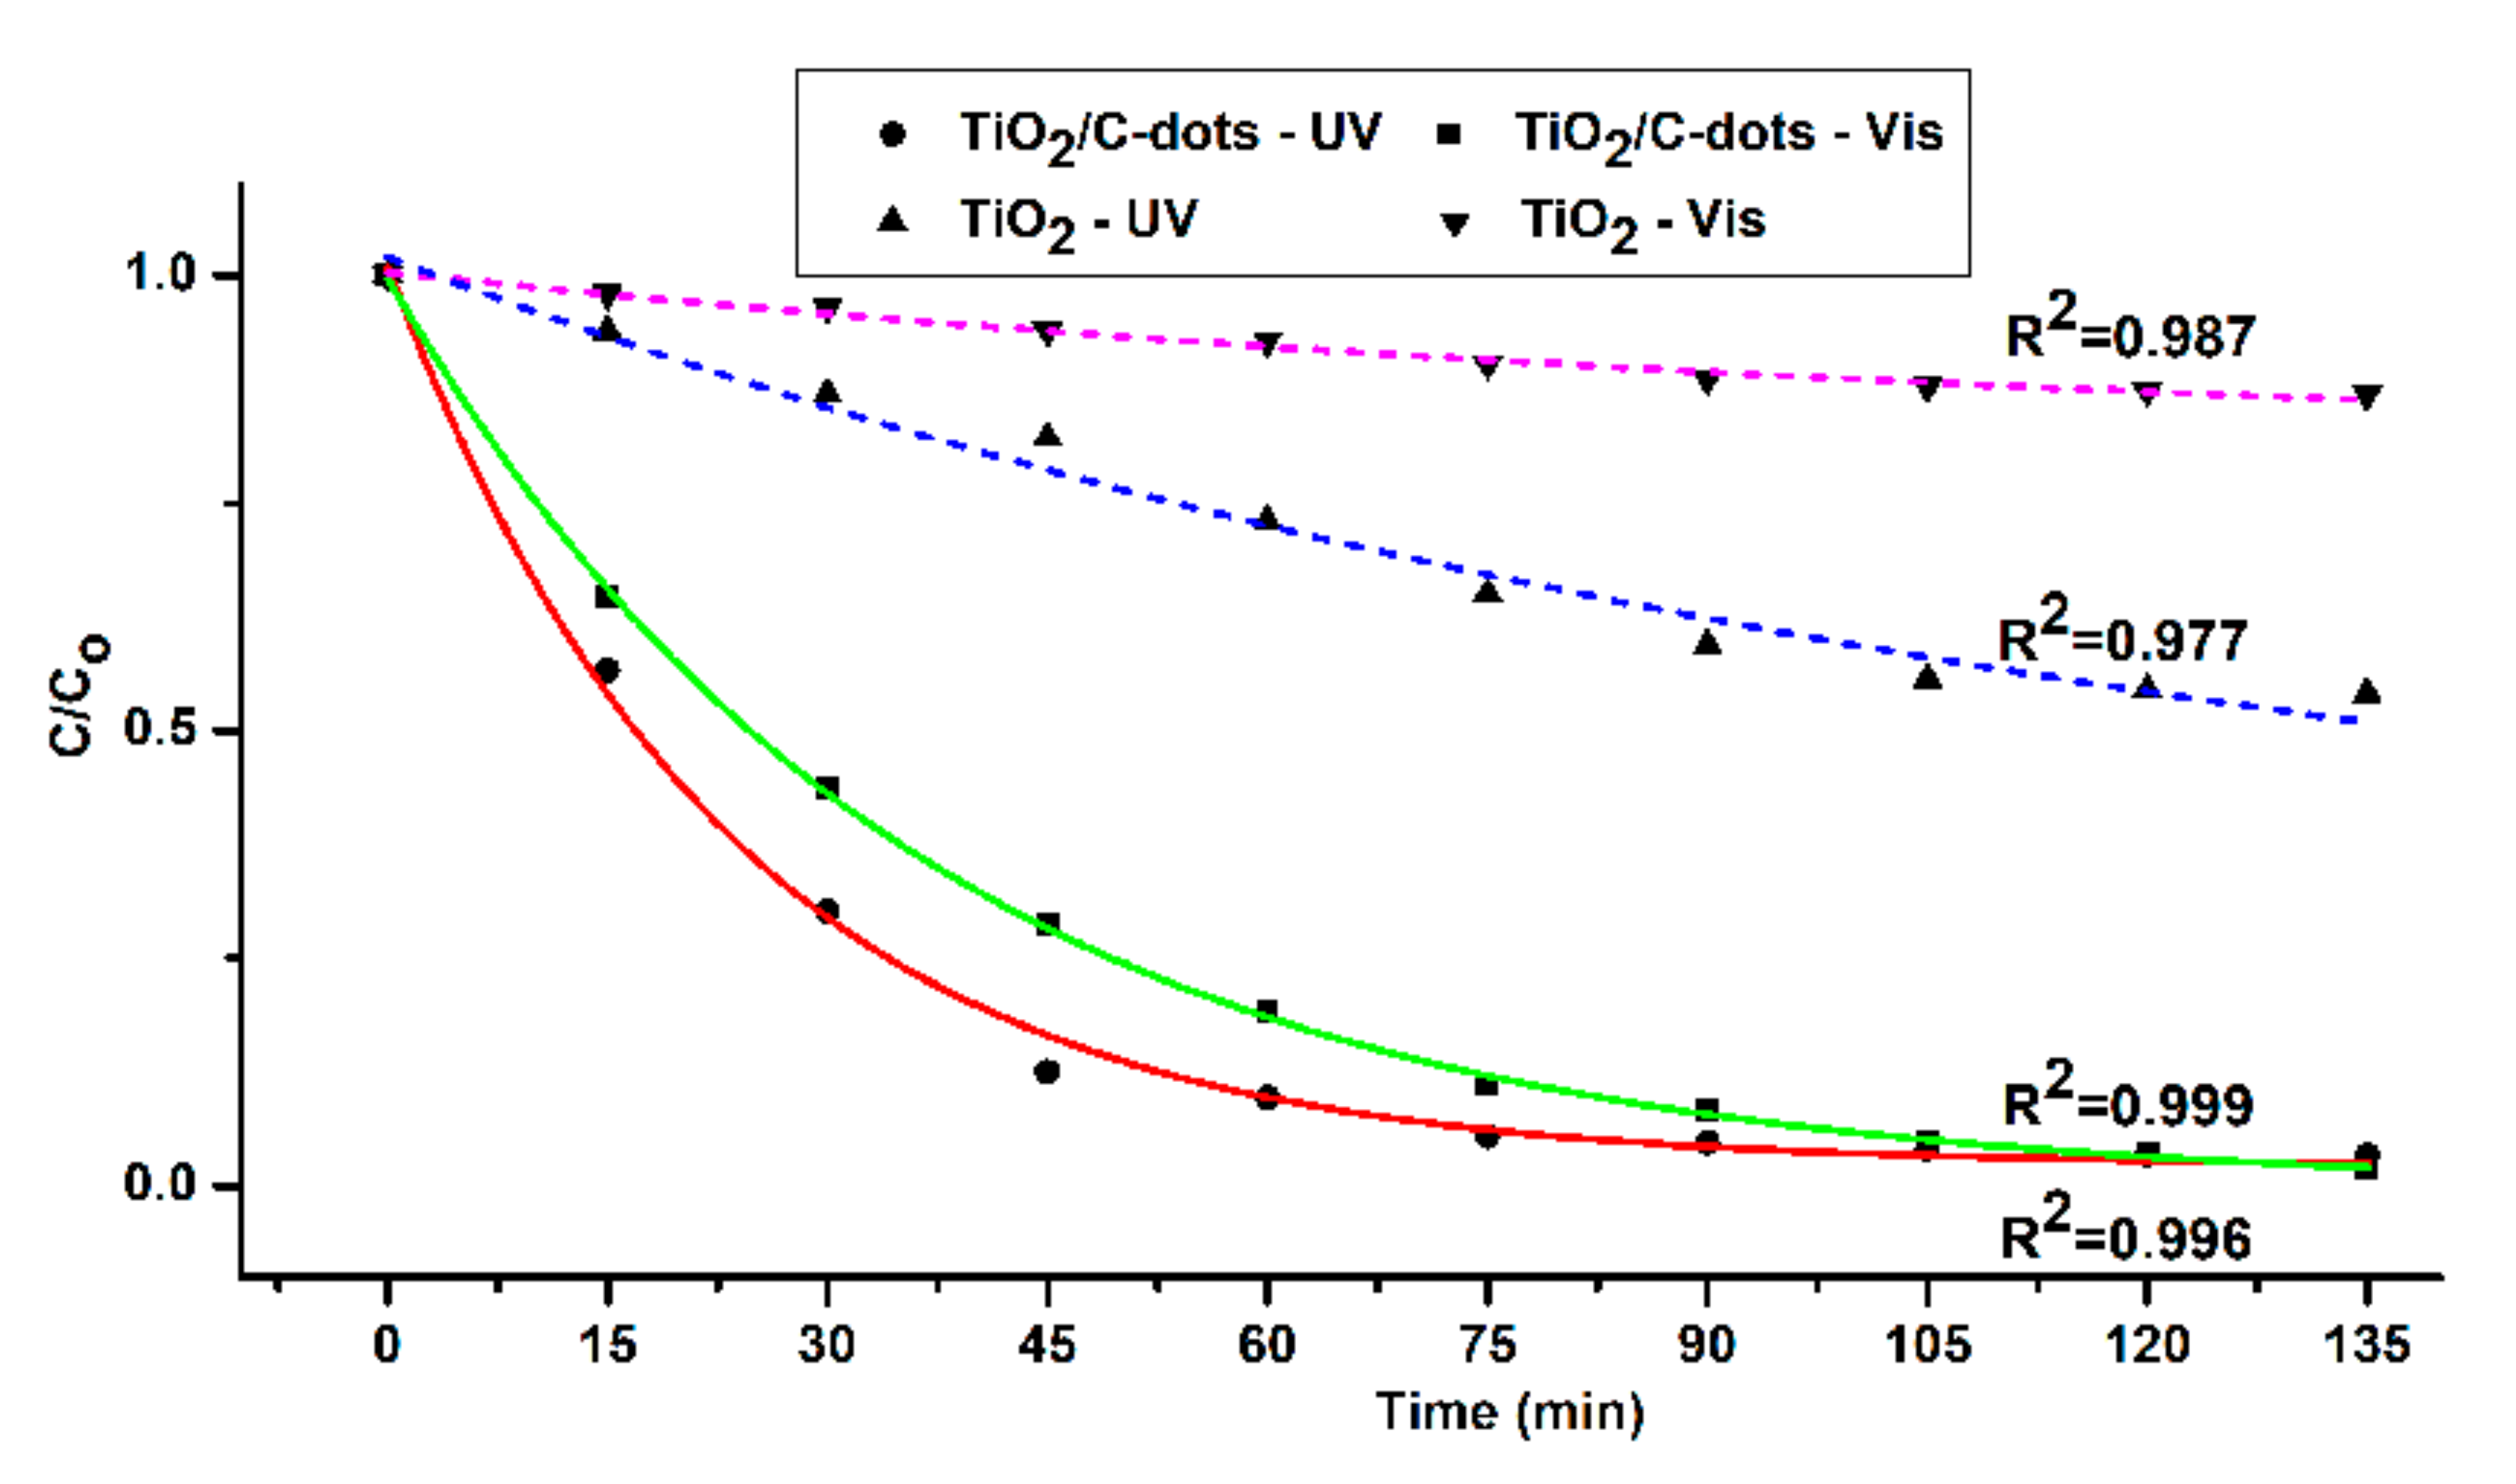
3.3. Photocatalytic Activity of TiO2/C-Dots

The photocatalytic performance of TiO2/C-dots was estimated utilizing MO as an indicator of photodegradation. In particular, Figure 11 shows the photocatalytic efficiency curves of the aqueous solution of MO during the first 120 min of radiation in the presence of TiO2/C-dots. Two studies were carried out; in the first study, MO was radiated with UV light (red line) and in the second one with visible light (green line), as a filter wavelength cut-off lower than 420 nm was used. The next stage includes the radiation of MO with UV light. The UV–VIS spectra of MO degradation over time are displayed in Figure S2. The existence of TiO2/C-dots nanoparticles causes the complete disappearance of both MO bands at λmax = 463 and 272 nm, which was assigned to N = N bonded aromatic rings. These results indicate the cleavage of the azo group of MO. Indeed, it was observed that about 50% of MO was degraded within 40 min, while the dye has almost been completely degraded in 120 min under UV radiation (Figure 11). In contrast, pure TiO2 displays a MO degradation of about 40% during the first 120 min. Photodegradation was also observed in the case of visible radiation, after the activation of TiO2/C-dots. The rate of visible degradation is relatively reduced in comparison to UV one. A noticeable decrease of MO amount is observed under visible irradiation, having the potential of further degradation after 120 min. An amount of 40% MO is degraded after the visible radiation in the presence of TiO2/C-dots. As opposed to that, TiO2 shows almost zero degradation of MO under visible irradiation. The above diagrams reveal the capability of TiO2/C-dots to interact with organic compounds and degrade them in the UV as well as in the visible region, thus indicating its self-cleaning properties. This significant visible-light photocatalytic activity of TiO2/C-dots nanoparticles could open the paths to various environmental applications, especially for water and air purification. The macroscopic evaluation of the photodegradation process is reported in Figures S3 and S4.
The rates of photocatalytic activity of TiO2 and TiO2/C-dots fit with a pseudo 1st order kinetic model, confirming the experimental data of photocatalytic degradation of MO. The photocatalysis rates exhibit a high degree of correlation, with the equation below that displays the calculation of MO concentration at various time intervals (C) vs. the reaction time (t): C = Co e−kt, where Co is the MO concentration for t = 0 min and k is the pseudo 1st order adsorption kinetic constant [47]. Both the values of k and the corresponding regression coefficients (R2) were determined for visible to be 30.84 × 10⁻³ min−1 and 0.984 and for UV 28.53 × 10⁻³ min−1 and 0.999, respectively. Pure TiO2 displays a remarkable reduction of MO photocatalytic degradation. In particular, the constant k was estimated to be 26.73 × 10⁻³ and 1.79 × 10⁻³ min−1 under UV and visible radiation, respectively.
Undoubtedly, the incorporation of C-dots into TiO2 significantly improves the photocatalytic degradation rate of MO, as a result of the increased photocatalytic activity of TiO2. In comparison to pure TiO2, the increased photocatalytic activity of TiO2/C-dots could be associated to the intermolecular charge transfer between organic (C-dots) and inorganic (TiO2) nanomaterials, leading to a remarkable efficiency of MO photodegradation (Figures S2–S4) [15].
The information provided by XRD and Raman spectroscopy did not fully support the correlation between C-dots fluorescence and TiO2/C-dots photocatalytic properties, which is subject of further analyses with relevant analytical techniques.
TiO2/C-dots nanoparticles might be successfully recovered by filtration or centrifugation and possibly be reused for several times. Therefore, this system could be useful for cleaning wastewater using sunlight. In addition, these nanoparticles have the potential for indoor air purification applications, due to their ability of photooxidation with visible light. Apart from their favorable preparation, TiO2/C-dots have the potential for a large-scale production of efficient photocatalytic materials.

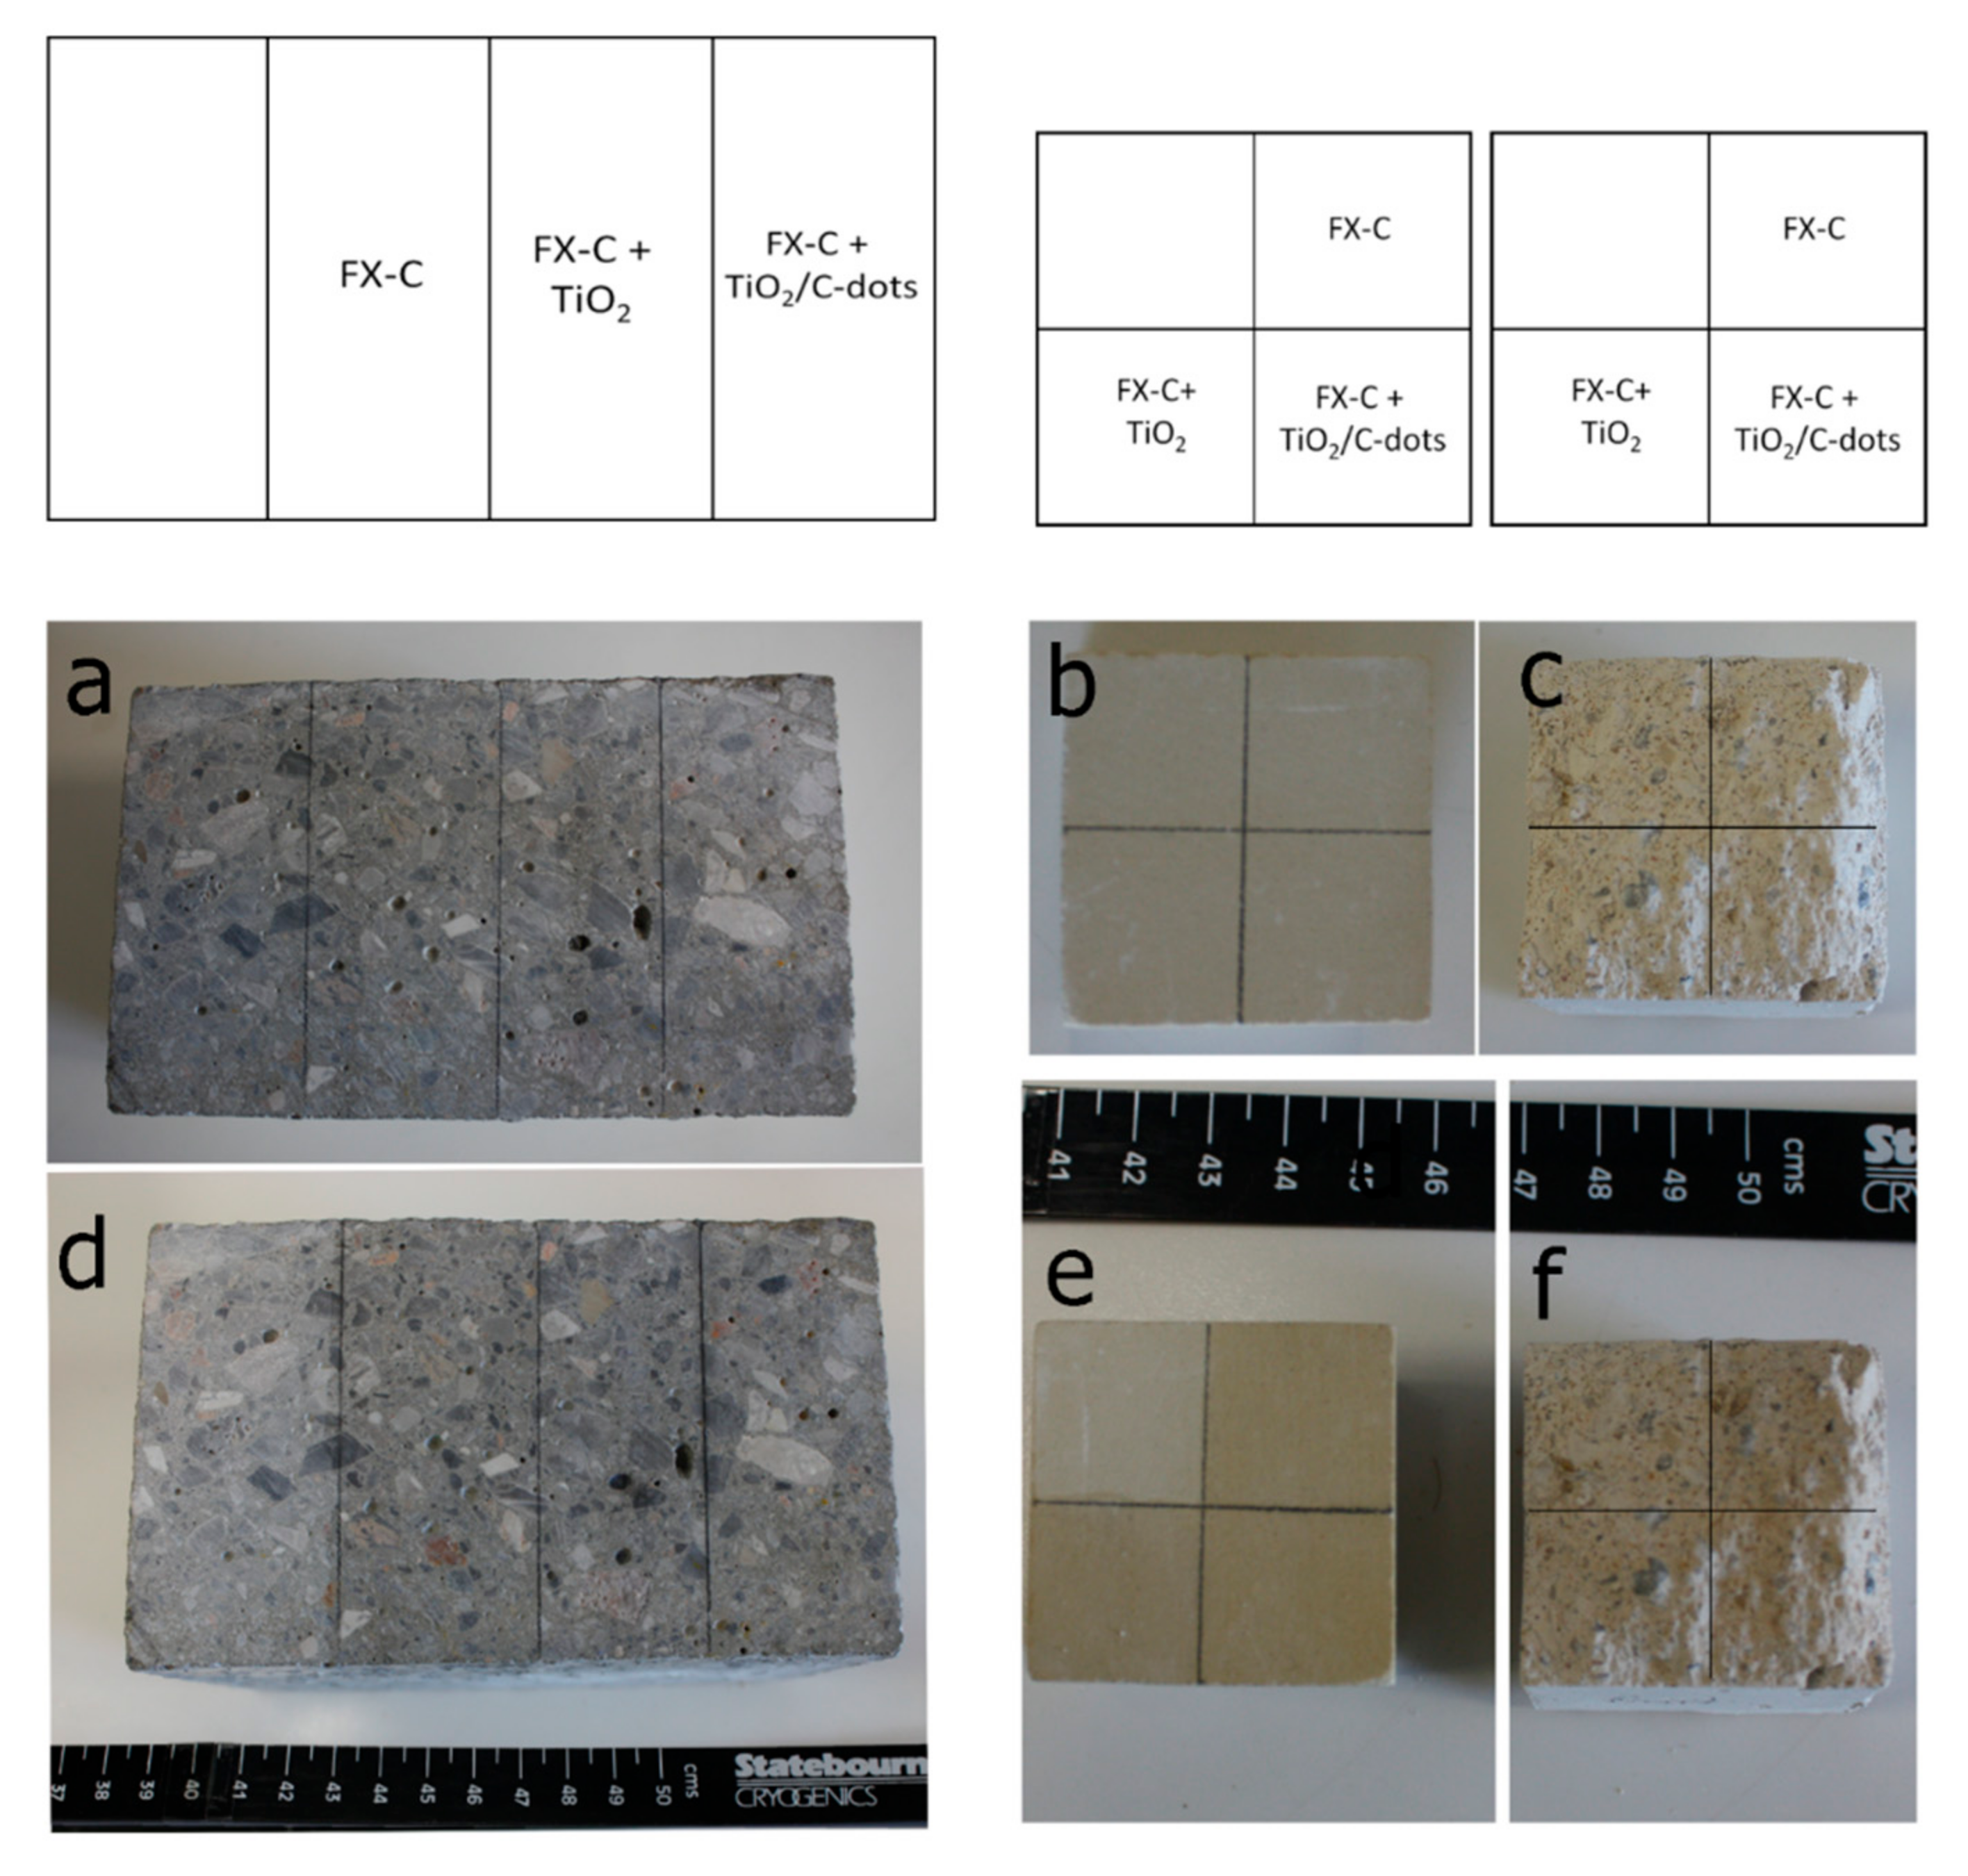
3.4. Macroscopical Evaluation of Photocatalytic Films onto Substrates

The protective agent FX-C enhanced with the photocatalysts was applied onto three different substrates: concrete, micritic limestone and lime mortar. The application was performed by brushing two homogeneous layers of the sol onto the surfaces and letting it dry at room temperature. As presented in Figure 12, the incorporation of either TiO2, or TiO2 enriched with C-dots does not affect the color of the formed protective film and also, does not promote cracking effects. This was further confirmed by the results of the colorimetric analysis demonstrated in Table 1. The aesthetic alteration of the concrete specimen is considered negligible as it is far below the required value for surface treatments onto monuments (ΔE* ≤ 5) [24]. Concerning limestone and lime mortar, the protective agent containing undoped TiO2 modified less the surface and the alteration is within the acceptable limits. The presence of C-dots in the incorporated photocatalyst, caused a slightly higher chromatic shift, though it still cannot be observed with naked eye.

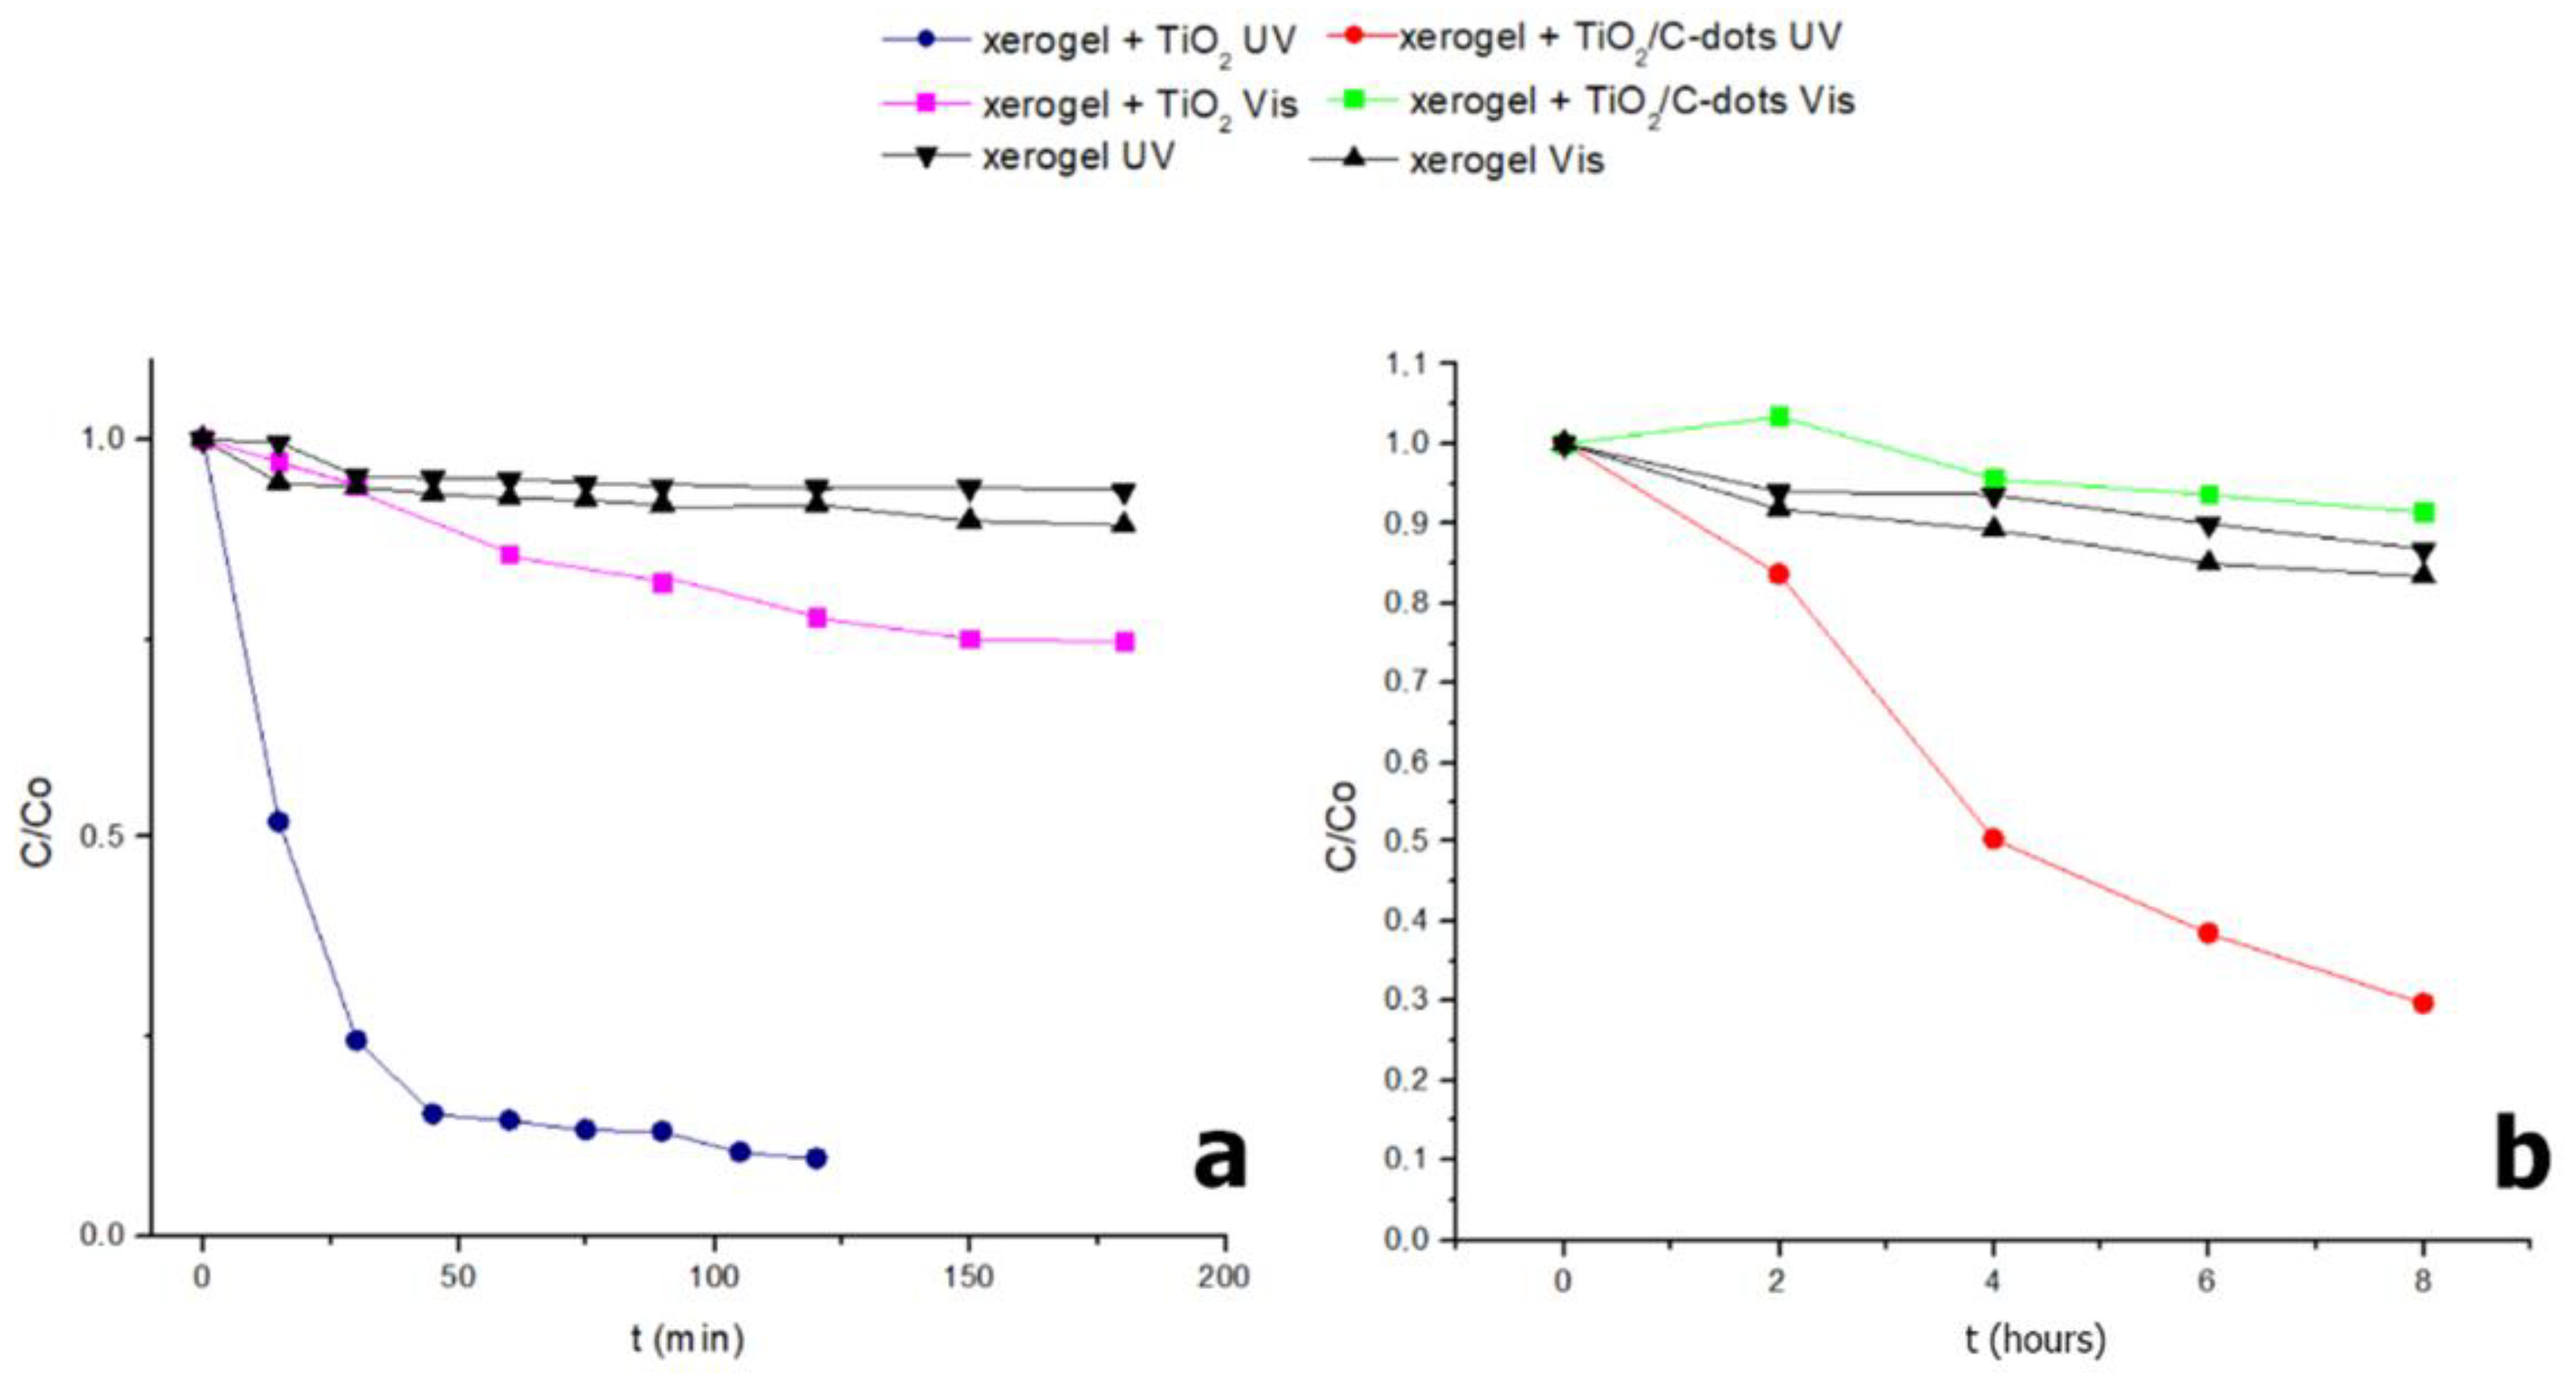
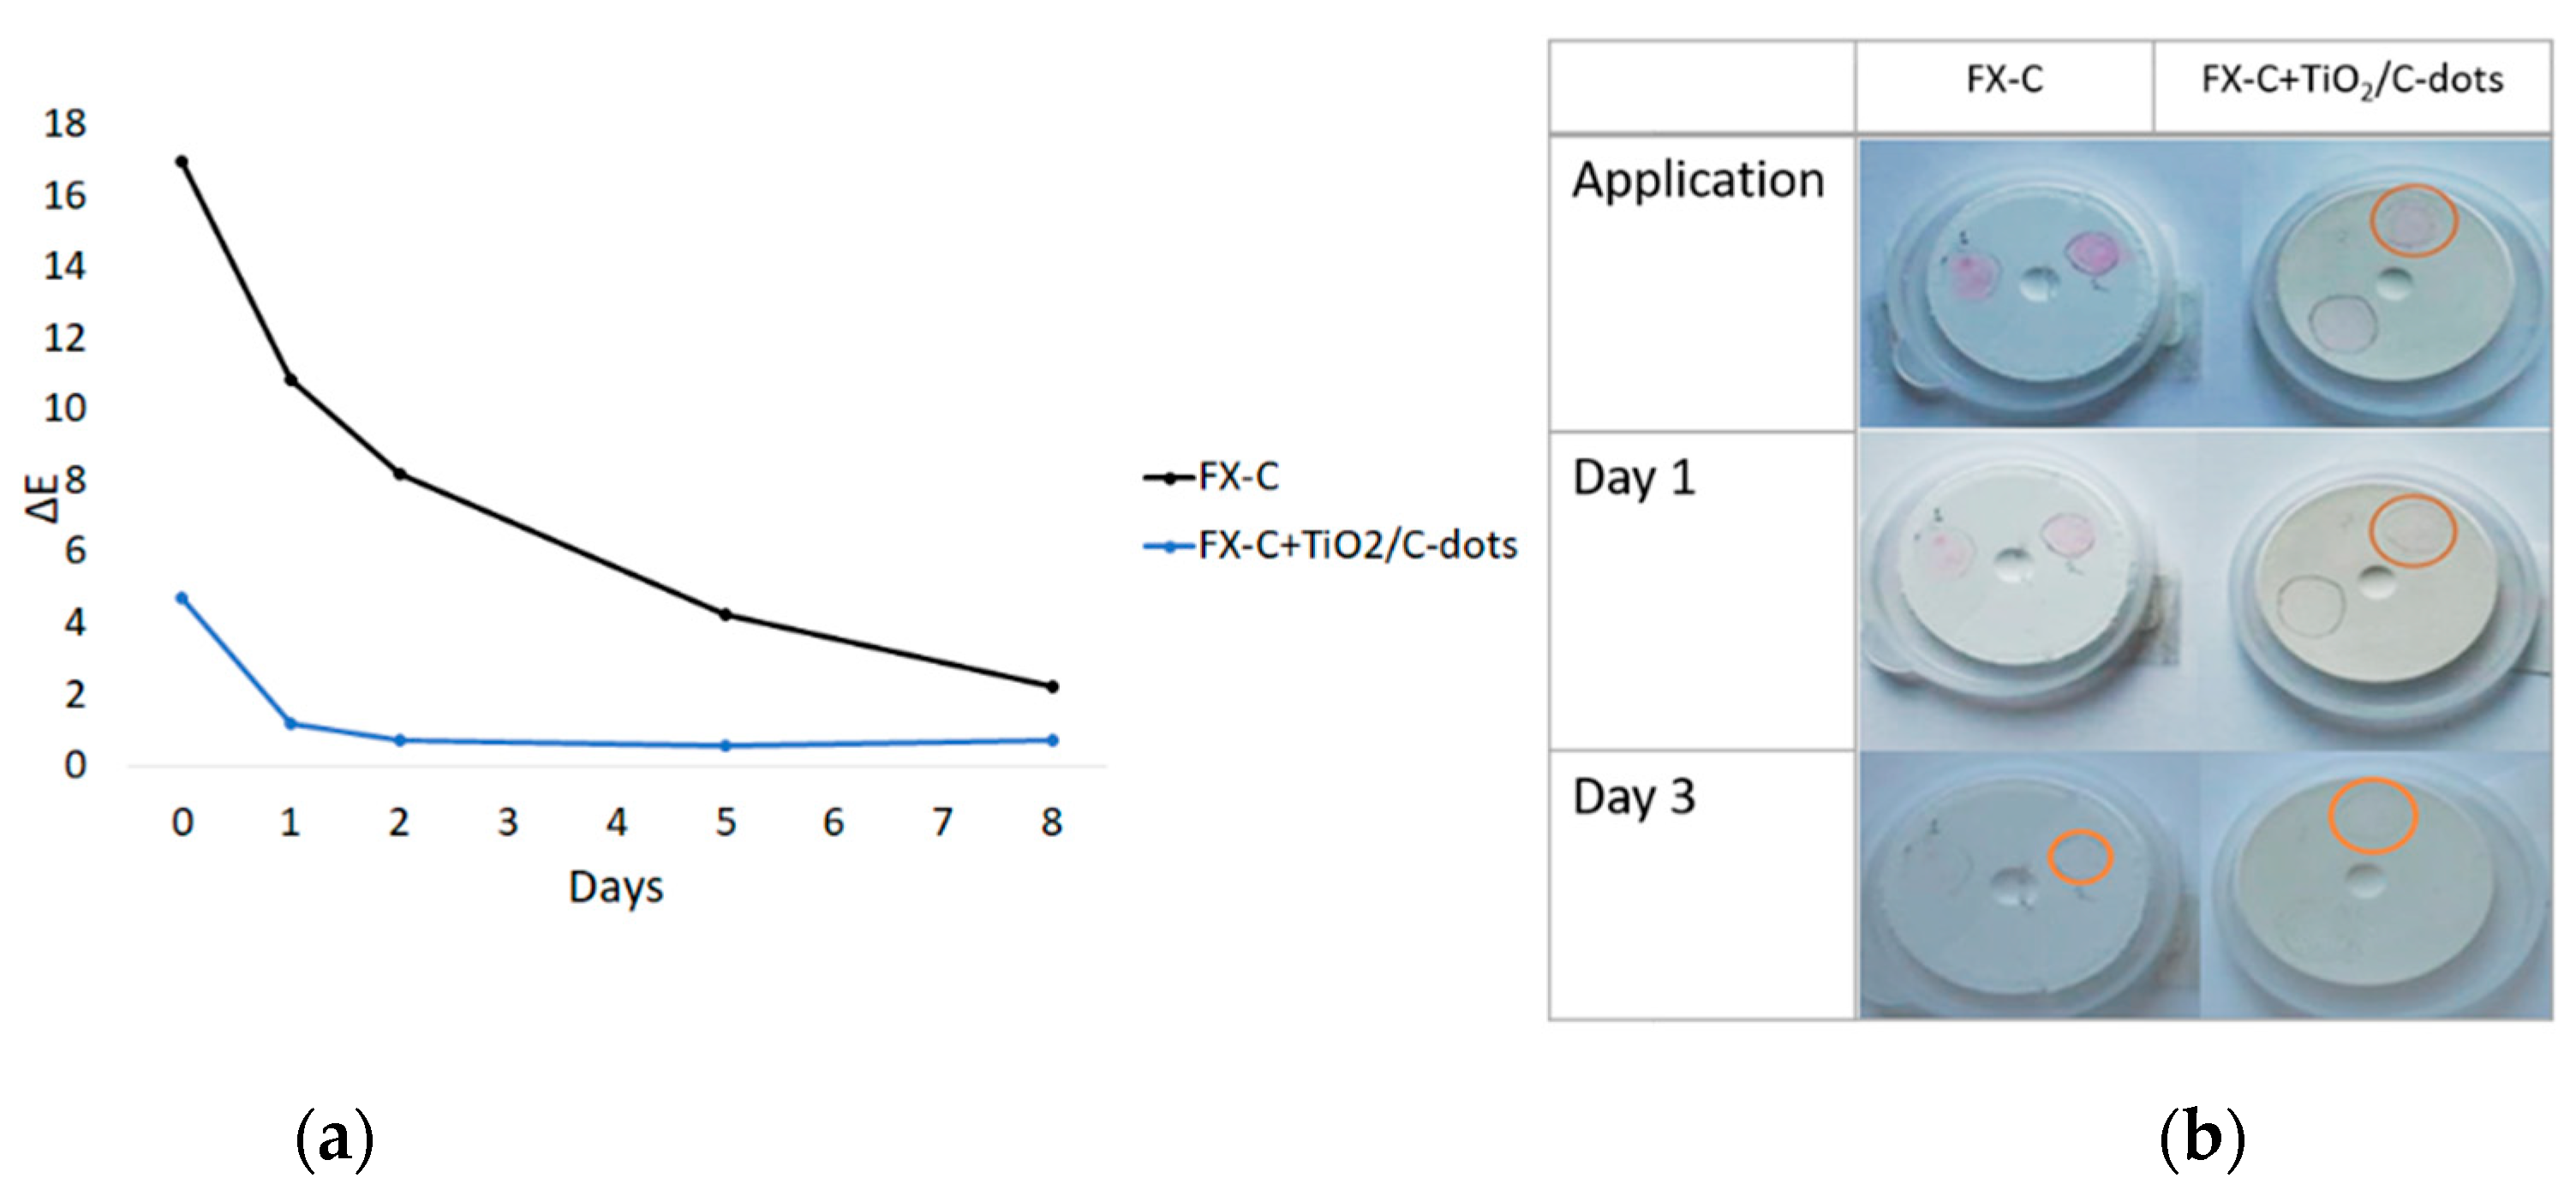
3.5. Photocatalytic Activity of Multifunctional Protective Films

The photocatalytic assessment of the protective films was carried out with the same organic pigment MO as an indicator, under UV and visible radiation. The degradation of MO was spectrophotometrically measured, via the decrease of MO bands at 463 nm. The study was realized for both FX-C xerogels containing pure TiO2 and TiO2 enriched with C-dots. Under UV radiation, the photocatalytic performance of the non-enhanced catalyst is not affected by its incorporation into the siliceous film. Specifically, the 50% of MO is decomposed after only 15 min of irradiation, whereas after 120 min the percentage reaches the 90% (Figure 13). The kinetic constant k, considering a pseudo 1st order photocatalytic reaction approach, was determined at 24.11 × 10⁻³ min−1. The results under visible radiation demonstrated that the photocatalytic constant of the degradation reaction is reduced at 1.86 × 10⁻³ min−1. In the case of the TiO2/C-dots, the photocatalytic degradation of MO is notably affected by the dispersion of the photocatalyst into the protective agent. Under neither UV nor solar radiation the multifunctional film manages to decompose a significant amount of the pigment, at least for the first 120 min of the experiment. As a result, the k constant was not able to be estimated. However, in order to evaluate if there is any photocatalytic action, the study was re-conducted for 24 h. At the end of the experiment the photocatalytic film successfully decomposes the 97% of the organic pigment, proving the retardation and not the absence of photocatalytic action.
Subsequently, bulk xerogels were tested for their photocatalytic properties via the degradation of drops of the same organic dye, MO, from their surface (Figure S5). A drop of MO was placed onto a marked spot of the xerogels’ surface that were then irradiated with visible light. The decolorization of the spot because of the photocatalytic degradation of the dye was monitored with a spectrophotometer with wavelength range from 360 to 740 nm, by measuring differences in color of the spotted area after several days from the application. As shown in Figure 14, the color difference between the xerogel’s surface before and immediately after the application of the MO drop is obviously lower in the case of the xerogel containing the photocatalyst TiO2/C-dots. Moreover, after only one day of application, the drop is completely decolorized on the enhanced xerogel, proving its photocatalytic activity, while on the FX-C xerogel, the MO drop can be still seen even after 3 days from the application.

4. Conclusions

Titanium dioxide nanoparticles treated with C-dots (TiO2/C-dots) were efficiently synthesized through a simple, low-temperature, cost-effective and large-scale procedure and were successfully incorporated into a siliceous protective agent, forming a multifunctional protective solution. Two simple and affordable compounds, citric acid and hydroxylamine, were utilized as precursors for the preparation of C-dots. XRD, Raman spectroscopy and TEM microscopy results identified anatase structure of TiO2/C-dots for as-synthesized materials. TiO2/C-dots were prepared by a cost-effective, and simple process. A comparison of the energy gap of pure TiO2 versus TiO2/C-dots shows the narrowing of the latter by 0.13 eV. TiO2/C-dots nanoparticles were studied for their ability to act as a catalyst. Indeed, the catalyst displays efficient photoactivity for the degradation of MO under visible and UV light. During the photocatalytic oxidation, the photodegradation of MO is completely effective and rapid after activation with UV light, following satisfactorily the pseudo first-order kinetic. Additionally, significant degradation of MO was observed in visible region. On the contrary, the synthesized TiO2 under the same conditions without C-dots displays remarkable lower activity under solar radiation by a factor of 10. The incorporation of C-dots into TiO2 was crucial for the increasing activity of the latter. The photocatalytic performance of the multifunctional film with pure TiO2, under UV radiation, exhibited values comparable to the pure TiO2, proving the activation’s independence of the catalyst after being incorporated in the protective agent. On the other hand, the enhanced TiO2/C-dots photocatalyst within the protective film did not perform as expected especially in the visible region, whereas in the UV region dissociated the MO in longer irradiation time. The photocatalytic activity of bulk xerogels was also evaluated by monitoring the discoloration of a drop of MO on the xerogels’ surface. In this case, the degradation of the dye was faster when the protective agent contained TiO2/C-dots.
The synthesized protective agents with the photocatalysts altered neither the color nor the consistency of the concrete, limestone or lime mortars surfaces.
In conclusion, the study succeeded in developing a multifunctional protective xerogel that combines hydrophobicity [48] and consolidation with photocatalytic properties under UV radiation, thus breaking new ground on conservation materials. Likewise, the TiO2/C-dots nanoparticles were characterized by advanced methods, including spectroscopic, microscopic and analytical techniques, whose results shed light on the structure, constitution and morphology of TiO2/C-dots evidencing that the synthesis followed resulted in the effectively photocatalytic anatase form of TiO2.

Supplementary Materials

The following are available online at https://www.mdpi.com/article/10.3390/coatings11080934/s1. Figure S1: Fluorescence spectra of TiO2/C-dots, Figure S2: TiO2/C-dots: UV–VIS spectra of MO before (black line) and after 180 min irradiation with UV (green line) and Vis (red line), Figure S3: TiO2/C-dots: Macroscopic image of Methylene Orange photodegradation by UV, Figure S4: TiO2/C-dots: Macroscopic image of Methylene Orange photodegradation by Vis, Figure S5: FX-C (a,d), FX-C with TiO2 (b,e), FX-C with TiO2/C-dots (c,f) in the form of sol and xerogel, respectively. Xerogels’ diameter is about 30 mm, Table S1: Mix design of the concrete and lime mortars treated with the proposed nanocomposite FX-C with TiO2-Cdots, Table S2. Protective agent uptake on concrete, limestone and lime mortar specimens.

Author Contributions

Conceptualization, P.-N.M.; methodology, P.-N.M. and A.B.; investigation, A.-I.K., T.K., and D.S., data curation P.-N.M., A.B., T.K., and D.S., writing—original draft preparation, P.-N.M., A.-I.K., T.K., and D.S; writing—review and editing, P.-N.M.; visualization, P.-N.M., T.K., and D.S.; supervision, P.-N.M.; project administration, P.-N.M.; funding acquisition, P.-N.M. and A.B. All authors have read and agreed to the published version of the manuscript.

Funding

Part of this research was financed by the InnovaConcrete project funded by the European program Horizon 2020 (GA n. 760858).

Institutional Review Board Statement

Not applicable.

Informed Consent Statement

Not applicable.

Data Availability Statement

Data available in a publicly accessible repository.

Acknowledgments

The authors would like to express their special thanks to Nikolaos Xekoukoulotakis (Technical University of Crete) for the photodegradation experiments on solar lamp. The authors should also like to thank the technicians of the laboratory Electron Microscopy ‘Vassilis Galanopoulos’ of Biology Department (University of Crete) and Aggelos Philippidis (IESL of Crete) for photoluminescence measurements. Special thanks should be given to Christos Christides and Maria Angelopoulou for their help.

Conflicts of Interest

The authors declare that there are no conflict of interest or personal relationship that may affect the conduct or reporting of the work submitted.

References

  1. Chiarello, G.; Dozzi, M.; Selli, E. TiO2-based materials for photocatalytic hydrogen production. J. Energy Chem. 2017, 26, 250–258. [Google Scholar] [CrossRef]
  2. Allen, N.S.; Mahdjoub, N.; Vishnyakov, V.; Kelly, P.J.; Kriek, R. The effect of crystalline phase (anatase, brookite and rutile) and size on the photocatalytic activity of calcined polymorphic titanium dioxide (TiO2). Polym. Degrad. Stab. 2018, 150, 31–36. [Google Scholar] [CrossRef]
  3. Haider, A.J.; Jameel, Z.N.; Al-Hussaini, I.H. Review on: Titanium dioxide applications. Energy Procedia 2019, 157, 17–29. [Google Scholar] [CrossRef]
  4. Rahimi, N.; Pax, R.A.; Gray, E.M. Review of functional titanium oxides. I: TiO2 and its modifications. Prog. Solid State Chem. 2016, 44, 86–105. [Google Scholar] [CrossRef]
  5. Di Valentin, C.; Pacchioni, G. Trends in non-metal doping of anatase TiO2: B, C, N and F. Catal. Today 2013, 206, 12–18. [Google Scholar] [CrossRef]
  6. Rahaman, Z.; Hossain, A.K.M.A. Effect of metal doping on the visible light absorption, electronic structure and mechanical properties of non-toxic metal halide CsGeCl3. RSC Adv. 2018, 8, 33010–33018. [Google Scholar] [CrossRef] [Green Version]
  7. Liu, J.; Li, R.; Yang, B. Carbon dots: A new type of carbon-based nanomaterial with wide applications. ACS Cent. Sci. 2020, 6, 2179–2195. [Google Scholar] [CrossRef]
  8. Van Dam, B.; Nie, H.; Ju, B.; Marino, E.; Paulusse, J.M.J.; Schall, P.; Li, M.; Dohnalová, K. Excitation-dependent photoluminescence from single-carbon dots. Small 2017, 13, 1702098. [Google Scholar] [CrossRef]
  9. Li, L.; Dong, T. Photoluminescence tuning in carbon dots: Surface passivation or/and functionalization, heteroatom doping. J. Mater. Chem. C 2018, 6, 7944–7970. [Google Scholar] [CrossRef]
  10. Wang, J.; Qiu, J. A review of carbon dots in biological applications. J. Mater. Sci. 2016, 51, 4728–4738. [Google Scholar] [CrossRef]
  11. Baker, S.N.; Baker, G.A. Luminescent carbon nanodots: Emergent nanolights. Angew. Chem. Int. Ed. 2010, 49, 6726–6744. [Google Scholar] [CrossRef] [PubMed]
  12. Hazarika, D.; Karak, N. Photocatalytic degradation of organic contaminants under solar light using carbon dot/titanium dioxide nanohybrid, obtained through a facile approach. Appl. Surf. Sci. 2016, 376, 276–285. [Google Scholar] [CrossRef]
  13. Wongso, V.; Chung, H.K.; Sambudi, N.S.; Sufian, S.; Abdullah, B.; Wirzal, M.D.H.; Ang, W.L. Silica–carbon quantum dots decorated titanium dioxide as sunlight-driven photocatalyst to diminish acetaminophen from aquatic environment. J. Photochem. Photobiol. A Chem. 2020, 394, 112436. [Google Scholar] [CrossRef]
  14. Saud, P.S.; Pant, B.; Alam, A.-M.; Ghouri, Z.K.; Park, M.; Kim, H.-Y. Carbon quantum dots anchored TiO2 nanofibers: Effective photocatalyst for waste water treatment. Ceram. Int. 2015, 41, 11953–11959. [Google Scholar] [CrossRef]
  15. Kumar, M.S.; Yasoda, K.Y.; Kumaresan, D.; Kothurkar, N.K.; Batabyal, S.K. TiO2-carbon quantum dots (CQD) nanohybrid: Enhanced photocatalytic activity. Mater. Res. Express 2018, 5, 075502. [Google Scholar] [CrossRef]
  16. Chen, J.; Shu, J.; Anqi, Z.; Juyuan, H.; Yan, Z.; Chen, J. Synthesis of carbon quantum dots/TiO2 nanocomposite for photo-degradation of Rhodamine B and cefradine. Diam. Relat. Mater. 2016, 70, 137–144. [Google Scholar] [CrossRef]
  17. Luo, H.; Dimitrov, S.D.; Daboczi, M.; Kim, J.-S.; Guo, Q.; Fang, Y.; Stoeckel, M.-A.; Samorì, P.; Fenwick, O.; Sobrido, A.B.J.; et al. Nitrogen-doped carbon dots/TiO2 nanoparticle composites for photoelectrochemical water oxidation. ACS Appl. Nano Mater. 2020, 3, 3371–3381. [Google Scholar] [CrossRef]
  18. Pichat, P. Photocatalytic Coatings in Comprehensive Materials Processing; Elsevier: Amsterdam, The Netherlands, 2014. [Google Scholar]
  19. Ganesh, V.A.; Raut, H.; Nair, A.S.; Ramakrishna, S. A review on self-cleaning coatings. J. Mater. Chem. 2011, 21, 16304–16322. [Google Scholar] [CrossRef]
  20. Guo, M.-Z.; Poon, C.S. Photocatalytic nano-mortars. In Smart Nanoconcretes and Cement-Based Materials; Elsevier: Amsterdam, The Netherlands, 2020. [Google Scholar] [CrossRef]
  21. Park, S.; Choi, G.R.; Lee, J.C.; Kim, Y.C.; Oh, D.; Cho, S.; Lee, J.-H. Organic and inorganic binder-coating properties for immobilization of photocatalytic ZnO nanopowders. Res. Chem. Intermed. 2010, 36, 819–825. [Google Scholar] [CrossRef]
  22. Colangiuli, D.; Calia, A.; Bianco, N. Novel multifunctional coatings with photocatalytic and hydrophobic properties for the preservation of the stone building heritage. Constr. Build. Mater. 2015, 93, 189–196. [Google Scholar] [CrossRef]
  23. Adachi, T.; Latthe, S.S.; Gosavi, S.W.; Roy, N.; Suzuki, N.; Ikari, H.; Kato, K.; Katsumata, K.-I.; Nakata, K.; Furudate, M.; et al. Photocatalytic, superhydrophilic, self-cleaning TiO2 coating on cheap, light-weight, flexible polycarbonate substrates. Appl. Surf. Sci. 2018, 458, 917–923. [Google Scholar] [CrossRef]
  24. Kapetanaki, K.; Vazgiouraki, E.; Stefanakis, D.; Fotiou, A.; Anyfantis, G.C.; Garcia-Lodeiro, I.; Blanco-Varela, M.T.; Arabatzis, I.; Maravelaki, P.N. TEOS modified with nano-calcium oxalate and PDMS to protect concrete based cultural heritage buildings. Front. Mater. 2020, 7. [Google Scholar] [CrossRef]
  25. David, M.E.; Ion, R.-M.; Grigorescu, R.M.; Iancu, L.; Andrei, E.R. Nanomaterials used in conservation and restoration of cultural heritage: An up-to-date overview. Materials 2020, 13, 2064. [Google Scholar] [CrossRef]
  26. Scherer, G.W.; Wheeler, G.S. Silicate consolidants for stone. Key Eng. Mater. 2008, 391, 1–25. [Google Scholar] [CrossRef]
  27. Maravelaki-Kalaitzaki, P. Black crusts and patinas on pentelic marble from the parthenon and erechtheum (Acropolis, Athens): Characterization and origin. Anal. Chim. Acta 2005, 532, 187–198. [Google Scholar] [CrossRef]
  28. Joost, U.; Juganson, K.; Visnapuu, M.; Mortimer, M.; Kahru, A.; Nommiste, E.; Joost, U.; Kisand, V.; Ivask, A. Photocatalytic antibacterial activity of nano-TiO2 (anatase)-based thin films: Effects on Escherichia coli cells and fatty acids. J. Photochem. Photobiol. B Biol. 2015, 142, 178–185. [Google Scholar] [CrossRef] [PubMed]
  29. Stefanakis, D.; Philippidis, A.; Sygellou, L.; Filippidis, G.; Ghanotakis, D.; Anglos, D. Synthesis of fluorescent carbon dots by a microwave heating process: Structural characterization and cell imaging applications. J. Nanopart. Res. 2014, 16, 1–10. [Google Scholar] [CrossRef]
  30. Han, Z.; He, L.; Pan, S.; Liu, H.; Hu, X. Hydrothermal synthesis of carbon dots and their application for detection of chlorogenic acid. Luminescence 2020, 35, 989–997. [Google Scholar] [CrossRef] [PubMed]
  31. Smits, M.; Chan, C.K.; Tytgat, T.; Craeye, B.; Costarramone, N.; Lacombe, S.; Lenaerts, S. Photocatalytic degradation of soot deposition: Self-cleaning effect on titanium dioxide coated cementitious materials. Chem. Eng. J. 2013, 222, 411–418. [Google Scholar] [CrossRef]
  32. Melhuish, W.H. Quantum efficiencies of fluorescence of organic substances: Effect of solvent and concentration of the fluo-rescent solute. J. Phys. Chem. 1961, 65, 229–235. [Google Scholar] [CrossRef]
  33. Liu, H.; Zhao, X.; Wang, F.; Wang, Y.; Guo, L.; Mei, J.; Tian, C.; Yang, X.; Zhao, D. High-efficient excitation-independent blue luminescent carbon dots. Nanoscale Res. Lett. 2017, 12, 399. [Google Scholar] [CrossRef] [Green Version]
  34. Johari, N.D.; Rosli, Z.M.; Juoi, J.M.; Yazid, S.A. Comparison on the TiO2 crystalline phases deposited via dip and spin coating using green sol–gel route. J. Mater. Res. Technol. 2019, 8, 2350–2358. [Google Scholar] [CrossRef]
  35. Konstantinou, I.K.; A Albanis, T. TiO2-assisted photocatalytic degradation of azo dyes in aqueous solution: Kinetic and mechanistic investigations: A review. Appl. Catal. B Environ. 2004, 49, 1–14. [Google Scholar] [CrossRef]
  36. Zhang, H.; Banfield, J. Thermodynamic analysis of phase stability of nanocrystalline titania. J. Mater. Chem. 1998, 8, 2073–2076. [Google Scholar] [CrossRef]
  37. Wu, W.-Y.; Chang, Y.-M.; Ting, J.-M. Room-temperature synthesis of single-crystalline anatase TiO2 nanowires. Cryst. Growth Des. 2010, 10, 1646–1651. [Google Scholar] [CrossRef]
  38. Dai, S.; Wu, Y.; Sakai, T.; Du, Z.; Sakai, H.; Abe, M. Preparation of highly crystalline TiO2 nanostructures by acid-assisted hydrothermal treatment of hexagonal-structured nanocrystalline titania/cetyltrimethyammonium bromide nanoskeleton. Nanoscale Res. Lett. 2010, 5, 1829–1835. [Google Scholar] [CrossRef] [PubMed] [Green Version]
  39. Lu, W.; Qin, X.; Liu, S.; Chang, G.; Zhang, Y.; Luo, Y.; Asiri, A.M.; Al-Youbi, A.O.; Sun, X. Economical, green synthesis of fluorescent carbon nanoparticles and their use as probes for sensitive and selective detection of mercury(II) ions. Anal. Chem. 2012, 84, 5351–5357. [Google Scholar] [CrossRef]
  40. Xu, H.; Yang, X.; Li, G.; Zhao, C.; Liao, X. Green synthesis of fluorescent carbon dots for selective detection of tartrazine in food samples. J. Agric. Food Chem. 2015, 63, 6707–6714. [Google Scholar] [CrossRef] [PubMed]
  41. Roy, P.; Chen, P.-C.; Periasamy, A.P.; Chen, Y.-N.; Chang, H.-T. Photoluminescent carbon nanodots: Synthesis, physicochemical properties and analytical applications. Mater. Today 2015, 18, 447–458. [Google Scholar] [CrossRef]
  42. Zhang, Q.; Ma, L.; Shao, M.; Huang, J.; Ding, M.; Deng, X.; Wei, X.; Xu, X. Anodic oxidation synthesis of one-dimensional TiO2 nanostructures for photocatalytic and field emission properties. J. Nanomater. 2014, 2014, 831752. [Google Scholar] [CrossRef] [Green Version]
  43. Challagulla, S.; Tarafder, K.; Ganesan, R.; Roy, S. Structure sensitive photocatalytic reduction of nitroarenes over TiO2. Sci. Rep. 2017, 7, 8783. [Google Scholar] [CrossRef]
  44. Stagi, L.; Carbonaro, C.M.; Corpino, R.; Chiriu, D.; Ricci, P.C. Light induced TiO2 phase transformation: Correlation with luminescent surface defects. Phys. Status Solidi 2014, 252, 124–129. [Google Scholar] [CrossRef]
  45. Kapridaki, C.; Pinho, L.; Mosquera, M.J. Producing photoactive, transparent and hydrophobic SiO2-crystalline TiO2 nanocomposites at ambient conditions with application as self-cleaning coatings. Appl. Catal. B Environ. 2014, 156, 416–427. [Google Scholar] [CrossRef]
  46. Monllor-Satoca, D.; Gómez, R.; González-Hidalgo, M.; Salvador, P. The “Direct–Indirect” model: An alternative kinetic approach in heterogeneous photocatalysis based on the degree of interaction of dissolved pollutant species with the semiconductor surface. Catal. Today 2007, 129, 247–255. [Google Scholar] [CrossRef]
  47. Kapridaki, C.; Xynidis, N.; Vazgiouraki, E.; Kallithrakas-Kontos, N.; Maravelaki-Kalaitzaki, P. Characterization of photoactive Fe-TiO2 lime coatings for building protection: The role of iron content. Materials 2019, 12, 1847. [Google Scholar] [CrossRef] [PubMed] [Green Version]
  48. Kapridaki, C.; Verganelaki, A.; Dimitriadou, P.; Maravelaki-Kalaitzaki, P. Conservation of monuments by a three-layered compatible treatment of TEOS-nano-calcium oxalate consolidant and TEOS-PDMS-TiO2 hydrophobic/photoactive hybrid nanomaterials. Materials 2018, 11, 684. [Google Scholar] [CrossRef] [Green Version]
Figure 1. Synthesis route of TiO2 enriched with C-dots.
Coatings 11 00934 g001
Figure 2. UV–VIS spectra and photoluminescence Excitation (200 nm)—Emission (350 nm) spectra (a), photoluminescence spectra (b,c) of aqueous C-dots solution; (d) fitting used to calculate the quantum yield (QY) of C-dots dispersed in water. The quinine sulfate (QS) and anthracene (An) were used as references.
Coatings 11 00934 g002
Figure 3. TEM images of C-dots (ac) and diameter size distribution diagram (d).
Coatings 11 00934 g003
Figure 4. X-ray diffraction patters of TiO2 and TiO2 enriched with C-dots.
Coatings 11 00934 g004
Figure 5. SEM images of TiO2 enriched with C-dots: (a) image captured from random area; (bd) magnified images of the area selected at (a).
Coatings 11 00934 g005
Figure 6. SEM images of pure TiO2: (a) image captured from random area; (b) magnified images of the area selected at (a).
Coatings 11 00934 g006
Figure 7. TEM images of TiO2 enriched with C-dots: (a,c) image captured from random areas; (b,d) magnified images of the area selected at (a).
Coatings 11 00934 g007
Figure 8. TEM images of pure TiO2: (a) image captured from random area; (b) magnified images of the area selected at (a).
Coatings 11 00934 g008
Figure 9. (a) FTIR spectra of C-dots, TiO2 and TiO2 enriched with C-dots. (b) Raman spectra of TiO2 and TiO2 enriched with C-dots.
Coatings 11 00934 g009
Figure 10. (a) Reflectance spectra and (b) Tauc plots of TiO2 and TiO2 enriched with C-dots for the calculation of their energy gap.
Coatings 11 00934 g010
Figure 11. Photocatalytic degradation curves of MO by TiO2 and TiO2 enriched with C-dots under UV and visible irradiation.
Coatings 11 00934 g011
Figure 12. Concrete (a,d), limestone (b,e) and lime mortar (c,f) specimens before application and after application, respectively.
Coatings 11 00934 g012
Figure 13. Photocatalytic degradation curves of MO by enhanced xerogels with (a) TiO2 and (b) TiO2 enriched with C-dots under UV and visible irradiation.
Coatings 11 00934 g013
Figure 14. (a) Variation graph of factor ΔE as a function of time. (b) Visual evaluation of the samples over time.
Coatings 11 00934 g014
Table 1. Changes in color (ΔE*) exhibited by treating different substrates with enhanced photocatalytic protective films.
SubstrateΔE*
Concrete
FX-C1.68
FX-C + TiO22.25
FX-C + TiO2/C-dots2.20
Limestone
FX-C7.37
FX-C + TiO24.06
FX-C + TiO2/C-dots6.58
Lime Mortar
FX-C4.7
FX-C + TiO25.15
FX-C + TiO2/C-dots6.47
Publisher’s Note: MDPI stays neutral with regard to jurisdictional claims in published maps and institutional affiliations.

