
Sound-Absorption Performance and Fractal Dimension Feature of Kapok Fibre/Polycaprolactone Composites

Abstract
:1. Introduction
2. Materials and Methods
2.1. Materials
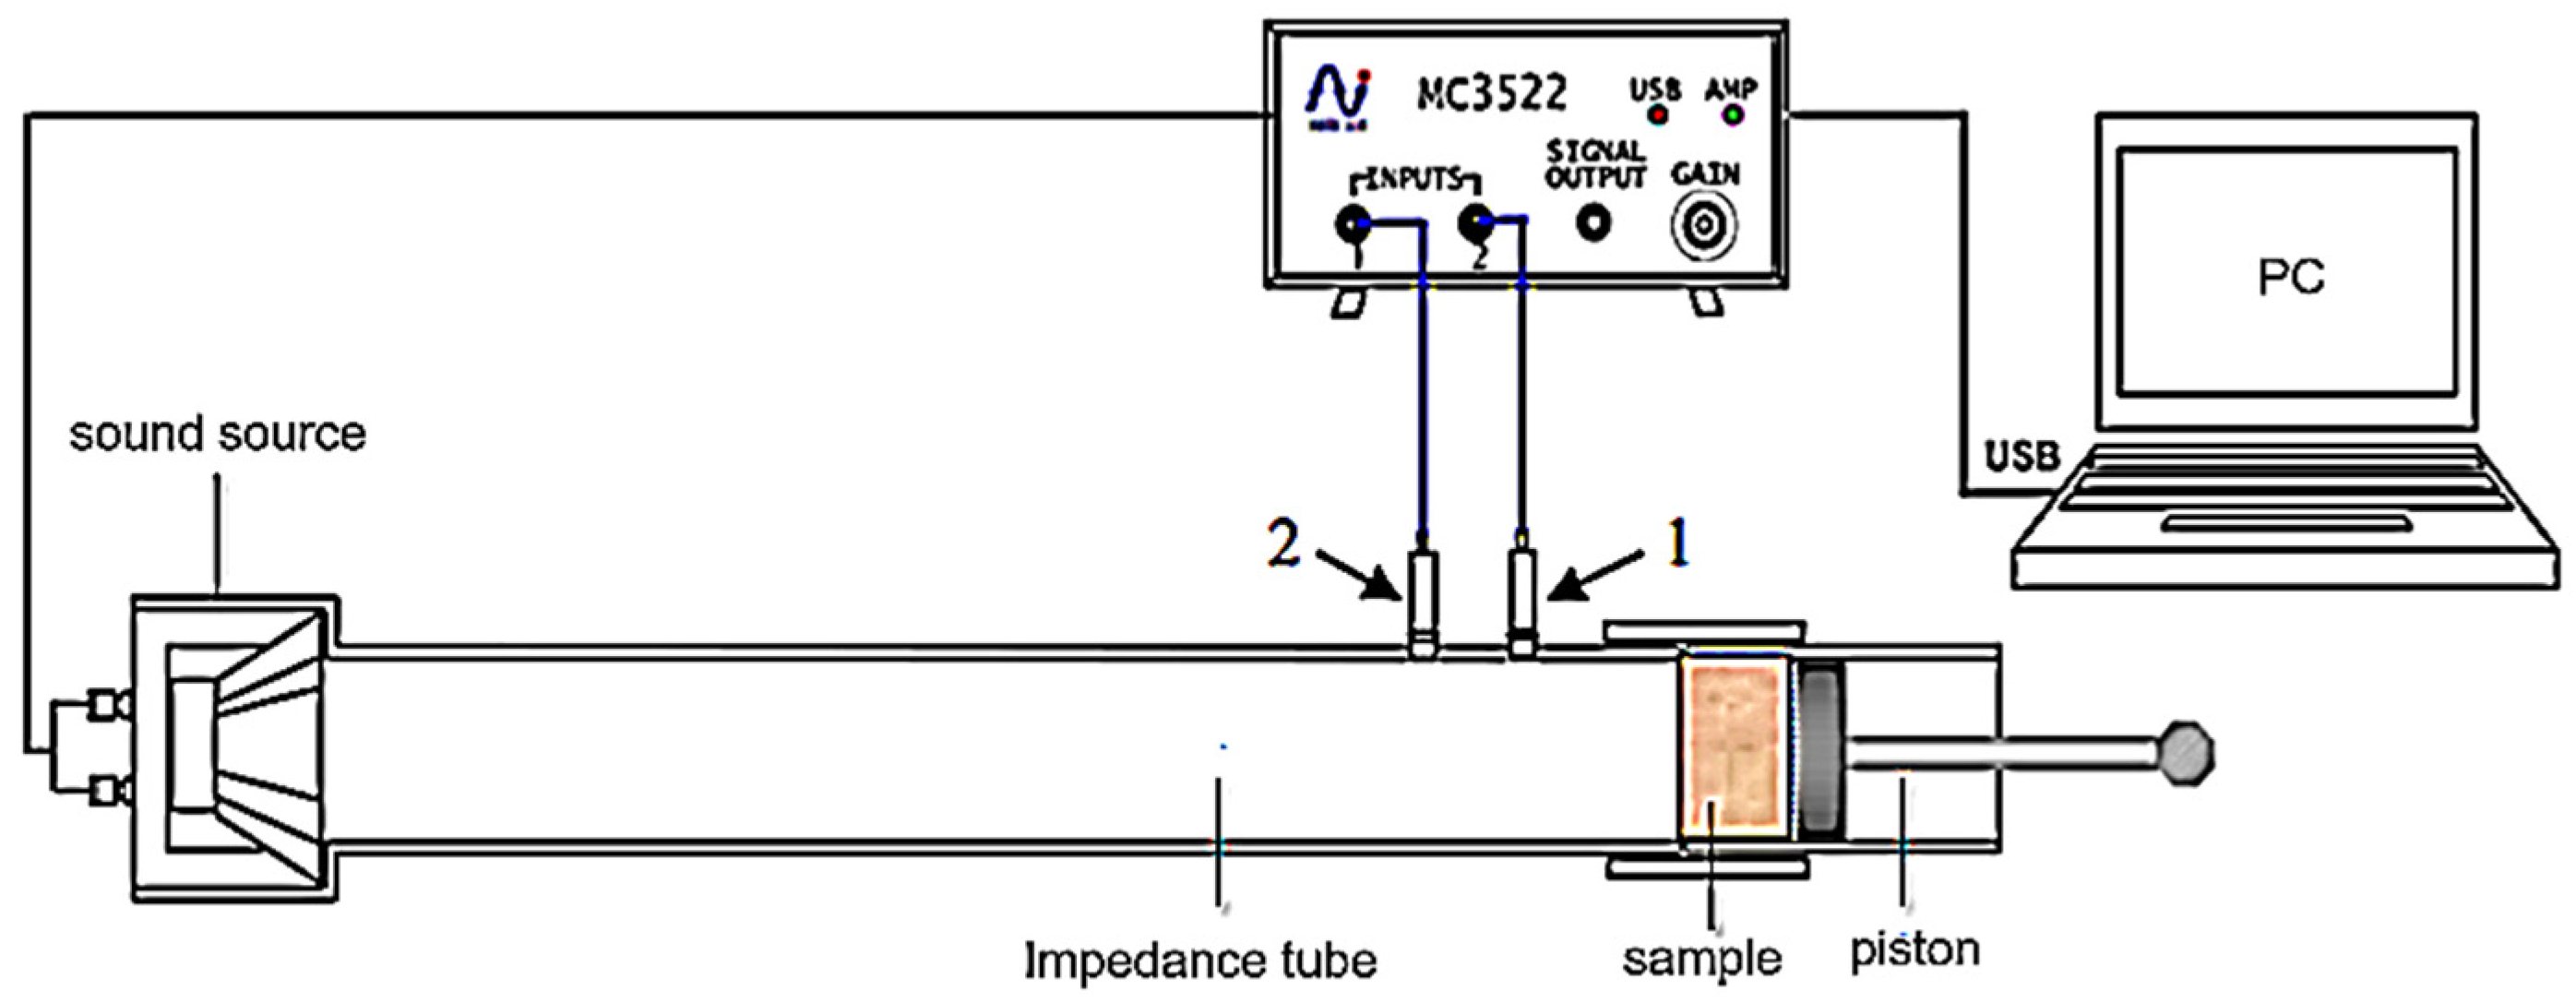
2.2. Equipment
2.3. Preparation of Composites
2.4. Testing of the Composites
2.4.1. Sound-Absorption Coefficient Test
2.4.2. Calculation of Porosity
2.4.3. Fractal Characterisation
3. Results and Discussion
3.1. Influence of Process Parameters on the Sound-Absorption Coefficient
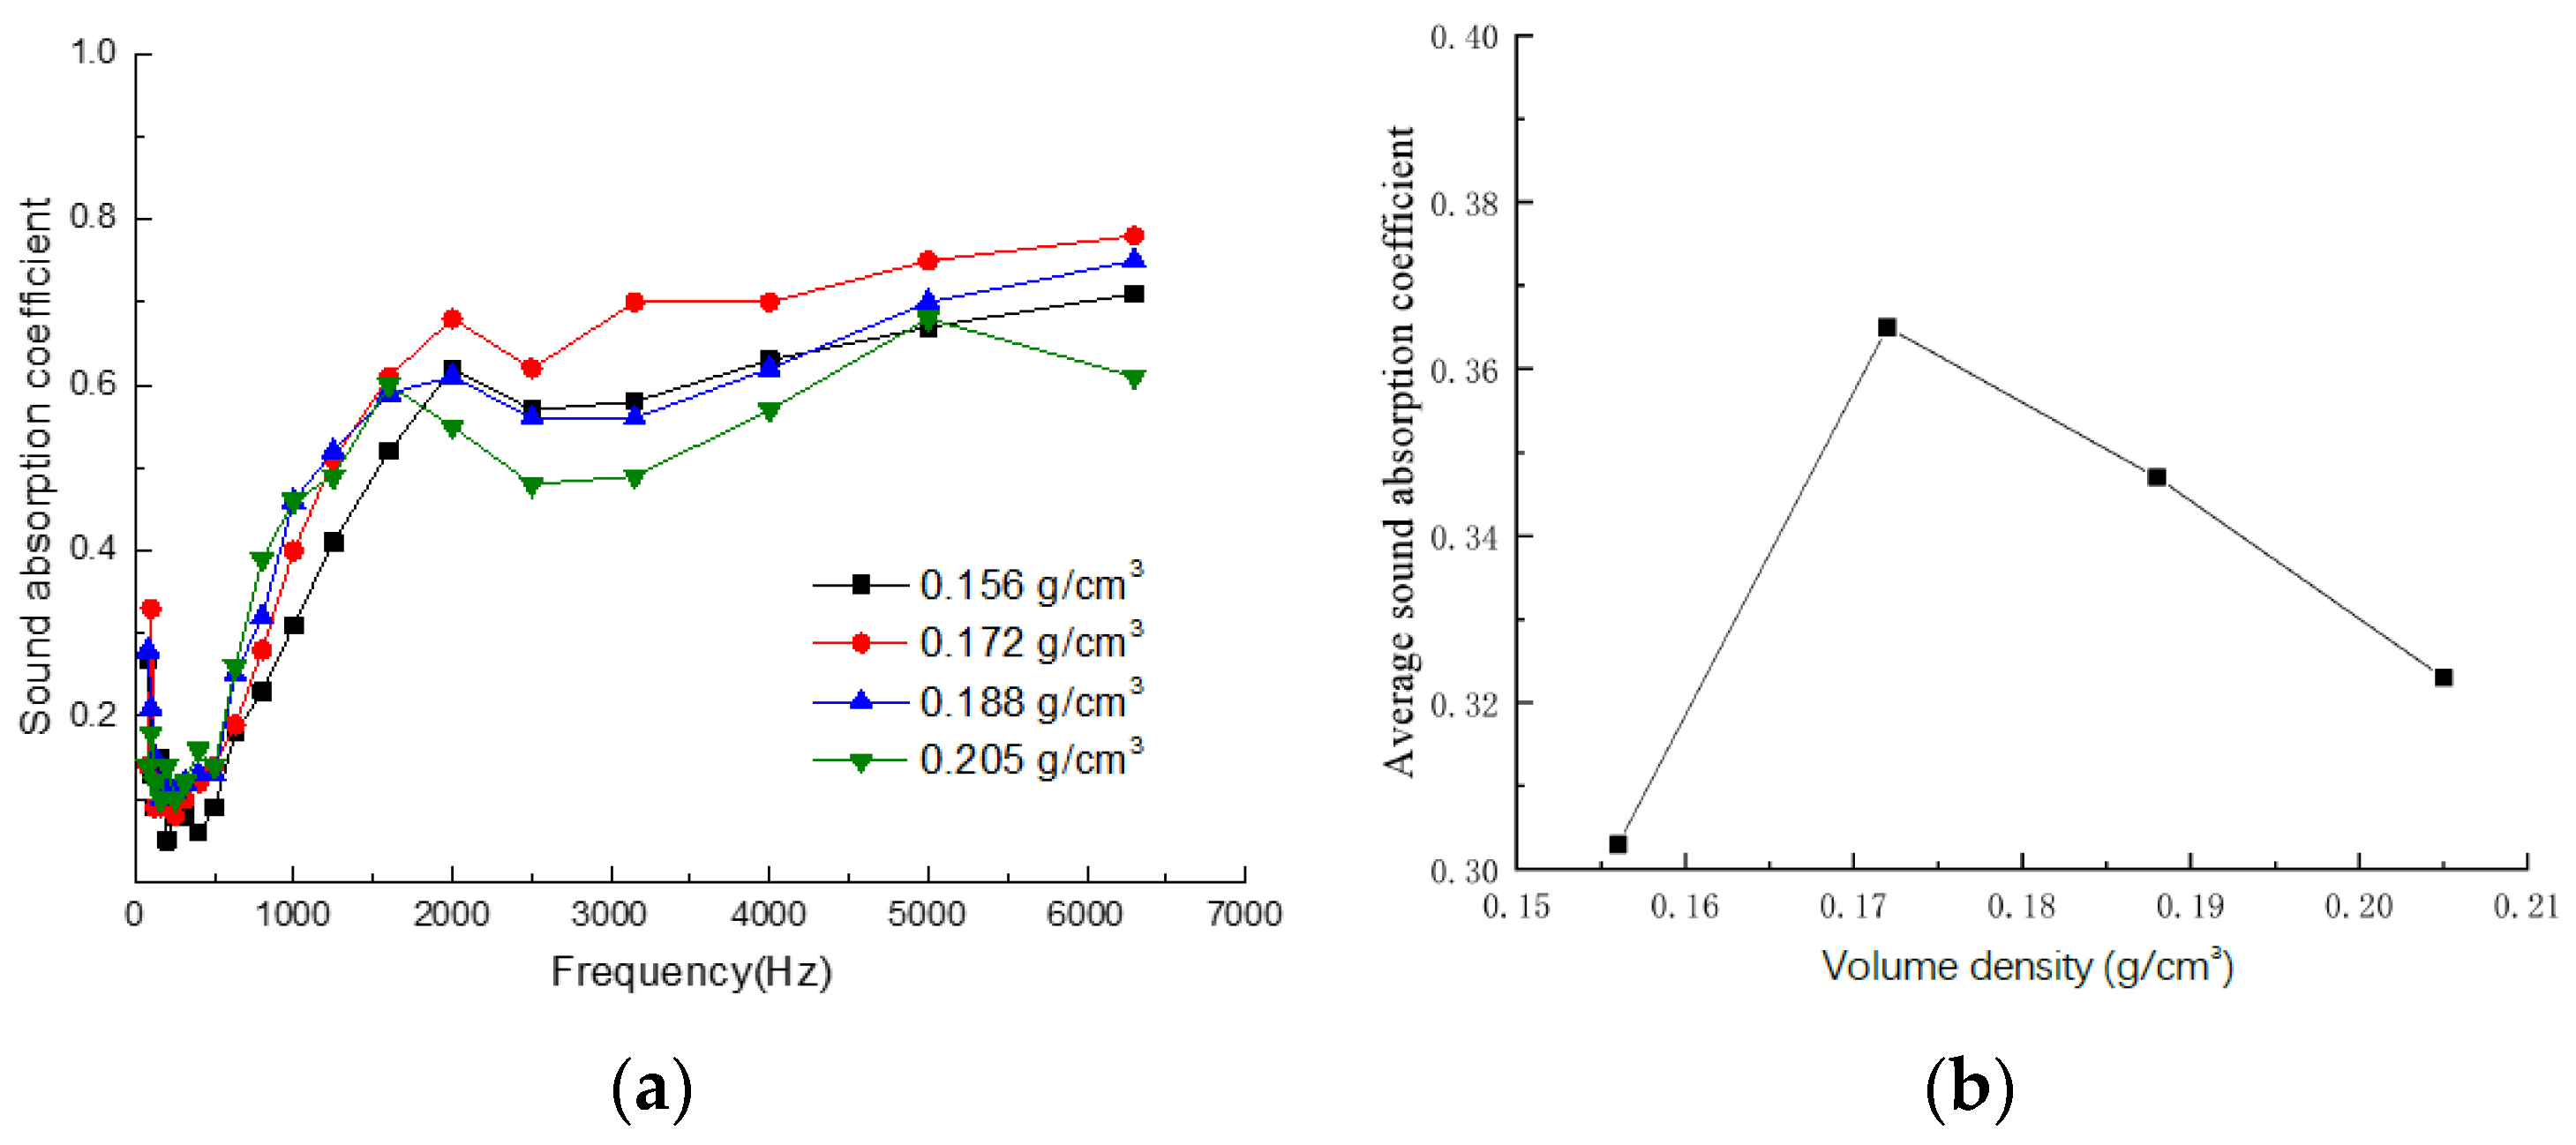
3.1.1. Influence of Volume Density on the Sound-Absorption Coefficient
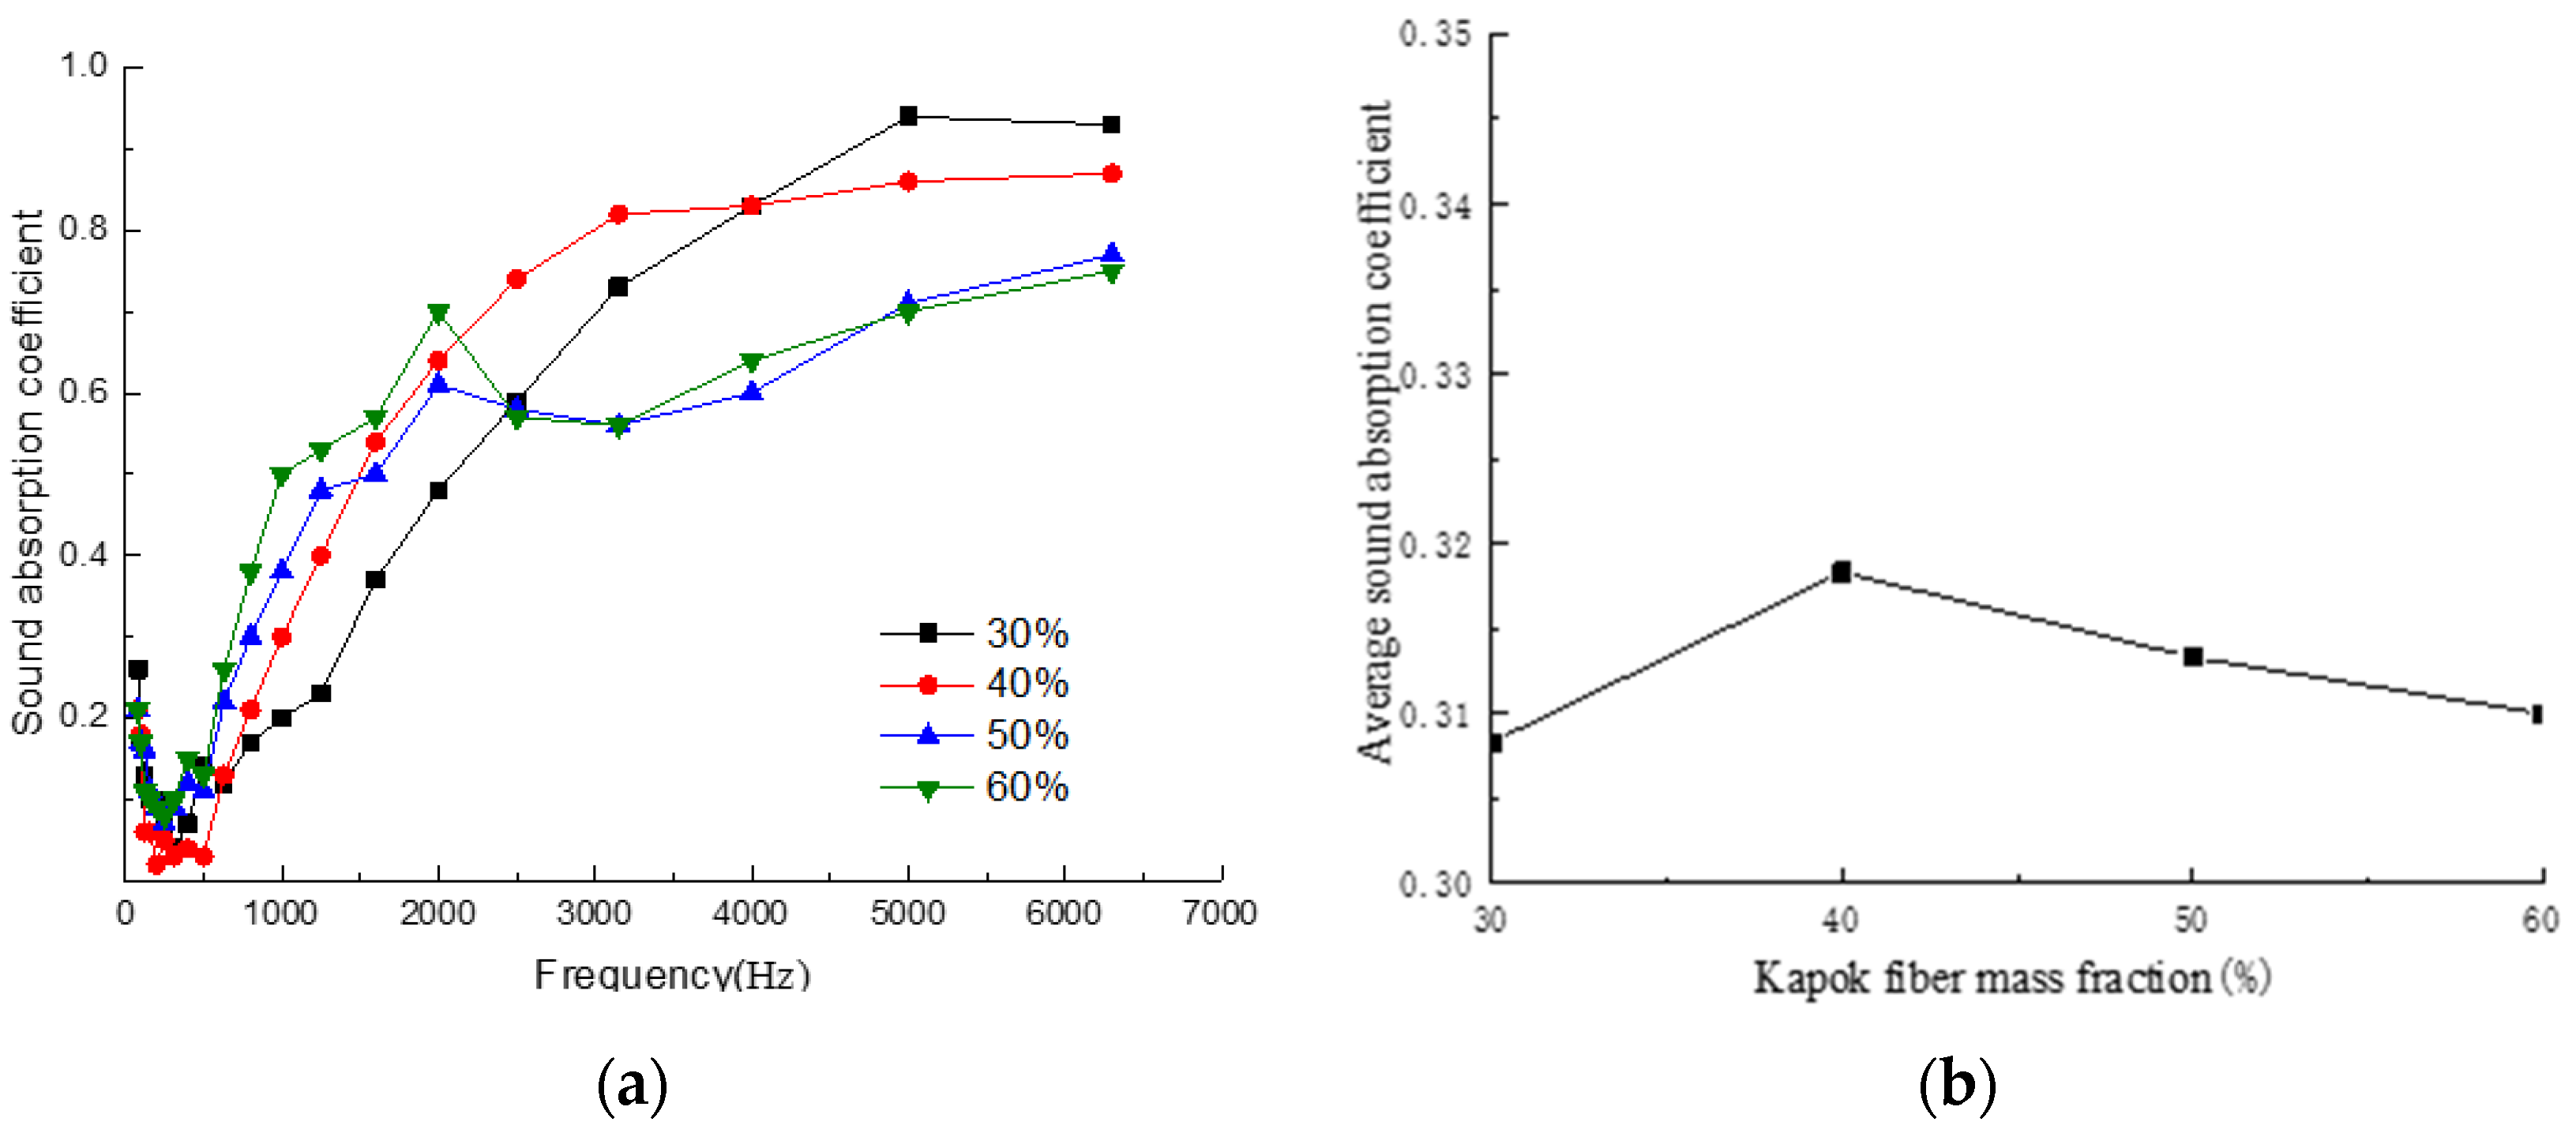
3.1.2. Influence of Mass Fraction of Kapok Fibre on the Sound-Absorption Coefficient
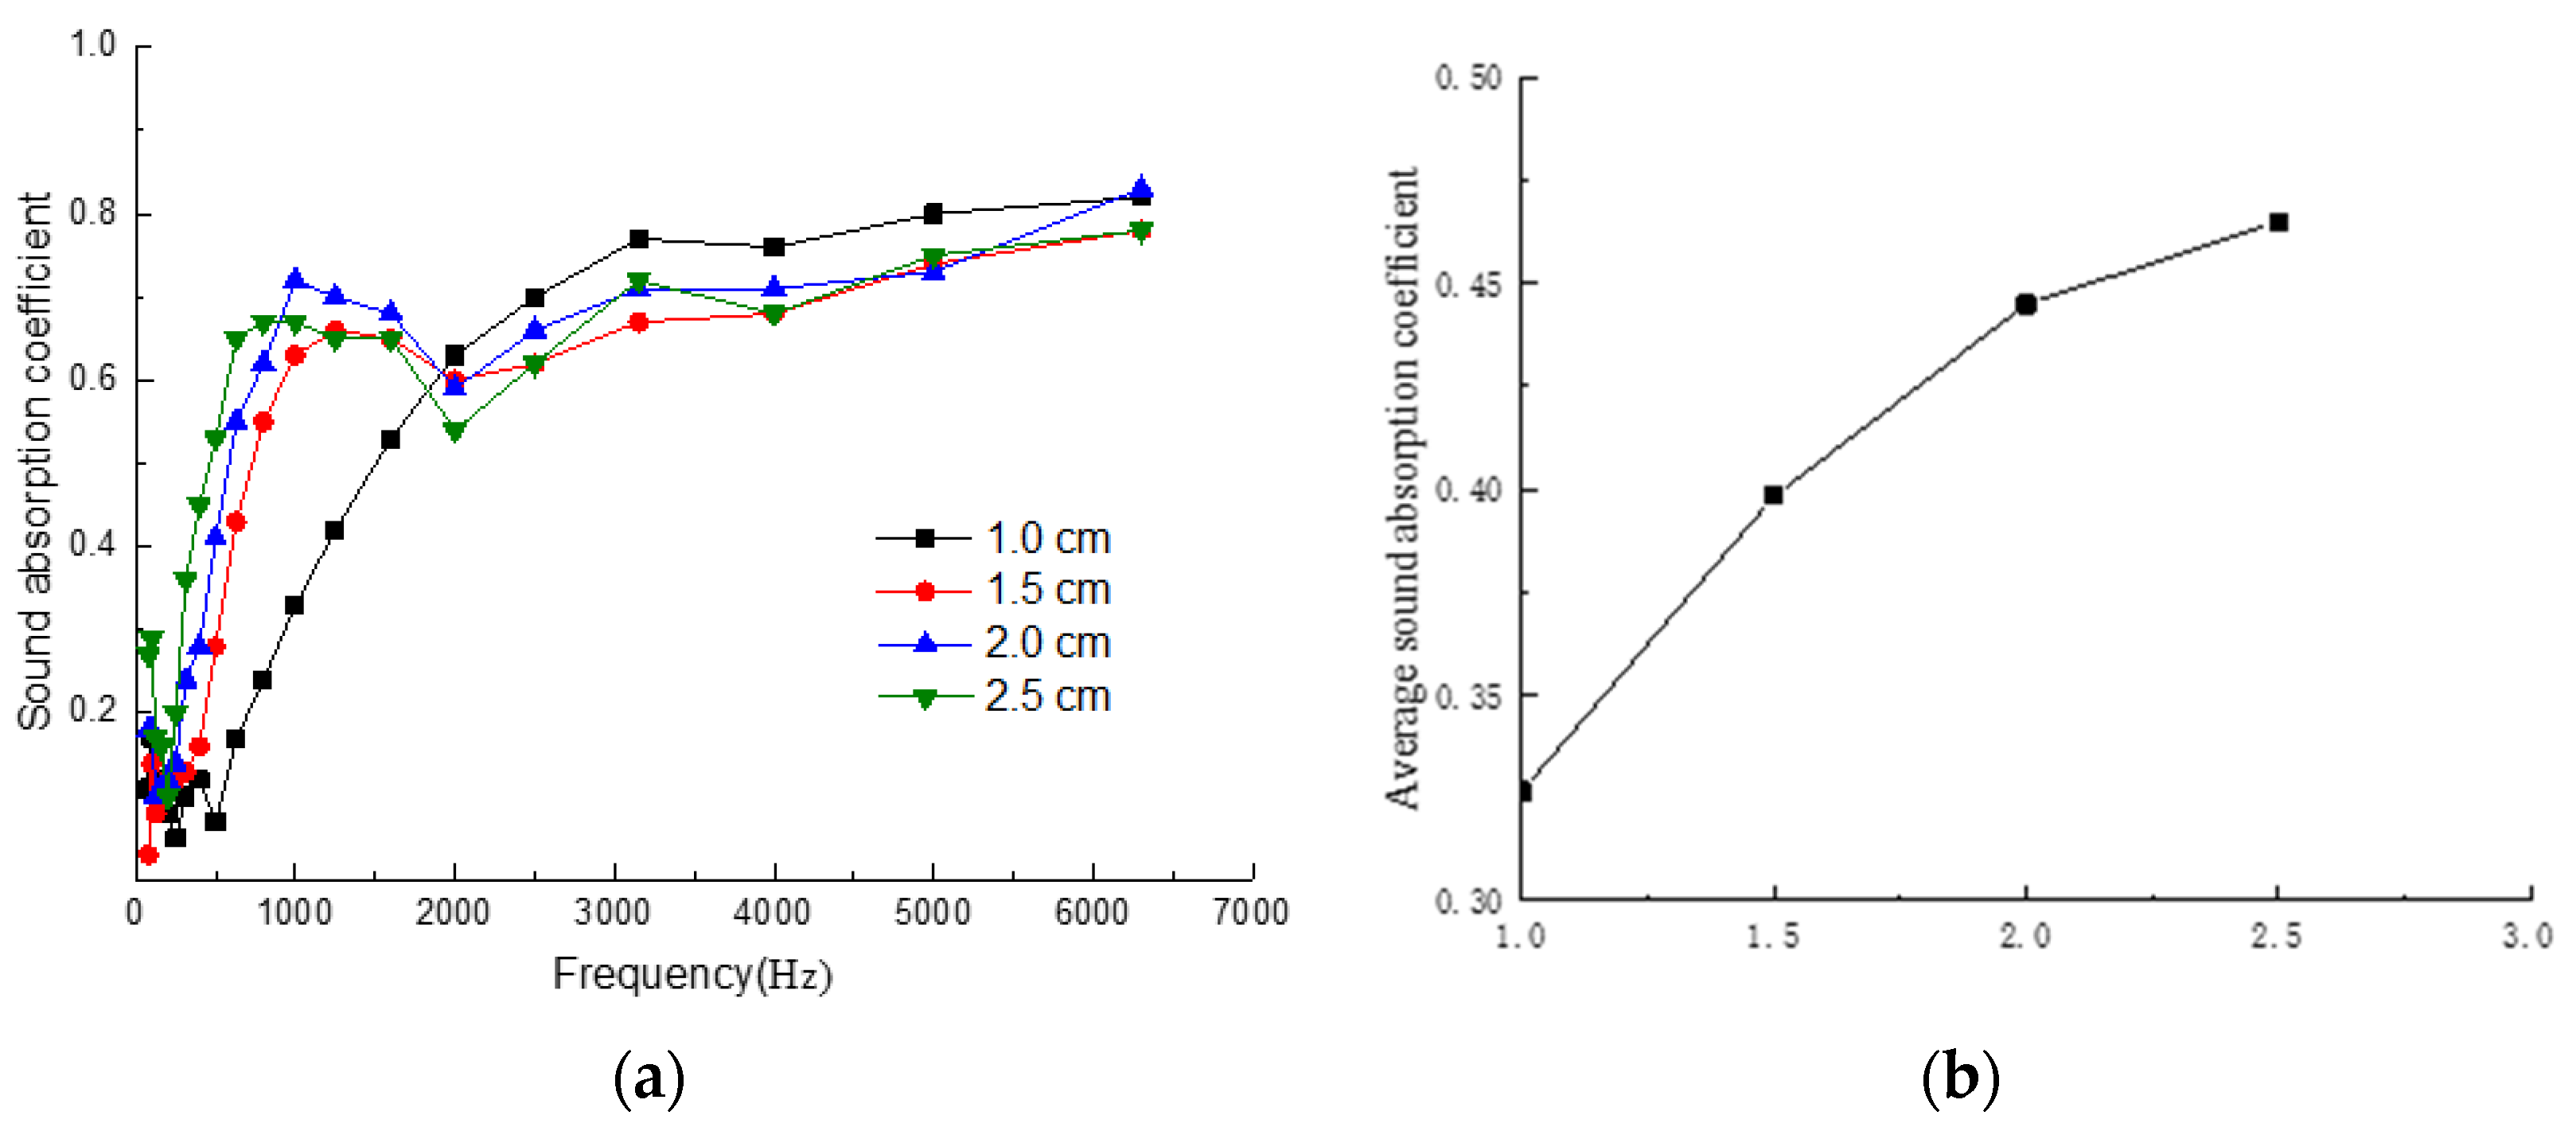
3.1.3. Influence of Thickness on the Sound-Absorption Coefficient
3.2. Fractal Characterisation Results
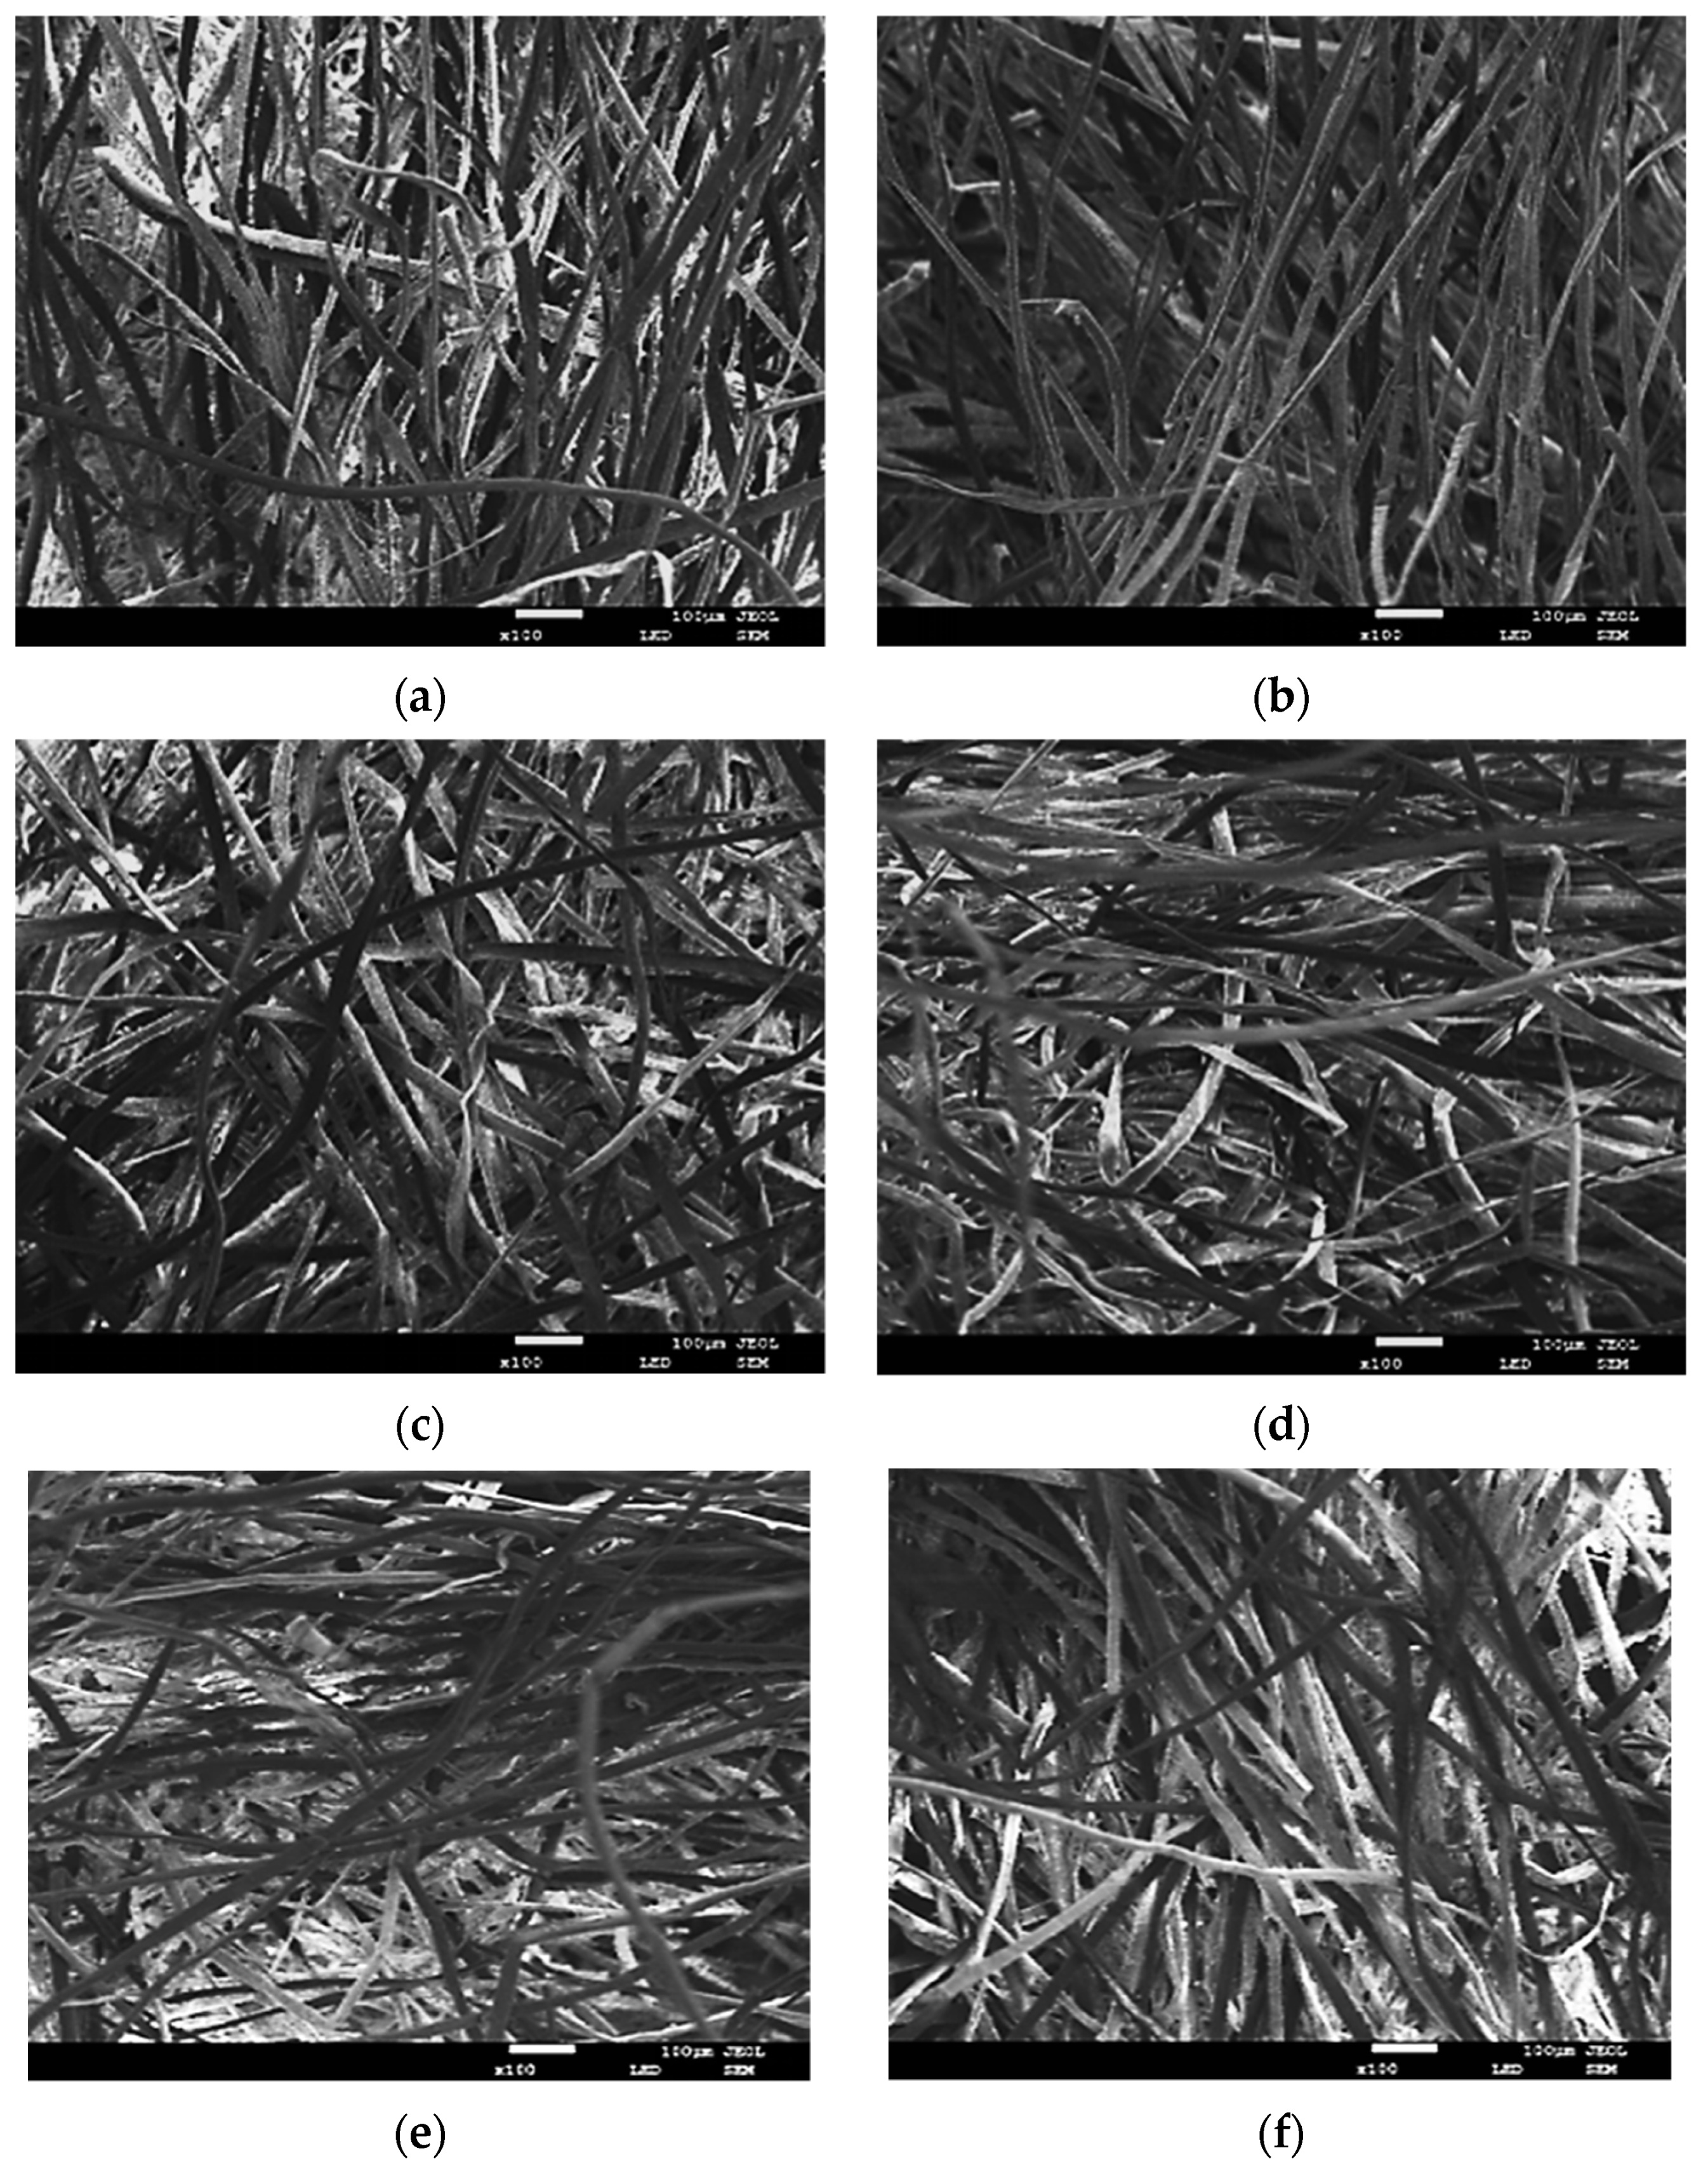
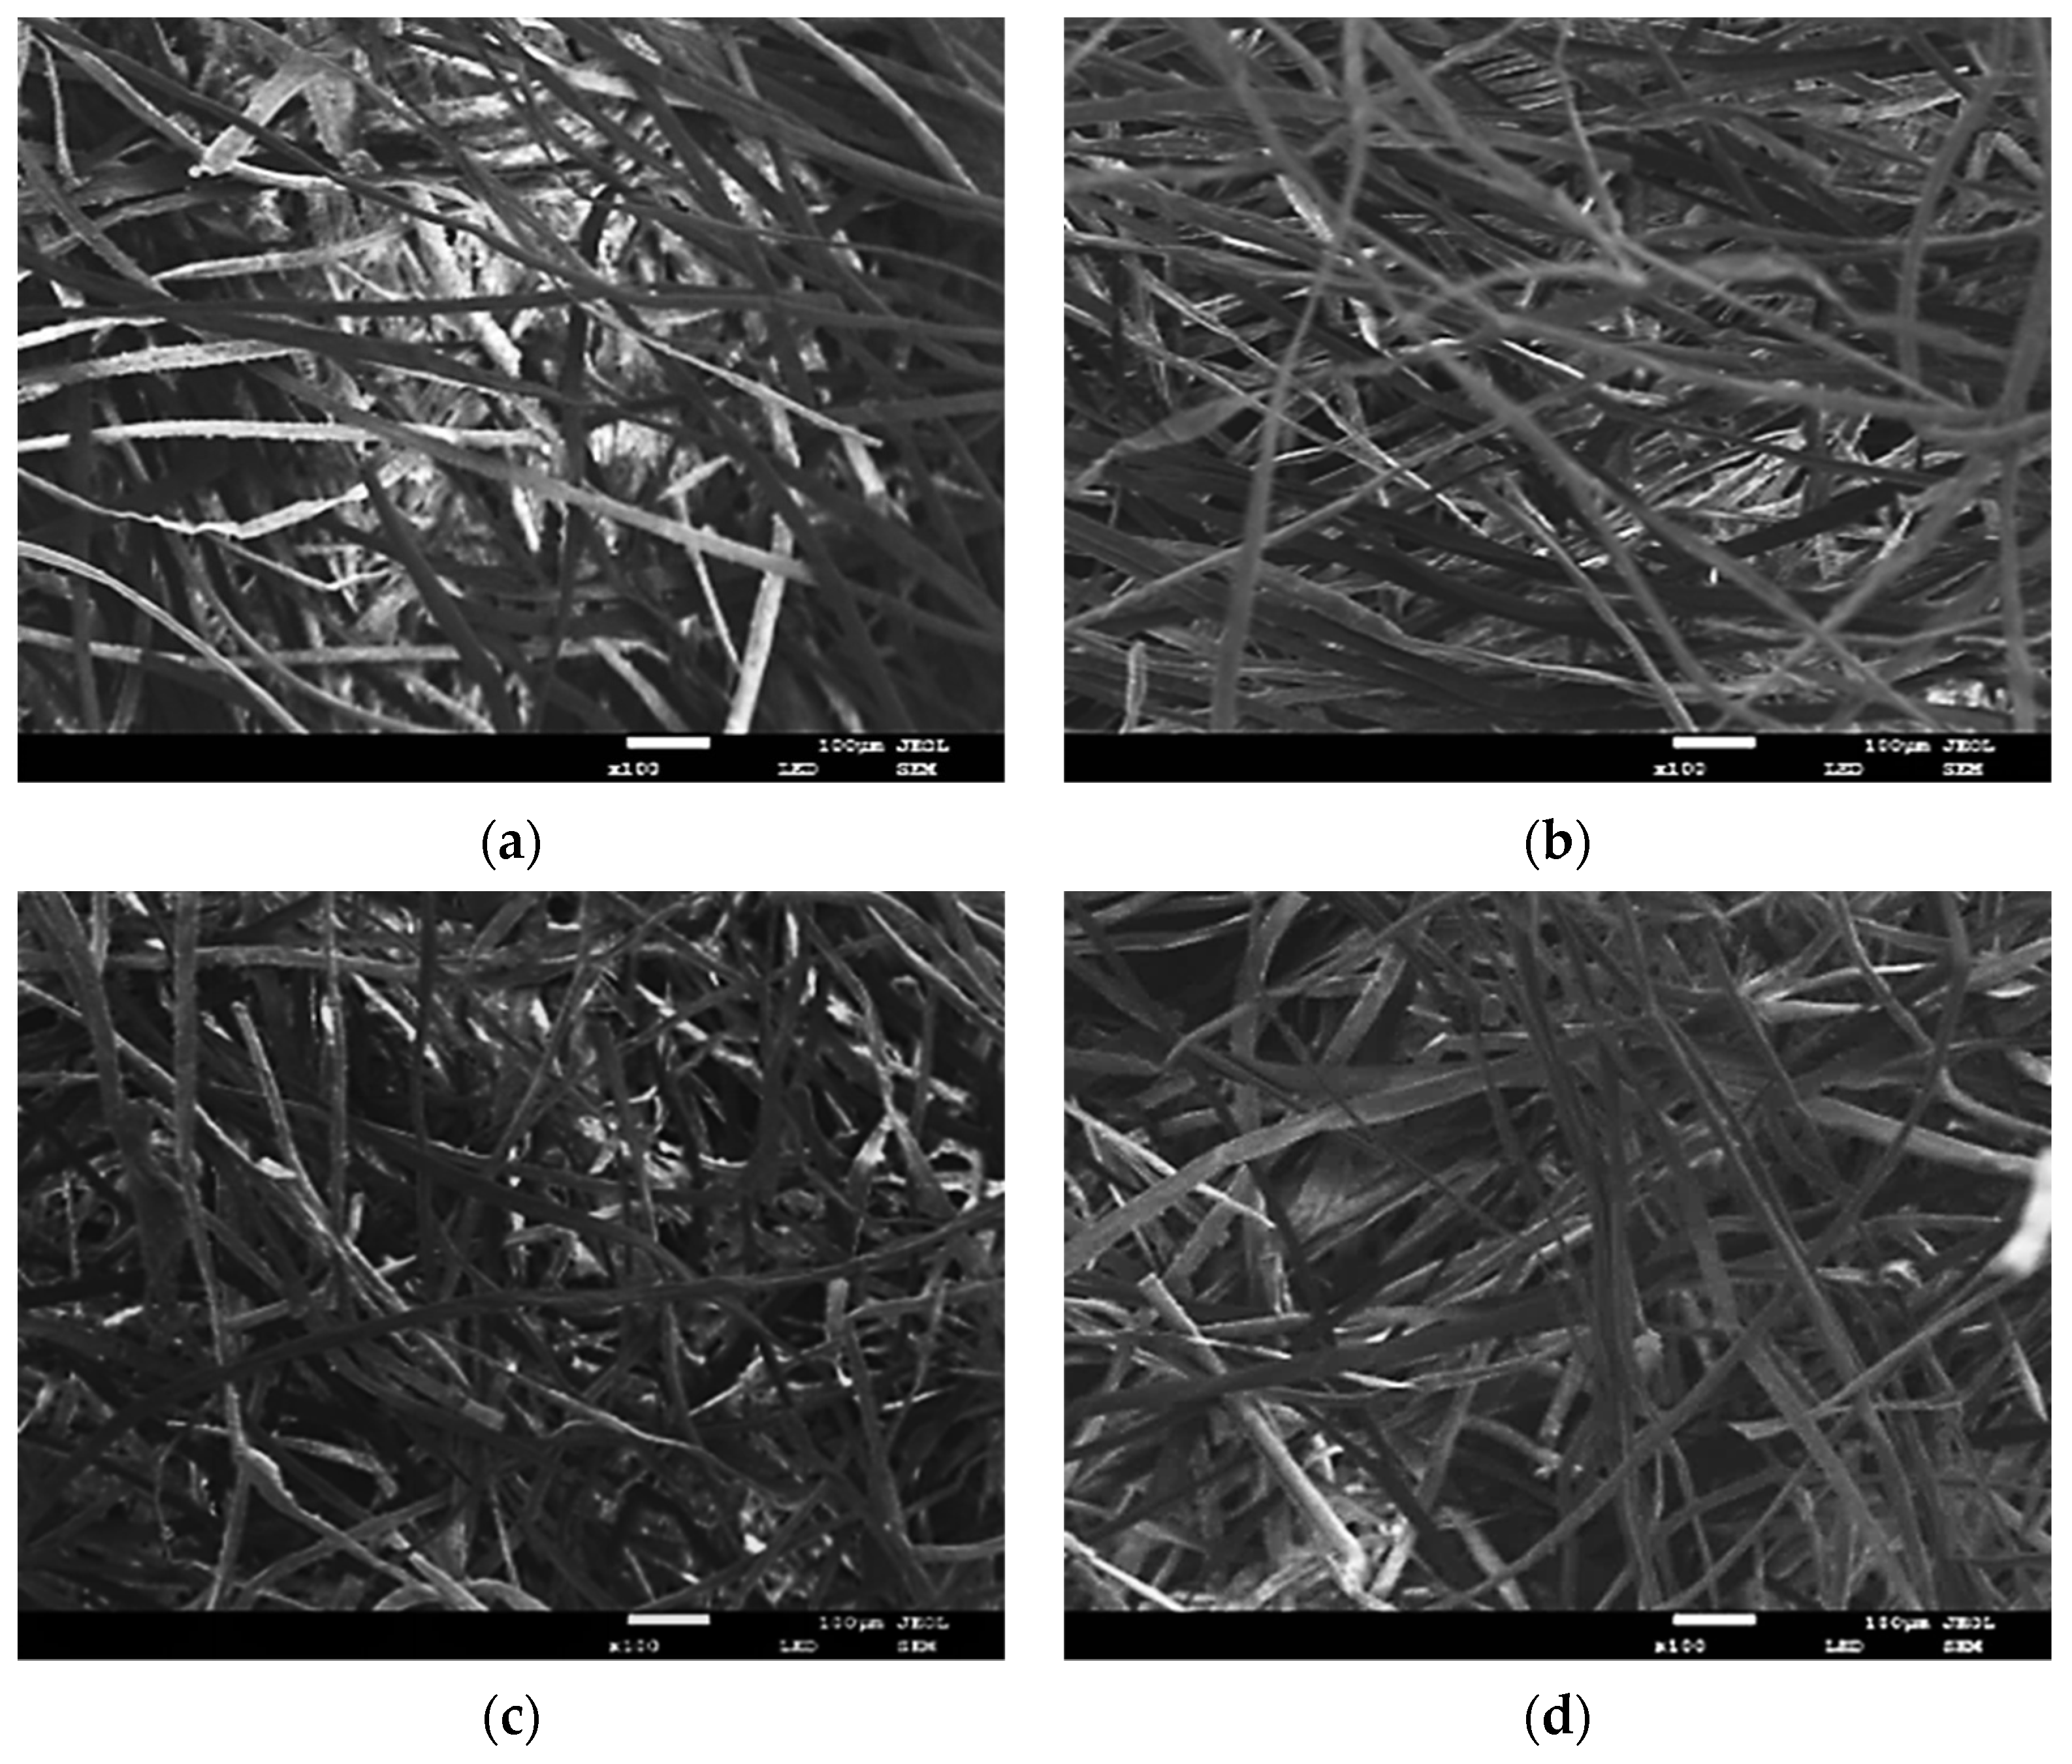
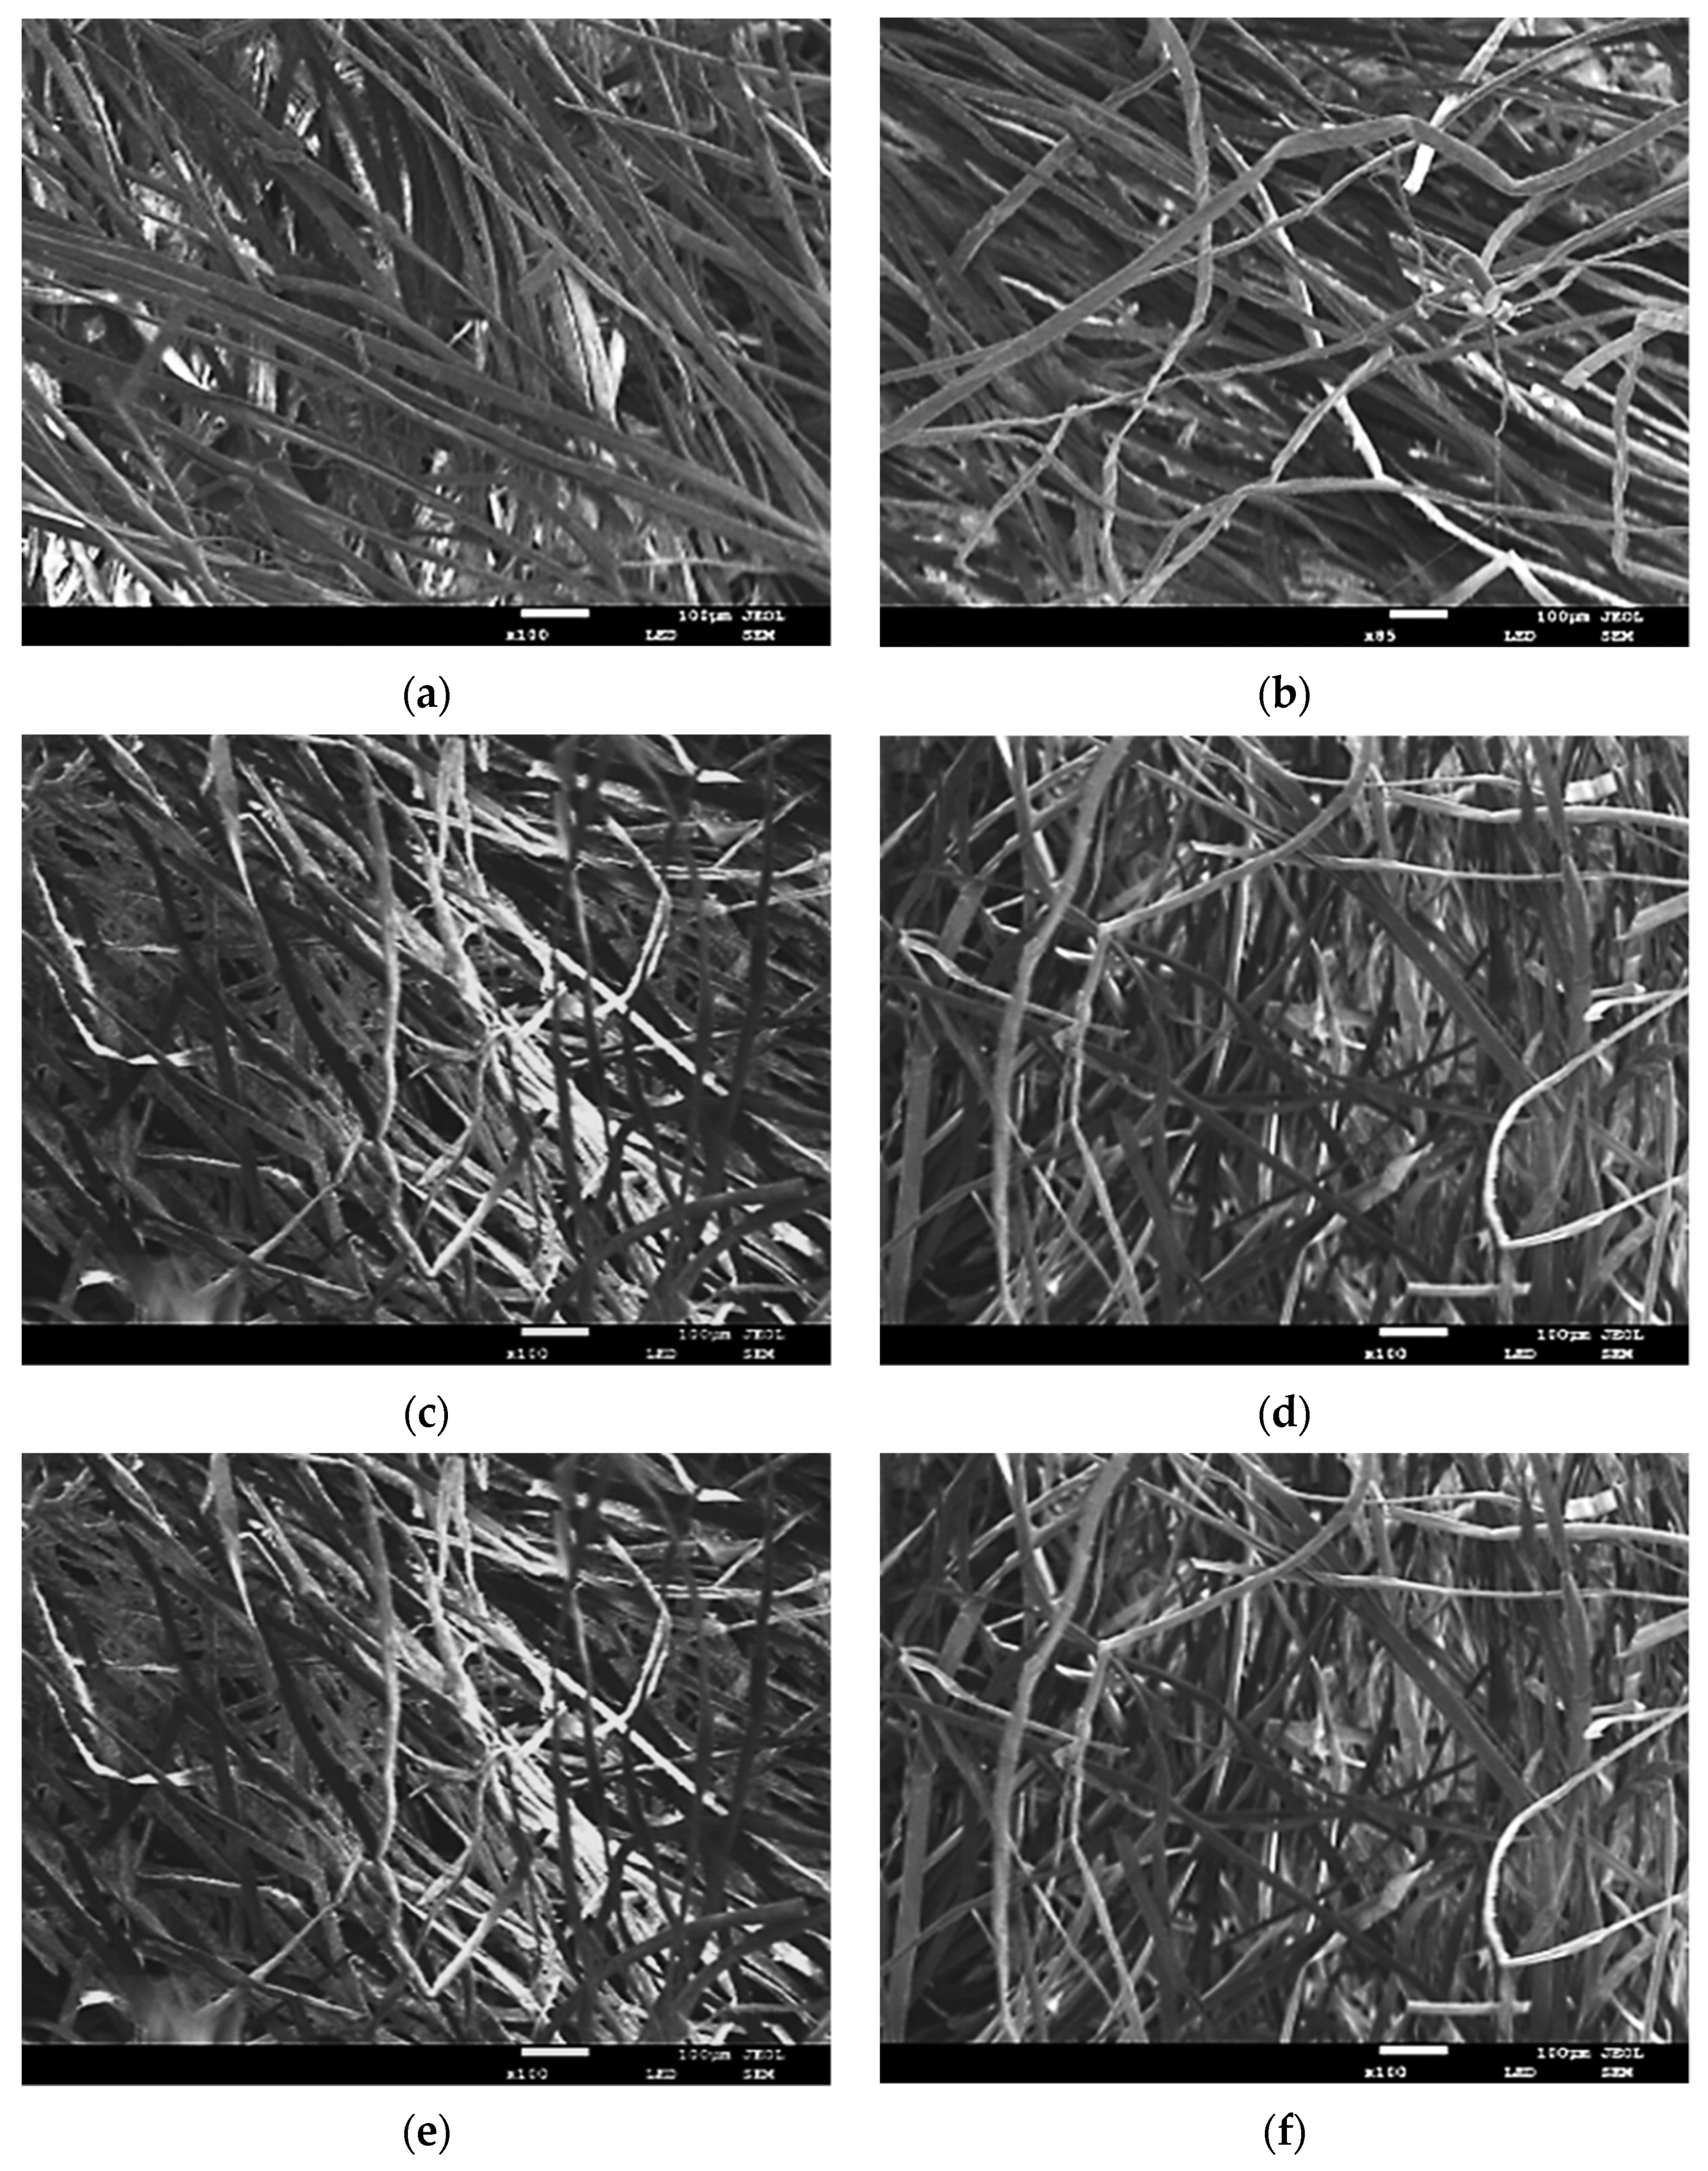
3.2.1. Kapok Fibre Sound-Absorbing Composites Image Acquisition
3.2.2. Preprocessing of Composites Images
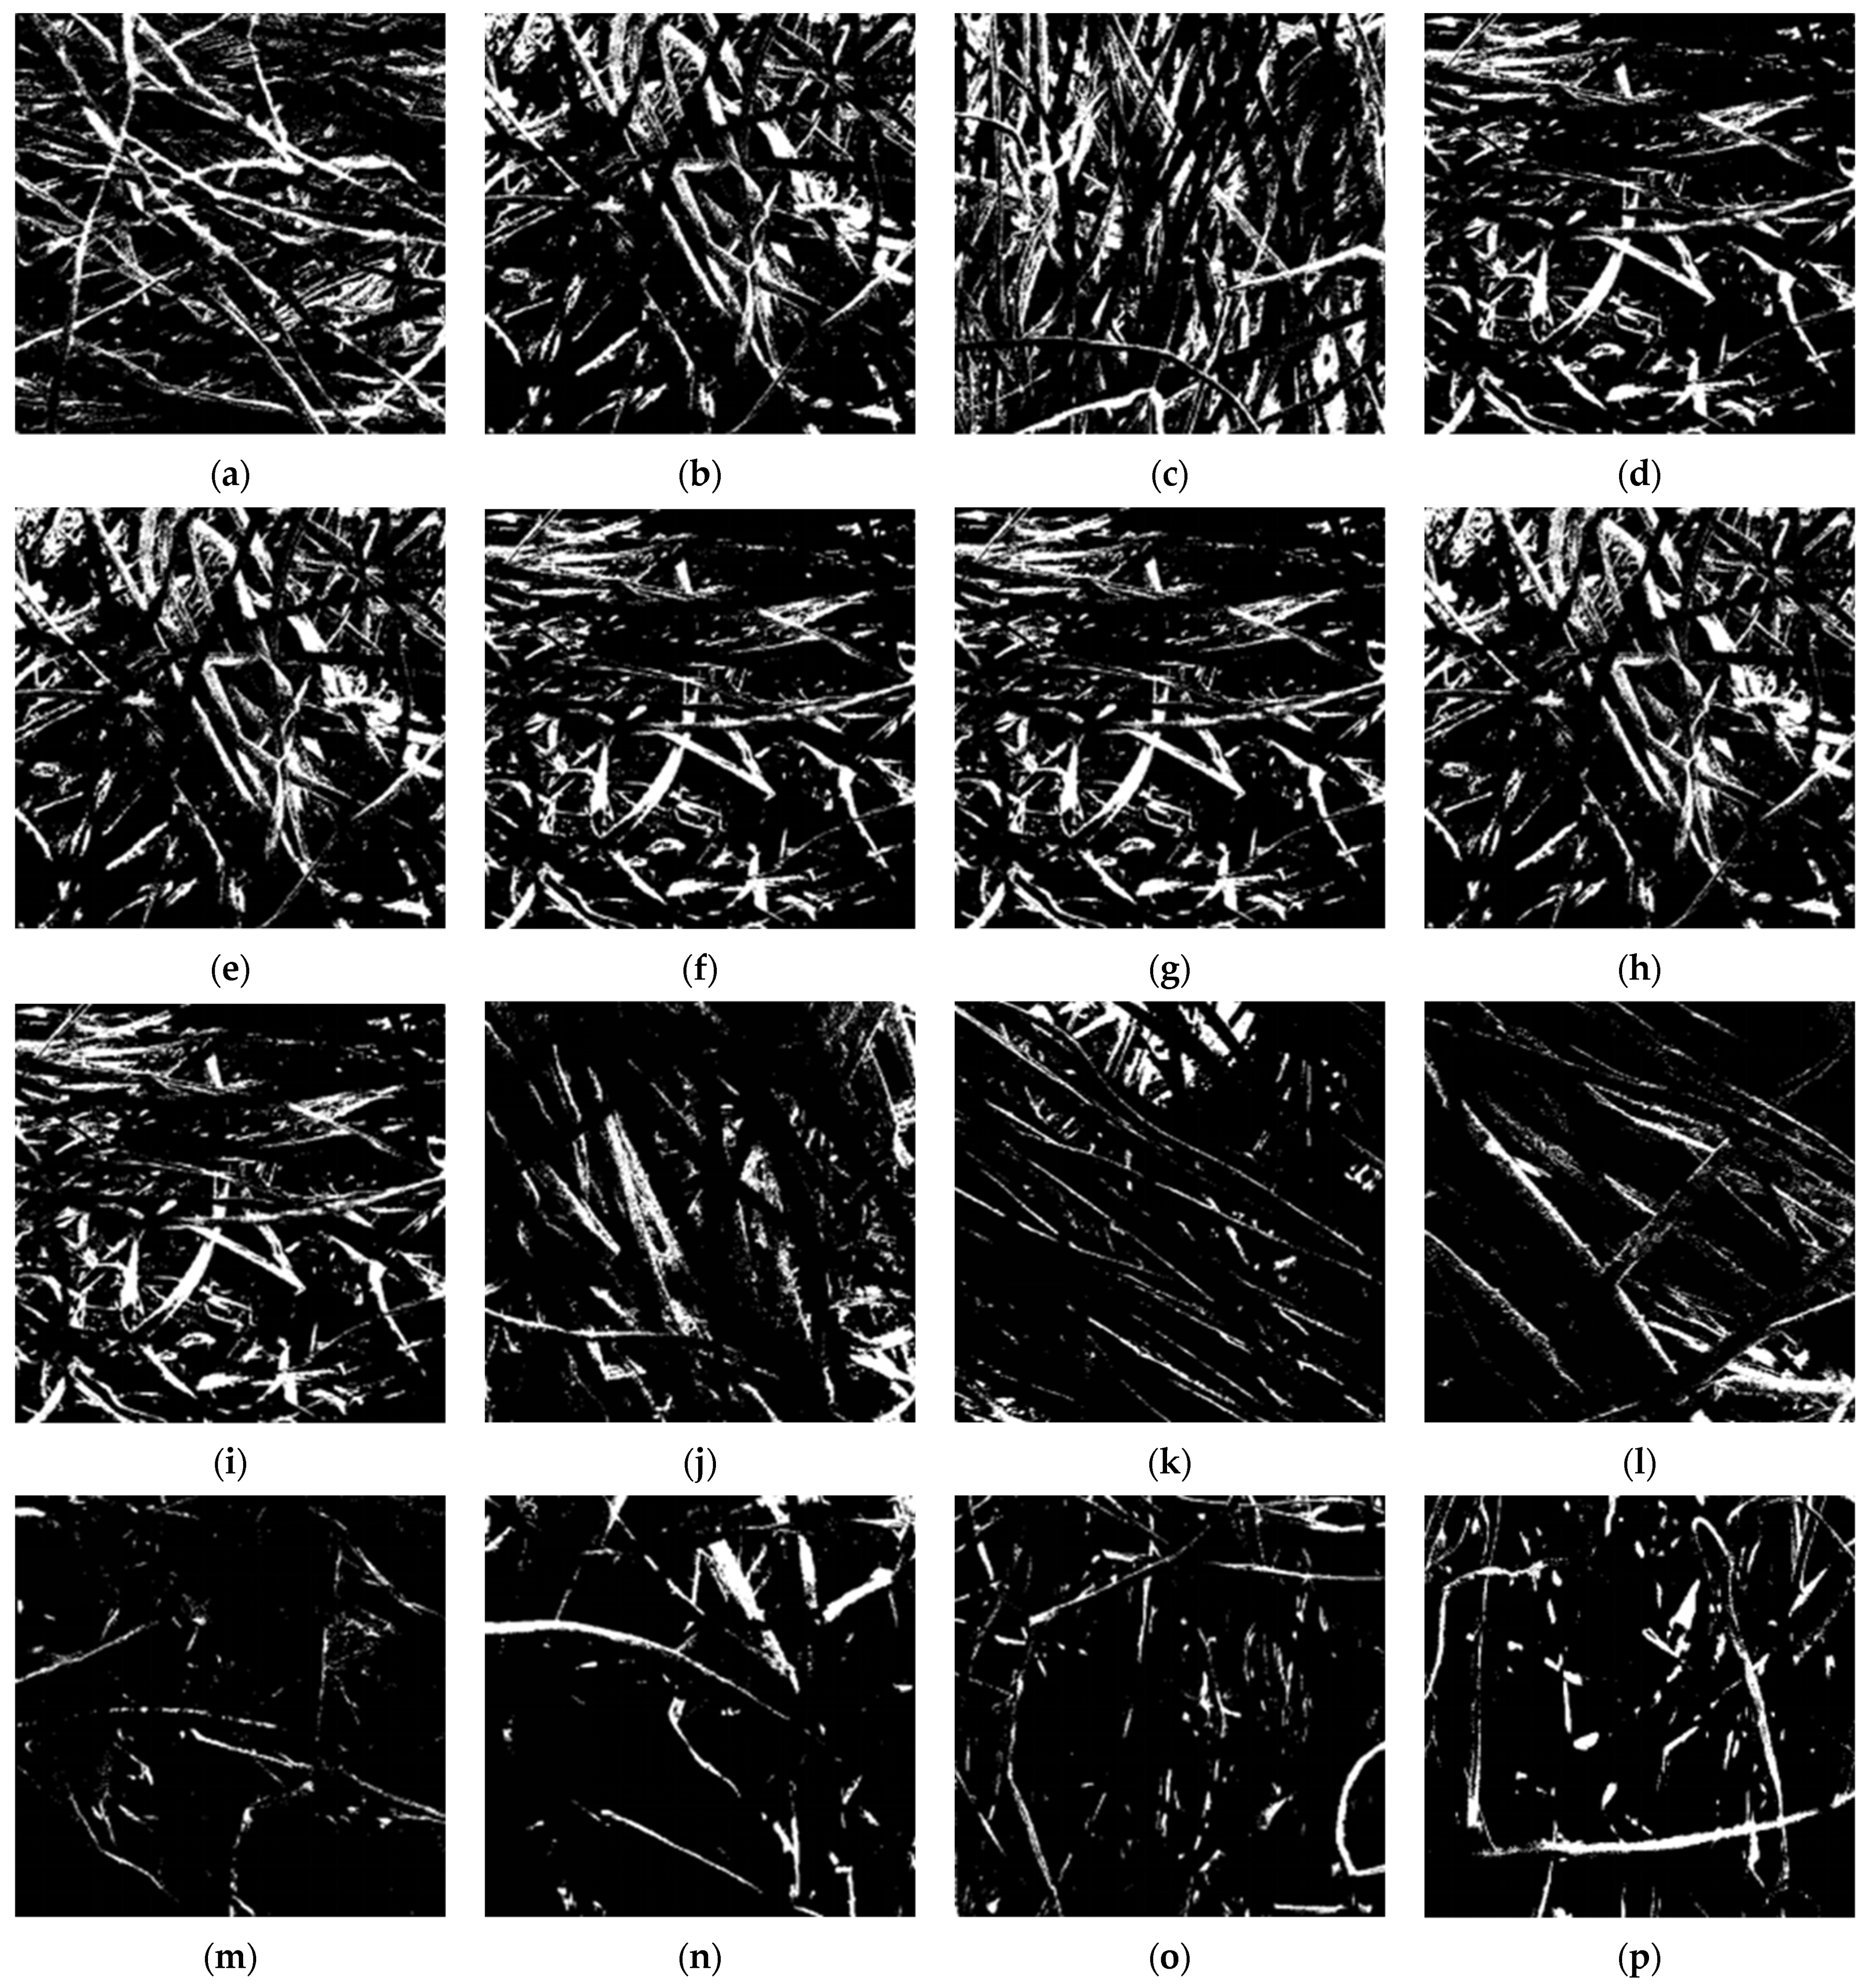
3.2.3. Image Binarisation
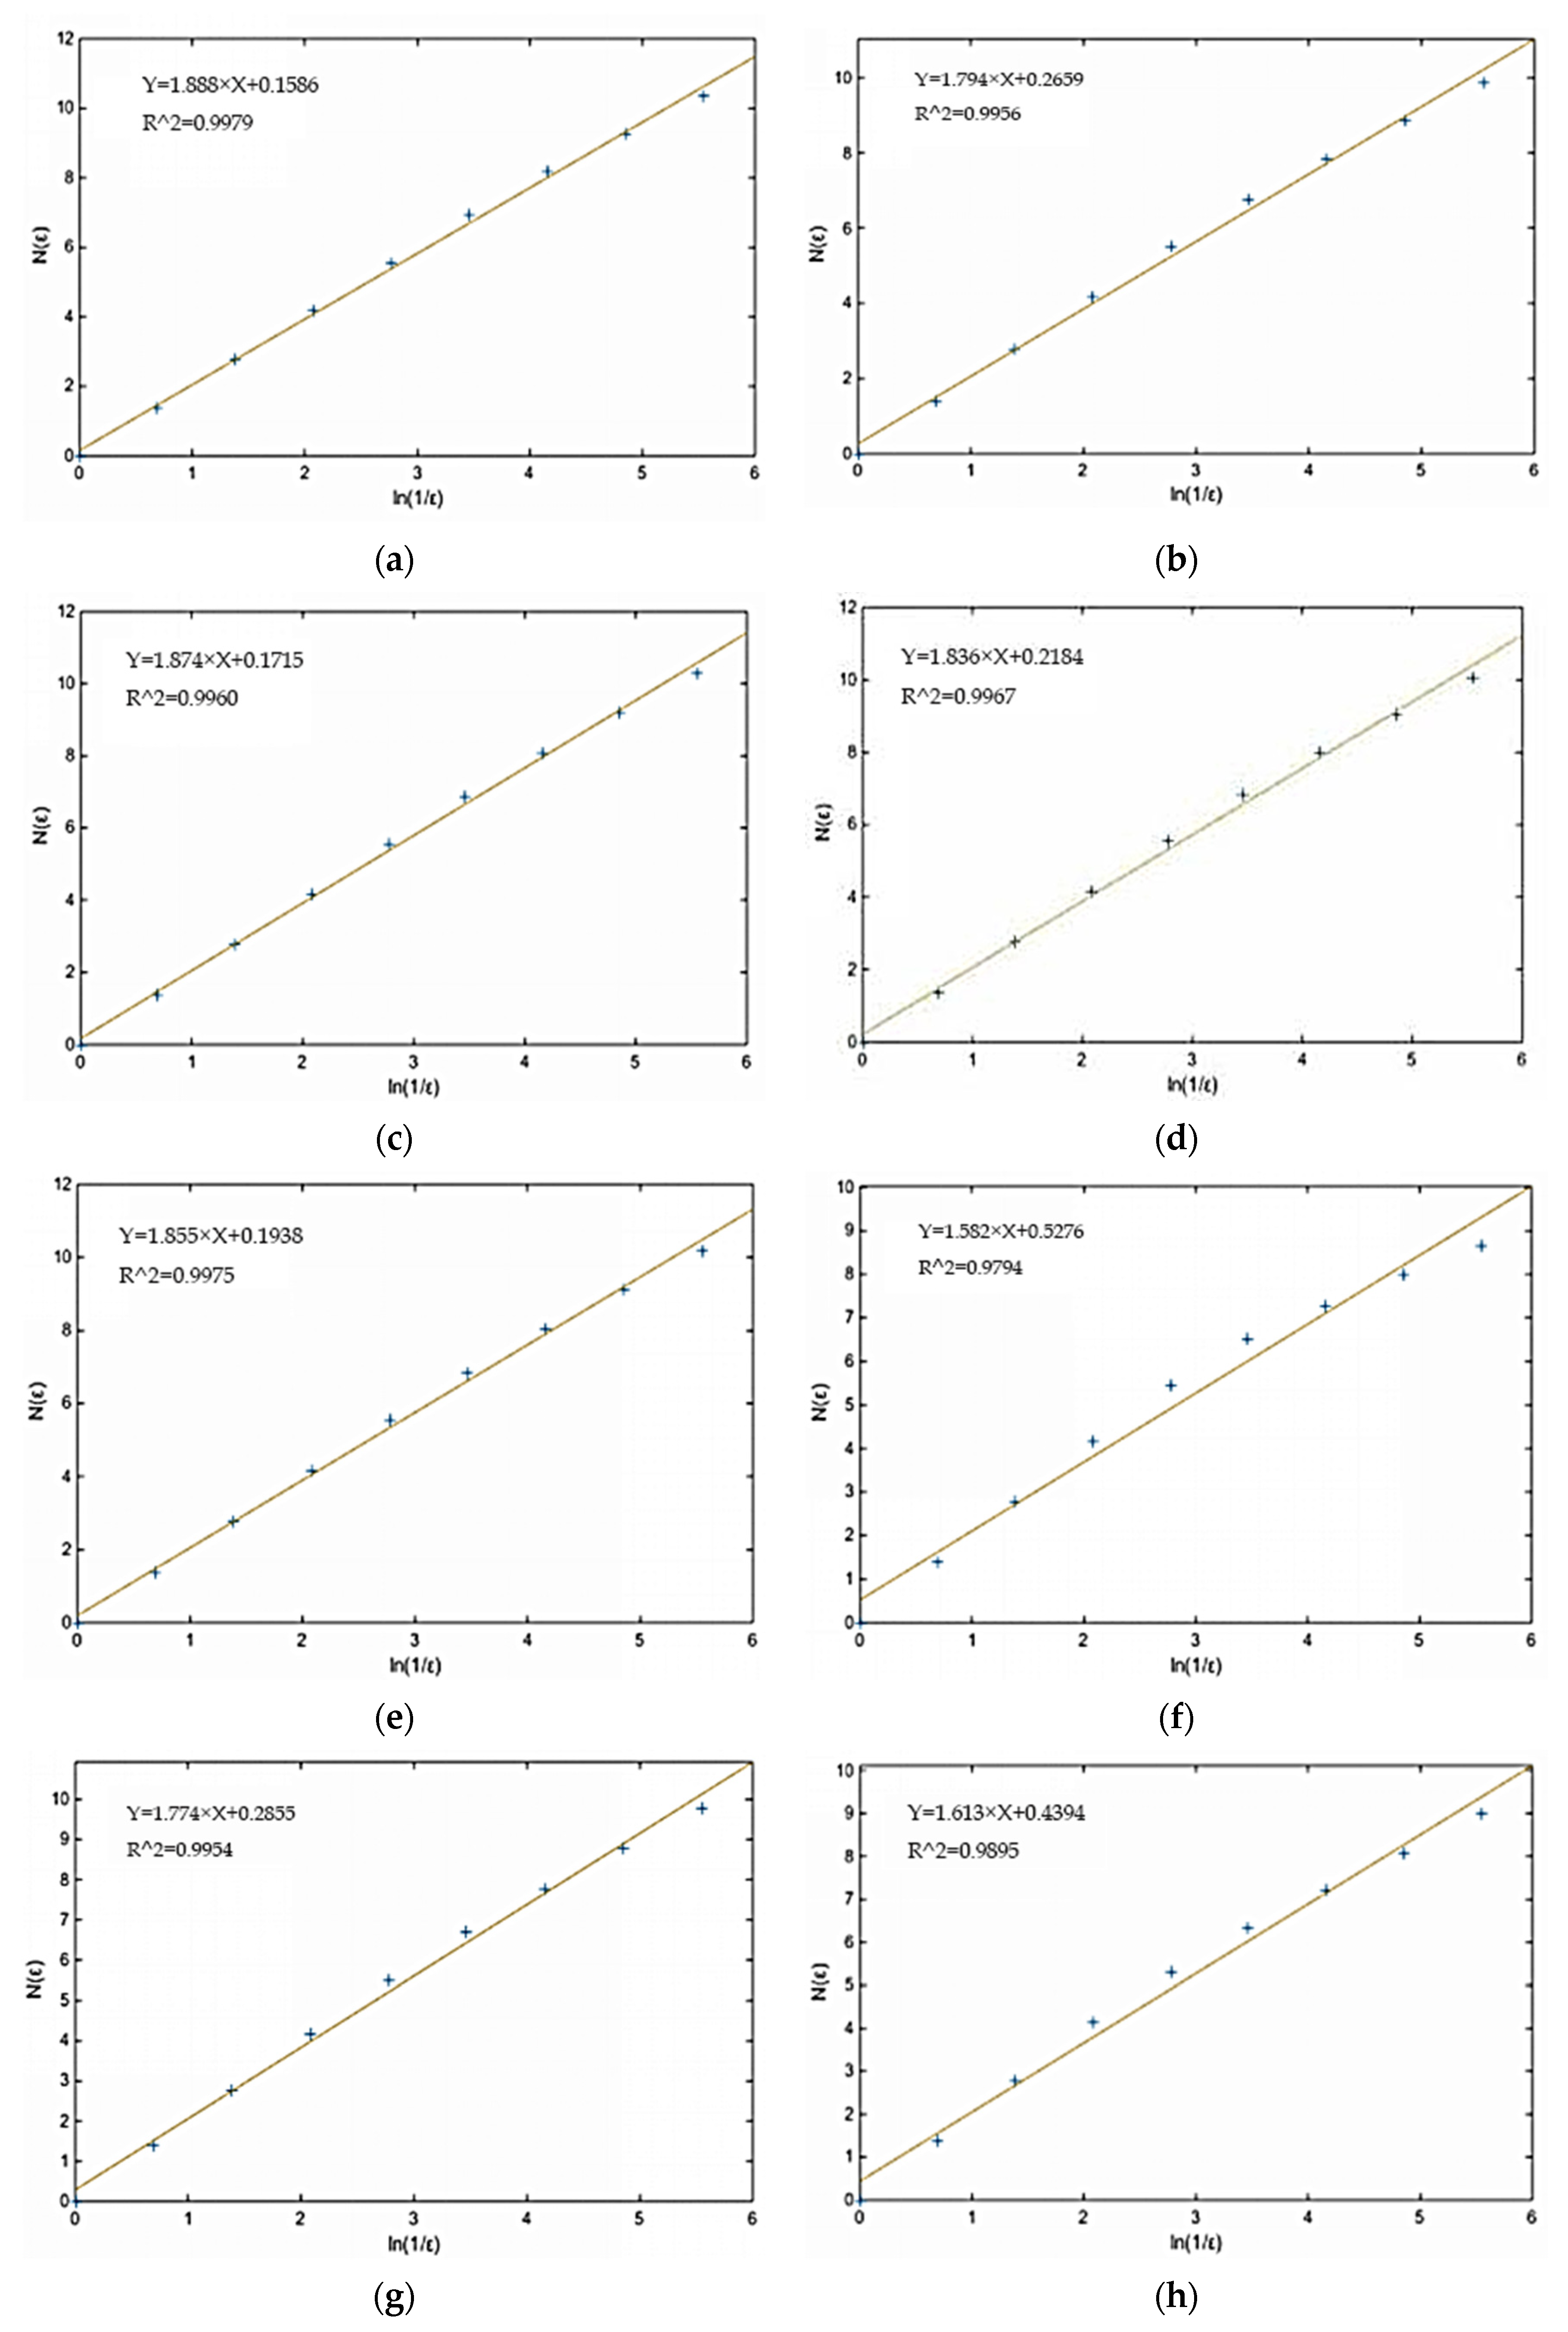
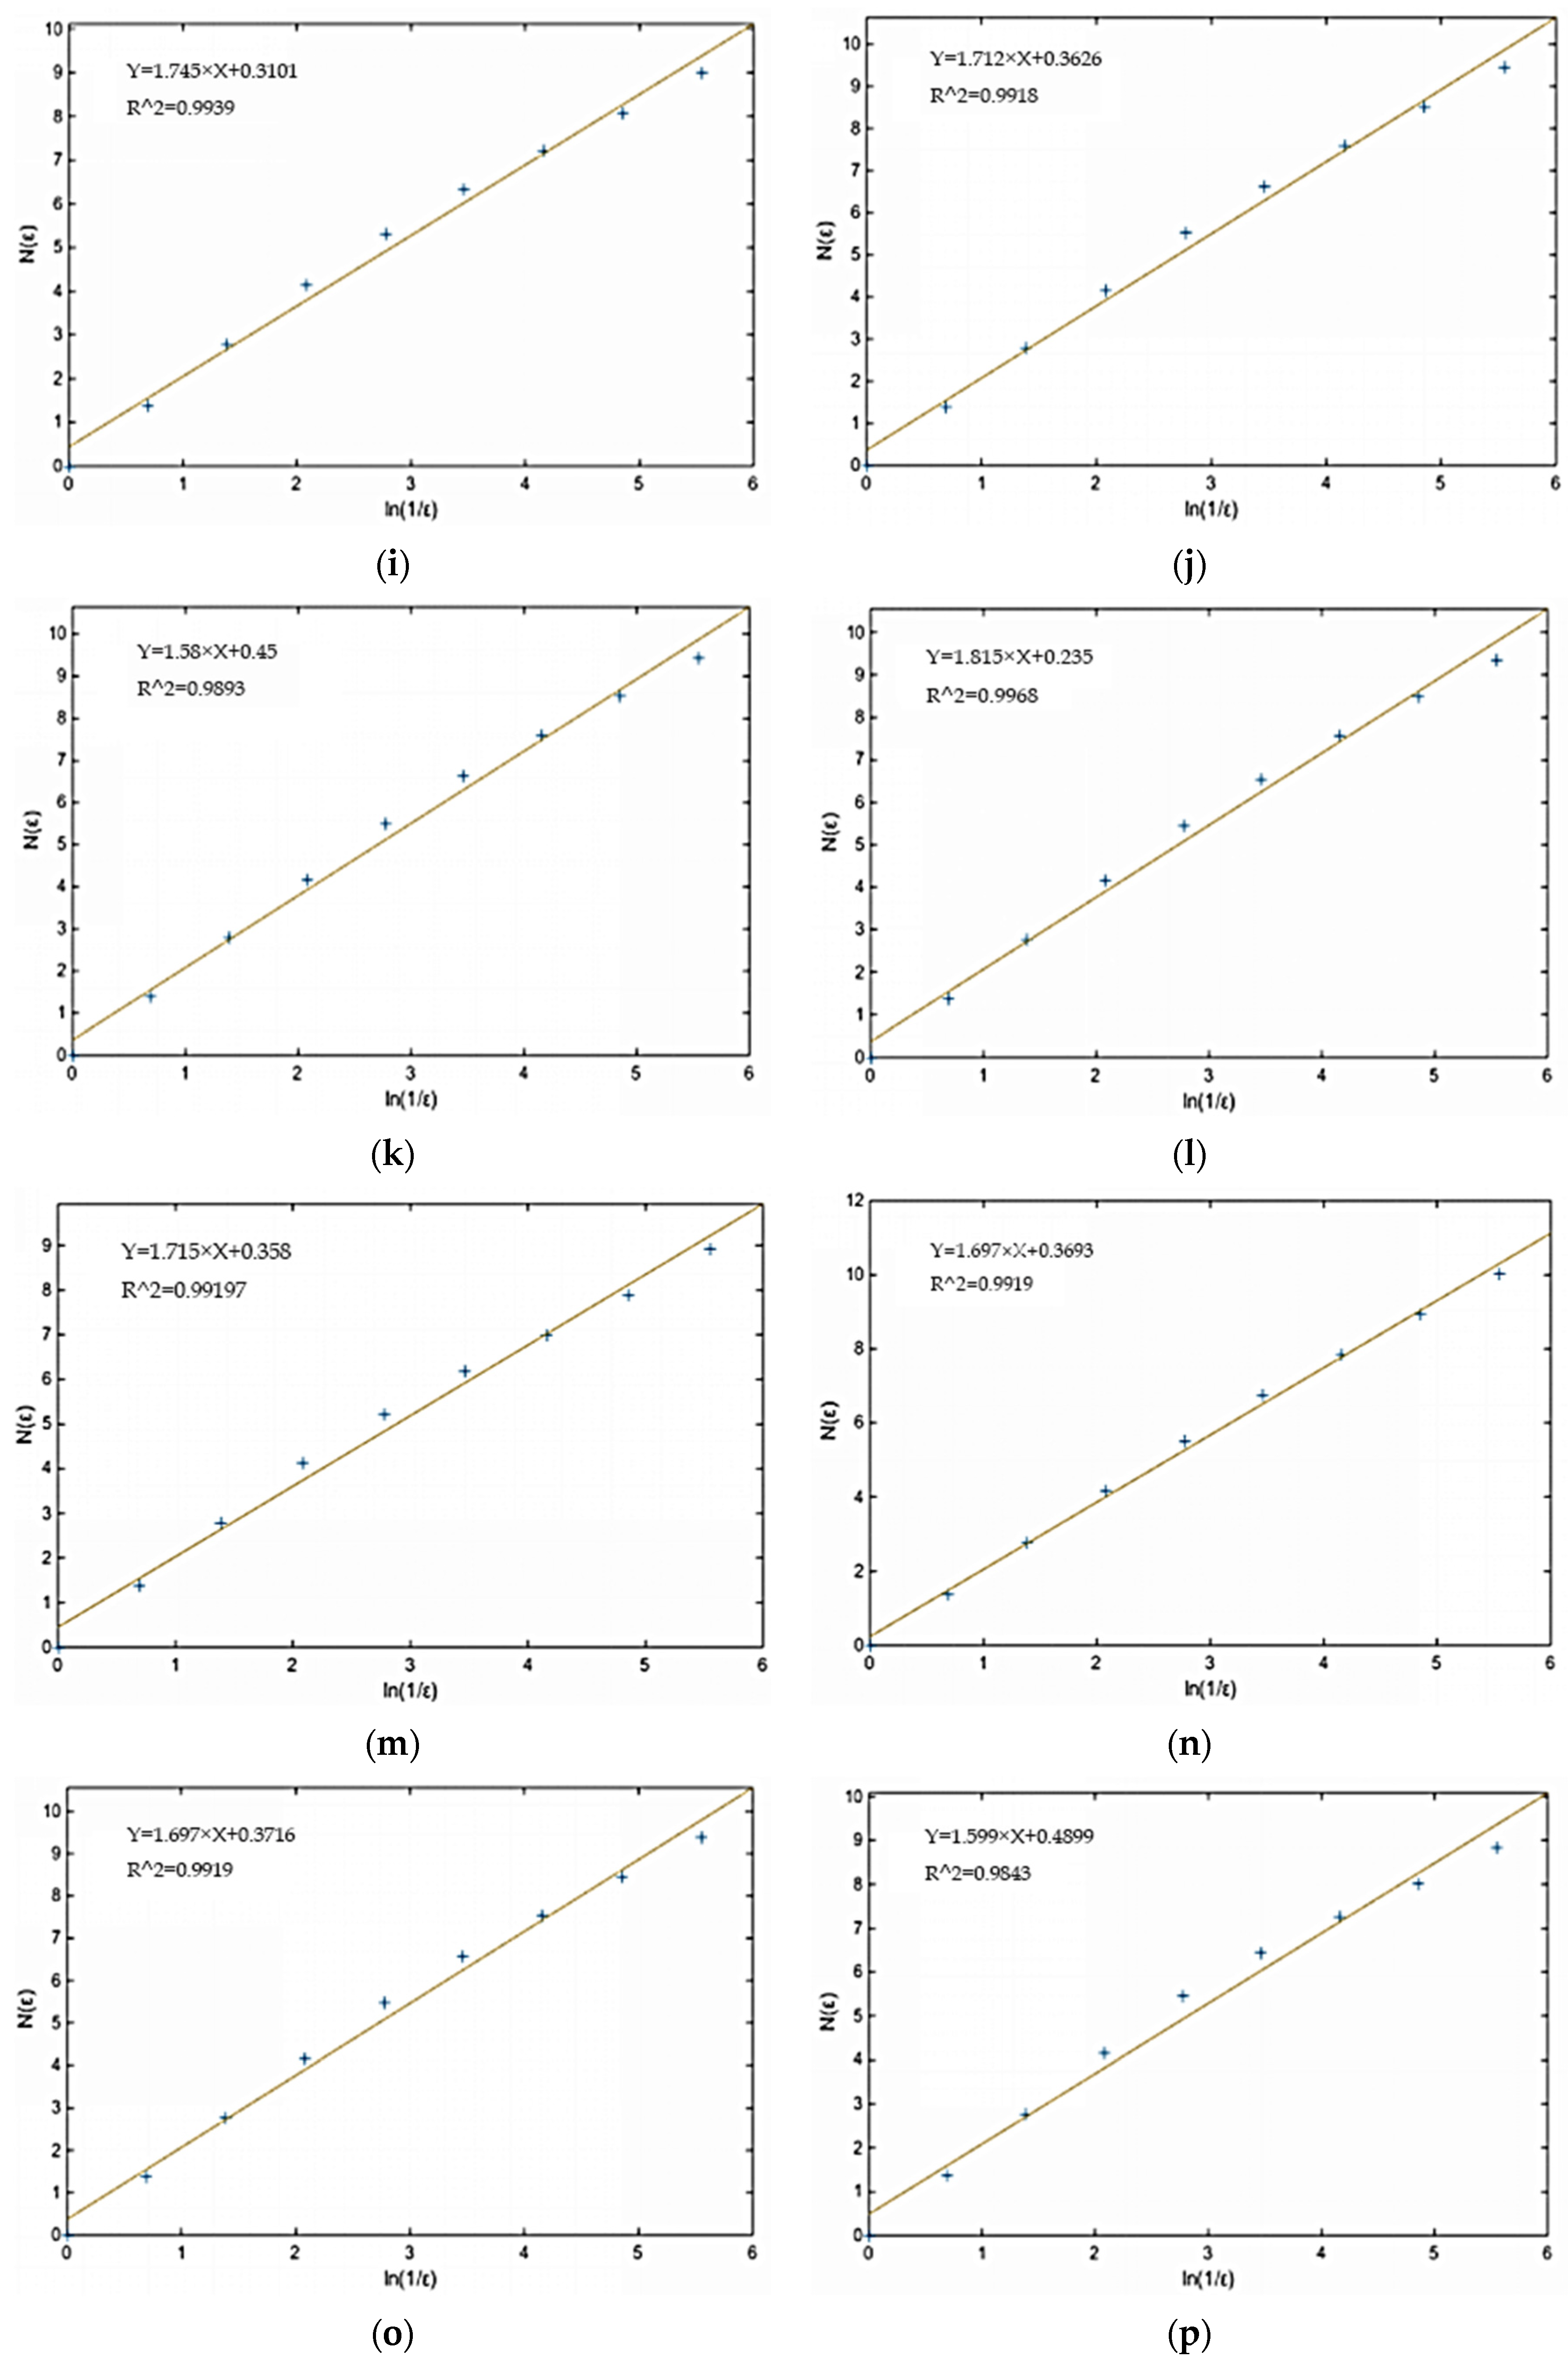
3.2.4. Calculation of Fractal Dimension
3.3. Relationship between Fractal Dimension and Various Factors
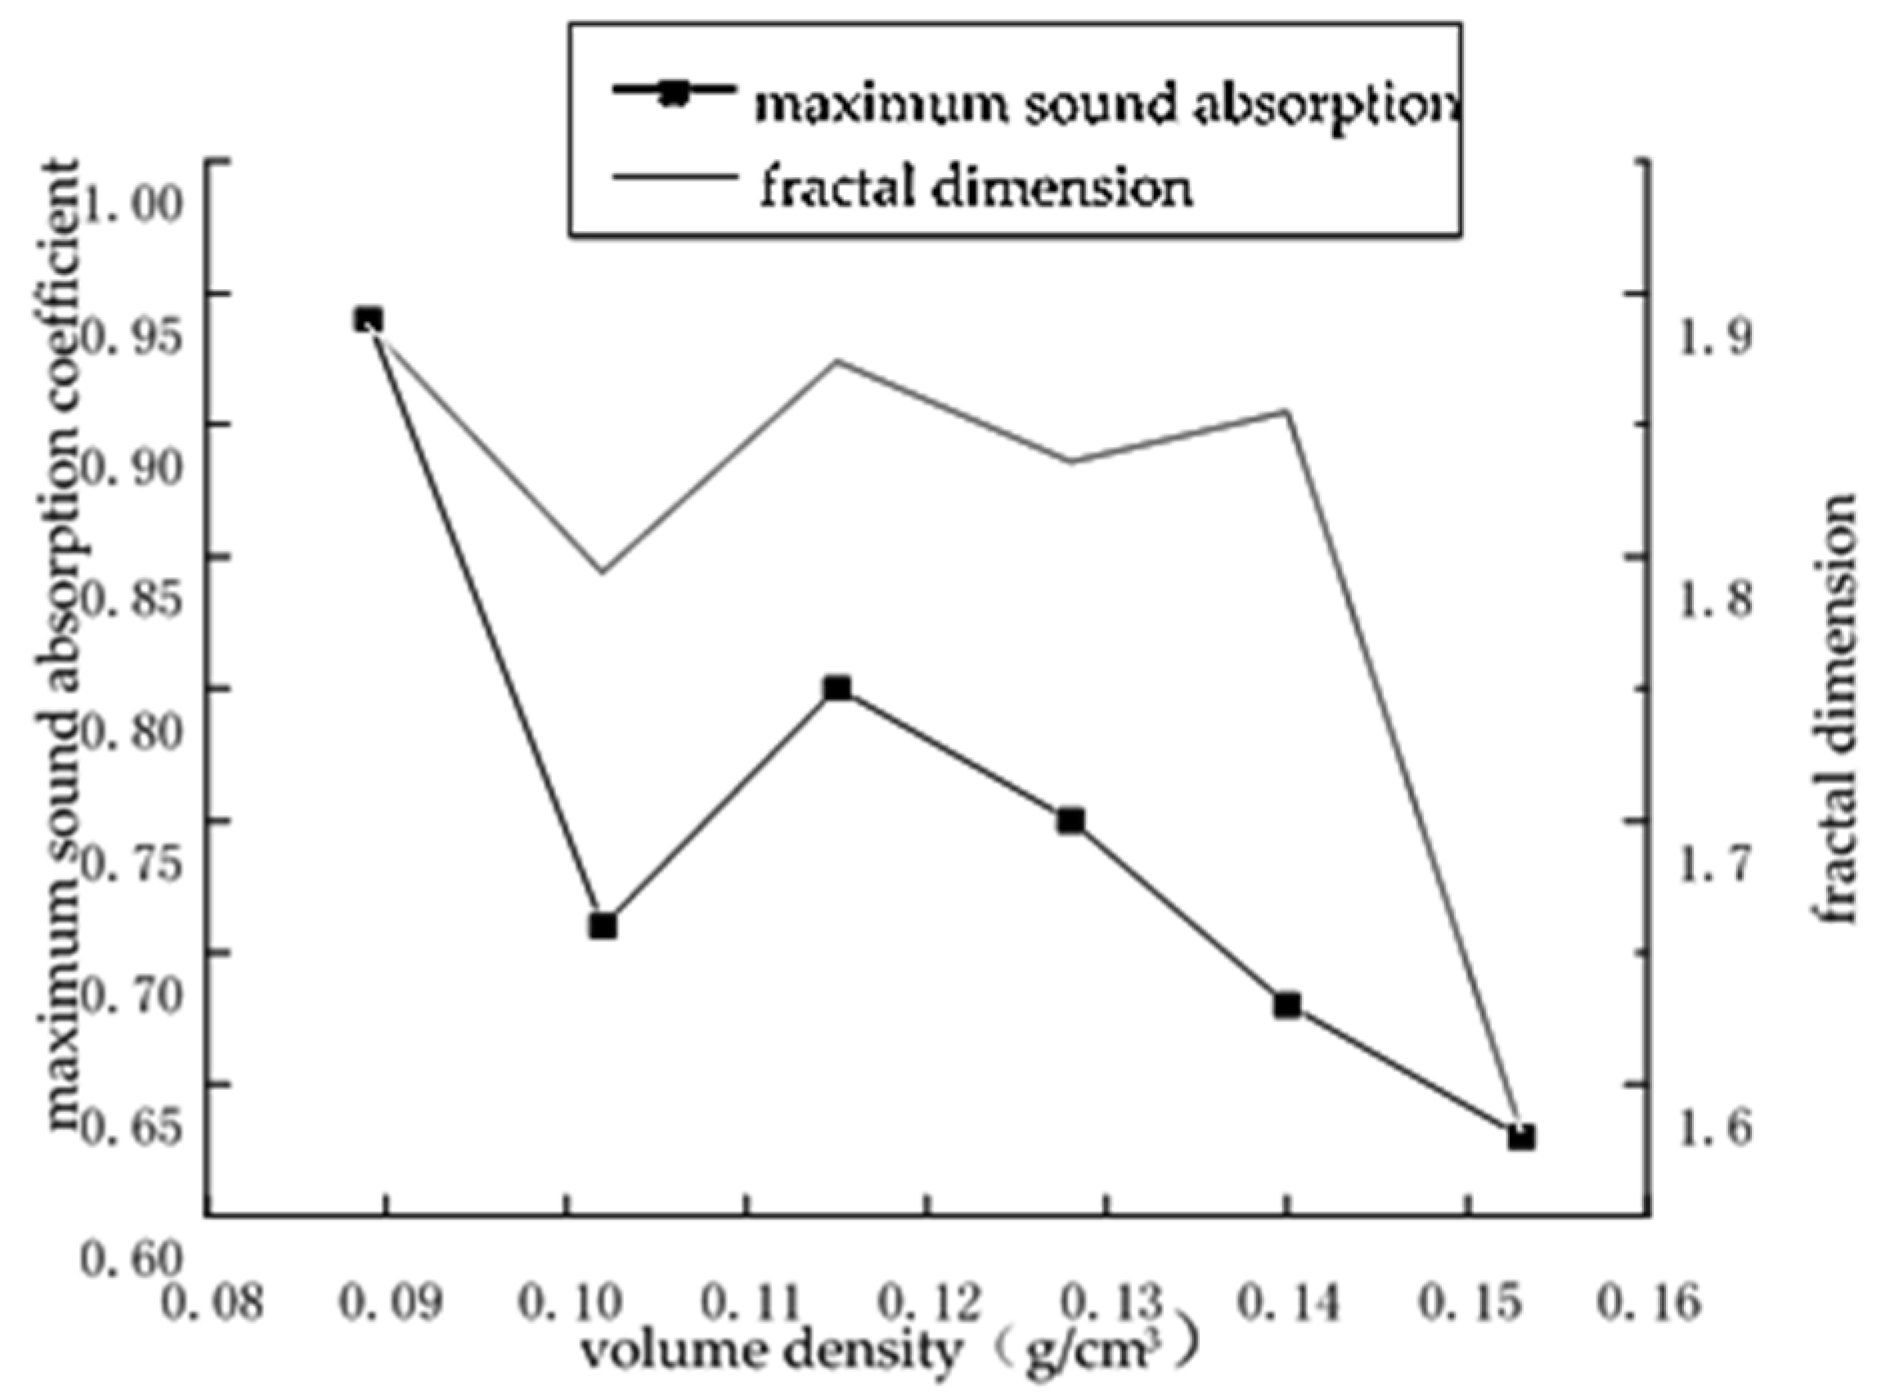
3.3.1. Influence of Volume Density on Fractal Dimension
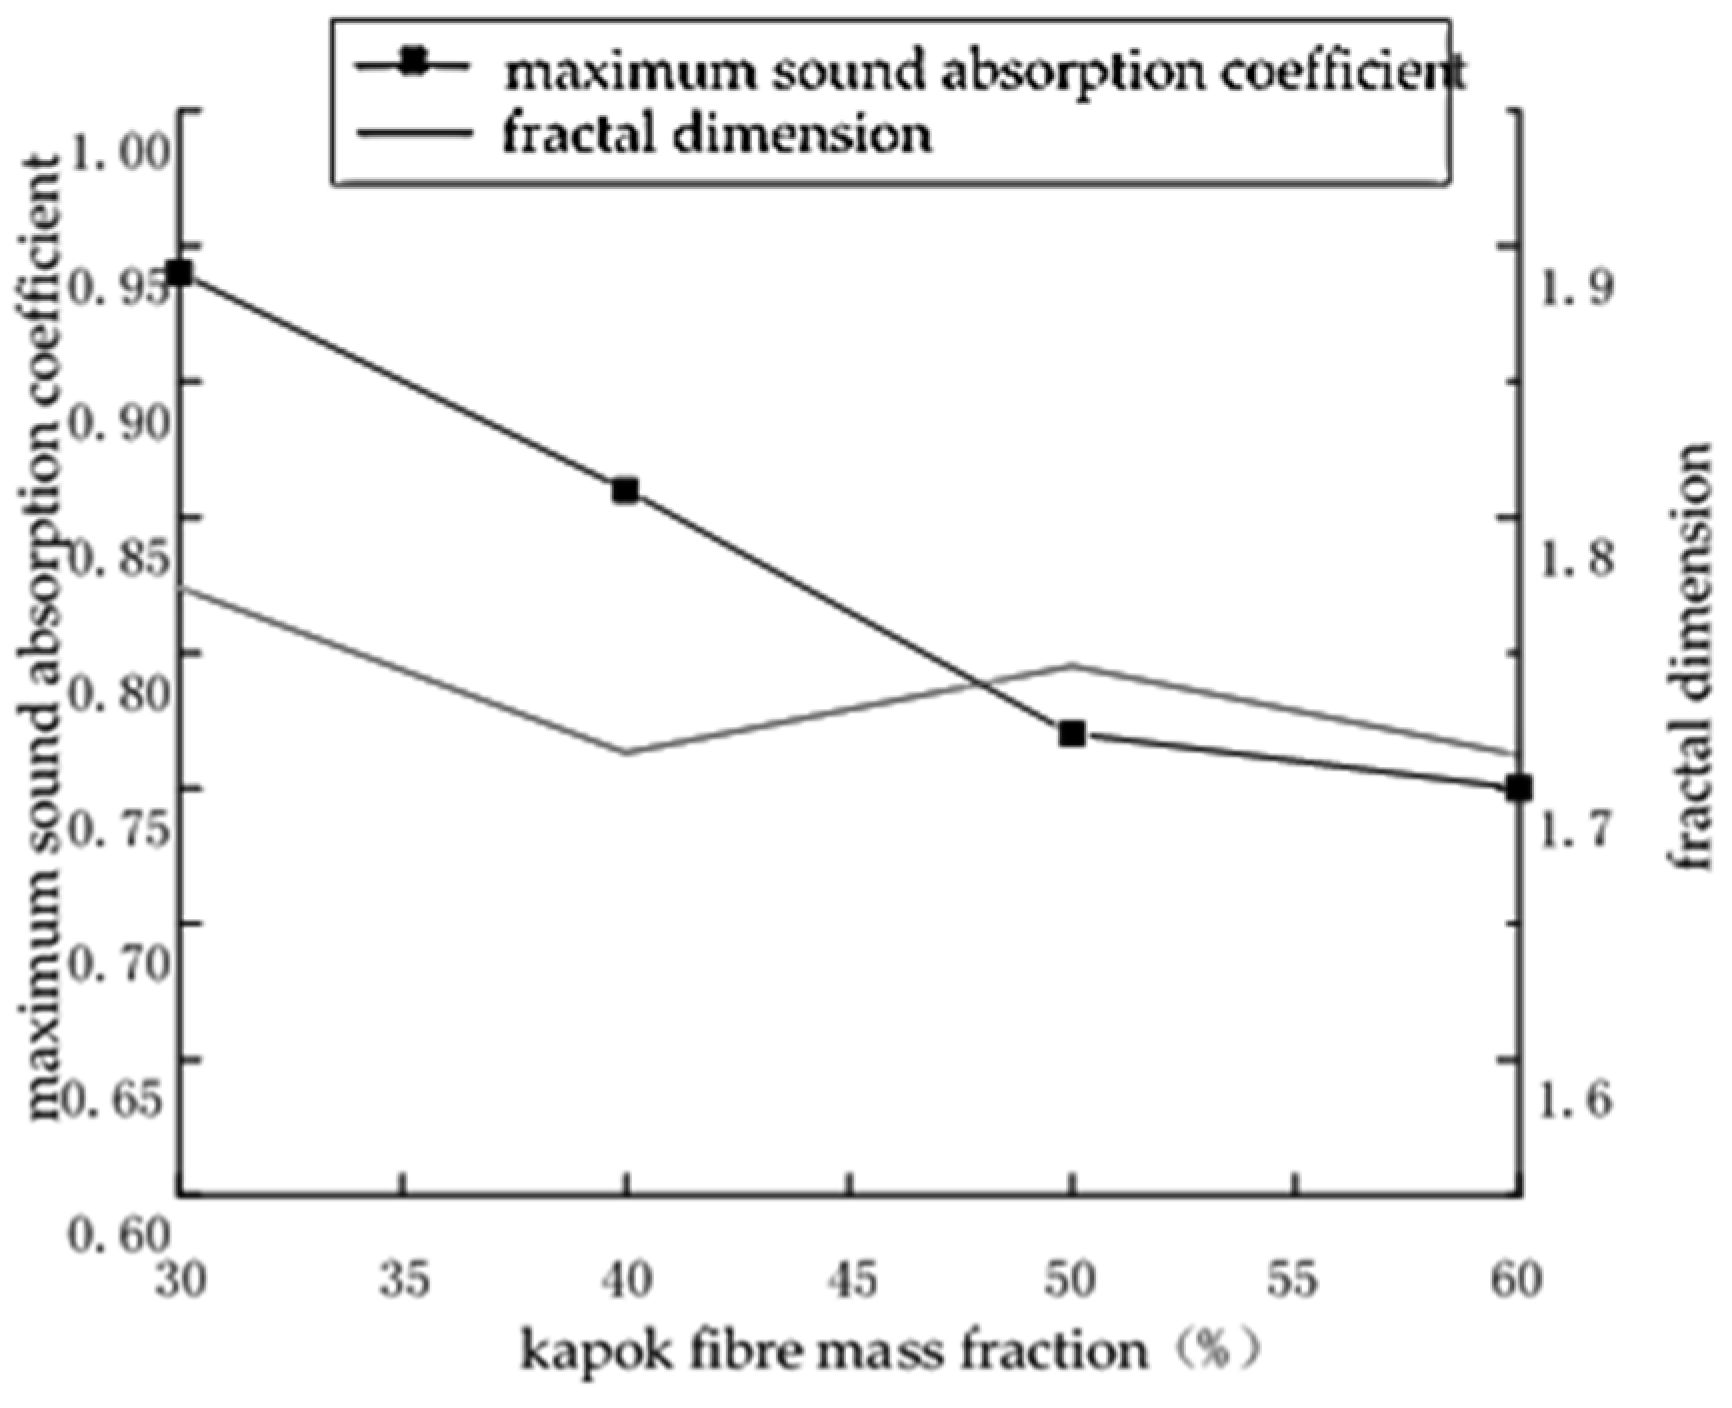
3.3.2. Influence of Mass Fraction of Kapok Fibre on Fractal Dimension
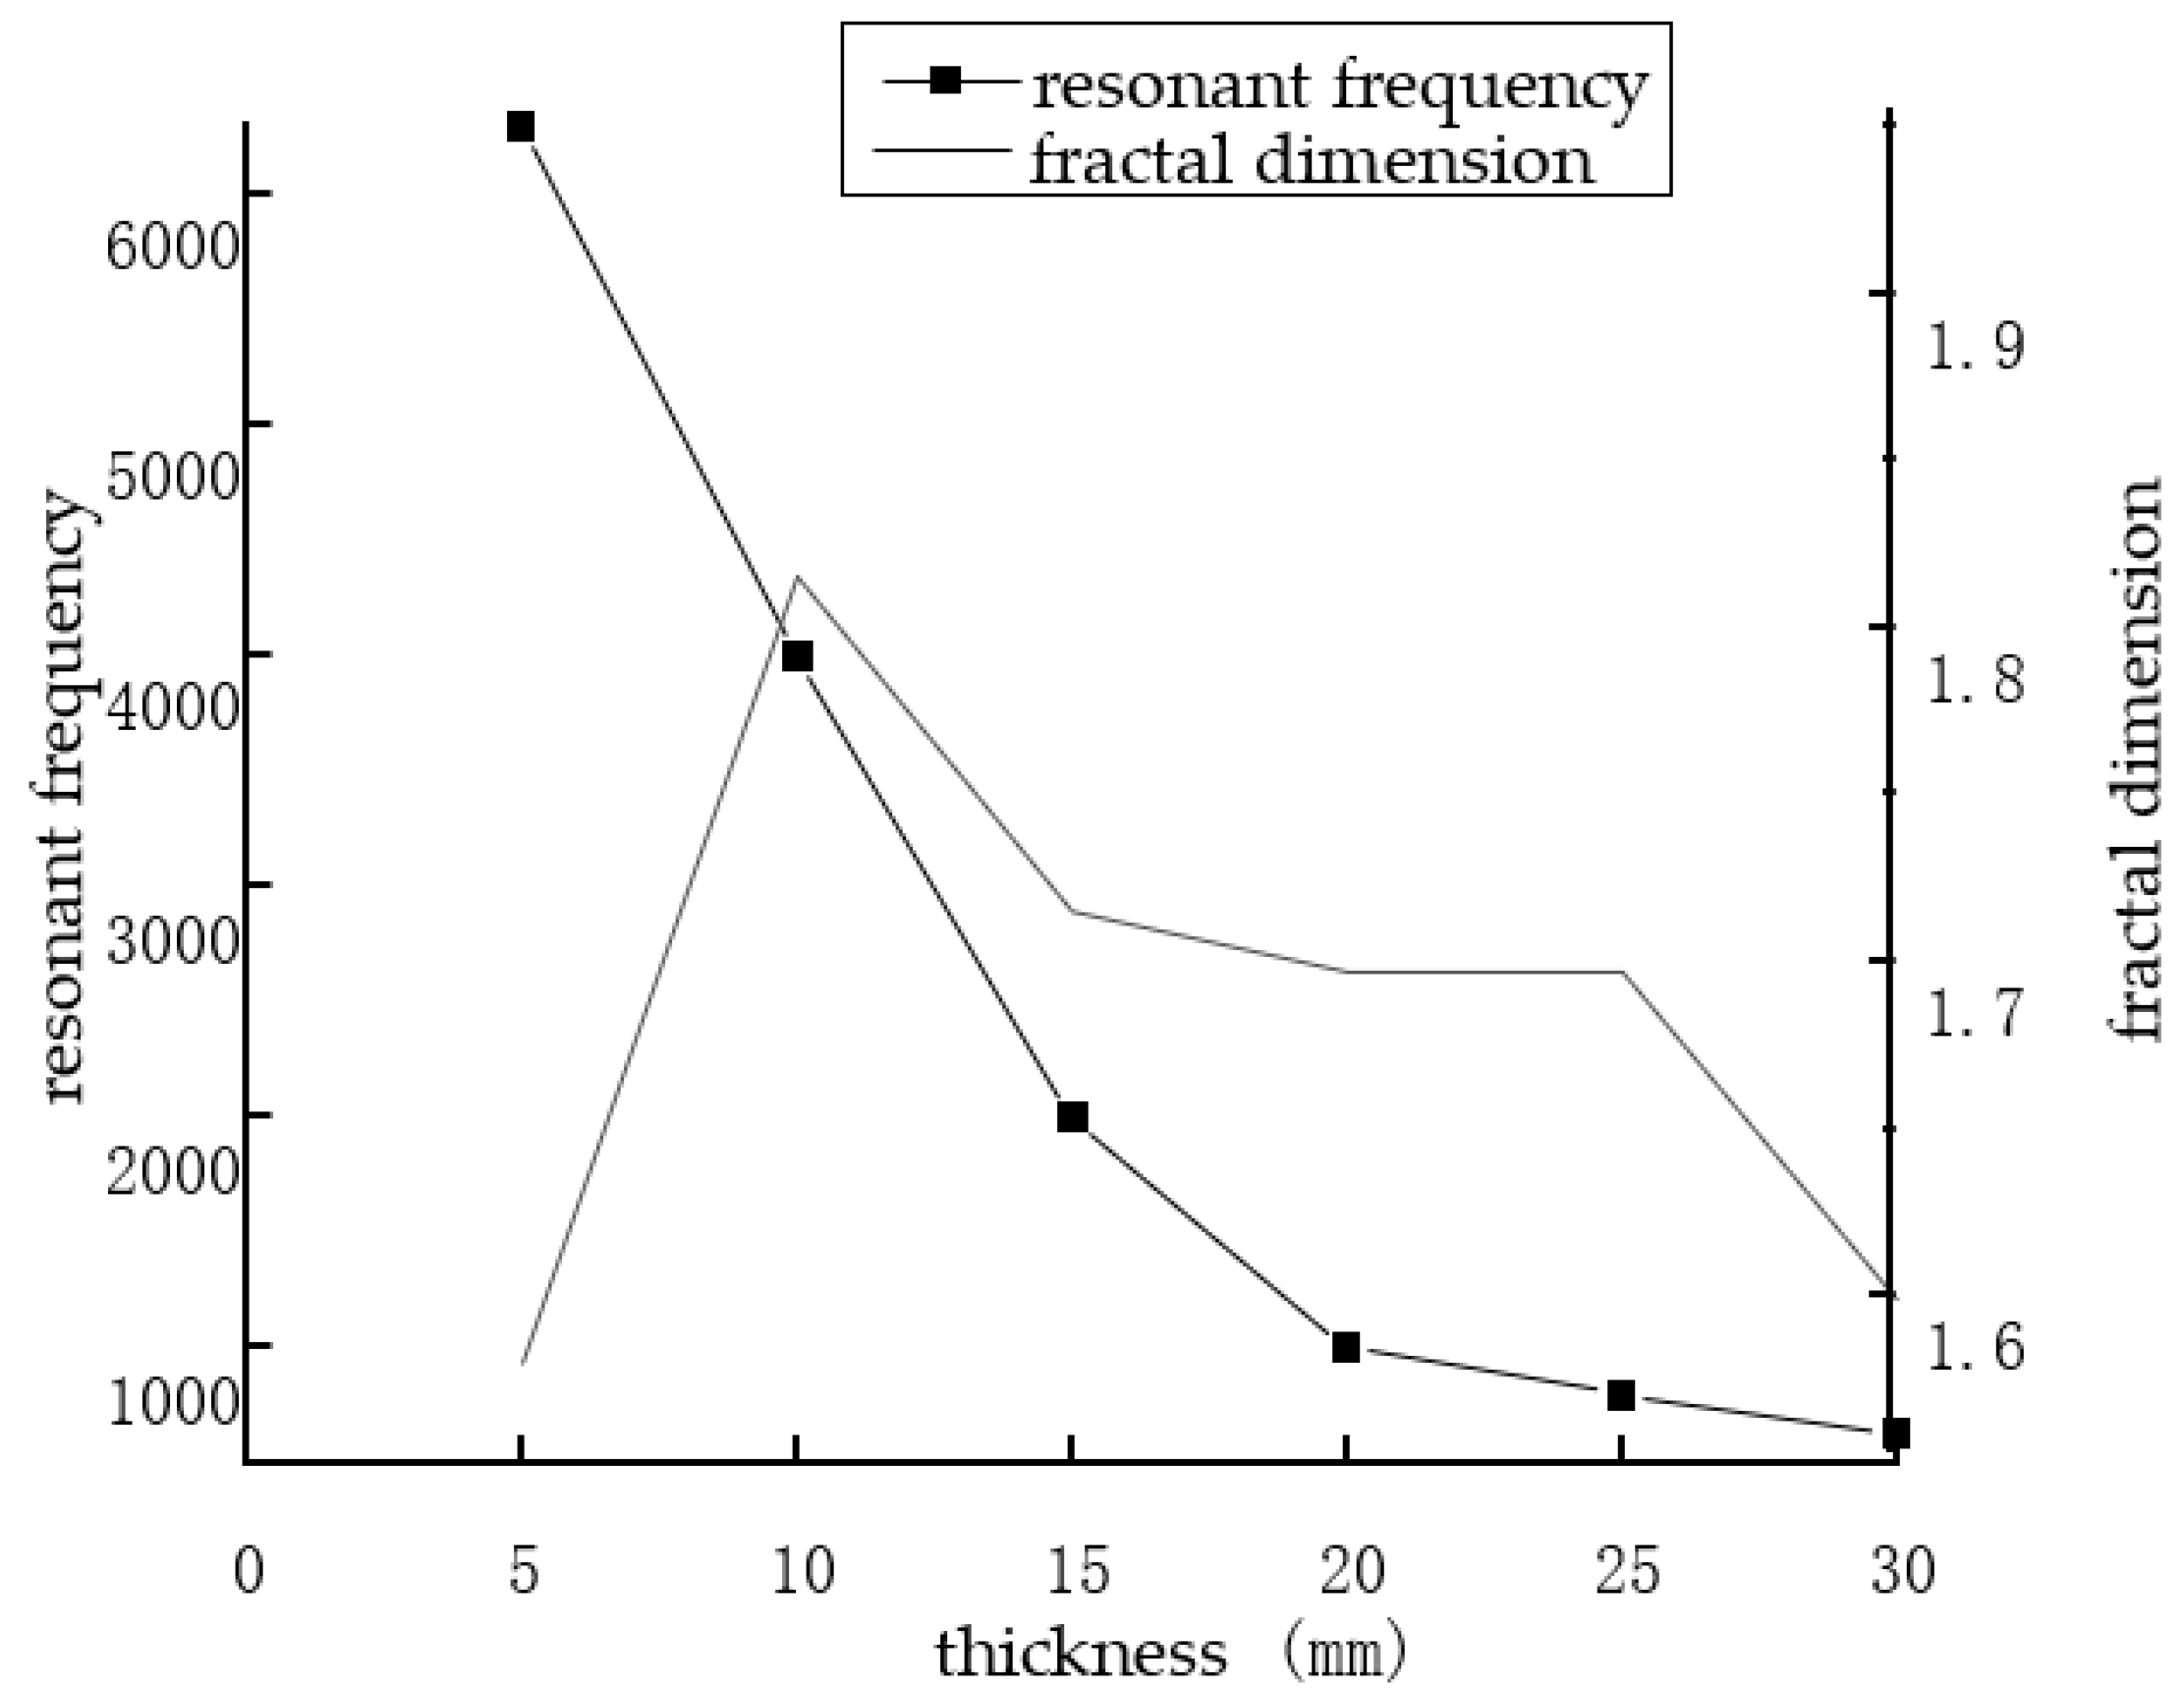
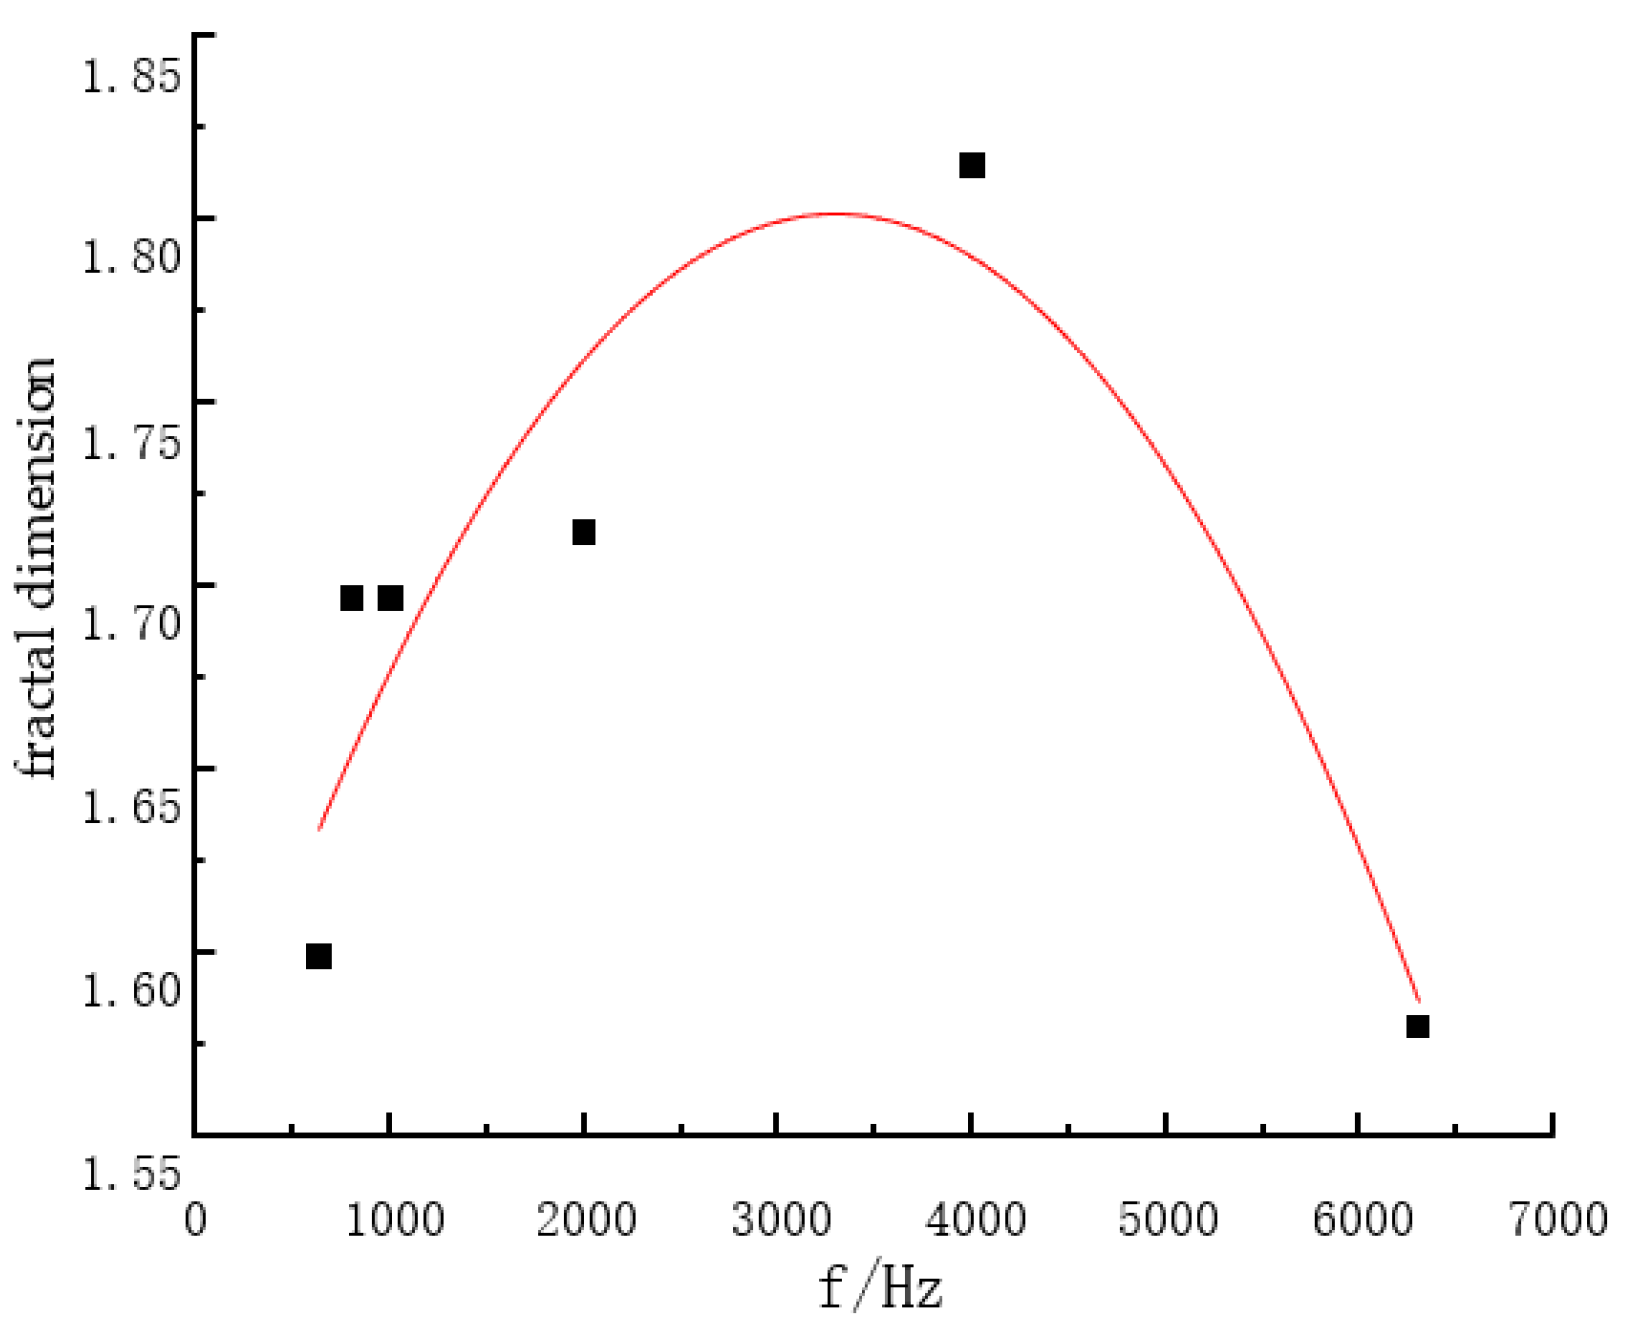
3.3.3. Influence of Thickness on Fractal Dimension
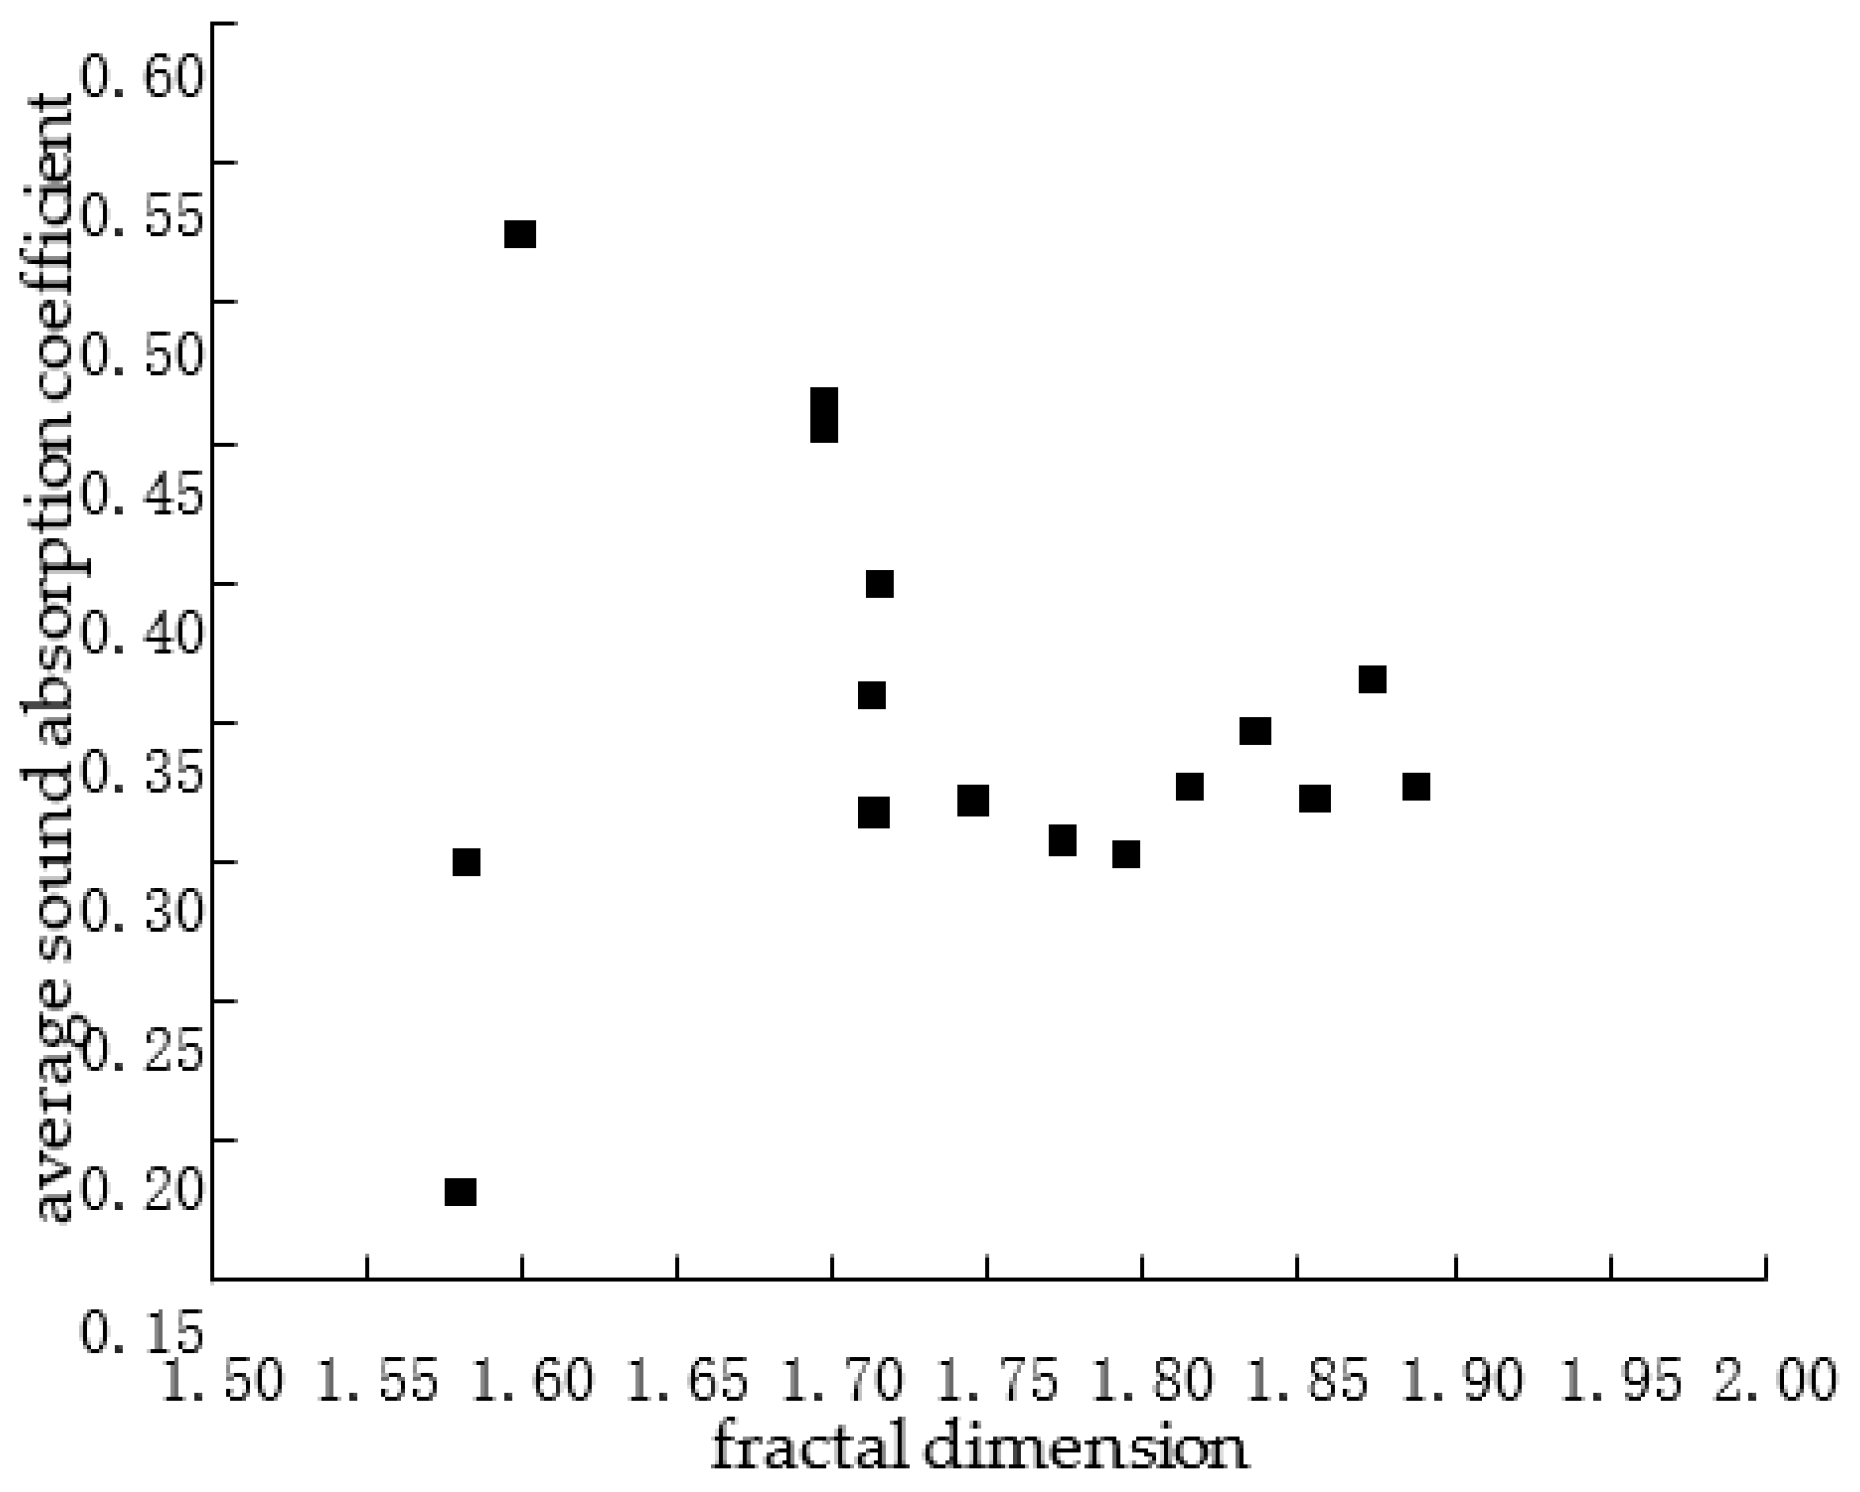
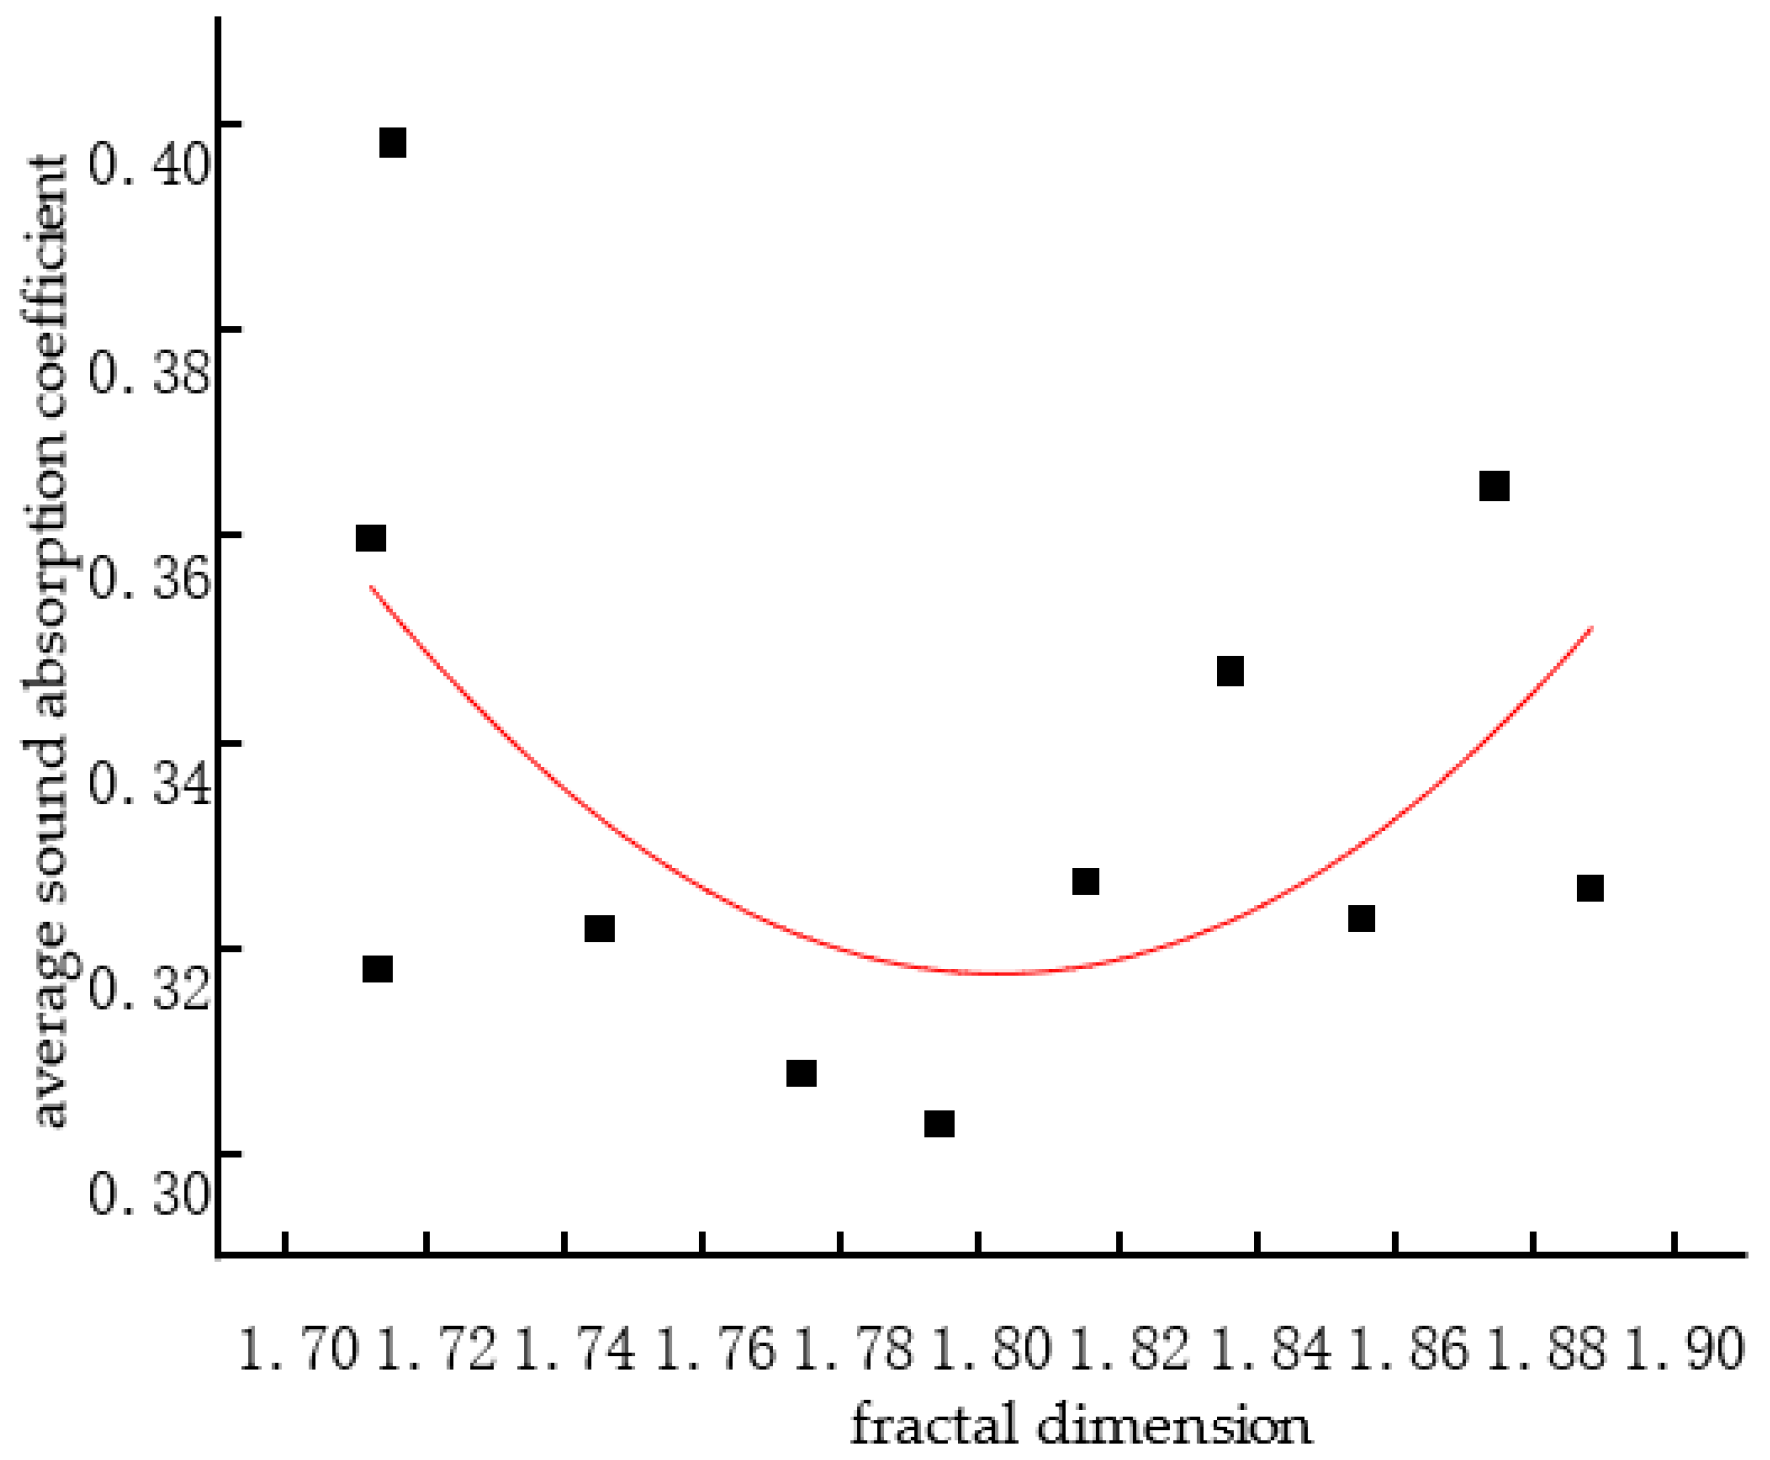
3.3.4. Relationship between Fractal Dimension and Average Sound-Absorption Coefficient
4. Conclusions
- (1)
- Through single-factor experiments, composite material determined the optimal process conditions as follows. The composite material’s volume density was 0.172 g/cm3, the mass fraction of kapok fibre was 40%, and the composite material’s thickness was 2.0 cm. Therefore, this experiment obtained a porous sound-absorbing material with a high sound-absorption coefficient and absorption bandwidth. The maximum sound-absorption coefficient was 0.830, and the average sound-absorption coefficient was 0.520.
- (2)
- The box-counting method was used to calculate the kapok fibre/polycaprolactone sound-absorbing composite material’s fractal dimension. The results showed that the kapok fibre/polycaprolactone composite material had strong fractal characteristics. By fitting the fractal dimension and average sound-absorption coefficient of the kapok fibre composites, the fitting curve was Y = 4.6 × X2 − 16.58X + 15.26. The right angle of fractal dimension and resonance sound-absorption frequency was Y = −2.37 × 10⁻⁸ × X2 + 1.56 × 10⁻⁴X + 1.54, which provided the theoretical basis for the study parameter design of the sound-absorption performance of kapok fibre composite material, and had important guiding significance.
- (3)
- Kapok fibre sound-absorption composite material had the advantages of low production cost, light weight, simple process, and recycling. Therefore, this sound-absorbing composite material could be widely used in the building environment. In this paper, only the sound-absorption performance of kapok fibre sound-absorption composite material was studied. In practical application, other properties such as mechanical properties, antibacterial properties, thermal insulation properties, and so on need to be considered.
Author Contributions
Funding
Institutional Review Board Statement
Informed Consent Statement
Conflicts of Interest
Appendix A
Appendix B
- 1.
- Binarisation images of composites with different volume density, mass fraction, and thickness

- 2.
- Calculation results of the fractal dimension of composite materials with different volume density, mass fraction, and thickness.


References
- Yuan, Y. Analysis of Hazard and Control of Urban Noise Pollution. Reg. Control 2020, 13, 61–62. [Google Scholar]
- He, Q.; Lin, L.; Lu, C.Y.; Lu, W.J.; Jing, X.F.; Chen, W. Research Development of Noise Reduction Materials. Smart Grid 2016, 4, 966–971. [Google Scholar]
- Tudor, E.M.; Dettendorfer, A.; Kain, G.; Barbu, M.C.; Ren, R.; Kristak, L. Sound-Absorption Coefficient of Bark-Based Insulation Panels. Polymers 2020, 29, 1012. [Google Scholar] [CrossRef]
- Tudor, E.M.; Kristak, L.; Barbu, M.C.; Gergel, T.; Nemec, M.; Kain, G.; Ren, R. Acoustic Properties of Larch Bark Panels. Forests 2021, 12, 887. [Google Scholar] [CrossRef]
- Smardzewski, J.; Batko, W.; Kamisinski, T.; Flach, A. Experimental Study of Wood Acoustic Absorption Characteristics. Holzforschung 2013, 68, 467–476. [Google Scholar] [CrossRef]
- Asdrubali, F.; Schiavoni, S.; Horoshenkov, K.V. A Review of Sustainable Materials for Acoustic Applications. Build. Acoust. 2012, 19, 283–312. [Google Scholar] [CrossRef]
- Fouladi, M.H.; Ayub, M.; Nor, M. Analysis of Coir fibre Acoustical Characteristics. Appl. Acoust. 2011, 72, 35–42. [Google Scholar] [CrossRef]
- Liang, L.S.; Guo, W.L.; Zhang, Y.; Li, L.P.; Du, J.J. Research Progress of New Sound Absorption Materials and Sound Absorption Model. J. Funct. Mater. 2020, 51, 19–25. [Google Scholar]
- Arenas, J.P.; Asdrubali, F. Eco-Materials with Noise Reduction Properties. In Handbook of Ecomaterials; Martínez, L., Kharissova, O., Kharisov, B., Eds.; Springer: Cham, Switzerland, 2018; pp. 1–26. [Google Scholar]
- Song, J.B.; Liu, X.X.; Yuan, G.P.; Fu, F.; Yang, W.B. Rheological and Mechanical Properties of HDPE /Tea stalk /CNTs Composites. Plast. Ind. 2015, 4, 79–82. [Google Scholar]
- Chu, J.Y.; Liao, S.Q.; Li, H.G. Performance and Application Progress of Kapok Fibre. Ind. Text. 2018, 36, 6–10. [Google Scholar]
- Xiang, H.F.; Wang, D.; Liu, H.C.; Zhao, N.; Xu, J. Investigation on Sound Absorption Properties of Kapok Fibres. Chin. J. Polym. Sci. 2013, 31, 521–529. [Google Scholar] [CrossRef]
- Su, Y.F.; Ge, M.Q. Kapok Fibre and its aPPLICATION in Textile. J. Fash. Technol. 2018, 3, 9–13. [Google Scholar]
- Zou, J.; Yao, H. Building a Modern Socialist Country in an All-Round Way: A NEW STRATEGIC GOAL of “Four Comprehensiveness”. J. Communist Party Sch. Shijiazhuang 2021, 23, 10–14. [Google Scholar]
- Xu, Y.J. Kapok and Wool Composite Thermal Insulation Building Materials. Ind. Text. 1999, 4, 23. [Google Scholar]
- Liu, X.T.; Li, L.; Yan, X. Carbon Absorbing Properties of WOVEN Composites. Mater. Sci. Eng. B 2012, 55, 550–559. [Google Scholar]
- Makki, A.I.; Oktariani, E. Acoustic Absorptive Properties of Kapok Fibre, Kapok Fibre Layered Tricot Fabric and Kapok Fibre Layered Double Weave Fabric. J. Phys. 2019, 1381, 1–4. [Google Scholar]
- Azieyanti, N.A.; Faris, R. Acoustic Isolation of Jute and Kapok Fibre Reinforcement Polypropylene Composites. IOP Conf. Ser. Mater. Sci. Eng. 2020, 932, 012096. [Google Scholar] [CrossRef]
- Liu, X.T.; Tang, X.N.; Deng, Z.M. Sound Absorption Properties for Multi-Layer of Composite Materials using Nonwoven Fabrics with Kapok. J. Ind. Text. 2020, 152808372090492. [Google Scholar] [CrossRef]
- Yu, B.M. Analysis of Heat and Mass Transfer in Fractal Medium. J. Eng. Thermophys. 2003, 3, 481–483. [Google Scholar]
- Chen, W.H.; Chen, T.N.; Wang, X.P.; Zhang, C. Study on Fractal Model of Flow Resistance of Fibre Porous Metal. J. Xi’an Jiaotong Univ. 2015, 49, 132–137. [Google Scholar]
- Fu, X.W. Thermal Conductivity Fractal Model of Down Fibre Aggregate. Master’s Thesis, Donghua University, Shanghai, China, 2012. [Google Scholar]
- Lyu, L.H.; Liu, Y.J.; Bi, J.H.; Guo, J. Sound Absorption Properties of DFs/EVA Composites. Polymers 2019, 11, 811. [Google Scholar] [CrossRef] [Green Version]
- Xu, Z.C. Research on Architectural Space Construction Based on Fractal Theory. Master’s Thesis, Nanjing University of the Arts, Nanjing, China, 2015. [Google Scholar]
- Liu, Y.J. Preparation and Sound Absorption Performance of the Poplar Seed Fibre/Polycaprolactone Composite Materials. Master’s Thesis, Dalian Polytechnic University, Dalian, China, 2020. [Google Scholar]
- Qian, J.M.; Li, X.X. Sound Absorption Mechanism of Polymer Matrix Composite Foams. Noise Vib. Control 2000, 2, 41–43. [Google Scholar]
- Su, W.; Li, X.Y. Feasibility of Absorbent Materials used for Road Noise-Deafening Barrier. China Fashion Inst. Technol. 2009, 2, 8–12. [Google Scholar]
- Wang, H.; Ma, Y.X.; Jin, X.Y. Study on Structure and Sound Absorption Performance of Compound Needled Nonwovens. Nonwovens 2009, 17, 31–34. [Google Scholar]
- Liu, Y.F.; Jeng, D.S. Pore Structure of Grain-Size Fractal Granular Material. Materials 2019, 12, 2053. [Google Scholar] [CrossRef] [Green Version]
- Li, Y. Study on Fractal Dimension Algorithm and its Evolution of Historical Buildings. Shanxi Archit. 2020, 46, 36–38. [Google Scholar]
- Yang, S. Structural Characteristics of Fibre Aggregates and Their Acoustic Absorption Performance. Ph.D. Thesis, Donghua University, Shanghai, China, 2011. [Google Scholar]
- Lyu, L.H.; Tian, Y.Y.; Lu, J.; Xiong, X.Q.; Guo, J. Flame-Retardant and Sound-Absorption Properties of Composites Based on Kapok Fibre. Materials 2020, 13, 2845. [Google Scholar] [CrossRef] [PubMed]
- Liu, L.B. Study on PCL and MPEG-PCL Block Copolymer Microspheres. Master’s Thesis, Shanghai Jiao Tong University, Shanghai, China, 2009. [Google Scholar]
- Liu, Y.J.; Lyu, L.H.; Guo, J.; Wang, Y. Sound Absorption Performance of the Poplar Seed Fibre/PCL Composite Materials. Materials 2020, 13, 1465. [Google Scholar] [CrossRef] [Green Version]
- Wang, J.C.; Zhang, X.F.; Zhou, J.H.; Mei, C.Z.; Wang, X.D. Carbonation Depth Model of Waste Fibre Recycled Concrete Based on Fractal Theory. Build. Struct. 2019, 49, 137–141. [Google Scholar]


| Sample Number | Composites Volume Density g·cm−3 | Maximum Sound Absorption Coefficient | Average Sound Absorption Coefficient | Fractal Dimension | The Square of the Correlation Coefficient R2 |
|---|---|---|---|---|---|
| 1# | 0.139 | 0.940 | 0.326 | 1.888 | 0.998 |
| 2# | 0.155 | 0.710 | 0.303 | 1.794 | 0.996 |
| 3# | 0.172 | 0.800 | 0.365 | 1.874 | 0.998 |
| 4# | 0.188 | 0.750 | 0.347 | 1.836 | 0.997 |
| 5# | 0.205 | 0.680 | 0.323 | 1.855 | 0.998 |
| 6# | 0.211 | 0.630 | 0.300 | 1.582 | 0.980 |
| Sample Number | Quality Fraction of Kapok Fibre % | Maximum Sound Absorption Coefficient | Average Sound Absorption Coefficient | Fractal Dimension | The Square of the Correlation Coefficient R2 |
|---|---|---|---|---|---|
| 7# | 30 | 0.940 | 0.308 | 1.774 | 0.995 |
| 8# | 40 | 0.860 | 0.318 | 1.713 | 0.990 |
| 9# | 50 | 0.770 | 0.322 | 1.745 | 0.994 |
| 10# | 60 | 0.750 | 0.360 | 1.712 | 0.992 |
| Sample Number | Thickness cm | Resonant Sound-Absorption Frequency | Average Sound-Absorption Coefficient | Fractal Dimension | The Square of the Correlation Coefficient R2 |
|---|---|---|---|---|---|
| 11# | 0.5 | 6300 | 0.182 | 1.580 | 0.989 |
| 12# | 1 | 4000 | 0.327 | 1.815 | 0.992 |
| 13# | 1.5 | 2000 | 0.400 | 1.715 | 0.997 |
| 14# | 2 | 1000 | 0.445 | 1.697 | 0.992 |
| 15# | 2.5 | 800 | 0.465 | 1.697 | 0.992 |
| 16# | 3 | 630 | 0.525 | 1.599 | 0.984 |
Publisher’s Note: MDPI stays neutral with regard to jurisdictional claims in published maps and institutional affiliations. |
© 2021 by the authors. Licensee MDPI, Basel, Switzerland. This article is an open access article distributed under the terms and conditions of the Creative Commons Attribution (CC BY) license (https://creativecommons.org/licenses/by/4.0/).
Share and Cite
Lyu, L.; Zhang, D.; Tian, Y.; Zhou, X. Sound-Absorption Performance and Fractal Dimension Feature of Kapok Fibre/Polycaprolactone Composites. Coatings 2021, 11, 1000. https://doi.org/10.3390/coatings11081000
Lyu L, Zhang D, Tian Y, Zhou X. Sound-Absorption Performance and Fractal Dimension Feature of Kapok Fibre/Polycaprolactone Composites. Coatings. 2021; 11(8):1000. https://doi.org/10.3390/coatings11081000
Chicago/Turabian StyleLyu, Lihua, Duoduo Zhang, Yuanyuan Tian, and Xinghai Zhou. 2021. "Sound-Absorption Performance and Fractal Dimension Feature of Kapok Fibre/Polycaprolactone Composites" Coatings 11, no. 8: 1000. https://doi.org/10.3390/coatings11081000