Article

Microstructure Analysis and Fatigue Behavior of Laser Beam Welding 2060-T8/2099-T83 Aluminum–Lithium Alloys

1
School of Materials Engineering, Shanghai University of Engineering Science, Shanghai 210620, China
2
Shanghai Collaborative Innovation Center of Laser Advanced Manufacturing Technology, Shanghai 210620, China
3
Hangzhou Hanlin Welding Technology Co., Ltd., Hangzhou 310021, China
*
Author to whom correspondence should be addressed.
Coatings 2021, 11(6), 693; https://doi.org/10.3390/coatings11060693
Submission received: 7 May 2021 / Revised: 4 June 2021 / Accepted: 8 June 2021 / Published: 10 June 2021
(This article belongs to the Special Issue The Applications of Laser Processing and Additive Manufacturing)

Abstract

:
In this paper, the microstructure analysis and performance research of dual laser beam welded 2060-T8/2099-T83 aluminum–lithium alloys were carried out. First, the macroscopic morphology and microstructure characteristics of T-joint aluminum–lithium alloys under different welding conditions were observed. Then the effect of welding parameters and pore defects on tensile and fatigue properties of the weld were carried out and the experimental results were analyzed. It was found that the weld heat input has a significant influence on the penetration of the welded aluminum–lithium alloys joint. When the laser power is too high, the weld will absorb more laser energy and the increase in the evaporation of magnesium will further increase the weld penetration. When the penetration depth increases, the transverse tensile strength tends to decrease. There is no obvious rule for the effect of pore defects on the tensile strength of the weld. At the same time, the heat input of the weld is inversely proportional to the porosity. When the weld heat input increases from 19.41 to 23.33 kJ/m, the porosity decreases from 5.35% to 2.08%. During the fatigue test, it was confirmed that the existence of pore defects would reduce the fatigue life of the weld. In addition, from the analysis of the fatigue fracture morphology it can be found that when the porosity is low, the weld toe is the main source of fatigue cracks. The crack propagation zone shows a typical beach pattern and the final fracture of the base metal presents the characteristics of a brittle fracture. While, when the porosity is high, the crack source is mainly located at the pore defects. T-joint fractures from the inside of the weld and the fracture in the final fracture zone have obvious pore defects and dimples.

1. Introduction

An aircraft’s structure is composed of tens of thousands of parts. In the early days, the main material used for aircraft manufacturing was aluminum alloy and the connection method was riveting. After a long period of development, riveting is an extremely mature process, but has been difficult to improve upon [1,2]. However, the riveting process also has many shortcomings in the aircraft assembly process, which are mainly reflected in: uneven stress distribution of the riveting seam, large manual labor and low production efficiency, riveting quality is greatly affected by human factors and is not easy to control [3,4]. Because of the many shortcomings of riveting technology, welding technology and other material surface treatment technologies are gradually being used in more and more applications in the aerospace field. Ball-burnishing technology is a rapid, environmentally-friendly, cost-effective surface treatment method based on irregular surface plastic deformation. Ball-burnishing provides the material with a good surface finish, high compressive residual stress and increases the hardness of the surface layer. These features are essential for improving the fatigue life of the component and the wear resistance due to the higher hardness [5,6].
The knowledge of aluminum–lithium alloys has been present for a long time. Due to its small specific gravity and high solubility in aluminum, people have long regarded lithium as a close partner of aluminum. However, only recently, due to the development of metallurgical technology and related technologies, has it been possible to make aluminum–lithium alloys with a larger lithium content, smaller specific gravity and higher strength. Aluminum–lithium alloys have excellent fracture toughness and ductility because of their low density, better corrosion resistance and fatigue resistance, which have broad application prospects in the aerospace and military industries [7,8]. Aluminum–lithium alloys are mainly developed for weight reduction in aircraft and aerospace equipment. The reduction in quality can effectively increase the payload of spacecraft, reduce fuel consumption and reduce the annual flight cost of each aircraft, thereby bringing greater economic benefits [9,10]. Due to the high focus and power density of the laser beam, laser welding has many advantages: high welding speed, narrow and deep weld, small heat affected zone, good mechanical properties and low structural deformation. In addition, its excellent propagation capability and accessibility make the laser beam a powerful tool for welding complex three-dimensional structures. Therefore, laser beam welding has gradually been cited in aluminum–lithium alloys [11,12]. Research on laser beam welding aluminum–lithium alloys has mainly focused on weld formation, microstructure, mechanical properties, porosity and crack sensitivity [13]. However, the fatigue behavior of laser welding aluminum–lithium alloys has rarely been studied. The formation and propagation of fatigue cracks during the welding process have great concealment, but fatigue fractures are instantaneous [14].
In the fatigue performance analysis of metal materials, most of the research pays close attention to the influence of the material microstructure and the magnitude of the applied load on fatigue performance. Zhang et al. [15] used scanning electron microscopy, electron backscatter diffraction and transmission electron microscopy to characterize the laser-arc hybrid welded AA6082 aluminum alloy’s microstructure and fatigue fracture. They discussed the influence of microstructure on different fatigue processes theoretically and found that the microstructure mainly affects the first stage of fatigue crack growth. Low porosity and finer grain size can improve the fatigue life of welds. Wang et al. [16] used a combination of high-power laser welding and narrow-gap laser-arc hybrid welding and found that the fatigue performance of laser welds is better than that of hybrid welds. They pointed out that this is closely related to the fine multi-directional grains in the laser weld and the particle phase precipitation in the mixed weld. Trishita Ray [17] explained the failure mechanism under fatigue load using a stress analysis model and experimental data. Through discontinuous fatigue tests, it was found that small welds show a slightly longer fatigue life. At the same time, with a lowering of fatigue load there is a shift in the mode of fatigue with transition from interfacial to partial to pull-out failure. Qiao et al. [18] pointed out that different aging treatments have a greater impact on the fatigue crack growth rate. After 60 days of natural aging on fiber Laser-VPTIG hybrid butt welded 7N01P-T4 aluminum alloy, they found that the fatigue crack growth rate of natural-aged joints is slower than that of welded joints without aging treatment. The reason for this can be attributed to the number of magnesium and zinc precipitations in the weld zone, which change the dislocation movement thereby effectively changing the fatigue crack growth. These studies were mainly focused on aluminum alloy and steel. Moreover, their research on the fatigue life of welds was limited to the expansion of fatigue cracks and there is no specific quantitative calculation of the fatigue life of welds.
Previous studies on fatigue properties focused on observing changes in process parameters to obtain the influence of microstructure or aging treatment on the fatigue properties of materials. At present, there are few studies on the fatigue performance of laser beam welding aluminum–lithium alloys and it is still unknown about the corresponding relationship with the structure. This article will take this as a starting point to study the microstructure, tensile properties and fatigue performance of laser beam welding aluminum–lithium alloys systematically, and focus the research on the relationship between the tensile and fatigue properties of aluminum–lithium alloys welded joints and their structure and defects.

2. Experimental Materials and Methods

During the welding process, two 4 KW IPG fiber lasers were used. The welding head and the wire feeding system on both sides were relatively stationary to achieve stable control during the simultaneous dual laser beam welding process. The specific device and process of the welding were described in the former literature [19]. The welding structure was T-joint with skin and stringer materials. The skin material in this experiment was 2060T8 aluminum–lithium alloys and the stringer material was 2099T83 aluminum–lithium alloys. The filler wire material was ER4047 with a diameter of 1.2 mm. The chemical composition and content are shown in Table 1.
In the experiment, three groups of laser beam welding parts processed under different process conditions were tested and analyzed (parameters are shown in Table 2). The joint structure was observed through the VHX-5000 ultra-depth-of-field microscope (Keyence (China) Co., Ltd., Shanghai, China). The non-destructive inspection of the weld was carried out by KST-V high-precision micro-focus X-ray machine. The ray shooting angle is shown in Figure 1a. A static tensile test of the skin perpendicular to the direction of the weld was carried out in accordance with the standard of ASTM E8M-13 [20] to determine the mechanical properties of laser beam welding aluminum–lithium alloys. The test loading rate was 2 mm/min. The workpiece and the force direction are shown in the Figure 1b. A tensile-tension fatigue test was carried out on the skin perpendicular to the direction of the weld. The fatigue life was tested by Zwick HB250-250kN electro-hydraulic servo dynamic fatigue testing machine (Shanghai Yuzhong Industrial Co., Ltd., Shanghai, China) and the morphological characteristics of the weld fatigue fracture was observed by TESCAN VEGA3 scanning electron microscope (Shanghai Lesser Spectrometer Analysis Technology Co., Ltd., Shanghai, China).

3. Result and Discussion

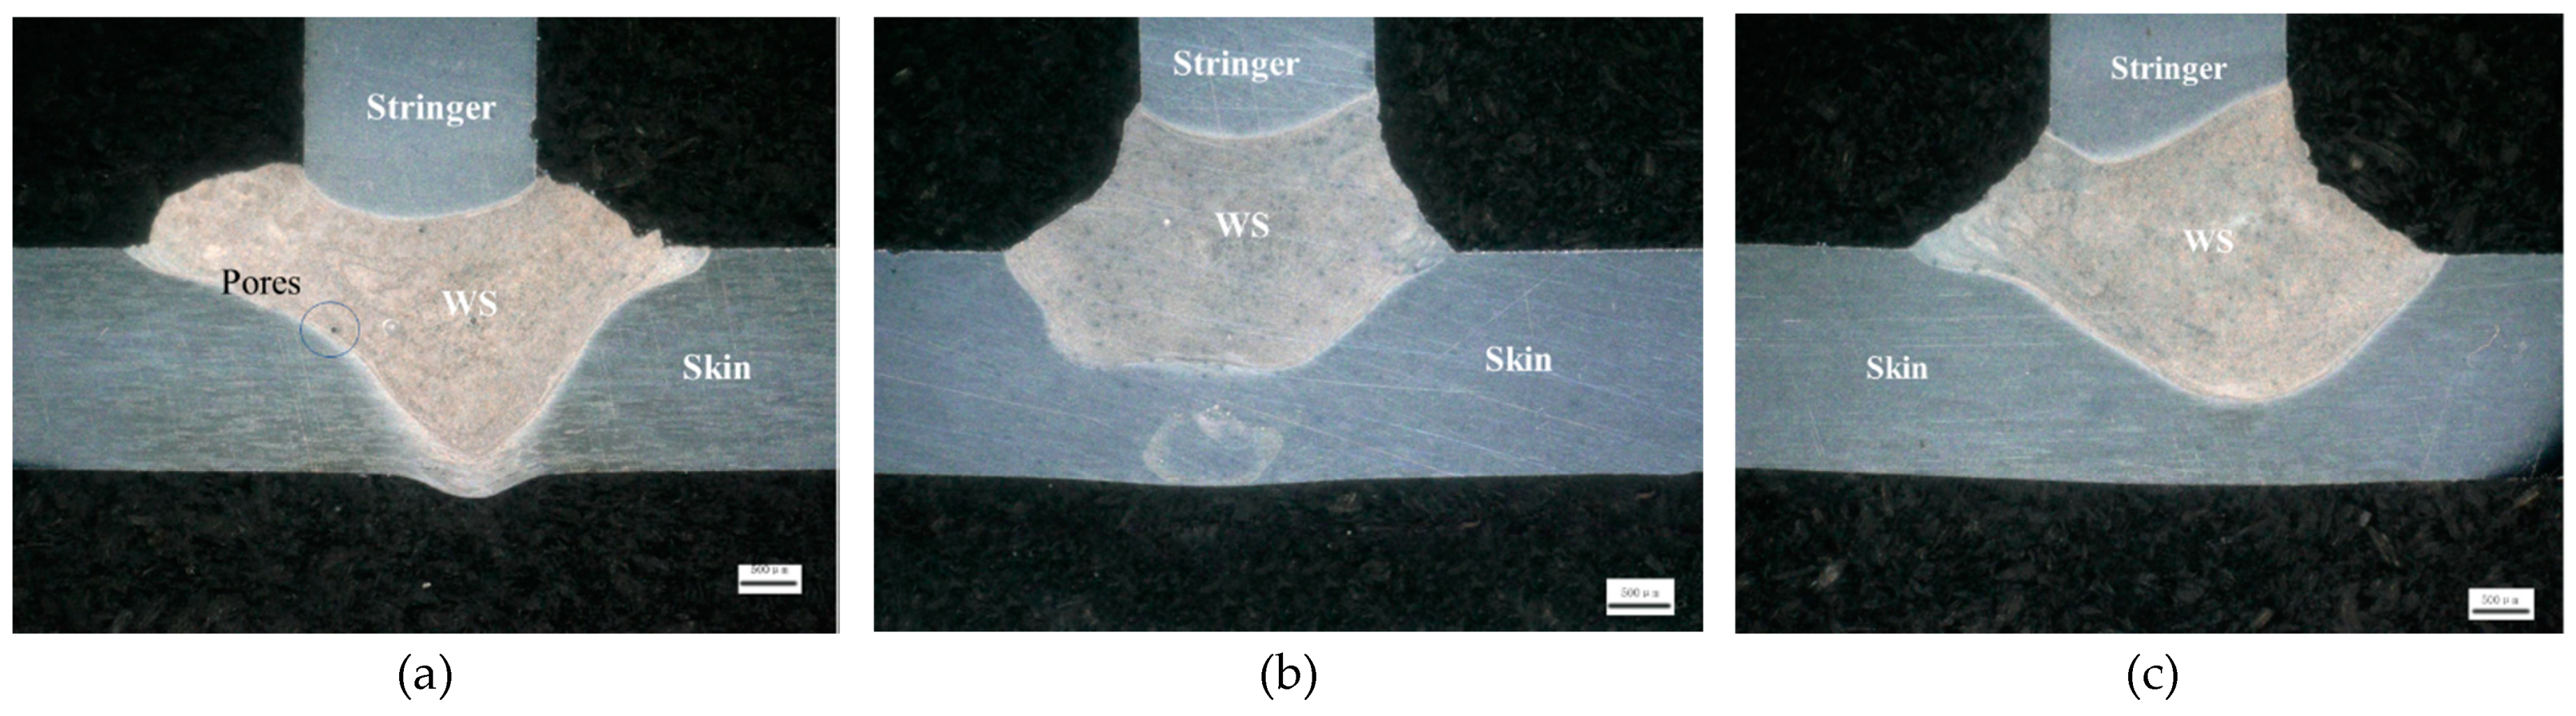
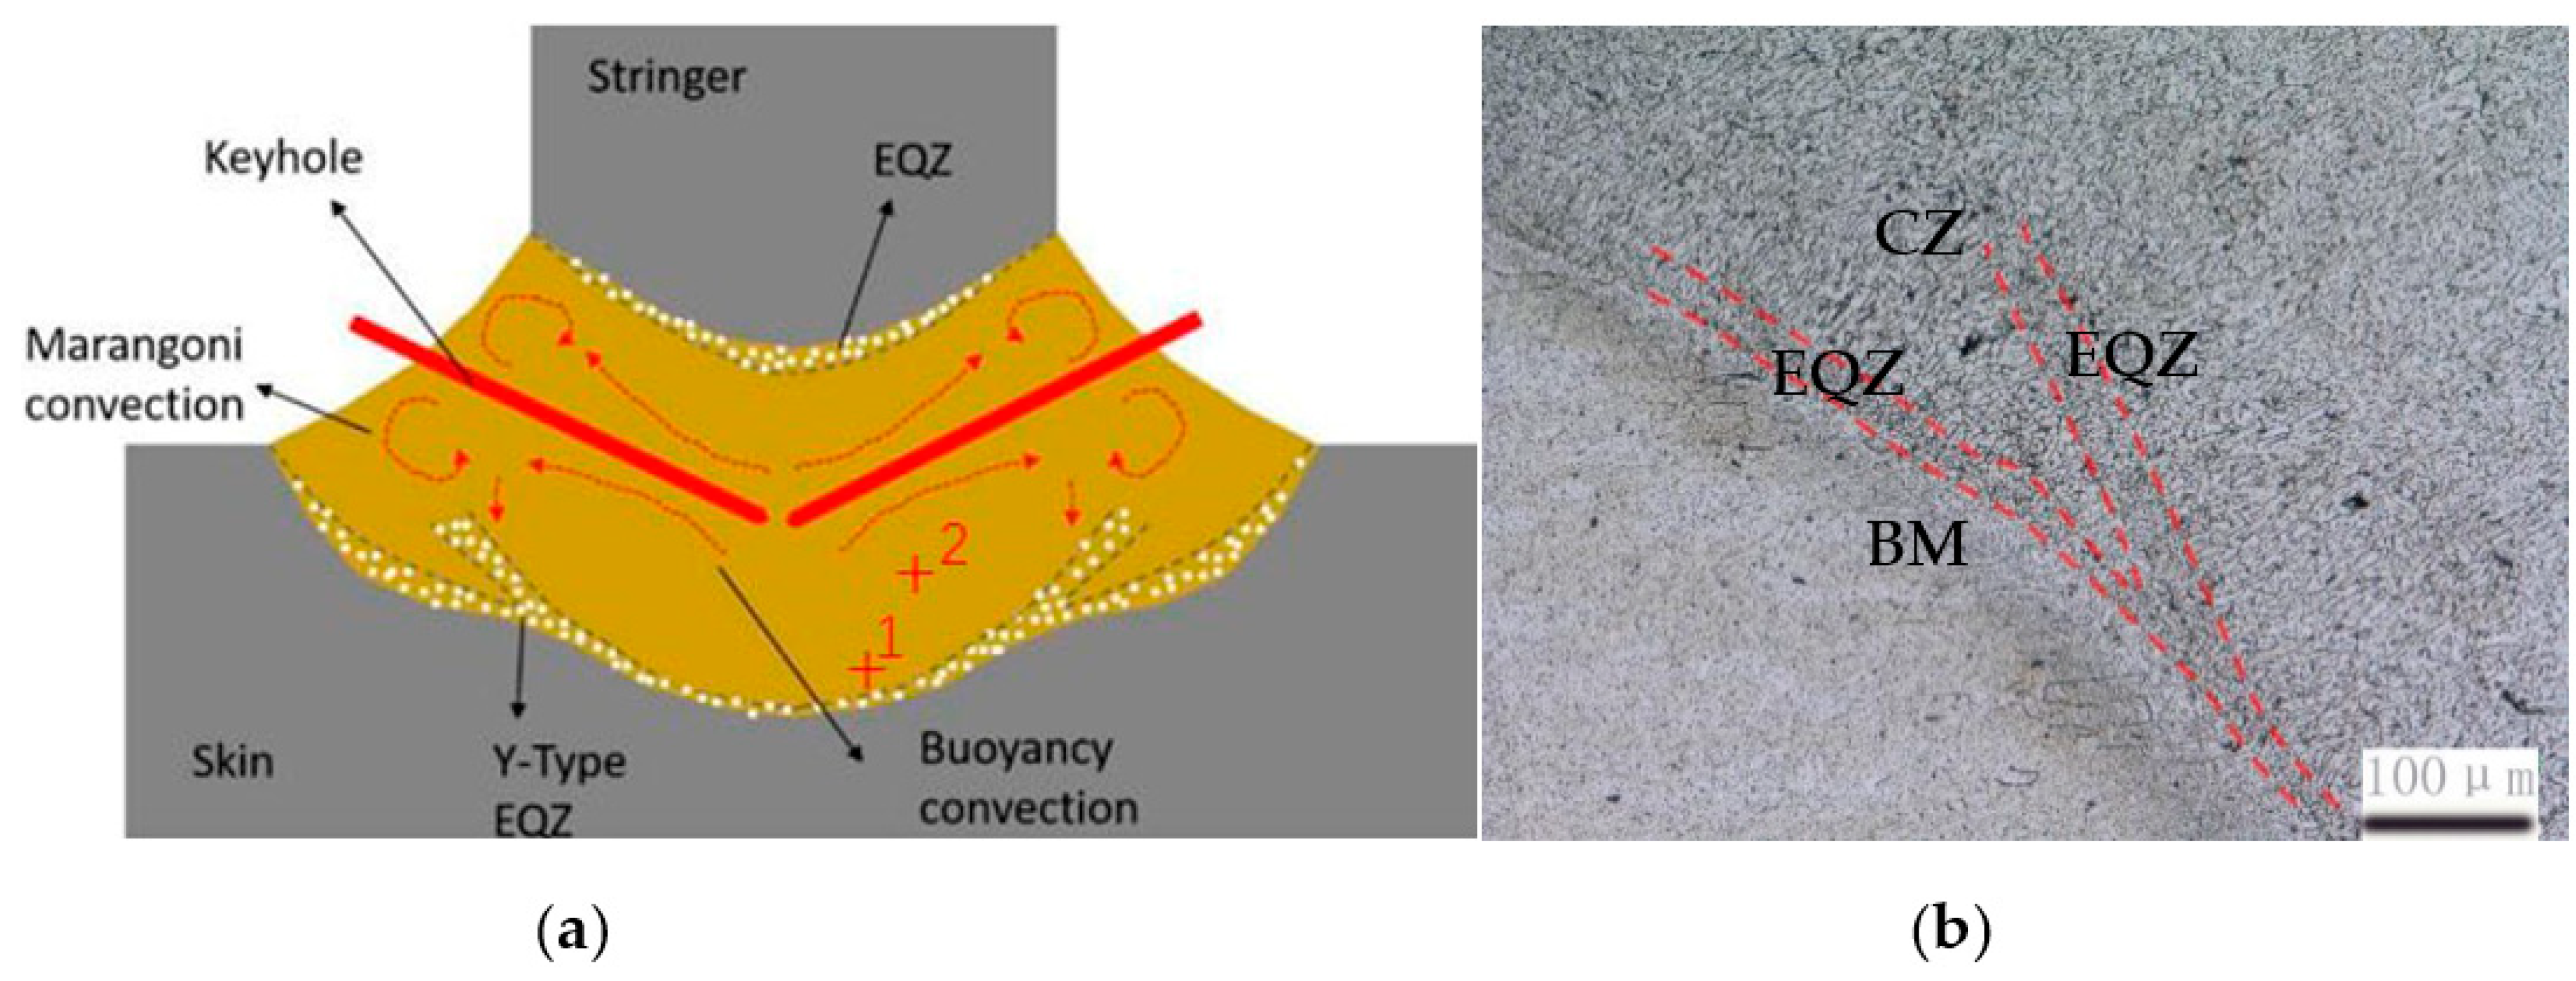
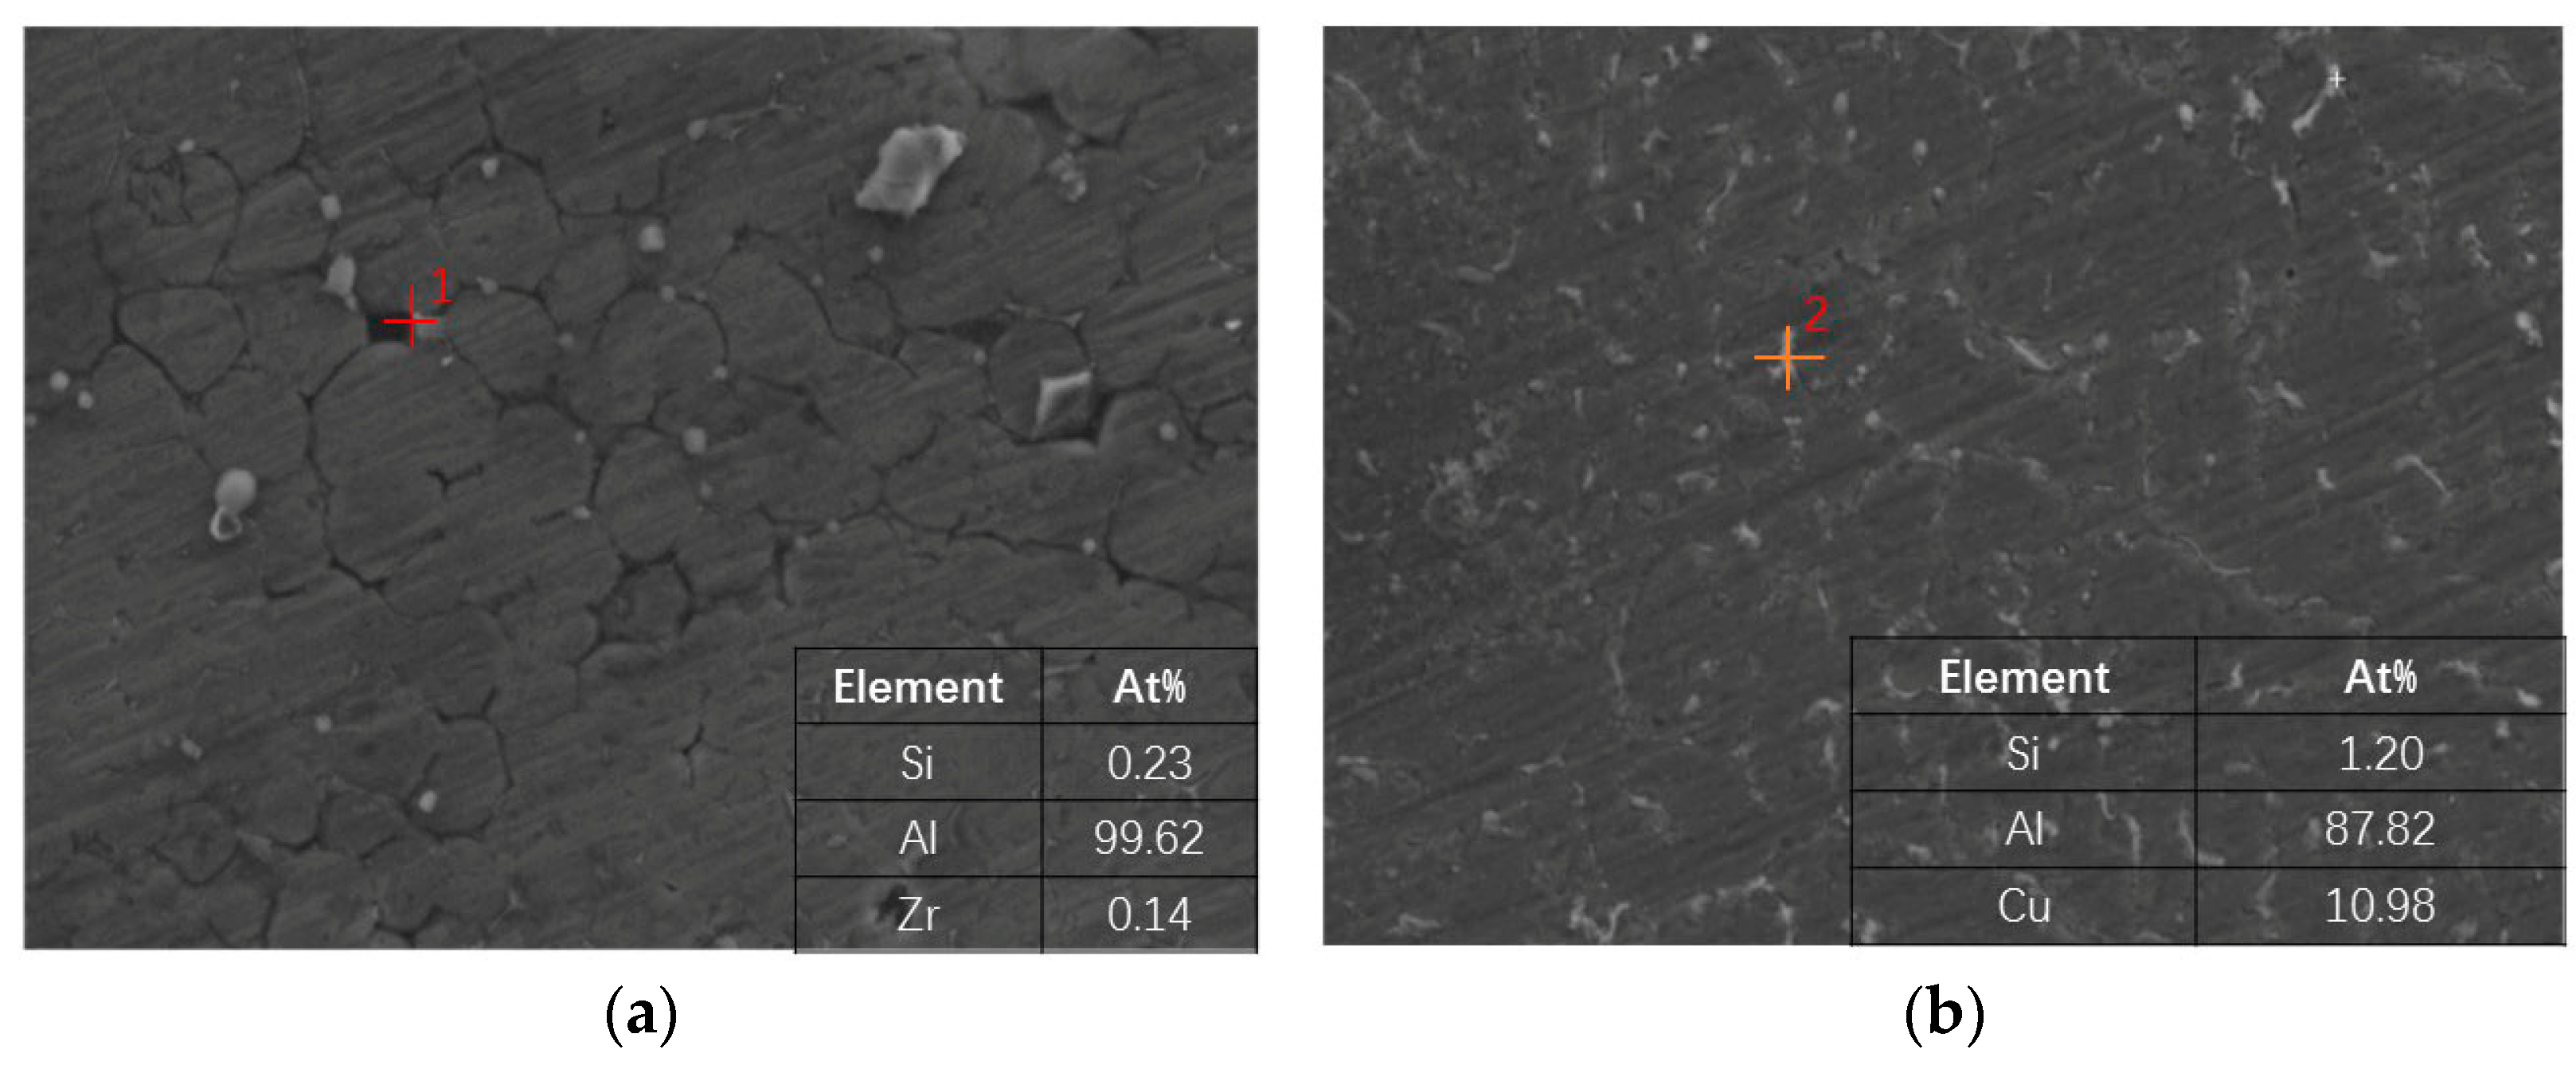
3.1. Weld Structure Analysis

An ultra-depth-of-field microscope was used to observe the macro morphology and structure characteristics of the laser beam welding aluminum–lithium alloys. The weld penetration ratio is shown in Figure 2. The appearance of the weld was well formed and there were no defects such as cracks or inclusions, but there was a small amount of pore defects in the weld. The weld pools on both sides of the joint penetrated each other to form a uniform transition weld. Experiments confirmed that the laser beam welding process parameters such as laser power, welding speed and wire feed speed had an obvious effect on the weld penetration ratio. As shown in Figure 2, when the process parameters changed, the weld penetration changed accordingly. Generally, as the laser power increased and the welding speed decreased, the weld penetration had a certain degree increase. In addition, increasing the wire feed speed also led to an increase in penetration.
The microstructure of the aluminum–lithium alloys is shown in Figure 3a. The joint can be divided into three parts: the weld, the heat-affected zone and the base metal. There was a heat-affected zone between the base metal and the weld. In the boundary, the weld can be divided into the equiaxed crystal zone (EQZ), columnar crystal zone (CZ) and fine crystal zone (CDZ). In the process of laser welding aluminum–lithium alloys, under the effect of a welding thermal cycle, there was a temperature gradient in the weld and the heating effect of each part of the welding seam was different, which resulted in large differences in its internal structure distribution and mechanical properties. Liu et al. [21] found that as the welding heat input decreases, the grain size of the equiaxed crystal tends to decrease. From Figure 3a, it can be observed that the fine equiaxed regions at the upper fusion line were enriched in the middle and narrow on both sides, while the distribution of the fine equiaxed regions near the lower fusion line was just the opposite. At the same time, the heat-affected zone between the weld and the base metal was heated to close to the melting point during welding and then rapidly cooled down, which caused a small number of coarse grains on the side of the base material near the fusion line. It was speculated that this was due to the difference in thermal conductivity between the base material and the weld that led to a difference in the grain size at the edge of the weld. In addition, as shown in Figure 3b, there was a Y-shaped EQZ branch near the middle and lower part of the lower fusion line, which was caused by strong convection in the molten pool. There were a large number of low-melting eutectic phases in the EQZ region, which are easy to initiate cracks. Regarding the reason for the formation of this region, it is difficult to detect the presence of Li element using the existing detection methods and the formation mechanism of this region has not yet formed a mature theory. Most researchers tend to believe that it is caused by the difference in temperature conditions between the internal areas of the weld and the strong concurrence in the molten pool. Marangoni convection and buoyancy convection were the main driving forces for the flow in the molten pool [22]. The partial melting zone near the fusion line was the main area where the mechanical performance test may have failed except for the defects. In order to further determine the element composition in the EQZ and other regions, the EDS analysis of the weld boundary is shown in Figure 4. The specific locations of the EDS points at the weld are shown in point 1 and point 2 in Figure 3a. Except for a small amount of zirconium and silicon, the second phase particles did not appear near the interface. A large amount of copper and a small amount of silicon was detected at the border near the center. These precipitates appear bright white in SEM, which is different from the grain. At the same time, it can be observed that the Al element decreased from the bottom of the weld center to the top. This is because the temperature in the upper area of the weld was higher than the bottom and the duration was longer. The Al element burned seriously and caused the content to decrease. On the other hand, the Si element increased slightly, which was caused by the Si element in the filler wire entering the weld.

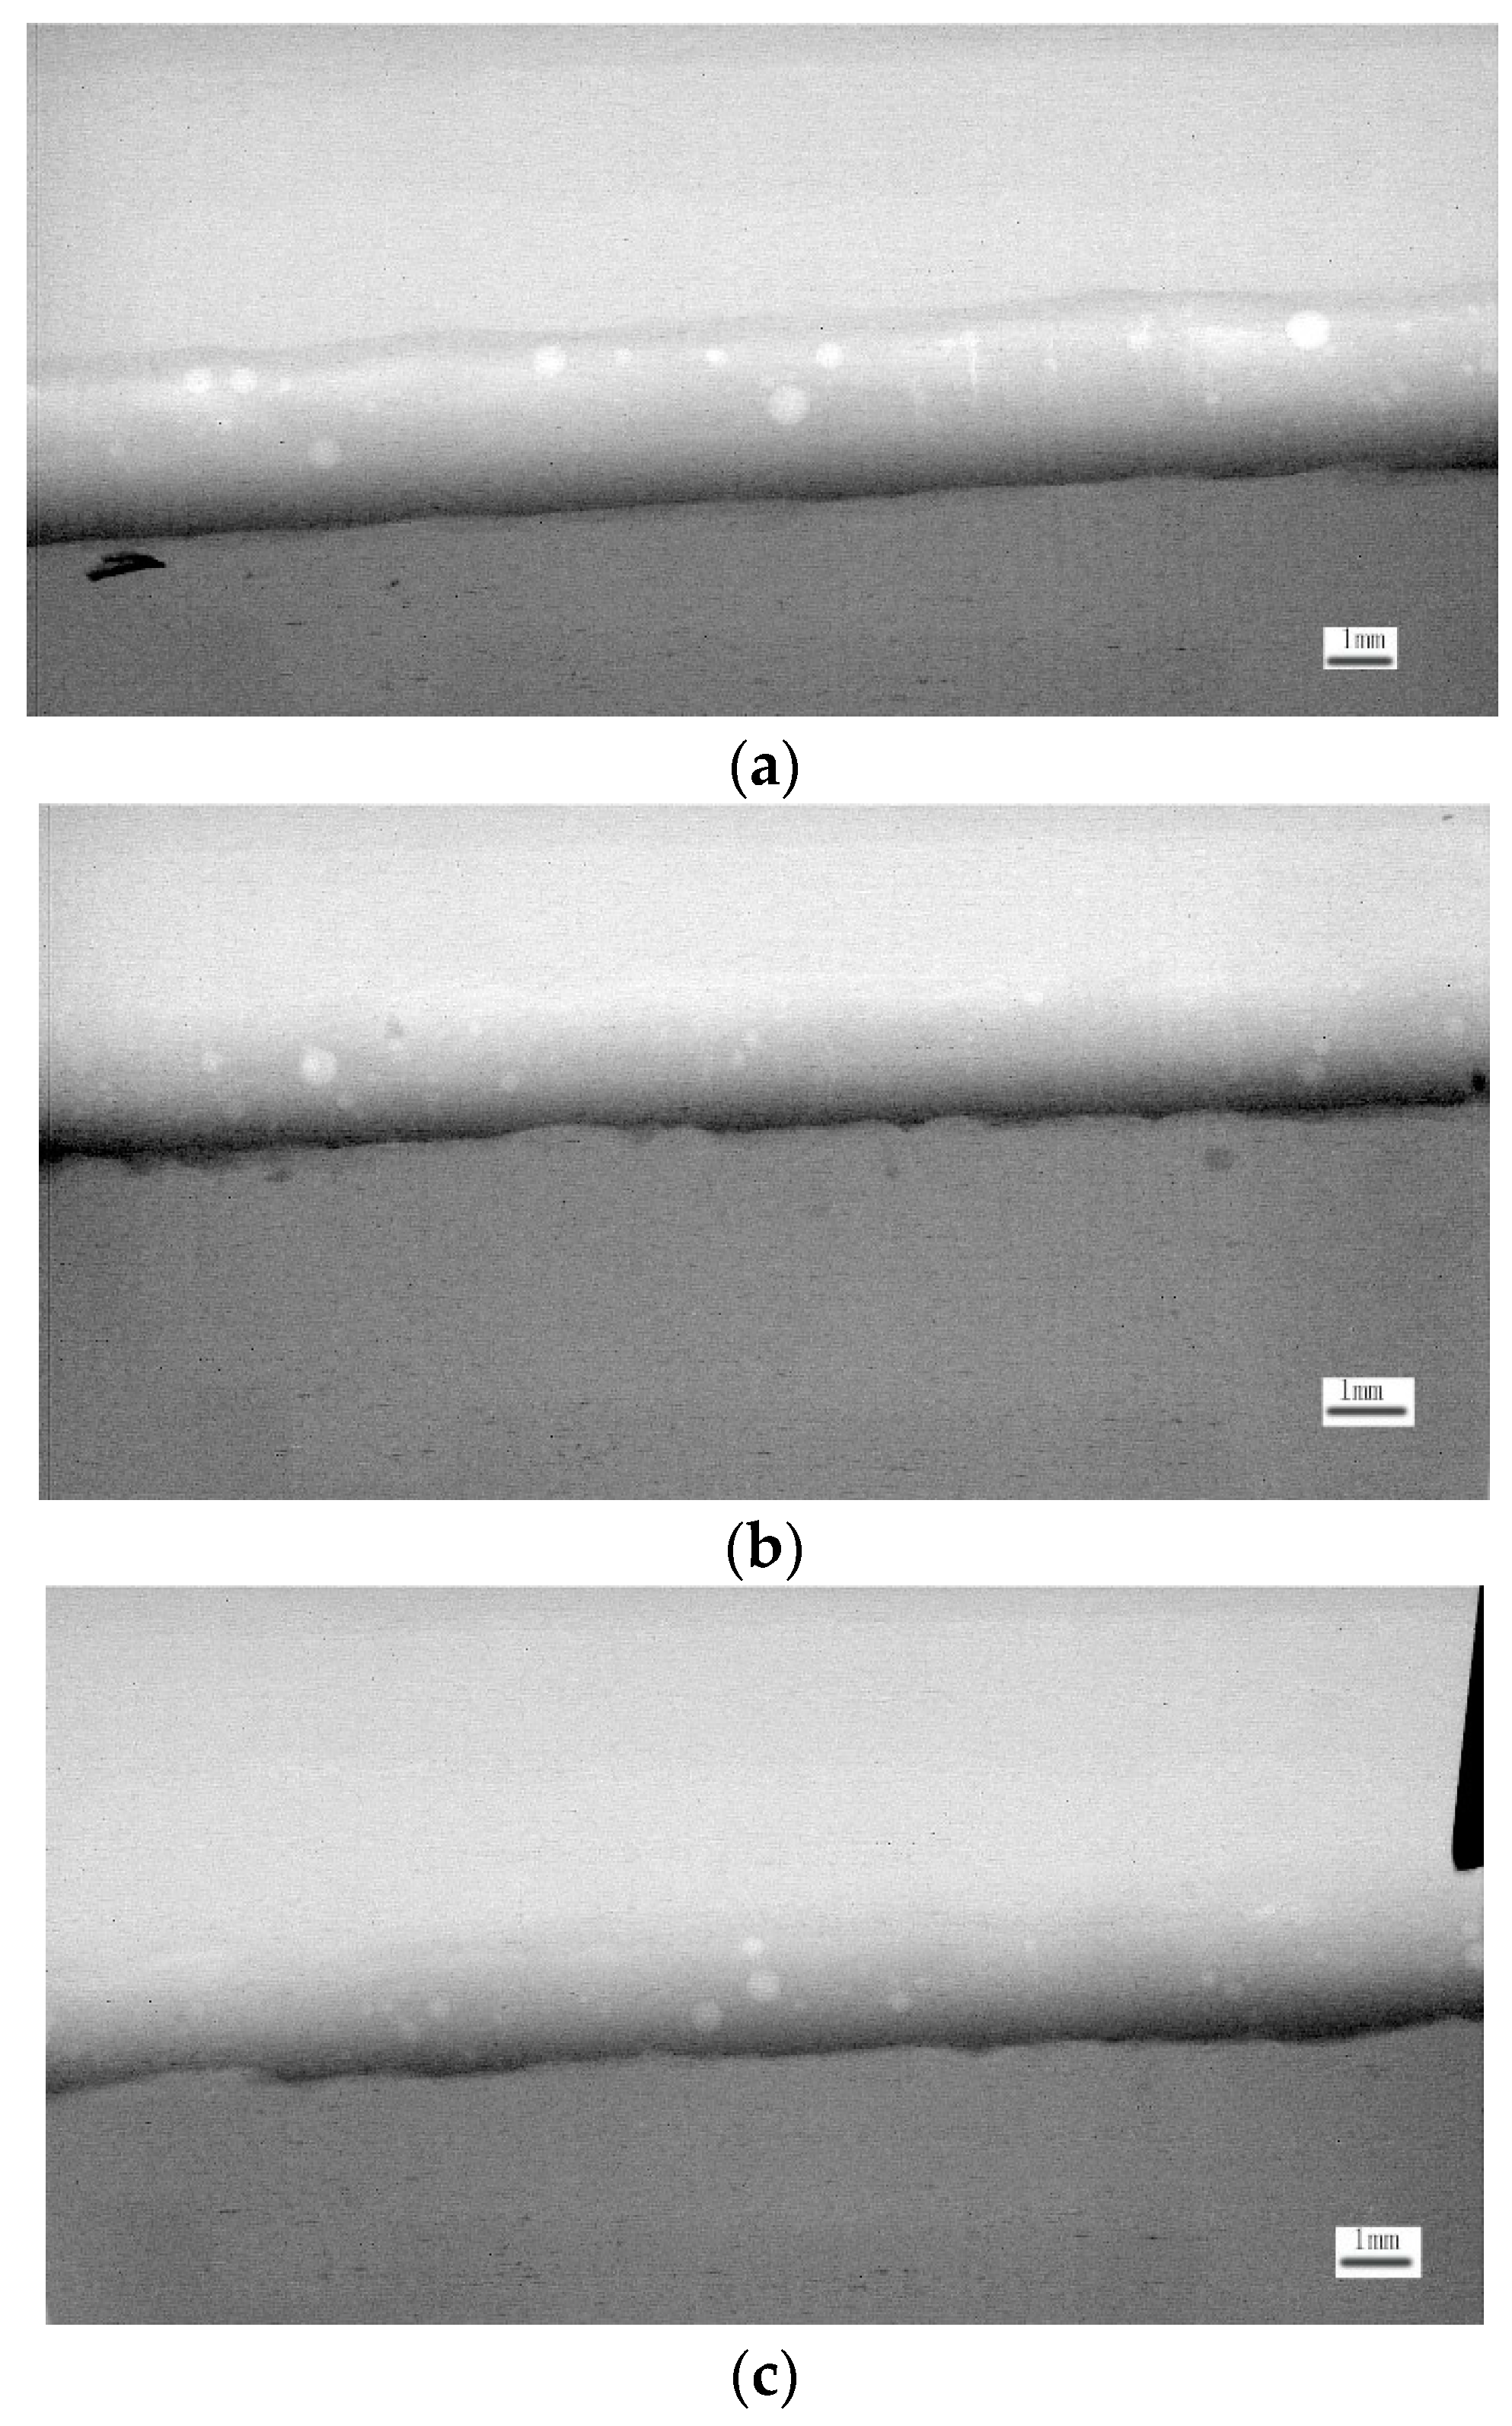
3.2. Non-Destructive Testing

In order to study the influence of the pore defects in the weld on the structure and performance of the weld, X-rays were used to conduct non-destructive testing on the weld at the joint of the skin and the stringer. Under the condition of ensuring stable welding control, we used the set parameters for a 1 meter weld. We selected a 12 mm long section from the middle of the weld to test its porosity by X-ray and then use image processing software to estimate its porosity. The radiographic angle is shown in Figure 1. The X-ray non-destructive testing weld ray diagram is shown in Figure 5 and the specific data of the detected pore defects are shown in Table 3. Compared to the pore data of the three groups of samples, it was found that the porosity, maximum pore diameter and maximum pore area of the first group of samples were much higher than those of the other two groups. In the laser welding of aluminum–lithium alloys, due to insufficient cleaning measures on the surface of the weldment before welding, the moisture in the welding zone was heated to desorb hydrogen, which was the direct cause of metallurgical pores in the weld. In order to avoid the occurrence of such pores, the weldment should be cleaned before welding to remove the oil and oxides on the surface of the weldment. At the same time, we used inert gas to strengthen the protection of the molten pool during the welding process and prevent hydrogen in the air from entering the molten pool. On the other hand, this experiment was aimed at the dual laser beam welding of the skin beam structure. In order to ensure the integrity of the back skin surface, it was a requirement that the back surface could not be welded through, which resulted in the generation of process pores due to the changes in process parameters. Based on this, in this article we only discuss the influence of process parameters on porosity and analyze its reasons. In this experiment, when the welding speed was increased from 0.12 to 0.17 m/s, the pores increased significantly according to Table 3. Bharath Bandi [23] pointed out that the porosity of the weld will increase significantly with the increase of the welding speed. Xie et al. [24] also confirmed that the shape and dynamic characteristics of the small hole are highly dependent on the welding speed during the laser welding process.
Moreover, under the same welding speed (0.12 m/s) of sample 2 and sample 3, the porosity increased with the decrease of laser power. It can be concluded that the heat input had influences on the number and size of pore defects. When the heat input of the weld increased from 19.41 to 23.33 kJ/m, the porosity reduced from 5.35% to 2.08% and the maximum pore diameter, as well as the maximum area, reduced accordingly, which showed that there was an approximate inverse relationship between the weld heat input and the porosity. This was due to the fact that when the heat input was small, the solidification time of the molten pool was short and the bubbles could not escape from the molten pool. At that moment, there were pores in the solidification of the molten pool. When the heat input increased, the solidification time of the molten pool increased. With enough time to escape, the number and size of stomata will also decrease [25]. Zhan et al. [26] proved through experiments that higher heat input will reduce the solidification rate causing bubbles to escape from the molten pool before solidification, thereby reducing porosity.

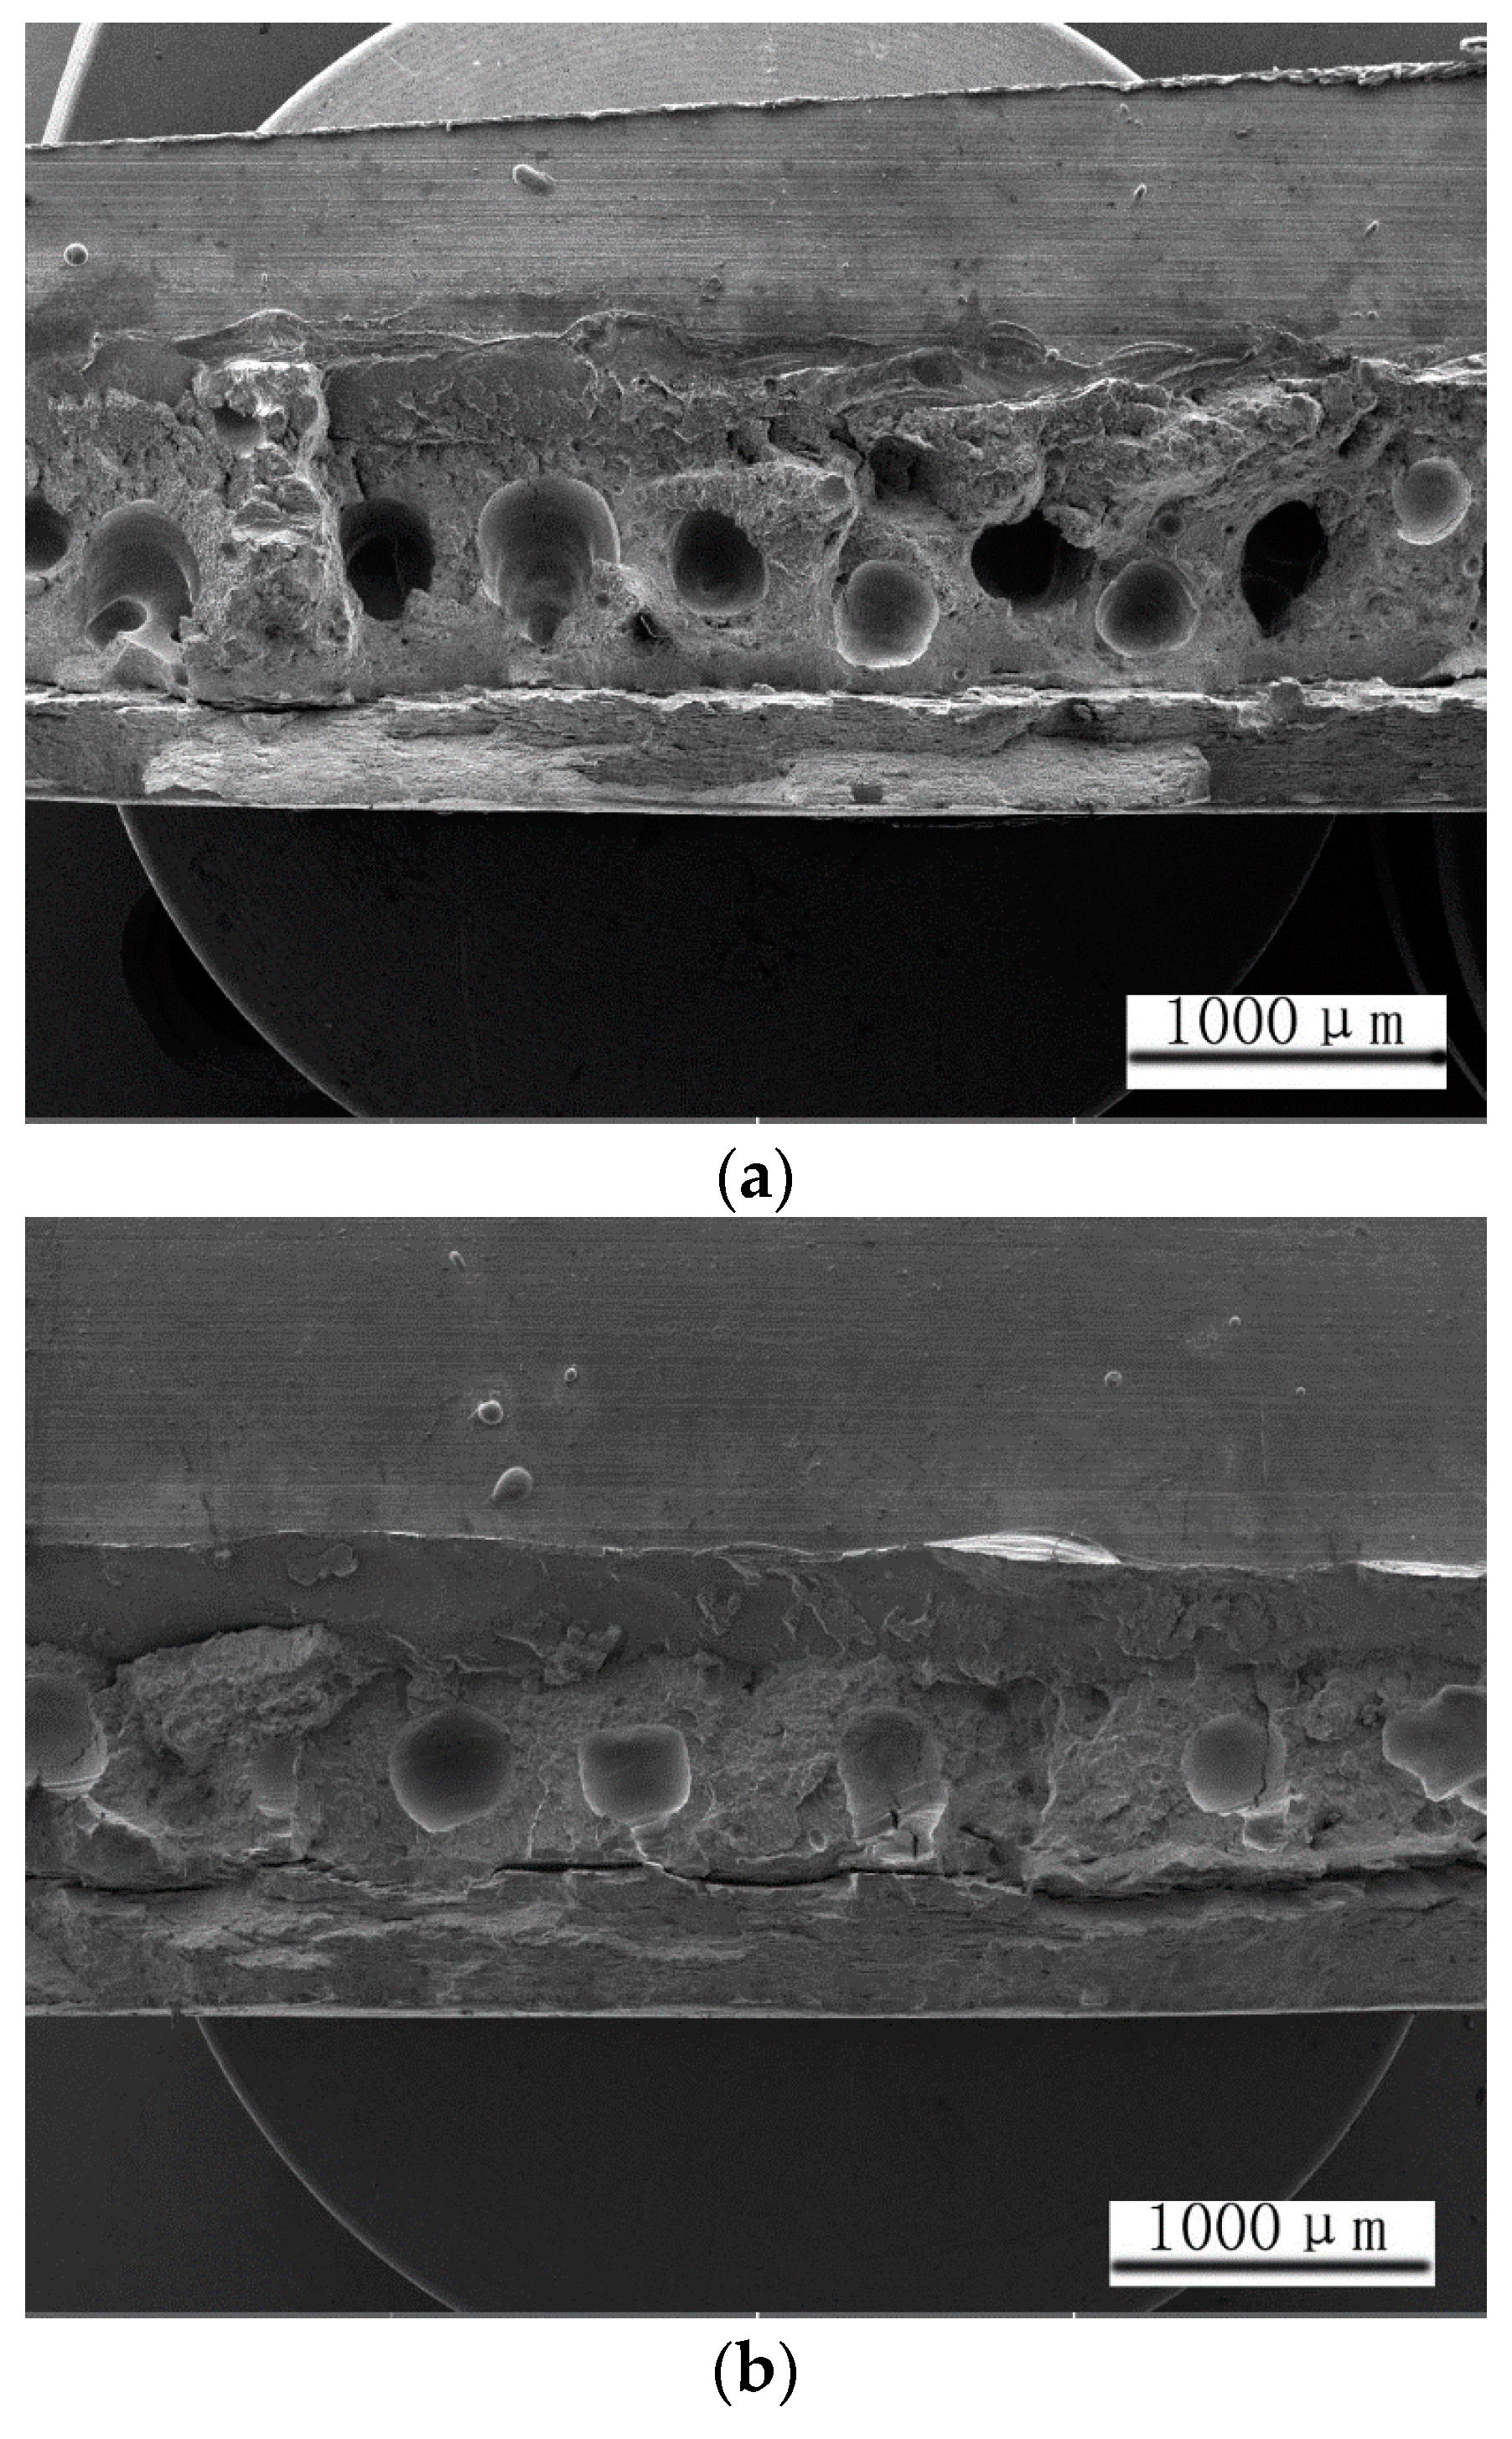
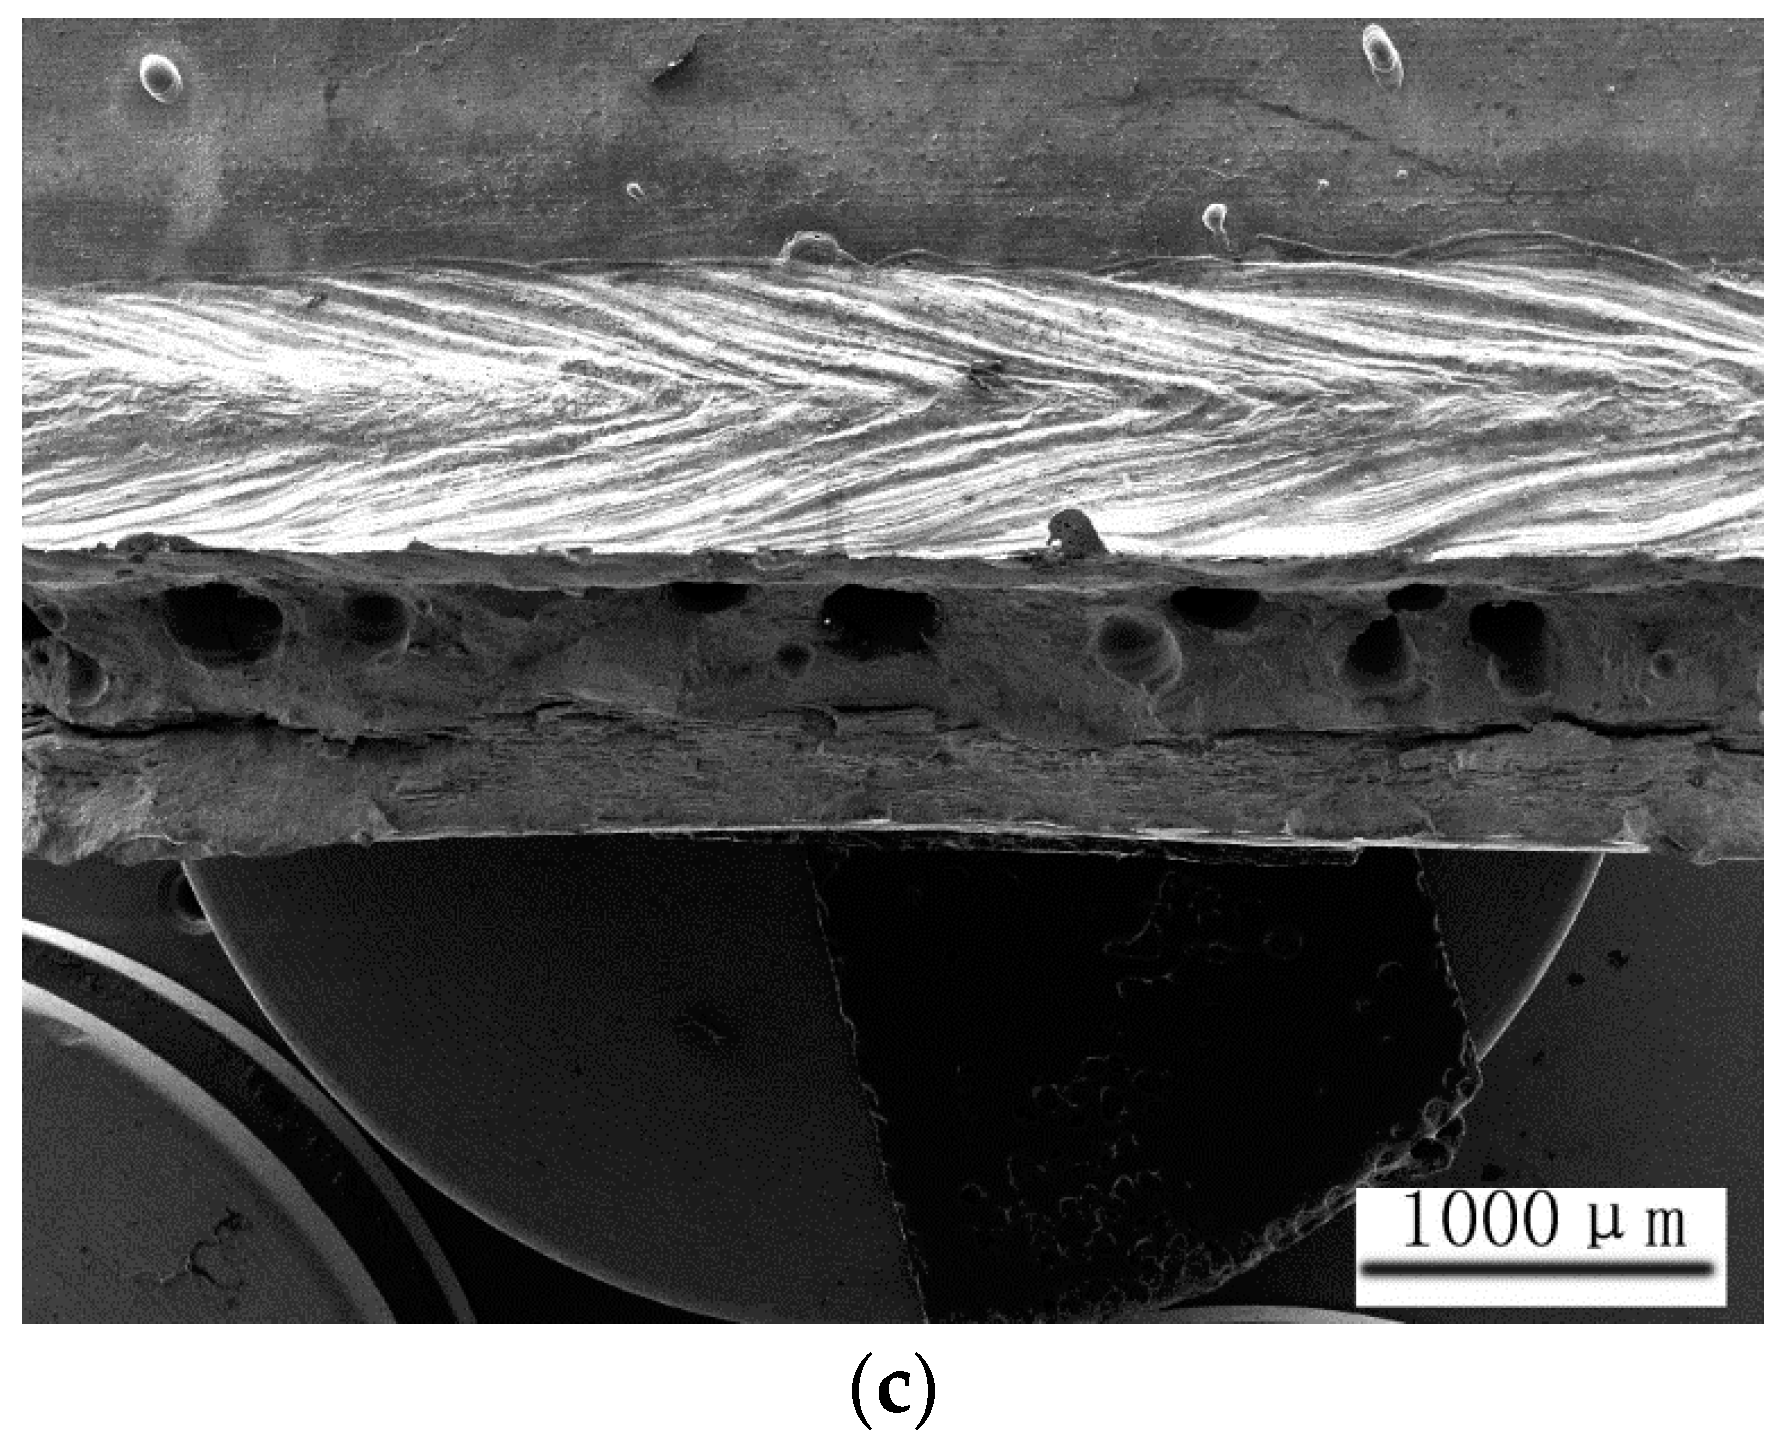
3.3. Tensile Property and Fracture Analysis

In the transverse tensile test, the test data of the three groups of samples and their respective penetration ratio data are shown in Table 4. The experiment found that the amount of weld heat input had a tremendous influence on the weld penetration value of the laser beam when welding aluminum–lithium alloys. When the weld heat input increased from 20.00 to 23.33 kJ/m, the weld penetration ratio increased from 51.8% to 62.6%. This was due to, along with the heat input increasing, the solidification time of the molten pool increasing and the weld absorbing more energy, resulting in a corresponding increase in its penetration. The difference in the heat input of the weld will cause a significant difference in the penetration of the joint. For sample 1, although weld heat input was lower, the weld penetration was the maximal. We speculate that the higher laser power makes the weld absorb more laser energy and also causes the penetration of the joint to increase. This is because the weld penetration depth of aluminum alloy depends on the magnesium content in the alloy and the missing amount of magnesium in the molten pool. When the laser power increased, the evaporation of magnesium increased, which in turn increased the effective laser absorption coefficient to make the weld penetration deeper [27]. In the experiment, it was found that the weld heat input and laser power have effects on penetration, but the specific effects of the two are not compared. According to sample 1, when the laser power was increased, the penetration value greatly improved. For sample 2 and sample 3, the welding speed of the two was the same. The increase in heat input caused by increasing the laser power also increased the weld penetration. Based on the above phenomenon, we put forward a reasonable guess that laser power is the main factor affecting weld penetration.
It also can be found by observing Table 4 that the weld penetration affects the transverse tensile strength of the weld. When the penetration ratio increased from 51.8% to 91.4%, the average strength of the tensile test workpiece decreased from 353.30 to 250.66 MPa. The relationship between the transverse tensile strength and the penetration depth of the skin was inversely proportional. Generally, as the penetration depth increases, the transverse tensile strength tends to decrease. Zhang et al. [28] pointed out that under the condition of consistent other geometric parameters, within a certain range, as the weld penetration is deeper, the tensile strength of the joint is lower. The more concentrated the stress at the weld toe, the easier it is to crack the joint. The influence of weld penetration on the transverse tensile strength can be analyzed from two aspects: First, when the weld penetration is too large, it is easy to cause the fusion area between the skin and the stringer to decrease or even fail to be fused. In the process, defects such as pores, slag inclusions and cracks are easily formed in the welding seam. Second, the crystal lattice of a metal will change when it is at a high temperature. In the process of cooling, the first place to cool is where the particles are the thickest, which causes differences in the size of the grains in the weld, resulting in a decrease in the transverse tensile strength of the joint.
In order to analyze the effect of pore defects on the tensile properties, the macroscopic morphologies of the three groups of samples were photographed with a scanning electron microscope as shown in Figure 6. It can be clearly seen from the figure that the fractures of the three groups of test pieces in the transverse tensile experiment all have pore defects. It can be observed from the fracture section that the fracture passes through the inside of the weld. There is no obvious rule for the effect of pore defects on the tensile strength of the joint. Sample 2 that has the biggest strength of 353.3 MPa in the tensile test but the fracture shows more porosity defects (Figure 6b) than sample 3 (Figure 6c).

3.4. Fatigue Property and Data Analysis

According to the test standard of ASTM E466-15 [29], under the conditions of frequency 15 HZ, stress ratio 0.06 and the maximum test load 75 MPa, the fatigue property test data of the three sets of samples are shown in Table 5.
According to the standard of HB7110-94 [30] “Metal Material Details Fatigue Rated Strength Cutoff Value (DFR cutoff) Test Method”, the fatigue property data of aluminum–lithium alloys was processed. The detailed fatigue strength rating (DFR) was used to measure the quality of the structure and the ability to withstand repeated loads [30,31]. In the data processing, two data were eliminated. One was the fatigue cycles of 1,000,000 in sample 2 because no fracture occurred during the test. Another was the fatigue cycles of 4363 in sample 1 because of an abnormal fracture compared to other samples. The specific calculation process is shown as follows:
<1> Calculate the characteristic life β of each group of test data according to Weibull distribution:
β = [ i = 1 n N i α ] 1 / α
In this formula: 2060 aluminum–lithium alloys α = 4;
<2> Find the life with reliability R = 95% and confidence C = 95%:
N 95 / 95 = β S T S R S C
In this formula: sample coefficient ST = 1; reliability coefficient aluminum alloy SR = 2.1; confidence degree coefficient SC = 1.12 when confidence degree C = 95%.
<3> Single-point method to find the cut-off value of the fatigue rated strength of details:
D F R = 0.94 σ mo 0.94 σ mo σ max S ( 5 lgN ) ( 047 S ( 5 lgN ) 0.53 ) ( 0.0282 S ( 5 lgN ) + 0.0318 )
In this formula: S = 2, σmo = 310 MPa, and N is N95/95.
The fatigue test data analysis results are shown in Table 6.
Through the calculation of the DFR value, it can be seen that the fatigue strength of the three groups of samples have a certain difference. From analysis of the fracture location, the second and third groups of fractures were mainly located at the base material of the weld toe and the number of fatigue life was higher. While the first group of fractures were mainly located inside the weld and the number of fatigue life was lower. Although the fracture positions of sample 2 and sample 3 were almost the same, the number of fatigue life and DFR value of sample 3 in the fatigue experiment was significantly higher than that of sample 2, indicating that the fatigue property of sample 3 was higher than that of sample 2.
In this paper, X-ray detection of the porosity of the base metal and the calculated DFR value confirmed that the existence of pore defects affected the fatigue strength of laser beam welding aluminum–lithium alloys. When the porosity decreased from 5.35% to 2.08%, the DFR value increased from 86.3 to 99.4 MPa. Indicating that the DFR and porosity were approximately in an inverse relationship. Ke et al. [32] pointed out that the existence of poles reduces the effective welding cross-sectional area, thereby affecting the strength and plasticity of the joint. In addition, the porosity may lead to stress concentration in the fusion zone, consequently reducing the mechanical properties of the joint. Generally, the larger the size of the pores, the easier it is to cause stress concentration and the existence of small holes will become a potential source of cracks. Under the action of cyclic loading, the existing micro-cracks in the weld will continue to grow until the micro-cracks pass through the grain boundary, connecting with the micro-cracks in the adjacent grains or expanding into the adjacent grains and finally forming a macroscopic view of scale fatigue cracks and breaks. The existence of small holes accelerates the growth rate of fatigue cracks, which also explains that the higher the porosity, the lower the corresponding DFR value.

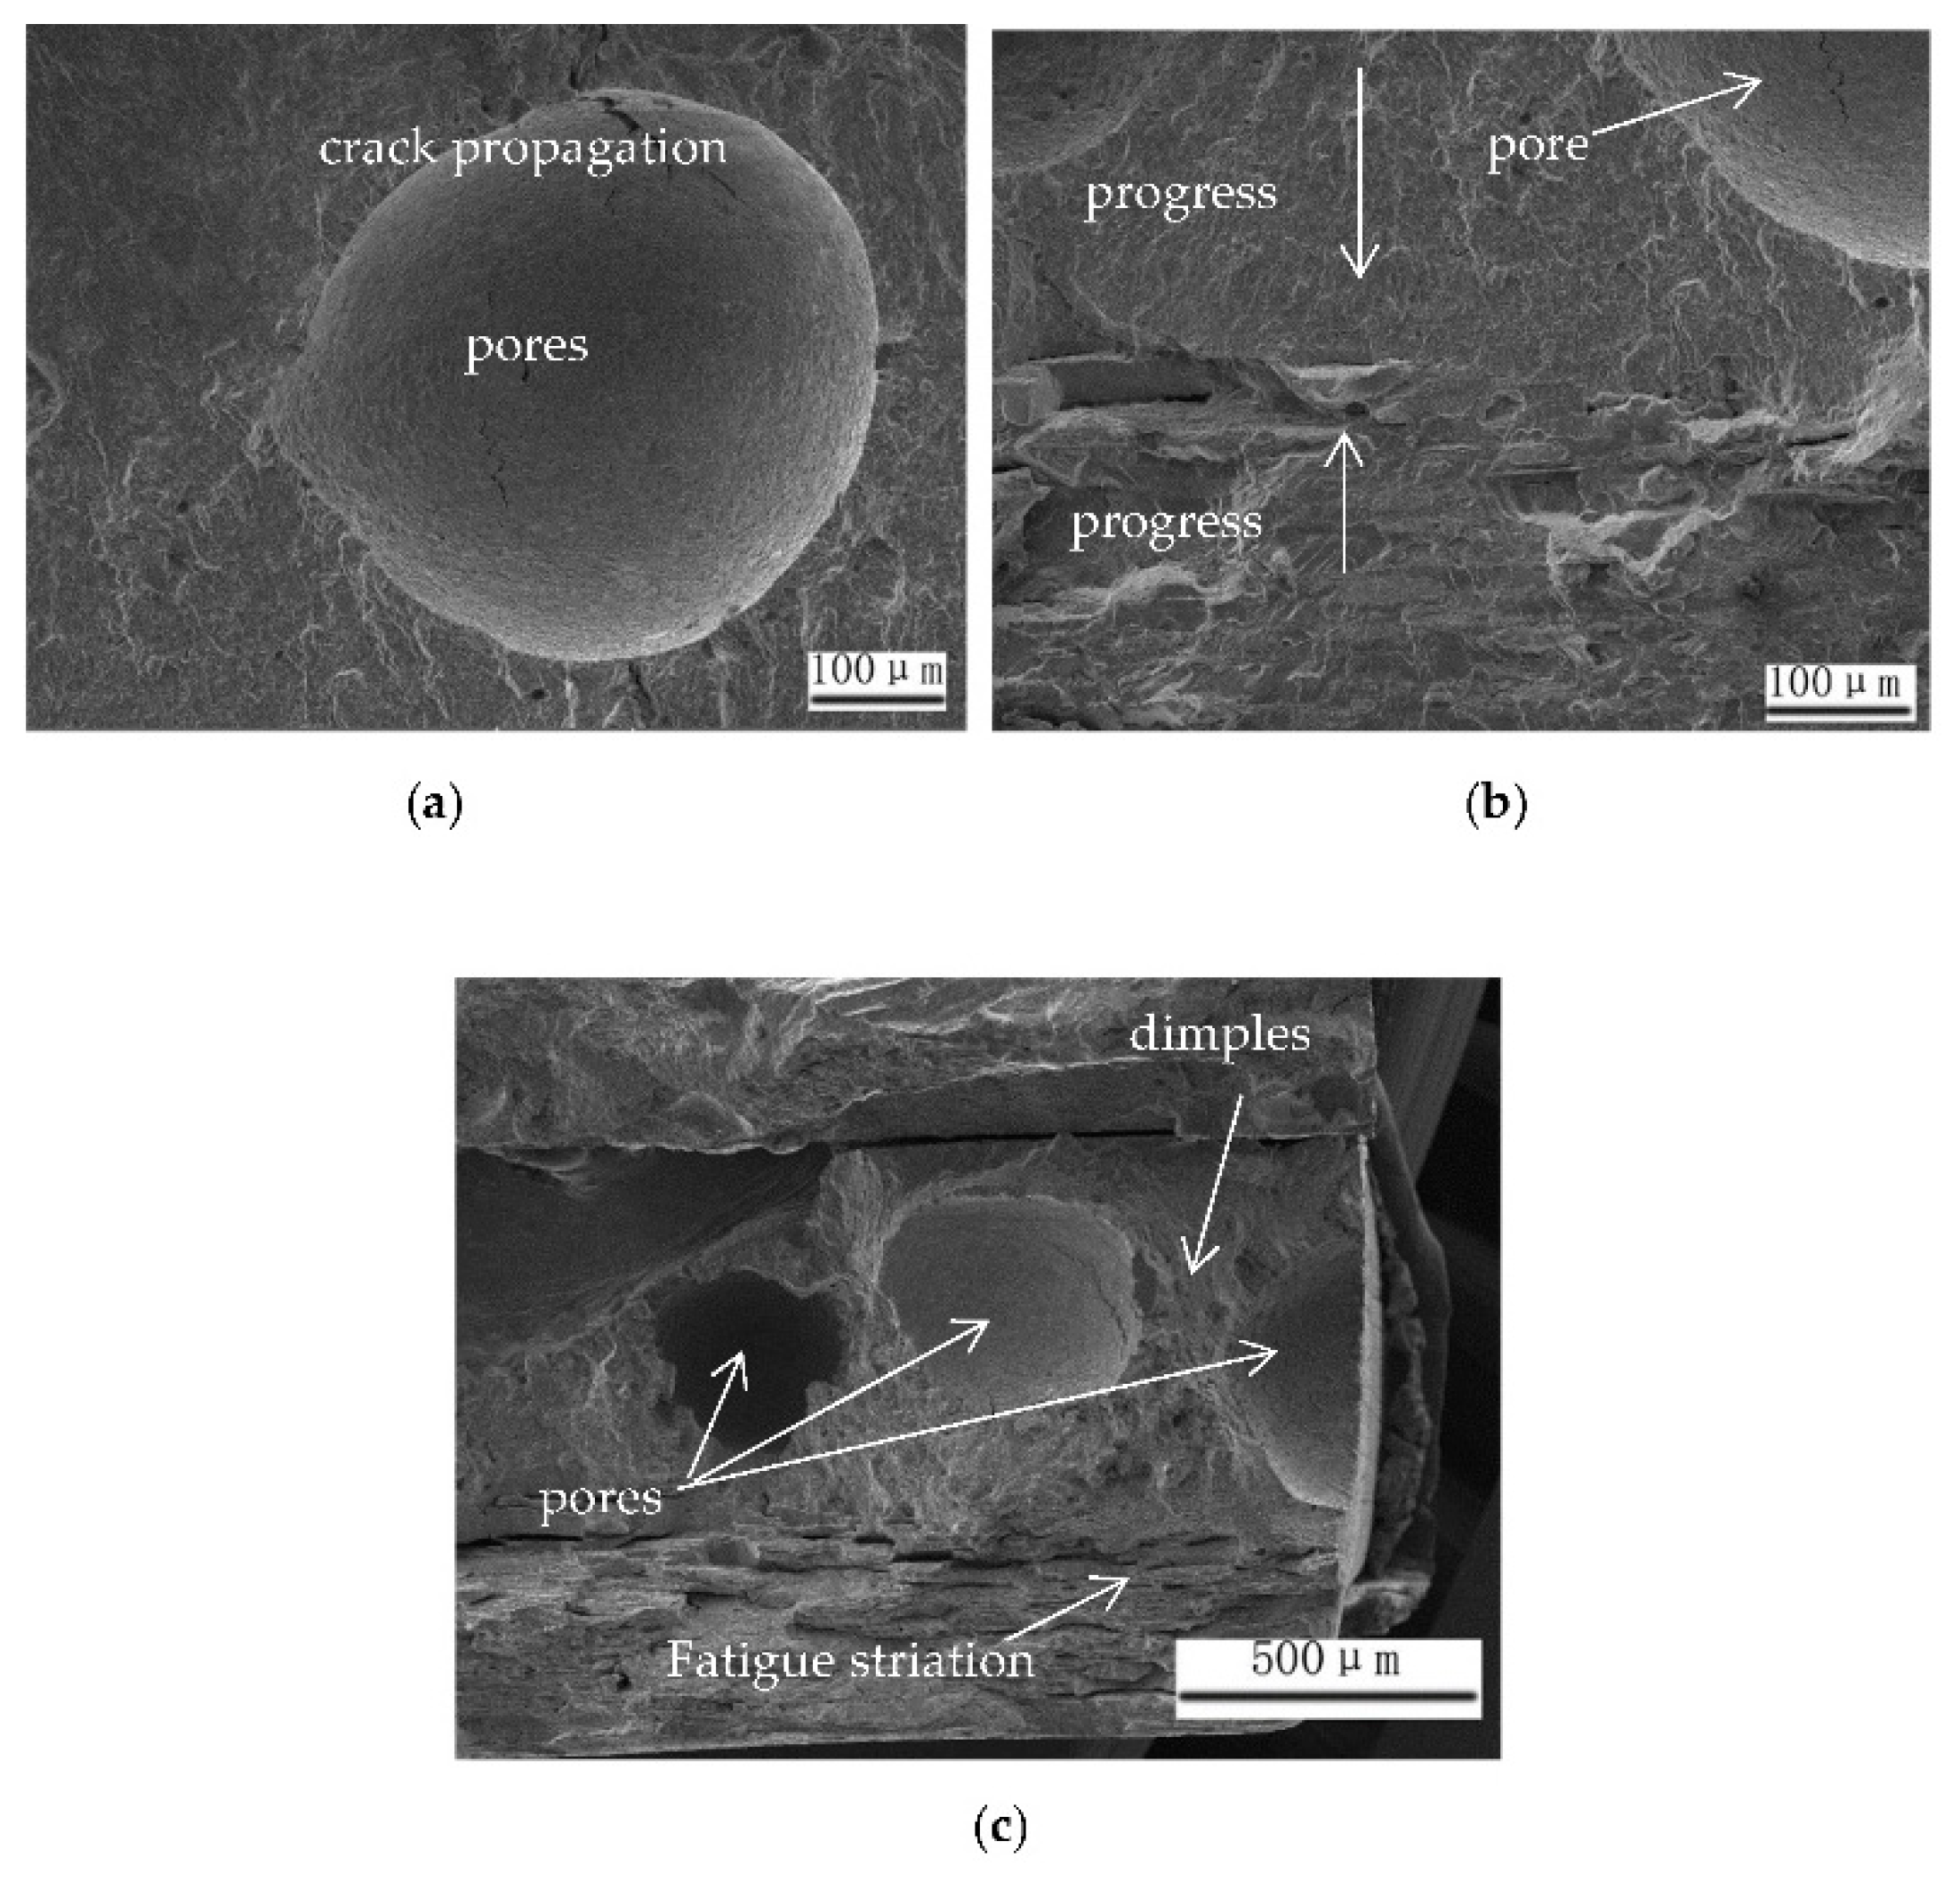
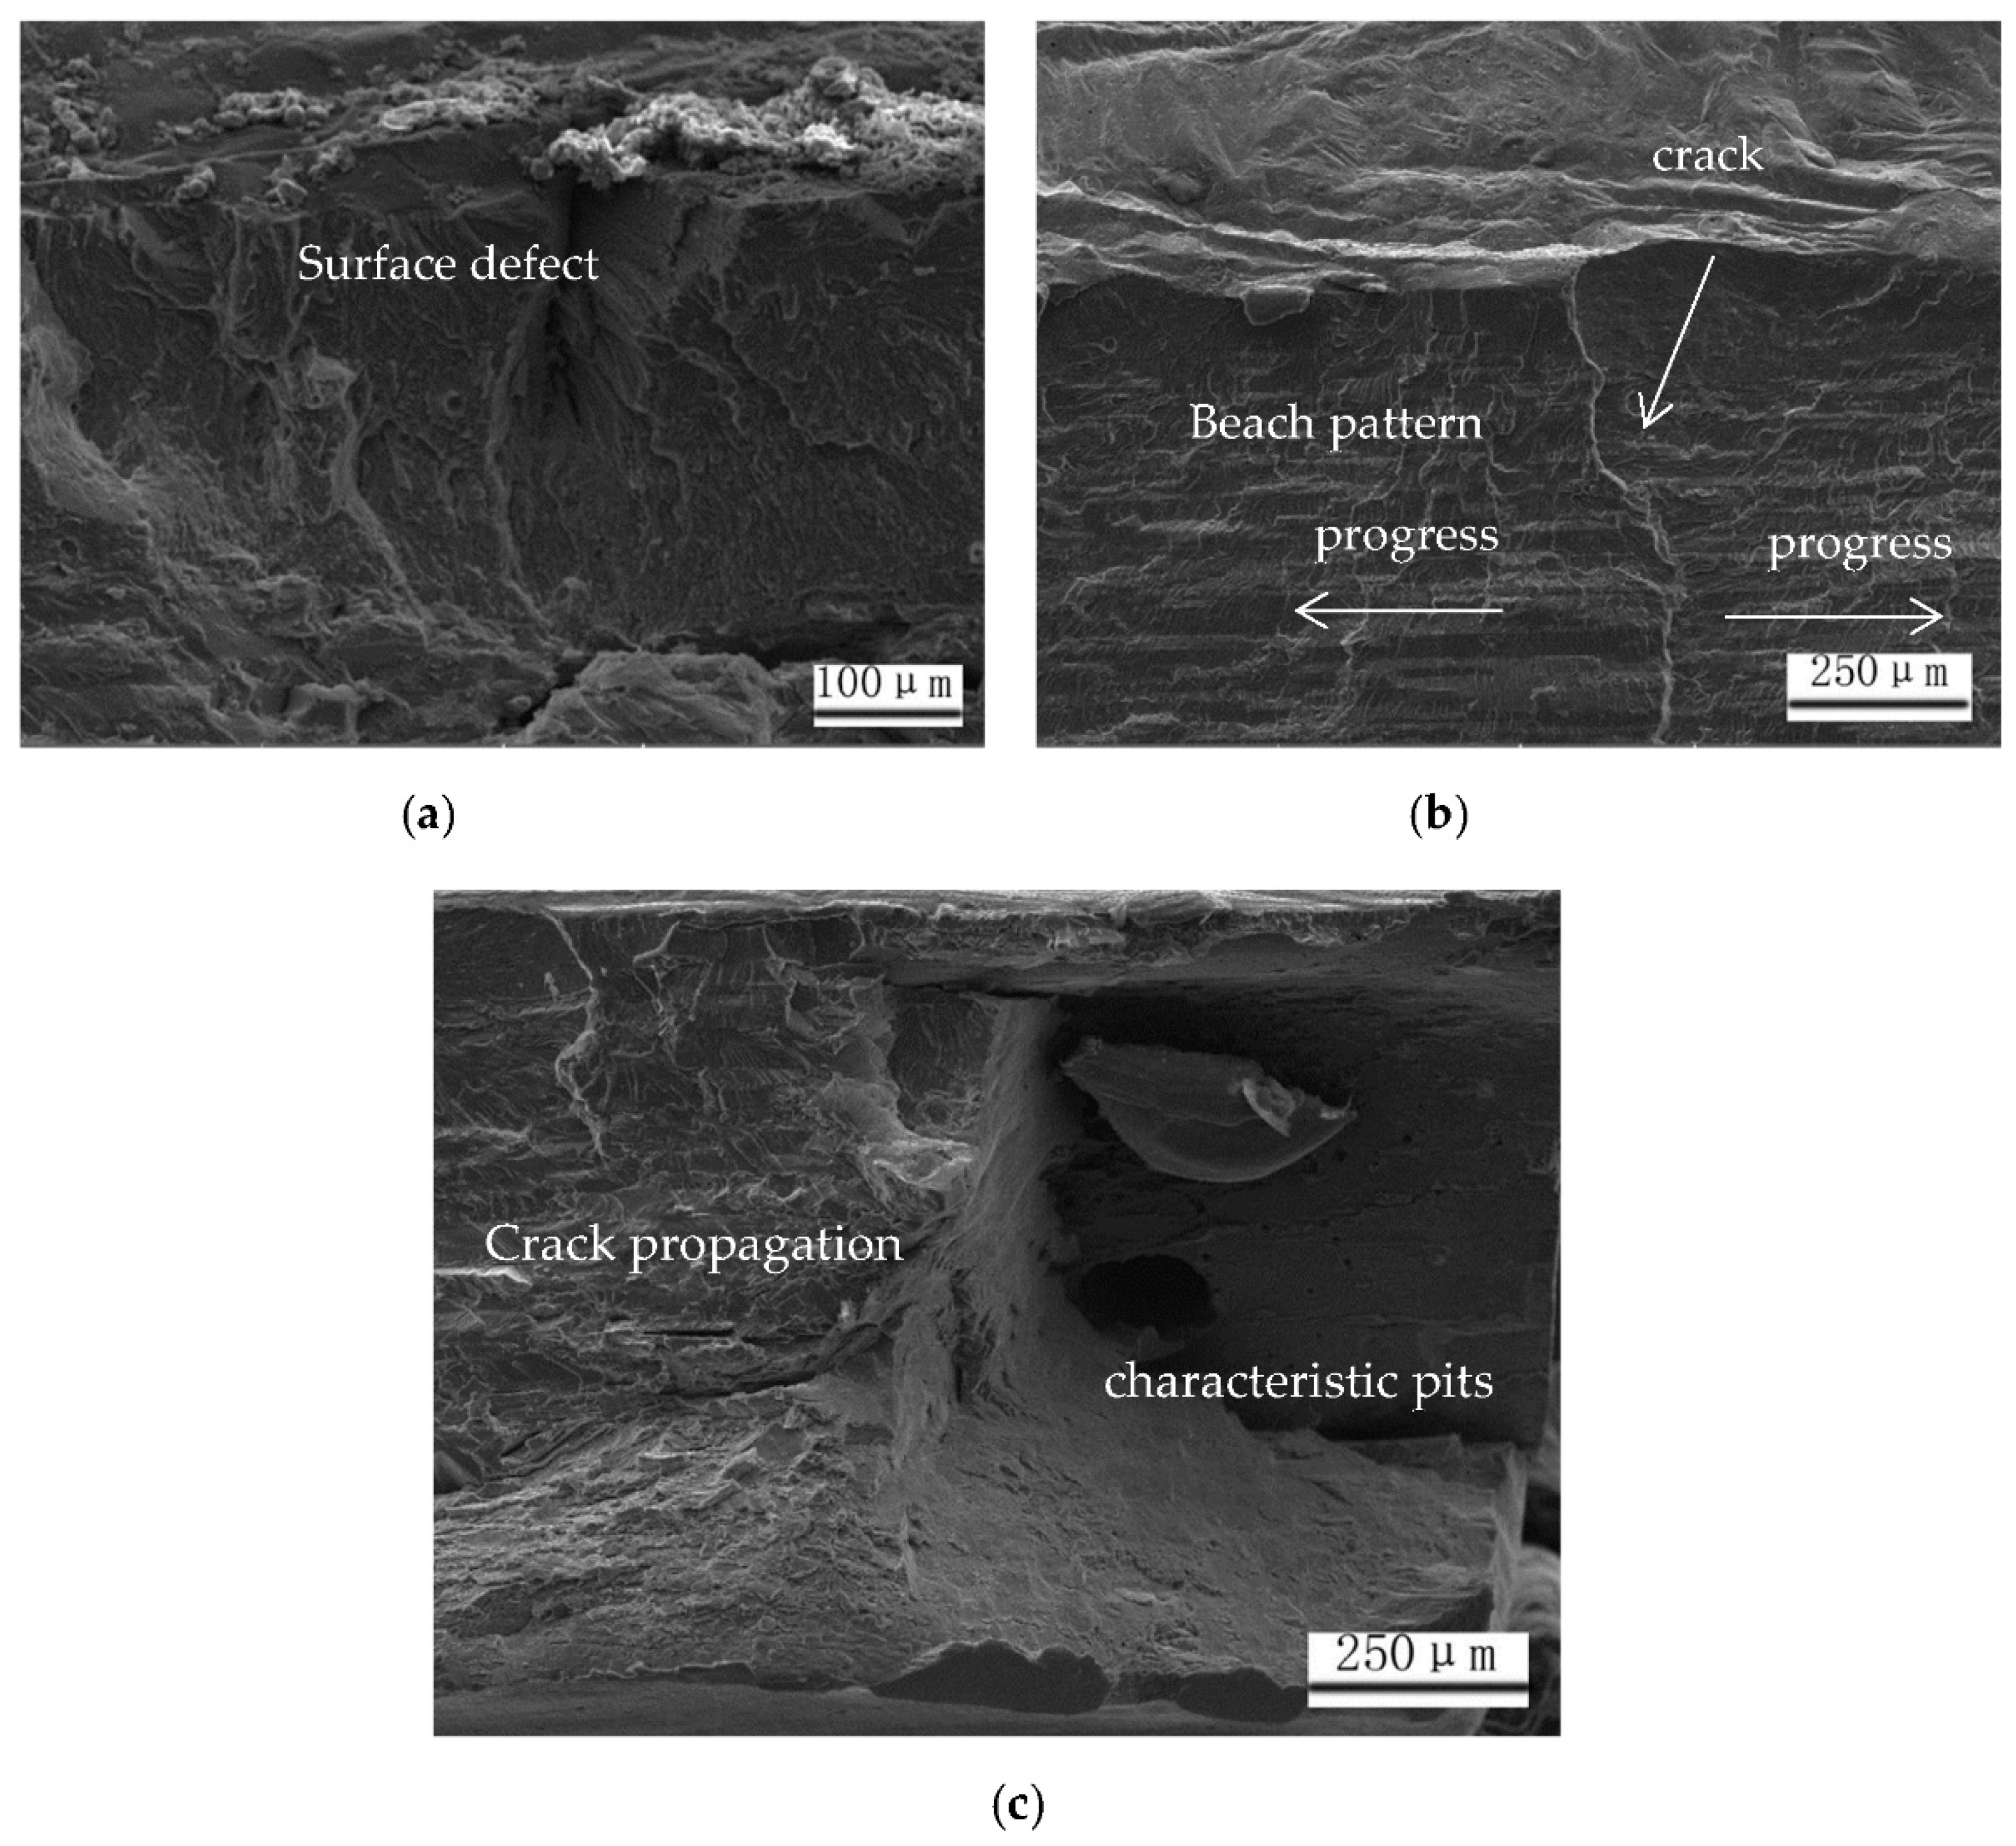
3.5. Fatigue Fracture and Failure Analysis

The fatigue fracture morphology and crack initiation locations were observed in order to determine the typical morphological features of the crack initiation zone, crack propagation zone and final fracture zone. Three sets of samples test data with poor performance are shown in Figure 7, Figure 8 and Figure 9.
As shown in Figure 7, due to pores being the main mode induced welding stress concentrates, fatigue cracks are likely to occur there [18]. Initial cracks play an important role in the initiation of fatigue cracks. The fewer the initial cracks, the longer the fatigue life [33]. There was radial crack growth around the pores in the crack initiation zone. This was because the fatigue cycle time in this area was longer. Under the action of alternating tensile and compressive stresses, the cracks repeatedly opened and closed causing the surface of the cracks to be slightly rubbed and squeezed. Obvious fatigue steps can be observed in the crack propagation zone. This was due to the forward expansion of the two fatigue sources. The farther away the crack propagation zone was from the fatigue source, the wider the fatigue slip step and the clearer the fatigue band. This is because the farther it was from the fatigue source, the faster the crack growth rate. At the junction of the fatigue expansion zone and the instantaneous failure zone, the fracture was rougher and there was a fatigue arc. The final fracture zone had pore defects and dimples, fatigue lines similar to brittle fractures could be observed in the middle and lower regions of the weld. The fatigue growth rate in the weld was faster than that of the base material. The weld fractures from the inside of the weld and the fatigue strength of the sample were greatly reduced due to the existence of pore defects.
In Figure 8 and Figure 9, the weld has cross-sectional changes at the transition from the weld to the base metal resulting in the most serious stress concentration at the weld toe as a source of fatigue. The crack propagation zone was along the base material of the skin, showing a typical beach pattern with arc-shaped stripes advancing from the crack source to the surroundings, which were perpendicular to the propagation direction of the fatigue crack and were finally, instantaneously broken at the lower fusion line. The final fracture zone was composed of the characteristic pits. The starting position of the fatigue fracture was a mixed fracture characteristic of ductile fracture and brittle fracture. The final fracture of the base metal presented the characteristic of a brittle fracture. The ductile fracture at the initial position of the fatigue fracture was mainly due to the macroscopic plastic deformation and ductile fracture at the micro-cracks during the fatigue experiment. The inner surface of the pits in the final fracture zone was rough and distributed in a ravine shape. The surface near the base metal was relatively flat. Both sample 2 and sample 3 had higher fatigue cycles. The difference between the two was that the fracture surface of the final fracture zone of sample 3 was smoother, the pore defects were relatively dispersed and the porosity was smaller. The fatigue life of sample 3 was relatively higher than that of sample 2.
Further analysis of the fatigue failure mechanism is shown in Figure 10. When there were many internal defects in the weld, the source of the crack occurred at the pores of the weld. As Hobbacher [34] said, embedded volumes such as pores and inclusions are discontinuities and therefore considered to be competitive weld defects, which can provide alternative locations for fatigue crack initiation. The fatigue strength of such a workpiece was poor. The fracture form is shown in Figure 10b. The weld began to break from the crack defect and reached the edge of the weld along the largest hole. The path ran through the entire weld. The fatigue source of fracture failure was located at the surface of the weld, the microcracks are shown in Figure 10c. At the first stage of fatigue crack growth, the local stress field at the crack tip was relatively high due to the fatigue cycle load. As a result, dislocations continued to move producing dense slip bands at the crack tip. At the second stage of fatigue crack growth, with the increase in the number of loading cycles, the depth and width of the slip zone increased continuously and the fatigue microcrack was formed [35]. When the fatigue crack was formed, the crack gradually expanded after continuous cyclic loading and when the crack expanded to a critical size, the workpiece fractured. The weld penetration of this type of workpiece was larger than half of the thickness of the skin. The fracture form is shown in Figure 10d. The weld fractured along the fusion line to the maximum penetration depth and fractured at the skin base material in the opposite direction.

4. Conclusions

Through the experimental research on the analysis of microstructure, tensile property, fatigue property and fatigue fracture of laser beam welding aluminum–lithium alloys. The main conclusions were drawn as follows:
(1)
Due to the difference in thermal conductivity between the base material and the weld, the grain size at the edge of the weld was different. The strong convection in the molten pool caused a Y-shaped EQZ branch in the middle and lower part of the lower fusion line. The nearby partial melting zone was the main area where mechanical performance testing might fail except for defects.
(2)
The weld heat input influenced the number and size of the pore defects. When the weld heat input increased from 19.41 to 23.33 kJ/m, the porosity decreased from 5.35% to 2.08%. The heat input of the weld had an inverse relationship with the porosity.
(3)
The value of the transverse tensile strength and the penetration depth of the skin showed an inverse relationship. There was no obvious rule for the influence of pore defects on the tensile strength of joint.
(4)
The DFR value decreased with the increase of porosity and the relationship between the two was inversely proportional. When the porosity decreased from 5.35% to 2.08%, the DFR value increased from 86.3 to 99.4 MPa. The existence of pole defects reduced the fatigue life of the joint and the generation of pores should have reduced during the welding process to improve the fatigue life.
(5)
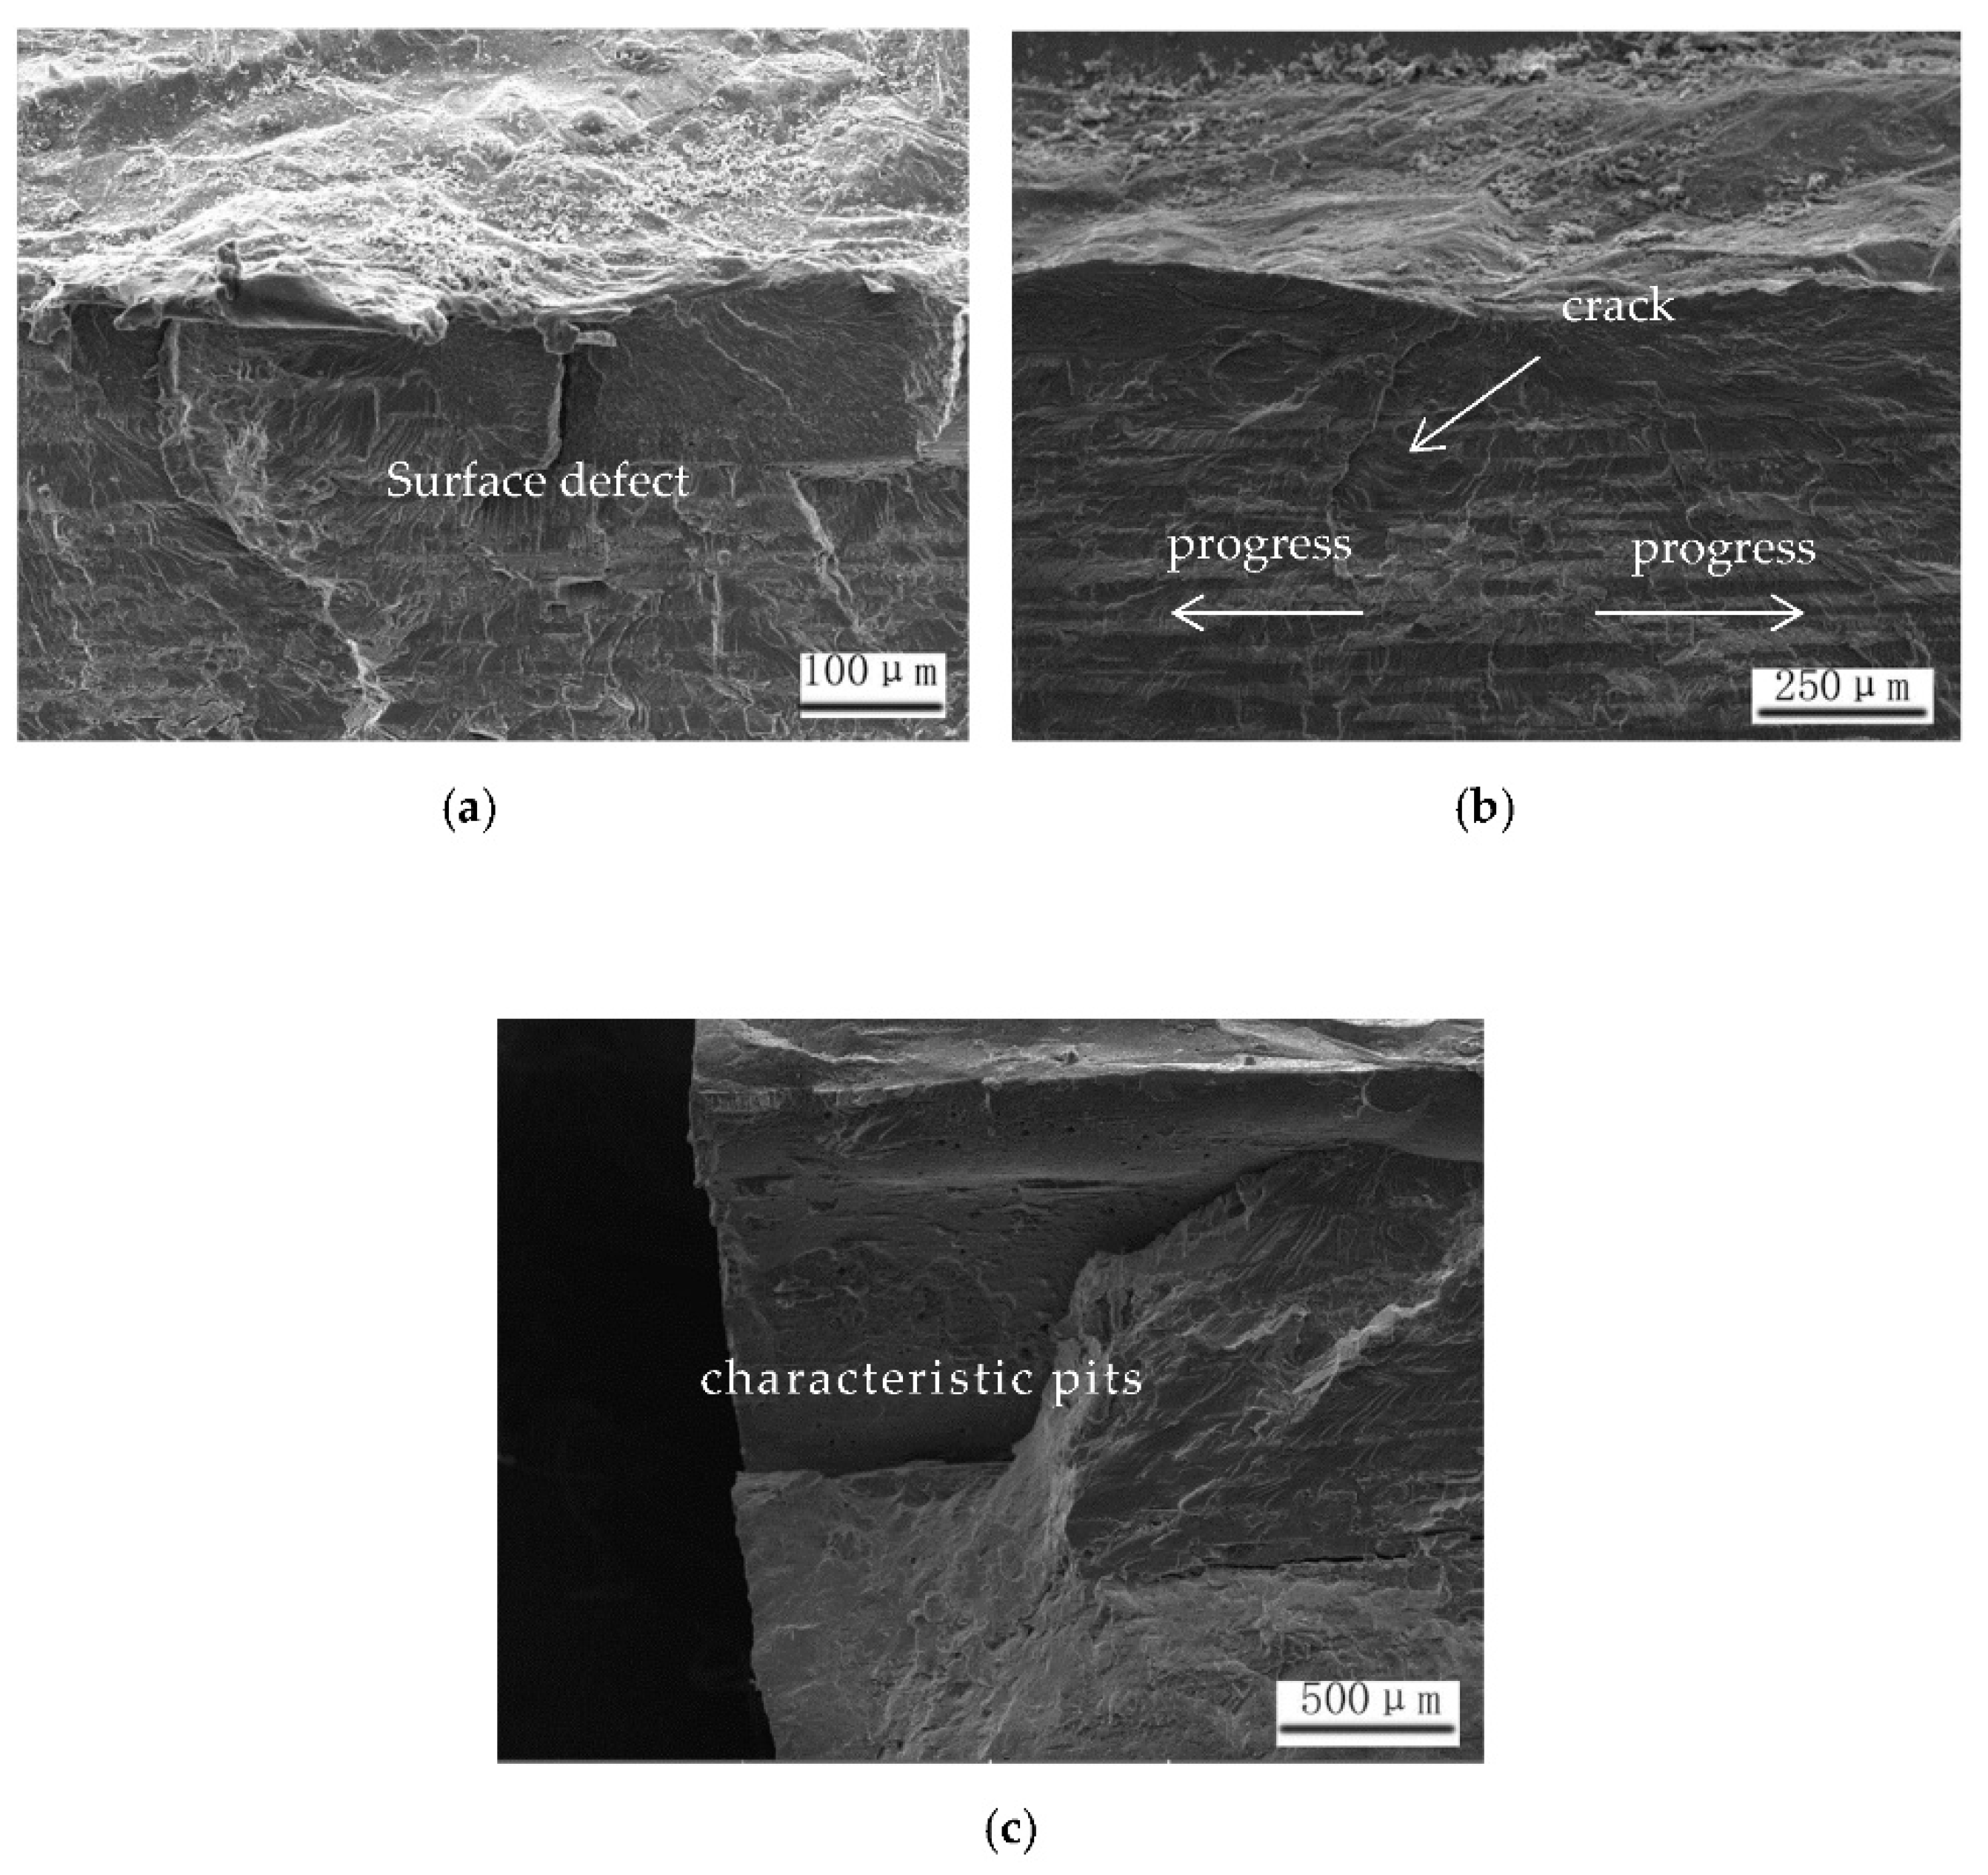
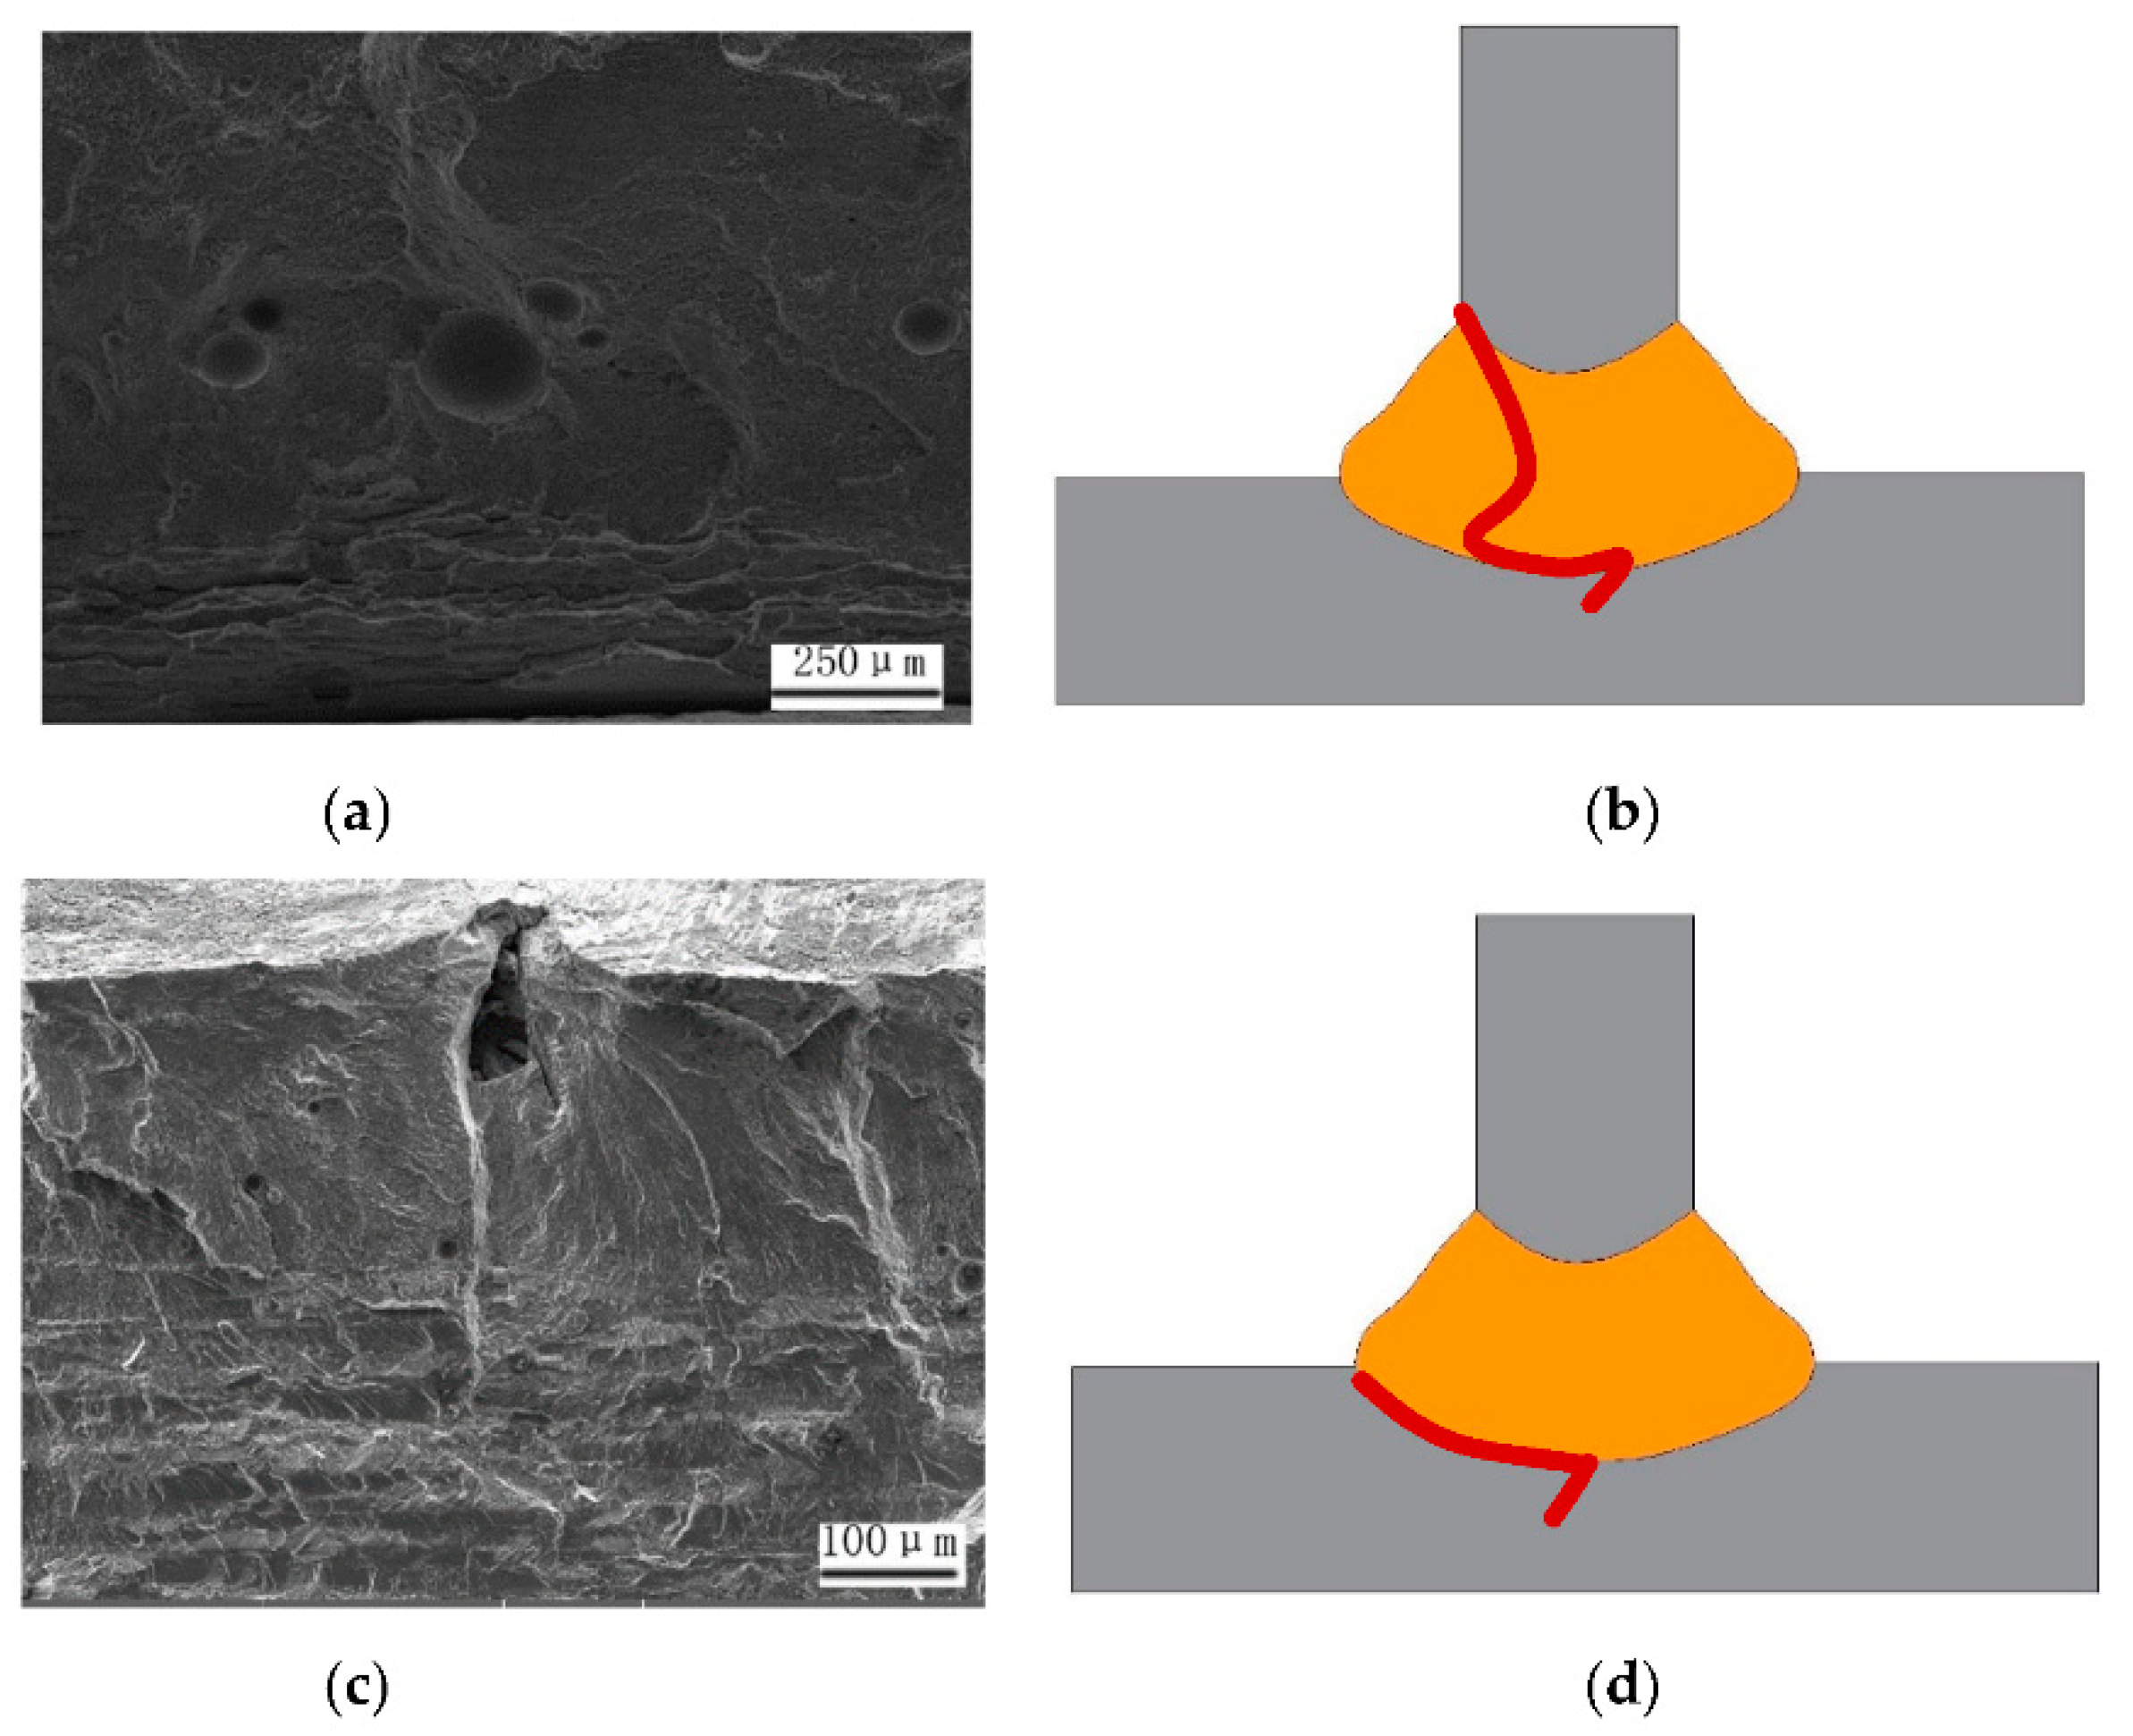
The initiation position of the fatigue fracture at the weld gap presented mixed fracture characteristics, while the final fracture of the base material presented brittle fracture characteristics. The existence of pore defects made the fatigue fracture show more dimples, and fatigue gray lines similar to brittle fractures were observed in the middle and lower regions of the weld.

Author Contributions

Data curation, J.T.; Funding acquisition, H.L.; Methodology, H.L.; Project administration, H.L.; Resources, Q.S.; Supervision, Z.Y.; Writing—original draft, W.C.; Writing—review and editing, H.L. All authors have read and agreed to the published version of the manuscript.

Funding

This research was supported by Zhejiang Key Project of Research and Development Plan (2019C01114 and 2021C01085) and the Talent Program of Shanghai University of Engineering Science (2018RC452018).

Institutional Review Board Statement

Not applicable.

Informed Consent Statement

Not applicable.

Data Availability Statement

Not applicable.

Conflicts of Interest

The authors declare no conflict of interest.

References

  1. Tao, W.; Yang, Z.; Chen, Y.; Li, L.; Jiang, Z.; Zhang, Y. Double-sided fiber laser beam welding process of T-joints for aluminum aircraft fuselage panels: Filler wire melting behavior, process stability, and their effects on porosity defects. Opt. Laser Technol. 2013, 52, 1–9. [Google Scholar] [CrossRef]
  2. Vaidya, W.V.; Horstmann, M.; Seib, E.; Toksoy, K.; Koçak, M. Assessment of fracture and fatigue crack propagation of laser beam and friction stir welded aluminium and magnesium alloys. Adv. Eng. Mater. 2006, 8, 399–406. [Google Scholar] [CrossRef]
  3. Hoang, N.-H.; Langseth, M.; Porcaro, R.; Hanssen, A.-G. The effect of the riveting process and aging on the mechanical behaviour of an aluminium self-piercing riveted connection. Eur. J. Mech. A Solids 2011, 30, 619–630. [Google Scholar] [CrossRef]
  4. Szolwinski, M.P.; Farris, T.N. Linking riveting process parameters to the fatigue performance of riveted aircraft structures. J. Aircr. 2000, 37, 130–137. [Google Scholar] [CrossRef]
  5. Egea, A.S.; Rodríguez, A.; Celentano, D.; Calleja, A.; De Lacalle, L.L. Joining metrics enhancement when combining FSW and ball-burnishing in a 2050 aluminium alloy. Surf. Coat. Technol. 2019, 367, 327–335. [Google Scholar] [CrossRef] [Green Version]
  6. Rodriguez, A.; Calleja, A.; Lacalle, L.N.L.; Pereira, O.; González, H.; Urbikain, G.; Laye, J. Burnishing of FSW aluminum Al–Cu–Li components. Metals 2019, 9, 260. [Google Scholar] [CrossRef] [Green Version]
  7. Fu, B.; Qin, G.; Meng, X.; Ji, Y.; Zou, Y.; Lei, Z. Microstructure and mechanical properties of newly developed aluminum–lithium alloy 2A97 welded by fiber laser. Mater. Sci. Eng. A 2014, 617, 1–11. [Google Scholar] [CrossRef]
  8. Mao, Y.; Ke, L.; Liu, F.; Huang, C.; Chen, Y.; Liu, Q. Effect of welding parameters on microstructure and mechanical properties of friction stir welded joints of 2060 aluminum lithium alloy. Int. J. Adv. Manuf. Technol. 2015, 81, 1419–1431. [Google Scholar] [CrossRef]
  9. Rioja, R.J.; Liu, J. The evolution of Al-Li base products for aerospace and space applications. Met. Mater. Trans. A 2012, 43, 3325–3337. [Google Scholar] [CrossRef]
  10. Tavares, S.M.; Dos Santos, J.; De Castro, P. Friction stir welded joints of Al–Li Alloys for aeronautical applications: Butt-joints and tailor welded blanks. Theor. Appl. Fract. Mech. 2013, 65, 8–13. [Google Scholar] [CrossRef]
  11. Xiao, R.; Zhang, X. Problems and issues in laser beam welding of aluminum–lithium alloys. J. Manuf. Process. 2014, 16, 166–175. [Google Scholar] [CrossRef]
  12. Zhang, X.; Huang, T.; Yang, W.; Xiao, R.; Liu, Z.; Li, L. Microstructure and mechanical properties of laser beam-welded AA2060 Al-Li alloy. J. Mater. Process. Technol. 2016, 237, 301–308. [Google Scholar] [CrossRef]
  13. Han, B.; Chen, Y.; Tao, W.; Li, H.; Li, L. Microstructural evolution and interfacial crack corrosion behavior of double-sided laser beam welded 2060/2099 Al-Li alloys T-joints. Mater. Des. 2017, 135, 353–365. [Google Scholar] [CrossRef]
  14. Yun, W.; Philip, B.; Zhenying, X.; Junfeng, W. Study on fatigue crack growth performance of EH36 weldments by laser shock processing. Surf. Interfaces 2019, 15, 199–204. [Google Scholar] [CrossRef]
  15. Zhang, C.; Gao, M.; Zeng, X. Effect of microstructural characteristics on high cycle fatigue properties of laser-arc hybrid welded AA6082 aluminum alloy. J. Mater. Process. Technol. 2016, 231, 479–487. [Google Scholar] [CrossRef]
  16. Wang, C.; Mi, G.; Zhang, X. Welding stability and fatigue performance of laser welded low alloy high strength steel with 20 mm thickness. Opt. Laser Technol. 2021, 139, 106941. [Google Scholar] [CrossRef]
  17. Ray, T.; Kundu, J.; Kundu, A.; Shome, M. Fatigue behaviour of laser spot welds in dual phase 780 steel. Int. J. Fatigue 2020, 132, 105374. [Google Scholar] [CrossRef]
  18. Qiao, J.; Lu, J.; Wu, S. Fatigue cracking characteristics of fiber Laser-VPTIG hybrid butt welded 7N01P-T4 aluminum alloy. Int. J. Fatigue 2017, 98, 32–40. [Google Scholar] [CrossRef]
  19. Tan, J.; Liu, H.; Zhang, P.; Yu, Z.; Shi, H.; Li, S.; Wu, D.; Yan, H.; Ye, X.; Wang, F.; et al. A study on the 2060-T8/2099-T83 aluminum-lithium alloys T-joints welded by double-sided laser beam welding. J. Mater. Eng. Perform. 2020, 29, 4295–4309. [Google Scholar] [CrossRef]
  20. ASTM E8/E8M-13, Standard Test Methods for Tension Testing of Metallic Materials; ASTM International: West Conshohocken, PA, USA, 2013.
  21. Liu, T.; Zhao, Y.; Kang, Y.; Zhan, X. Effect of micro morphology in different zones on mechanical properties of 2060 Al-Li alloy laser welded joints. J. Manuf. Process. 2020, 50, 336–344. [Google Scholar] [CrossRef]
  22. Zhan, X.; Chen, J.; Liu, J.; Wei, Y.; Zhou, J.; Meng, Y. Microstructure and magnesium burning loss behavior of AA6061 electron beam welding joints. Mater. Des. 2016, 99, 449–458. [Google Scholar] [CrossRef]
  23. Bandi, B.; Dinda, S.K.; Kar, J.; Roy, G.G.; Srirangam, P. Effect of weld parameters on porosity formation in electron beam welded Zircaloy-4 joints: X-ray tomography study. Vacuum 2018, 158, 172–179. [Google Scholar] [CrossRef] [Green Version]
  24. Xie, M.-X.; Li, Y.-X.; Shang, X.-T.; Wang, X.-W.; Pei, J.-Y. Effect of heat input on porosity defects in a fiber laser welded socket-joint made of powder metallurgy molybdenum alloy. Materials 2019, 12, 1433. [Google Scholar] [CrossRef] [Green Version]
  25. Zhang, Y.; Chen, G.; Zhou, C.; Jiang, Y.; Zhong, P.; Li, S. Pores formation in laser–MAG welding of 42CrMo steel. J. Mater. Process. Technol. 2017, 245, 309–317. [Google Scholar] [CrossRef]
  26. Zhang, D.-K.; Zhao, Y.; Dong, M.-Y.; Wang, G.-Q.; Wu, A.-P.; Shan, J.-G.; Meng, D.-Y.; Liu, X.-L.; Song, J.-L.; Zhang, Z.-P. Effects of weld penetration on tensile properties of 2219 aluminum alloy TIG-welded joints. Trans. Nonferrous Met. Soc. China 2019, 29, 1161–1168. [Google Scholar] [CrossRef]
  27. Beiranvand, Z.M.; Ghaini, F.M.; Moosavy, H.N.; Sheikhi, M.; Torkamany, M.J.; Moradi, M. The relation between magnesium evaporation and laser absorption and weld penetration in pulsed laser welding of aluminum alloys: Experimental and numerical investigations. Opt. Laser Technol. 2020, 128, 106170. [Google Scholar] [CrossRef]
  28. Zhan, X.; Qi, C.; Gao, Z.; Tian, D.; Wang, Z. The influence of heat input on microstructure and porosity during laser cladding of Invar alloy. Opt. Laser Technol. 2019, 113, 453–461. [Google Scholar] [CrossRef]
  29. ASTM E466-15 (2015) Standard Practice for Conducting Force Controlled Constant Amplitude Axial Fatigue Tests of Metallic Materials; ASTM International: West Conshohocken, PA, USA, 2015.
  30. Huang, W.; Wang, T.-J.; Garbatov, Y.; Soares, C.G. DFR based fatigue reliability assessment of riveted lap joint accounting for correlations. Int. J. Fatigue 2013, 47, 106–114. [Google Scholar] [CrossRef]
  31. Skorupa, M.; Machniewicz, T.; Schijve, J.; Korbel, A. Fatigue life prediction model for riveted lap joints. Eng. Fail. Anal. 2015, 53, 111–123. [Google Scholar] [CrossRef]
  32. Ke, W.; Bu, X.; Oliveira, J.; Xu, W.; Wang, Z.; Zeng, Z. Modeling and numerical study of keyhole-induced porosity formation in laser beam oscillating welding of 5A06 aluminum alloy. Opt. Laser Technol. 2021, 133, 106540. [Google Scholar] [CrossRef]
  33. Meng, X.; Yang, S.; Huang, Y.; Fang, Y.; Gu, J.; Xiong, Q.; Duan, C. Microstructure characterization and mechanism of fatigue crack propagation of 6082 aluminum alloy joints. Mater. Chem. Phys. 2021, 257, 123734. [Google Scholar] [CrossRef]
  34. Hobbacher, A. The new IIW recommendations for fatigue assessment of welded joints and components—A comprehensive code recently updated. Int. J. Fatigue 2009, 31, 50–58. [Google Scholar] [CrossRef]
  35. Feng, J.; Li, L.; Chen, Y.; Tian, Y.; Sun, Y.; Zhang, X.; Zhang, J. Inhomogeneous microstructure and fatigue crack propagation of thick-section high strength steel joint welded using double-sided hybrid fiber laser-arc welding. Opt. Laser Technol. 2021, 134, 106668. [Google Scholar] [CrossRef]
Figure 1. (a) Schematic diagram of X-ray non-destructive testing, (b) Schematic diagram of transverse tensile testing.
Coatings 11 00693 g001
Figure 2. Macro morphology of T-joint and the proportion of weld penetration. (a) sample 1, (b) sample 2, (c) sample 3.
Coatings 11 00693 g002
Figure 3. (a) Microstructure of the cross section; (b) Y-type EQZ.
Coatings 11 00693 g003
Figure 4. EDS analysis of boundary (a) Point 1; (b) Point 2.
Coatings 11 00693 g004
Figure 5. Weld ray diagram. (a) sample 1, (b) sample 2, (c) sample 3.
Coatings 11 00693 g005
Figure 6. Macro morphology of tensile fracture of weld. (a) sample 1, (b) sample 2, (c) sample 3.
Coatings 11 00693 g006aCoatings 11 00693 g006b
Figure 7. The SEM photographs of fracture of sample 1–8 fatigue cycle is 111,962. (a) crack initiation zone, (b) crack propagation zone, (c) final fracture zone.
Coatings 11 00693 g007
Figure 8. The SEM photographs of fracture of sample 2–8 fatigue cycle is 206,437. (a) crack initiation zone, (b) crack propagation zone, (c) final fracture zone.
Coatings 11 00693 g008
Figure 9. The SEM photographs of fracture of sample 3–5 fatigue cycle is 259,208. (a) crack initiation zone, (b) crack propagation zone, (c) final fracture zone.
Coatings 11 00693 g009
Figure 10. (a) The source of the crack is at the pore of the weld (b) Schematic diagram of fracture from the inside of the weld (c) The source of the crack is at the gap of the weld (d) Schematic diagram of fracture from the edge of the weld.
Coatings 11 00693 g010
Table 1. 2060T8/2099T83 aluminum–lithium alloys and filler wire chemical composition and content (wt. %).
MaterialsCuLiZnMgMnZrAgSrSiFeTiAl
2060T83.90.80.320.70.290.10.34-0.020.02<0.1Remain
2099T832.521.871.190.4970.3090.082-0.060---Remain
Filler wireSiFeCuMnZnTiMgAl
ER404711.520.20<0.0010.010.0010.010.01Remain
Table 2. Laser beam welding parameters of 2060T8/2099T83 aluminum–lithium alloys.
Serial NumberMain Welding Parameters
P
Laser Power (W)
V
Welding Speed (m/s)
F
Wire Feeding Speed (m/min)
Q
Weld Heat Input * (kJ/m)
133000.17419.41
224000.122.920.00
328000.123.623.33
* Weld heat input Q = P/v.
Table 3. Stomatal data.
Serial NumberPorosity (%)Maximum Aperture (mm)Maximum Area (mm2)
15.351.010.71
23.320.670.29
32.080.390.10
Table 4. Tensile test data and penetration ratio.
Tensile Test DataPenetration (%)
Serial NumberLoad (N)Strength (Mpa)Average Intensity (Mpa)
1-17168.50286.74250.6691.40
1-24744.30189.77
1-36886.80275.47
2-17981.30319.25353.3051.80
2-28973.40358.94
2-39543.00381.72
3-17674.10306.96289.2162.60
3-26278.80251.15
3-37738.10309.52
Table 5. Fatigue property test data.
Sample 1Fatigue cycles
155,330645,236245,959304,197117,4594,363195,593111,962
Fracture
Position
weld toeweld toein the weldin the weldin the weldin the weldin the weldin the weld
Sample 2Fatigue cycles
367,165637,084532,836622,556661,6441,000,000473,174206,437
Fracture
Position
weld toeweld toeweld toeweld toeweld toeunbrokenweld toeweld toe
Sample 3Fatigue cycles
906,548589,857718,367464,790259,208935,257553,682379,642
Fracture
position
weld toeweld toeweld toeweld toeweld toeweld toeweld toeweld toe
Table 6. Fatigue test data analysis results.
Serial NumberβN95/95DFR/MPa
1404,794172,10686.3
2553,567235,36093.5
3706,560300,40899.4
Publisher’s Note: MDPI stays neutral with regard to jurisdictional claims in published maps and institutional affiliations.

