Article

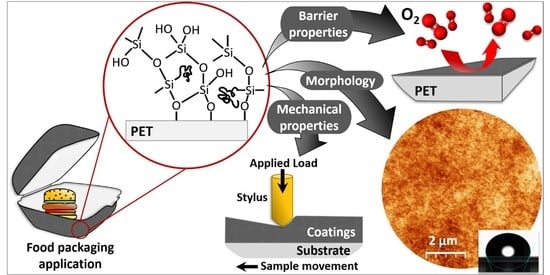
Structural and Functional Properties of Fluorinated Silica Hybrid Barrier Layers on Flexible Polymeric Foil

1
Łukasiewicz Research Network—PORT Polish Center for Technology Development, Stablowicka 147, 50-066 Wroclaw, Poland
2
Institute of Low Temperature and Structure Research, PAS, Okolna 2, 50-422 Wroclaw, Poland
3
Department of Mechanics, Materials and Biomedical Engineering, Wroclaw University of Science and Technology, Smoluchowskiego 25, 50-370 Wroclaw, Poland
4
IFN-CNR CSMFO Lab. and FBK Photonics Unit, Via alla Cascata 56/C Povo, 38100 Trento, Italy
*
Authors to whom correspondence should be addressed.
Coatings 2021, 11(5), 573; https://doi.org/10.3390/coatings11050573
Submission received: 15 April 2021 / Revised: 7 May 2021 / Accepted: 11 May 2021 / Published: 14 May 2021
(This article belongs to the Special Issue Multifunctional Coating for Packaging Applications)

Abstract

:
The reported work was focused on sol–gel-derived organically modified and fluorinated silica coatings deposited on elastic polymeric foil. The structure and topography of the coatings were tested by infrared spectroscopy and microscopic studies. The functional properties were determined using thermal analysis, surface analysis, and oxygen permeability tests. The barrier feature of the investigated materials against oxygen was correlated with the properties of the coatings. The hybrid (organic–inorganic) structure of the coatings was proven, demonstrating the presence of a silica network modified with alkyl and fluoroalkyl groups since precursors with the isooctyl group or different lengths of the fluoroalkyl chains were used for the syntheses. The coatings were free of defects and had a smooth surface except for the sample containing the longest fluoroalkyl chain (perfluorododecyl group), which showed a wrinkle-like surface. The hydrophobic character of the coatings increased, whereas the oxygen permeation coefficient values decreased (reaching a fourfold lower coefficient in comparison to the bare substrate) with a higher content of the fluorinated carbon atoms in the structure. The results were enriched by the information from the thermomechanical analysis as well as nanoindentation and scratch tests giving values of the glass transition temperature, thermal expansion coefficient, coatings adhesion, and hardness of the investigated systems.

Graphical Abstract

1. Introduction

Materials based on polymers are most commonly used in the packaging industry due to their excellent physical, chemical, and mechanical properties. They have relatively low costs of production which is also quite easy and a highly efficient process [1]. It is difficult to imagine the world without using plastic materials. Polyethylene (PE), polypropylene (PP), polyethylene terephthalate (PET), polyvinyl chloride (PVC), and polystyrene (PS) are the main plastics used in packaging, which account for 90% of all plastics used in the production of packaging materials [2].
The Industry of Polymers classified materials into two groups depending on their flexibility properties. The first group is determined by rigid polymeric materials (cans, tanks, bottles, or containers) whose shape does not change during usage and which can be reused for a long time. They usually have higher impact strength, better barrier properties as well as better mechanical and chemical resistance. The second class of plastic materials used in packaging is flexible materials, which require less polymer and less energy for their production because of their lower weight. Using flexible polymeric foil, the product package can be formed at any shape and it can be printed at the same time. Despite the advantages, flexible plastic packaging has lower barrier properties than rigid materials [2]. Their properties are usually improved by using additives during fabrication processes or by covering with functional layers. For example, antimicrobial properties are improved by using silver nanoparticles [3], titanium dioxide, and zinc oxide [4]. Application of the coatings in packaging materials became an attractive and effective way to improve the functional properties of packaging polymers [5].
Barrier properties against oxygen permeation play a significant role in packaging materials. On the one hand, some products (fresh fruits or vegetables) need the presence of oxygen, but on the other hand, there are many dry products with a long shelf-life, which require non-oxygen storage conditions. Those products in the oxygen atmosphere lose aromas and oily substances and their degradation processes occur [6].
Two mechanisms are responsible for gas transport through the barrier layer: the diffusion flow in the volume of the material (material property) and the flow through the layer defects (microstructure features: inhomogeneity, holes, microchannels, microcracks, and grain boundaries). The diffusion mechanism consists of several stages: absorption of the penetrating agent on the surface of the barrier layer, penetration into the layer, diffusion through its volume, and desorption to the opposite barrier surface. Consequently, the permeability of the external factor is a function dependent on: particle size, molar mass, and physical and chemical interaction with the barrier [7]. The greatest role in gas transfer through the polymer is played by free spaces, places in the amorphous network of the polymer where the molecules are far apart enough to create the free spaces between the polymer chains [8,9]. The permeability of the gases through the polymer structure also depends on the degree of crystallinity (morphology), where the higher content of crystal regions in the polymer structure reduces the gas permeation [10]. The barrier properties of the functional coatings also depend on the chemical composition of the layer and the ratio of the organic to the inorganic part. The coating should be smooth, tightly packed in its volume, and have an adequate surface energy [11].
In paper packaging, the pure polymeric foils (e.g., PE or PET) are bonded with cellulosic forms and with aluminum foils to improve barrier properties [12]. As the best oxygen barrier materials, glass and tinplate were found, the latter one replaced by aluminum in can production. Due to the weight reduction in these packages and the cost of their production, multi-layer packages have been used, where the barrier layer is an aluminum foil. Unfortunately, such multi-layer structures are problematic in the recycling process [13,14,15].
The application of nanostructures might be an effective way to improve the barrier properties of the coatings [16]. The nanocomposite coatings for packaging application are still mainly at the laboratory scale, but there are some products available in the market, for example, Nano-Seal trade name, which is dedicated to food packaging [17]. The SAES Coated Films [18] offer oxygen barrier nano-coatings which have been tested for fresh food storage in combination with a modified atmosphere [19].
The sol–gel technology and its capabilities in the nanoscale arrangement can give an important contribution in improving the barrier properties of packaging polymeric foils [20]. The sol–gel chemistry is widely used in various coating technologies because it is cheap, efficient, comprehensive, and does not require expensive equipment. In this process, the amorphous form of coatings might be obtained, for which the structural analysis is relatively difficult [21]. Nevertheless, to understand the influence of the polymer structure on the functional properties, wide experimental investigations and in-depth analysis of the results are required.
The surface energy of the coating and its wettability not only ensure hydrophilic/hydrophobic surface, but also affect gases and vapor permeation. Modification of these parameters can be obtained by the introduction of fluoric atoms to the final chemical structure of the layer [22]. Fluorinated silicon compounds are known to be used for functionalized coating fabrication but they are mainly applied at steel substrates for corrosion protection [23]. Other types of fluoroalkyl-modified resins are used on anti-fouling [24] and anti-icing surfaces [25], where the superhydrophobic properties of the coatings are crucial [26]. Fluorinated structures work well for these applications, especially when nanocomposite materials are prepared [27] or the surface of the coating is additionally textured with a laser [28]. However, for most of the mentioned applications, the final coatings are rather rigid, thick, and applied on non-flexible substrates. Therefore, the adaptation of the properties of the sol–gel coatings deposited on flexible substrates using fluoroalkyl silanes is an interesting topic in terms of characterizing these structures, including the verification of their gas barrier properties for possible packaging applications.
The fabrication and characterization of sol–gel-derived fluorinated silica coatings are presented in this work. By using organically modified silanes with different lengths of fluoroalkyl chains, the sols were synthesized and the series of coatings were deposited on polyethylene terephthalate foil. The structure, morphology, topography, and functional properties, such as wettability, roughness, adhesion, hardness, and oxygen permeability, were tested and discussed.

2. Materials and Methods

2.1. Materials

The following chemicals were used for syntheses: isooctyltriethoxysilane (IOTES) and perfluorooctyltriethoxysilane (PFOTES) from Merck KGaA, Darmstadt, Germany, trifluoropropyltrimethoxysilane (TFPTMS) from TCI, Tokyo, Japan, perfluorododecyltriethoxysilane (PFDDTES) from Apollo Scientific, Stockport, UK, ethyl silicate (ES) from Wacker Chemie AG, Munich, Germany, deionized water, 96% ethanol and hydrochloric acid from Avantor Performance Materials Poland S.A., Gliwice, Poland.

2.2. Sol Preparation

Syntheses were carried out via the sol–gel process by hydrolysis and condensation reactions of silicon-based compounds in acidic conditions. For all layers’ synthesis, ethyl silicate and isooctyltriethoxysilane were the main silica precursors and the sample prepared with these two compounds was marked as (CF)0 (0 = no fluorine substituted carbon atoms). For three other samples, the difference was in a third precursor added during the reaction step, which had various fluorinated alkyl chains: trifluoropropyltrimethoxysilane (sample (CF)1, one fluorinated carbon in the alkyl chain, –CF3), perfluorooctyltriethoxysilane (sample (CF)6, six fluorinated carbons in the alkyl chain, –(CF2)5CF3), and perfluorododecyltriethoxysilane (sample (CF)10, ten fluorinated carbons in the alkyl chain, –(CF2)9CF3). The used precursors and their molecular structures are collected in Table S1 in the Supplementary Materials. To obtain the sols, precursors at appropriate molar ratios (ES:IOTES:fluorinated silicate = 2:1:1) were mixed with ethanol and deionized water. After stirring for 1.5 h at room temperature, the solutions were kept under vacuum for 3 h to evaporate part of the solvent, and later they were stored in open containers at 60 °C for 16 h before the deposition process. The synthesis of the (CF)10 sample was carried out at an inert (argon) atmosphere in a glove-box because of the high sensitivity of PFDDTES to the humid air.

2.3. Layer Fabrication

The hybrid (organic–inorganic) layers were deposited using the spin-coating method on a polyethylene terephthalate foil (Melinex St504 with 175 µm thickness, DuPont Teijin Films, Luxembourg City, Luxembourg) as a substrate. The substrates were cleaned with ethanol and isopropanol using an ultrasonic bath and activated by plasma treatment before the deposition process.
Different shapes and sizes of substrates were used. Squares with dimensions 2.5 cm × 2.5 cm were taken for most of the measurements. Samples in the form of narrow rectangles (4 mm × 10 mm) were cut for thermomechanical analysis. For analyses of oxygen permeability, discs with 7 cm diameter were taken. The sols were deposited on the substrates with 8000 rpm rotation speed. After deposition, the samples were conditioned at room temperature for one day and later were dried at 60 °C. A schematic diagram of the preparation and testing of the fabricated coatings is shown in Figure S1 in the Supplementary Materials.

2.4. Methods of Layer Characterization

To confirm the presence of characteristic chemical bonds in the organosilicate network, Fourier Transform Infrared spectroscopy (FTIR) analysis was provided with the Attenuated Total Reflectance (ATR) diamond attachment using the Bruker FTIR Tensor 27 apparatus (Billerica, MA, USA). The spectra have been registered in the range of 400–4000 cm−1 with 4 cm−1 resolution using 32 scans.
The thickness of the coating was estimated using the Bruker DektakXT stylus profilometer (Billerica, MA, USA) with 3 mg force and 12.5 µm needle with the profile measurement length of 1300 µm which includes the level of the coating and the level of the substrate. The thickness of the coating was determined from the difference of those two levels with the precision of measurement in vertical position around 1 nm (given by producer). The result is the mean of three single measurements.
The surface morphology and layer composition were investigated by Scanning Electron Microscopy (SEM/FIB—FEI Helios Nanolab 450HP, Nanolab Technologies Inc., Milpitas, CA, USA). Before imaging, the amorphous carbon layers with thickness around 20 nm were deposited on the samples’ surface using a vacuum sputtering device (Leica EM ACE600, Wetzlar, Germany). The samples were imaged with a magnification of 5000× and a beam with energy of 5 kV. The view of the sample surface was received by a Back-scattered Electron Detector (BSE, Nanolab Technologies Inc., Milpitas, CA, USA) and transformed into final images.
The topography of the coatings was analyzed by Atomic Force Microscopy (AFM) (FastScan, Bruker, Billerica, MA, USA) equipped with the SCM PIT probe, with spring constant 2.8 Nm−1 and resonant frequency of 75 kHz (length 225 μm). The roughness parameters Ra and Rq were calculated from the surface of 100 µm2. Ra is the arithmetic average deviation of the profile from the mean line and Rq is the root mean square of the height of the profile on the measuring section.
The thermal properties were analyzed using Thermomechanical Analysis (TMA) (TMA/SDTA1, Mettler Toledo, Columbus, OH, USA) to determine the glass transition temperature (Tg), expansion coefficient, and elongation of the samples measured using film elongation mode in a temperature range from 25 °C to 180 °C with a heating rate 2.5 K/min and 0.1 N force. For the TMA measurements, samples were placed in a holder dedicated for foils in the stretching mode. The deformation of samples under the influence of increasing temperature was recorded in a graphical form. From the graphs, the sample elongation Tg and expansion coefficient were determined.
The surface energy and wettability properties were tested using the Goniometer OCA 35 (DataPhysics, Filderstadt, Germany). The values of contact angles were measured with a water drop volume of 3 µL (water contact angle, WCA). The presented values are the average of ten single measurements for each sample. The Surface Free Energy (SFE) was calculated using the Owens–Wendt method based on contact angle values of two different standard liquids with polar and non-polar character—water and diiodomethane. The method is suitable for polymers and is based on polar and dispersive force components [29].
The oxygen permeability tests were performed according to the PN-EN ISO 2556 standard using a device of Remi-Plast (Czerwonak, Poland) production. The test is based on a manometric method, consisting of subjecting one side of the barrier (chamber 1) to the gas (oxygen) at a pressure of 1 bar (0.1 MPa) and observation of the pressure change on the opposite side of the barrier, which is under negative pressure (chamber 2). The tests were conducted during 3 h exposition for each sample. The details on the calculation of Oxygen Transmission Rate (OTR) were given elsewhere [30]. The formula used for calculations is presented in Equation S1 (Supplementary Materials). Taking into account the samples’ thickness, the oxygen permeation coefficient could be estimated by multiplying the OTR and the thickness values.
The scratch tests were performed with a scratch tester equipped with an integrated optical microscope and hi-resolution camera (CSM instruments, Peseux, Switzerland) and using diamond Rockwell indenter with a radius of 200 µm. Examination was carried out according to the EN-1071-3 standard. The scratch of 15 mm length was made in progressive mode with load range of 0.03–15 N and loading rate of 10 mN/min. All pictures documenting samples’ surfaces immediately after the scratch test were received using the integrated optical microscope with Olympus objective lens with 20× magnification. The measurements were carried out for 3 samples of the same material, in 2 repetitions for each one.
The nanoindentation tests were performed with a nanoindentation tester (NHT2, CSM instruments, Peseux, Switzerland). For each material, 3 samples were measured and 12 measurements were performed for each sample (6 in two different areas of the sample). The measurements were carried out using a three-sided pyramid Berkovich tip. The maximum load was set as 0.10 mN and the loading and unloading rate was equal to 0.80 mN/min. The stabilization pause at maximum load was 10 s. The calculations were performed according to Martens hardness protocol. For the presented results, the outliers and values from an incorrect course of loading and un-loading curves were rejected; however, it was not more than 3 values per sample.

3. Results

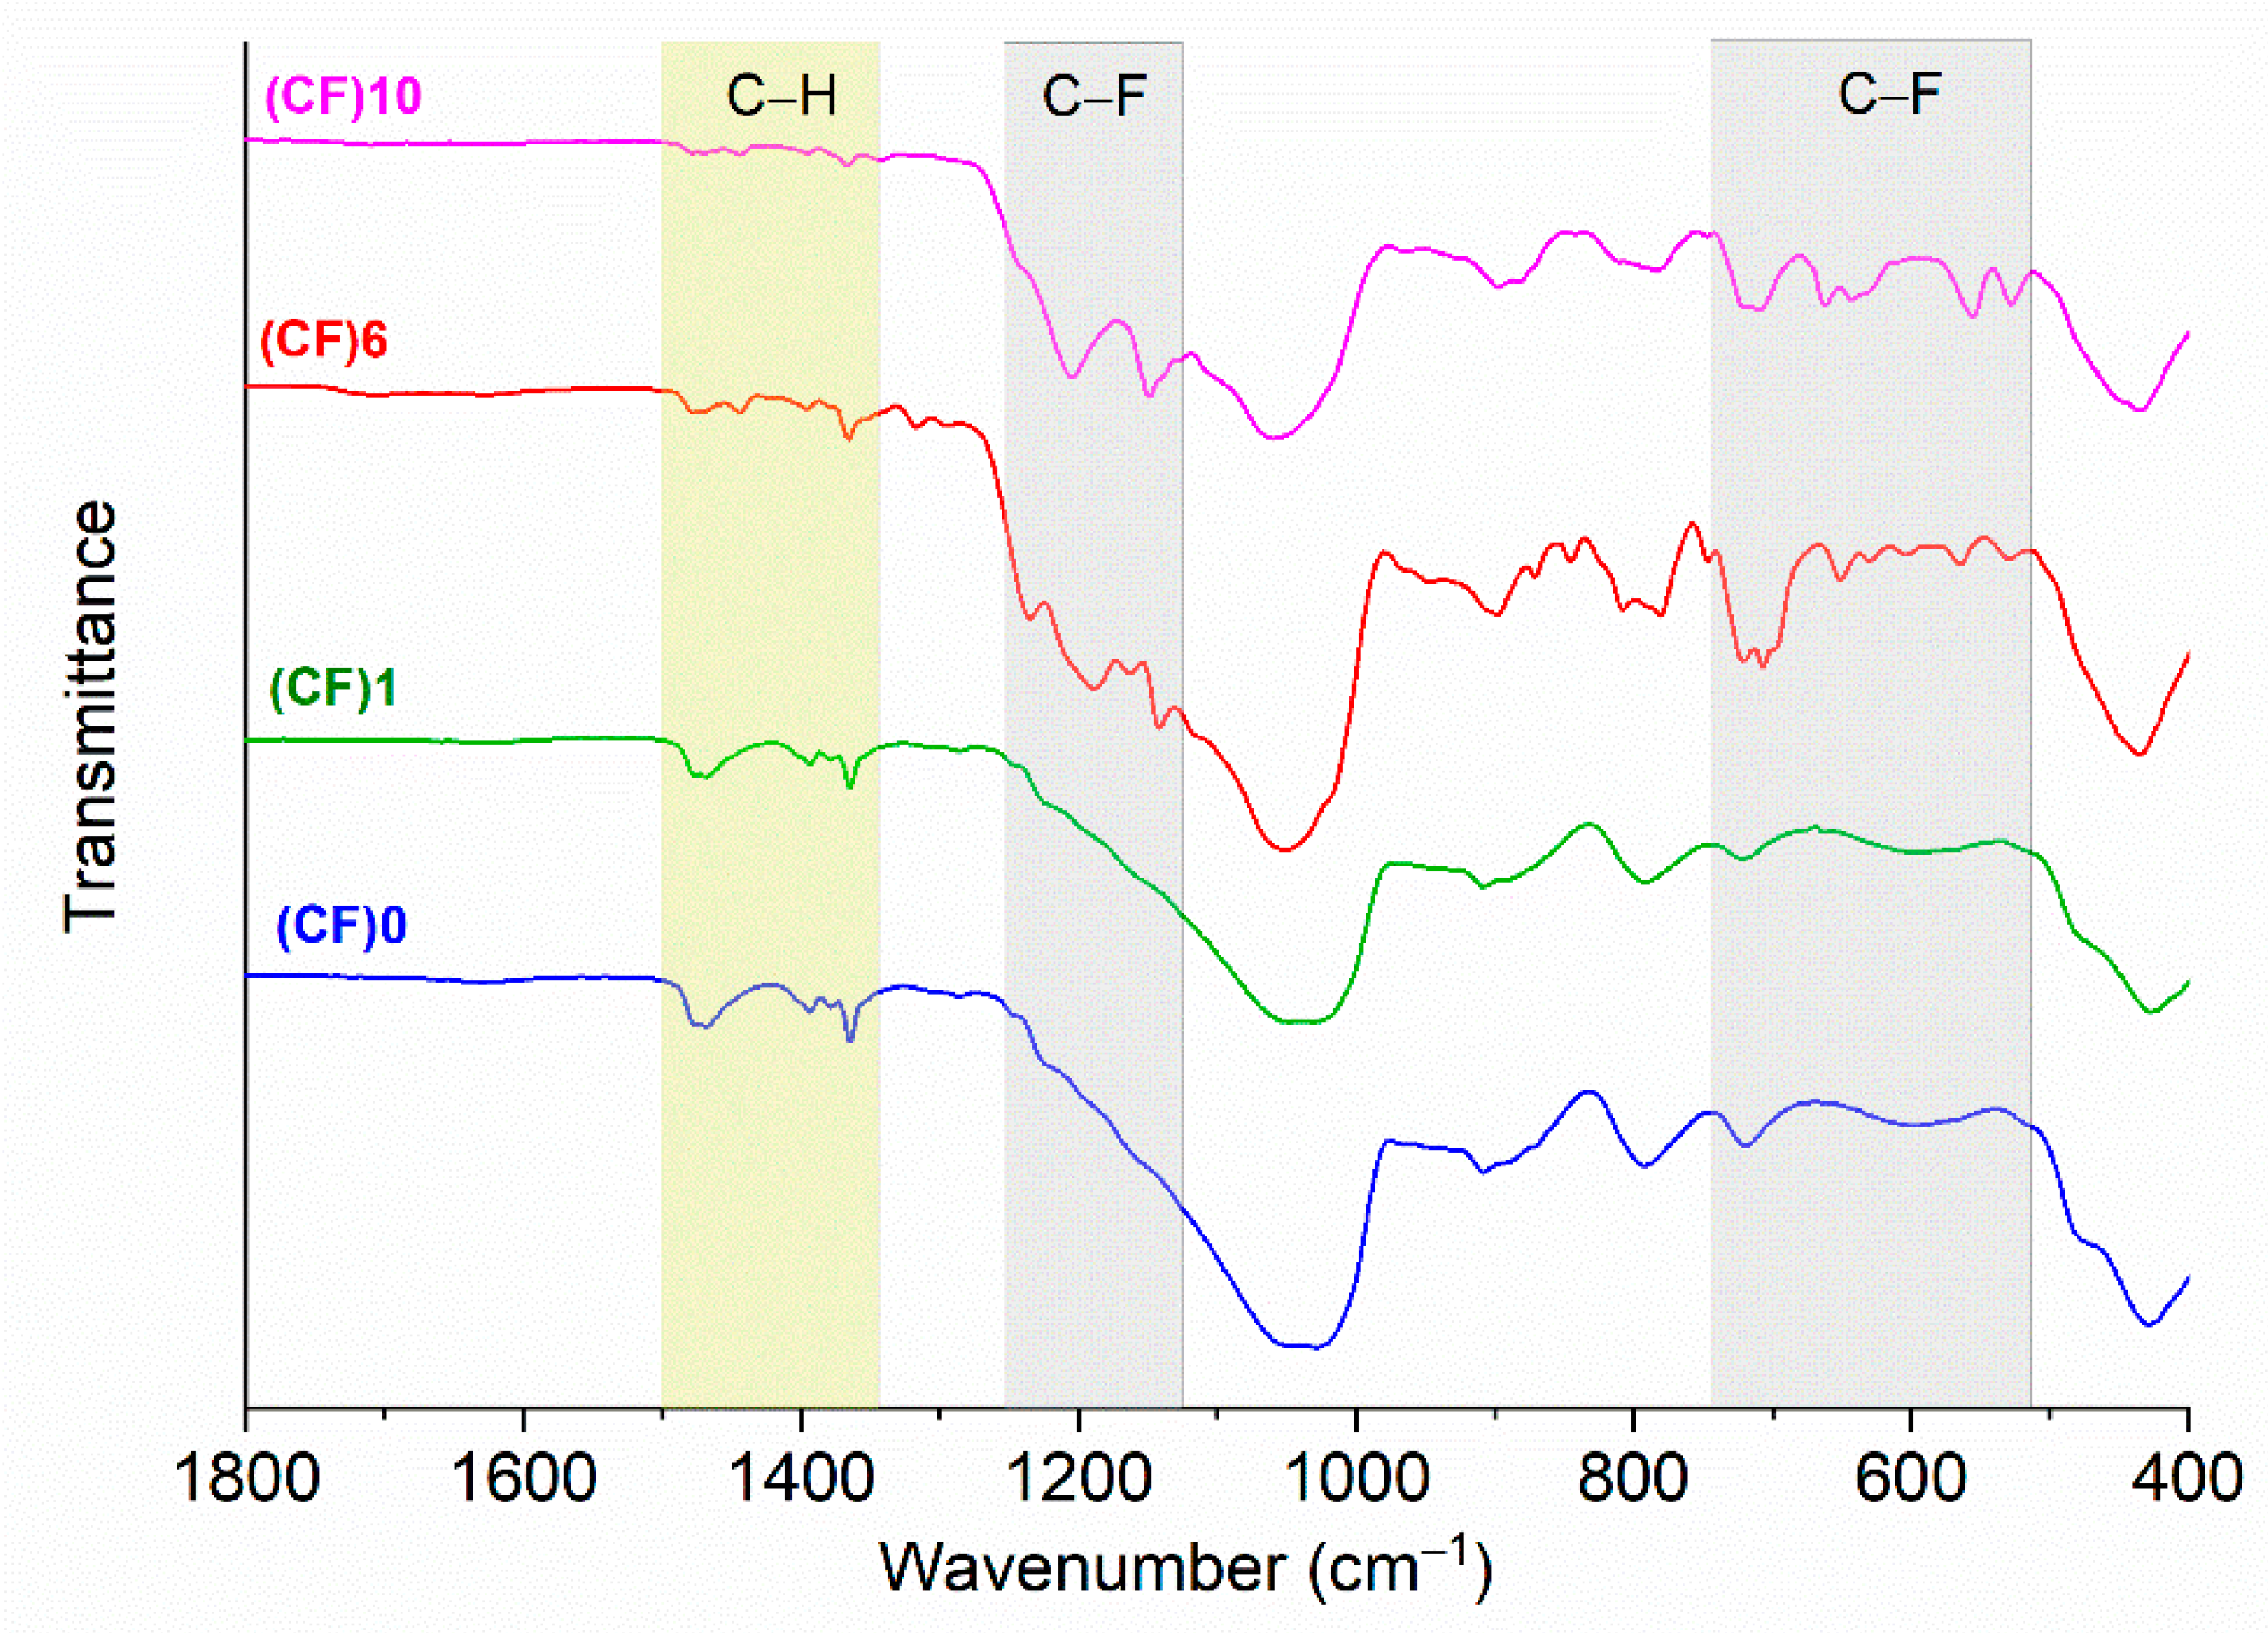
3.1. Chemical Composition (FTIR Spectroscopy)

The chemical structure of the fabricated layers was analyzed by FTIR spectroscopy (Figure 1 shows spectra in the range of 400–1800 cm−1 and the whole range graphs with the spectra of the substrate are included in the Supplementary Materials, Figure S2). The significant bands assigned to the specific vibrations of the network bonds are collected in Table 1 and listed hereafter.
The strongest complex band in the range of 980–1200 cm−1 corresponded to the asymmetric stretching vibration of Si–O–Si bonds in the silica matrix and indicated that the expected silica network has been formed. Other absorption bands assigned to vibrational modes of the Si–O–Si bonds were present around 430 cm−1 [31,32,33] and 800 cm−1 (rocking and symmetric stretching vibrations, respectively) [34,35]. The band at 900 cm−1 indicated the Si–O stretching mode [36,37]. The broad band characteristic for the Si–OH stretching vibration of the terminal silanol groups and other hydroxyl groups was centered near 3400 cm−1 [38]. The bands of medium intensity located in the range of 2980–2850 cm−1 were related to the symmetric and asymmetric stretching vibrations of C–H bonds in –CH2 and –CH3 groups. The bending vibrations of C−H bonds were also present at 1350–1490 cm−1 [39,40]. The absorption seen for (CF)6 and (CF)10 in the range of 1100–1250 cm−1 was the characteristic bands of the C–F stretching vibrations in –CF2 and –CF3 groups. Moreover, the existence of C–F bonds was also observed in the range of 520–730 cm−1, corresponding to the rocking and wagging modes [41,42,43].

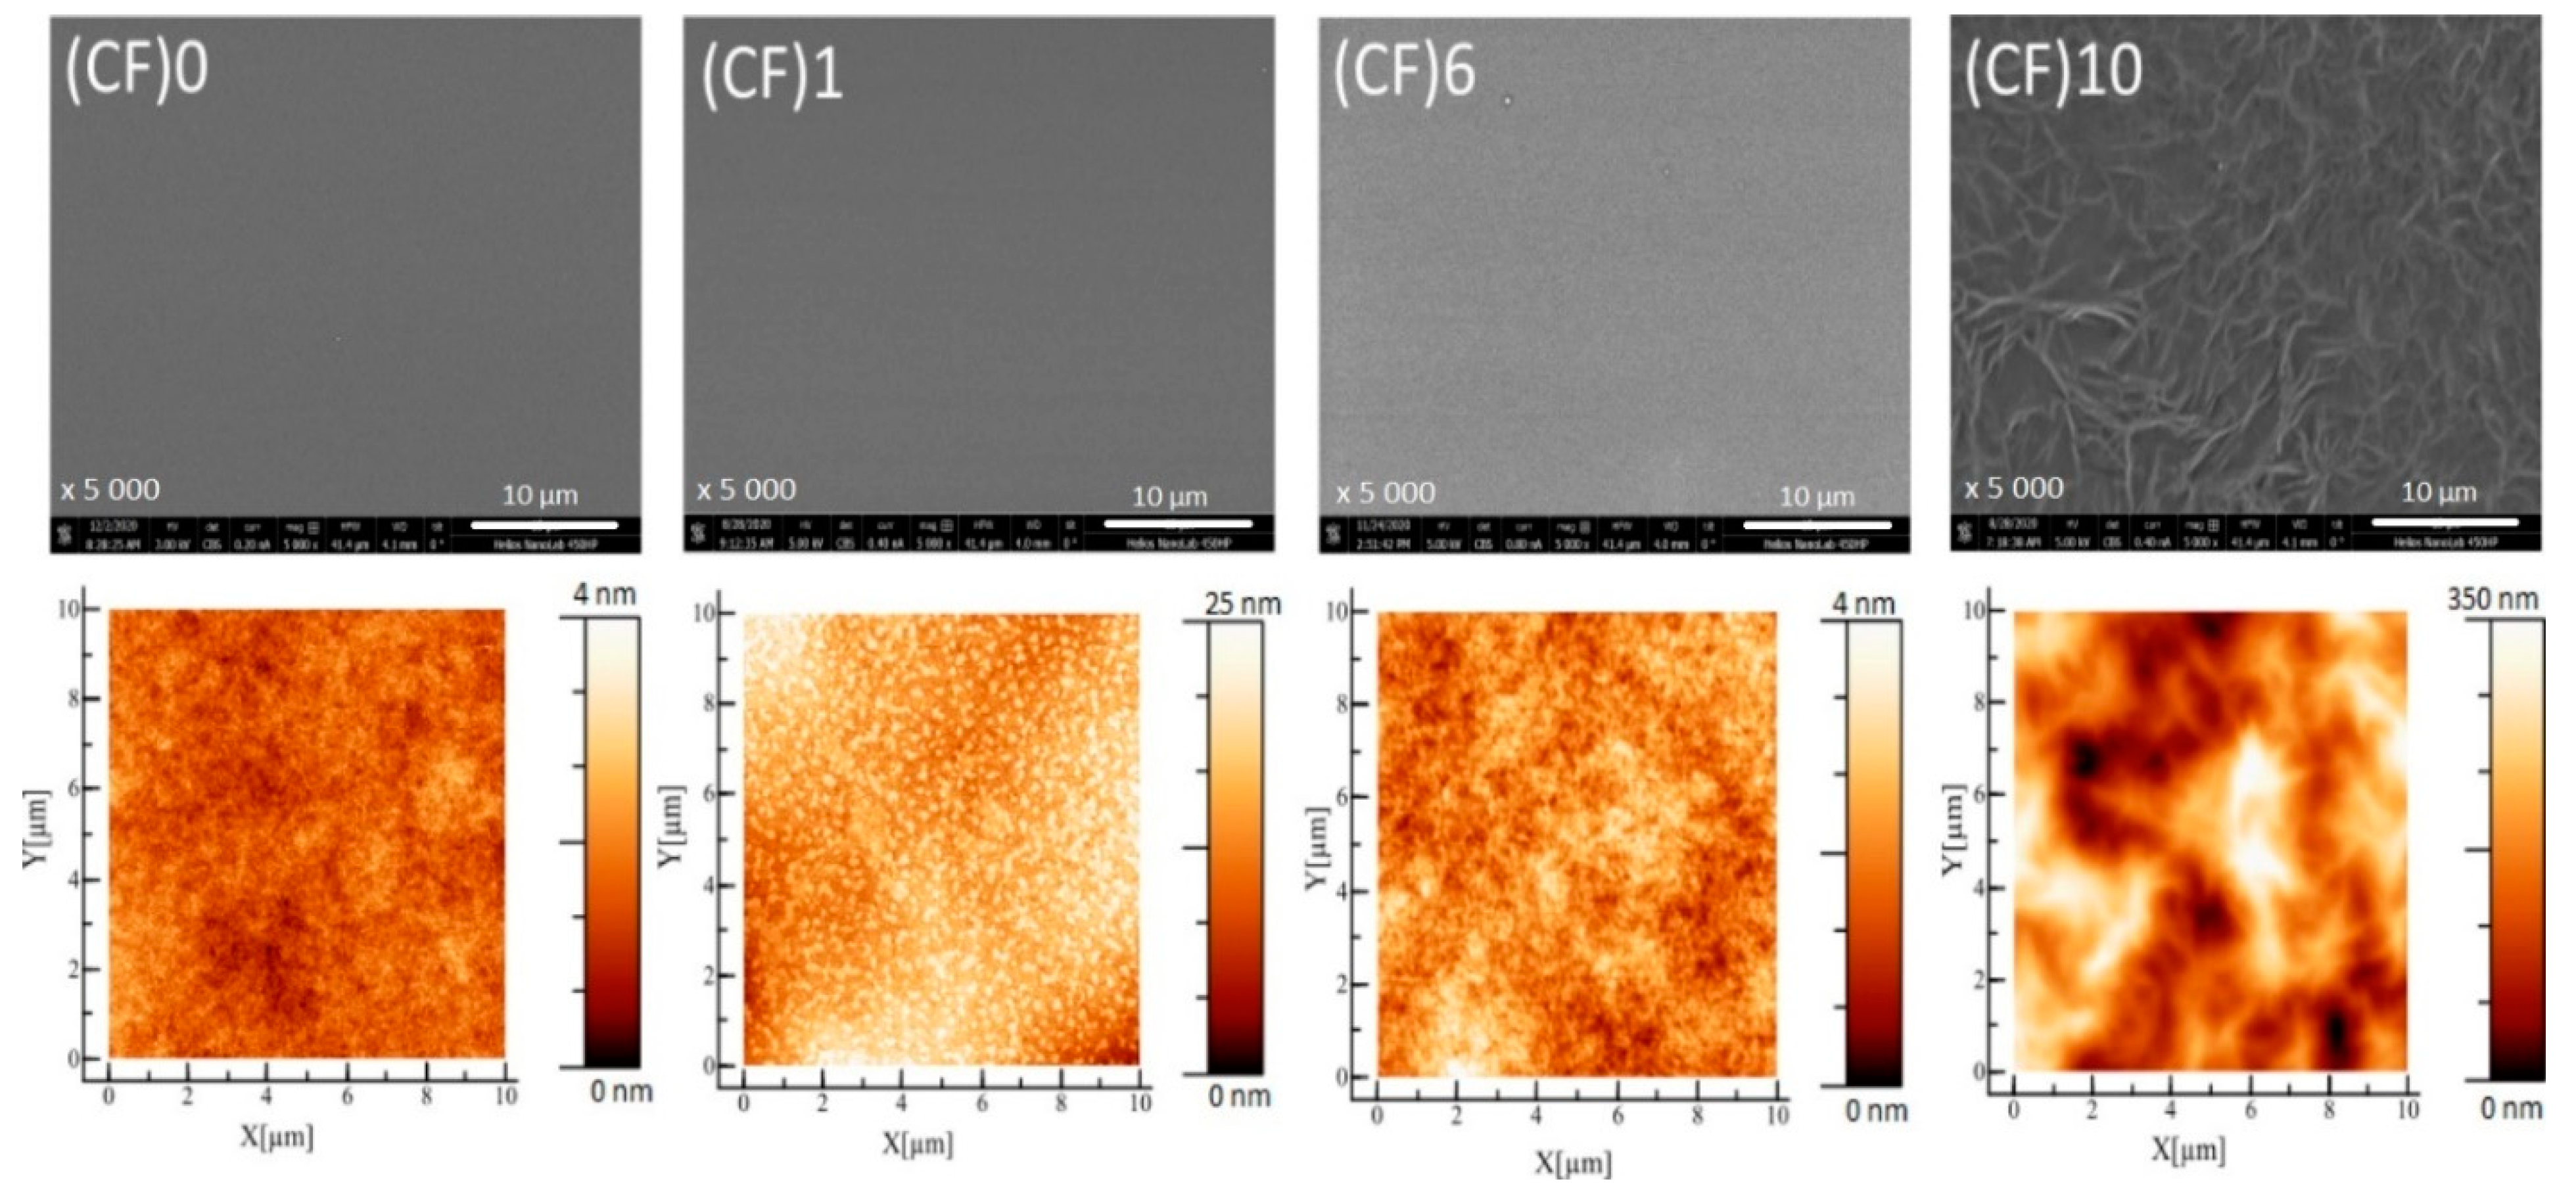
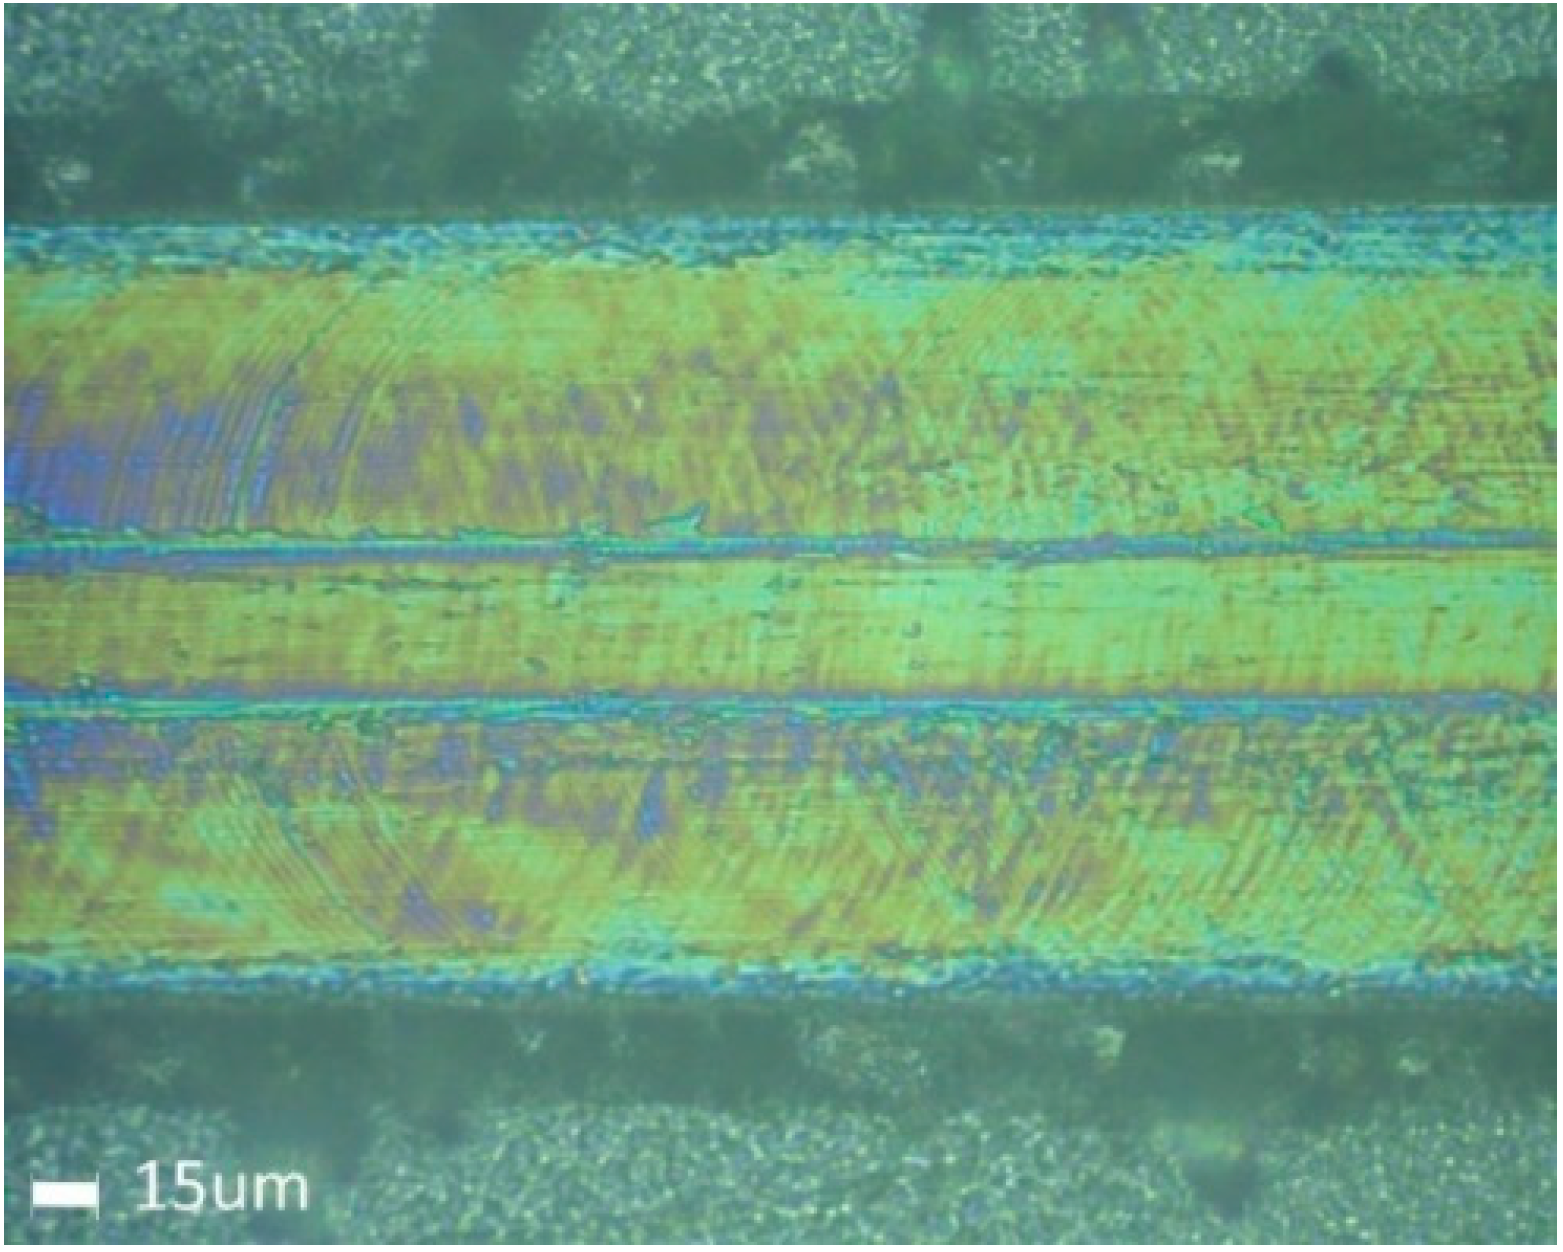
3.2. Microscopy Imaging

The sols deposited on cleaned substrates formed adhesive layers. The coatings of the hybrid organic–inorganic network effectively covered the elastic foil. SEM images (Figure 2) showed continuous layers without damages such as cracks or other possible defects. While the (CF)0, (CF)1, and (CF)6 samples exhibited homogeneous and smooth surface topology, the (CF)10 SEM image revealed a wrinkle-like structure of this coating.
The topographies of the samples measured with AFM are presented in the bottom panel of Figure 2, and the coatings’ roughness analysis in comparison to the PET foil (substrate) is presented in Table 2. Three samples showed relatively low roughness parameters in the range of 0.4 nm to 5.5 nm, and the fourth one, (CF)10, reached much higher parameters with 78.3 nm and 63.1 nm of Ra and Rq, respectively. The lowest roughness of 0.4 nm was obtained for the (CF)6 sample and it was comparable to (CF)0 (a reference sample not modified by fluoroalkyl chains) with the Ra parameter equal to 0.9 nm. The same parameter for (CF)1 had a higher value equal to 5.5 nm. Table 2 also collects the thickness of all investigated materials as determined from the profilometer measurements. One may note that the samples had a similar thickness equal to 1.50 µm. Only the (CF)6 sample showed a greater thickness than the others, which was 1.70 µm.

3.3. Wettability and Surface Energy Properties

The water contact angle measurements performed for the samples showed that all fabricated samples had hydrophobic character (Table 2). The measured WCA value for the substrate was 80°, while for the reference coating named (CF)0 it reached 103°. A similar value was obtained for (CF)1—a sample with short organic chains and one fluorine-containing carbon in the structure. With increasing the length of the fluoroalkyl chain, higher hydrophobic properties of the samples were achieved, reaching the WCA equal to 108° and 113° for (CF)6 and (CF)10, respectively.
The highest value of the SFE was shown for the untreated polymeric substrate (PET foil), reaching 31.50 mN/m. With the increase in the WCA, the SFE decreased and the surface revealed the hydrophobic character. The (CF)10 sample had the lowest SFE equal to 10.78 mN/m. It is correlated with the presence of the longest nonpolar (fluoroalkyl chain) groups on the coating’s surface. The (CF)6 sample showed a similar value of SFE to (CF)10 but, at the same time, its WCA value was 5 degrees lower than for (CF)10.

3.4. TMA Results

The permeation of polymeric materials depends on a few factors affecting gas diffusion, and one of those is glass transition temperature. There is a correlation between the glass transition temperature and the free volume in the polymer structure. In the inorganic silicate polymers, the fraction of the free volume increases with the decreasing Tg [44,45,46]. Assuming that the substrate is 175 µm thick and the layer has a thickness of 2 µm, the layer constitutes about 1% of the modified system. Despite the small contribution of the coating, the samples showed slight changes in the temperature of the phase transitions. Table 3 collects the glass transition temperature (Tg) with expansion coefficient and elongation in specific temperature ranges. For all coated samples, the glass transition temperature was higher than in the case of bare PET foil. The highest value (86.8 °C) was recorded for the (CF)6 sample. All coatings showed a significant decrease in the coefficient of thermal expansion, with the lowest value obtained for (CF)1 (31 ppm/K vs. 115 ppm/K for PET). The last determined parameter of the foil, i.e., elongation in the selected temperature range, did not change when PET was covered with the (CF)6 layer but decreased twice (or more) for three other coatings.

3.5. Oxygen Permeability

In the oxygen permeability tests, variation in the pressure in a chamber covered by the tested samples was registered. The dependence dp/dt allowed us to determine the value of the oxygen transmission rate for the samples. The oxygen permeability coefficients were calculated and those results are given in Table 3. The oxygen permeability coefficient for the PET substrate was 8.48 cm3/(m2·day) and it decreased for all the tested samples, reaching the lowest value of 2.05 cm3/(m2·day) for (CF)10.

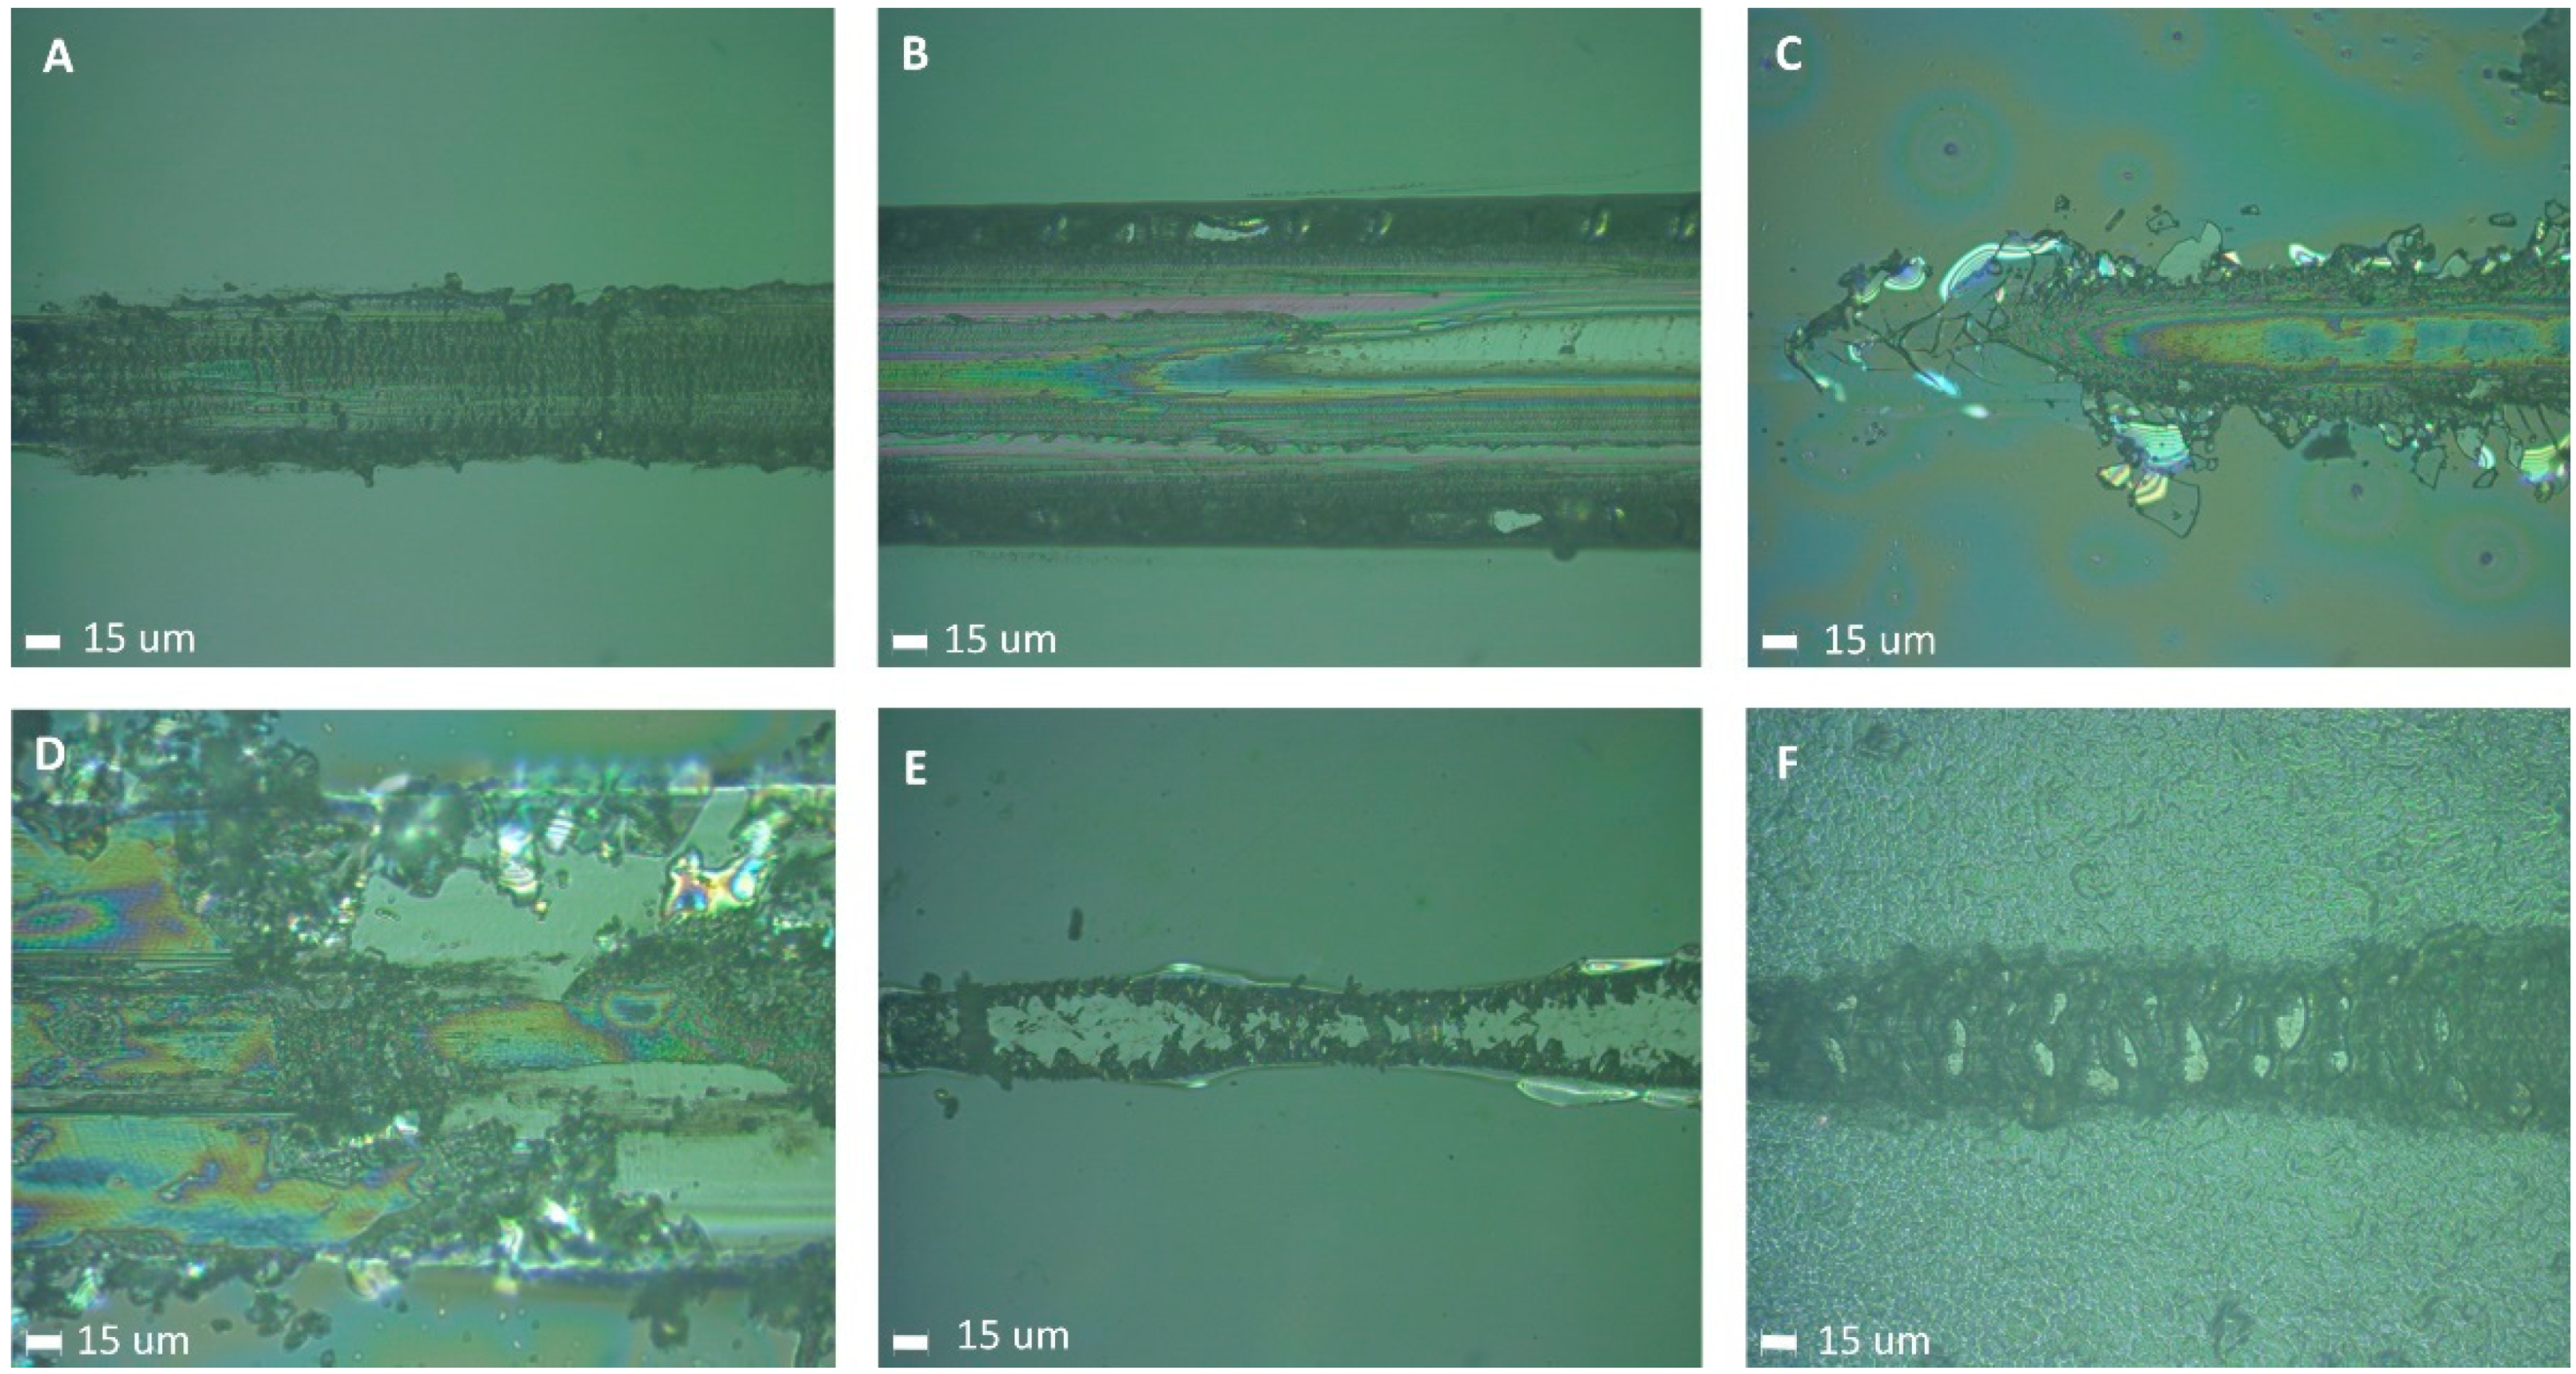
3.6. Adhesion and Scratch Resistance

The adhesion and scratch resistance were determined by the scratch test. The critical loads were distinguished as Lc1—first decohesion of coating, Lc2—first adhesive failure in the form of chipping, and Lc3—coating detachment in the middle of the scratch track. Not all types of critical loads were observed for every coating. Some types of coating destruction were observed from the beginning of the scratch track. The values of subsequent critical loads for different materials are presented in Table 4, and forms of coating destruction for individual critical loads are presented in Figure 3.
All samples were characterized by relatively low scratch resistance—decohesion of the coating in the form of cracking was observed for most of them from the beginning of the scratch track. For the (CF)0 coating, cracks across the scratch track were observed from the beginning of the loading, as shown in Figure 3A. For the coatings with worse adhesion, coating detachment in the case of (CF)6 (Figure 3E) and cracking connected with chipping in the case of (CF)10 (Figure 3F) were observed from the beginning of the scratch track. Exceptional behavior, different from the other samples, was observed for (CF)1, where the first coating cracking and chipping (Figure 3C) were observed at loads of 0.12 N and 0.17 N, respectively. The observations of the way of coating destruction showed additionally that this sample exhibited a brittle type of cracking (Figure 3C). However, the (CF)1 sample showed the best adhesion and scratch resistance overall, and the lowest adhesion to the substrate was exhibited by (CF)6 (Figure 3E and Table 4).
The coating detachment of (CF)0 was observed in a form of plastic abrasion of the coating as presented in Figure 3B, while the (CF)1 coating peeled off in a brittle way, resulting in the formation of sharp edges as shown in Figure 3D. The (CF)6 coating, showing the worst adhesion among the samples, was fully detached from the beginning of the scratch track, as mentioned before. Very specific behavior was observed for the (CF)10 sample, which was cracking and chipping from the beginning of the scratch track (Figure 3F). With the increase in the applied load, this coating stopped chipping and its total detachment did not occur. The phenomenon looks like pressing the coating into the substrate, as presented in Figure 4. Thanks to this effect, the (CF)10 coating showed the best resistance to detachment from the substrate. For this sample, total detachment of the coating was not observed up to 15 N. The samples were not tested for higher loads because substrate destruction was observed for a further increase in the load. Finally, the (CF)1 coating exhibited the most fragile way of destruction.

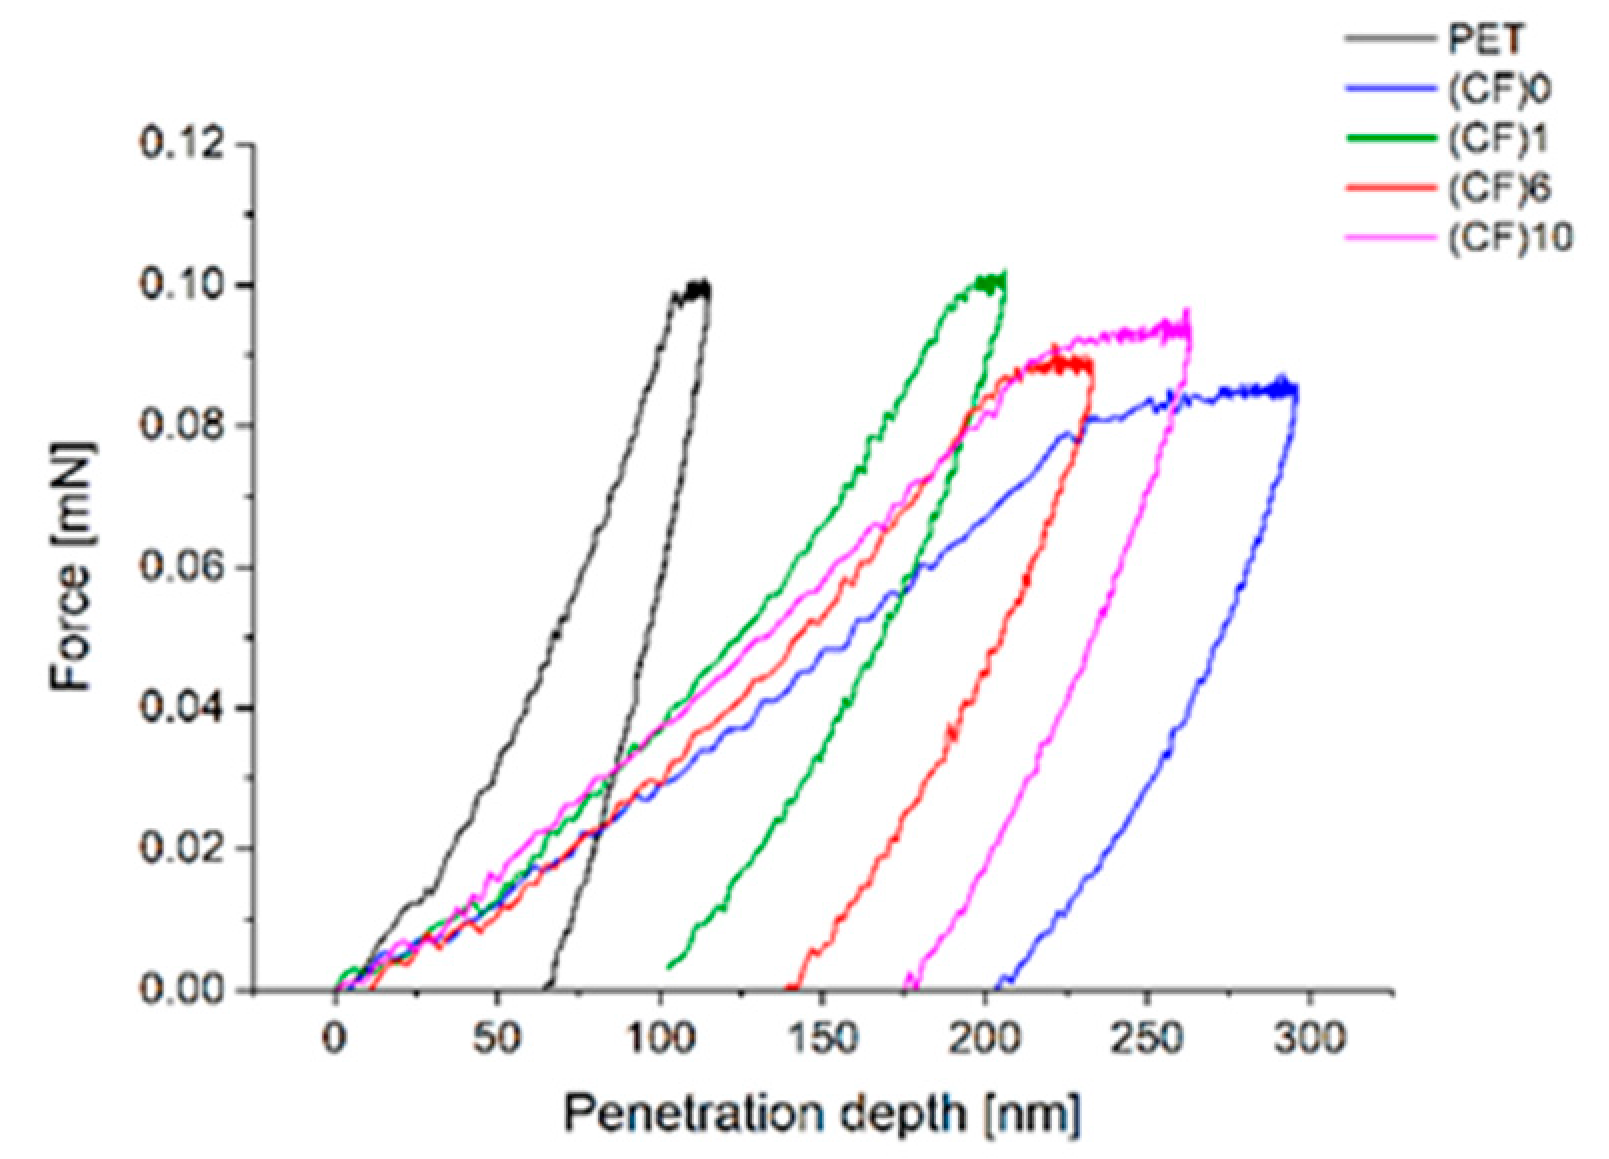
3.7. Nanoindentation

The thicknesses of the obtained coatings were high enough to conduct the nanoindentation tests for coating hardness evaluation. The sample loading and unloading curves for subsequent materials are presented in Figure 5. The mean values of Martens hardness (MH) and the maximum penetration depth reached by the indenter during testing are presented in Figure 6. Due to the fact that the indents exceeded more than 10% of the coating thickness (as presented in Figure 6B), the calculated hardness values give information about the overall system, i.e., the substrate plus the coating, not the coating itself. It can be observed that in the submicron scale, the examined coated materials became softer than the uncoated PET substrate. The addition of the fluoroalkyl groups increased the Martens hardness of the material in comparison to the (CF)0 coating without fluorine substituted carbons. However, the increase in the fluoroalkyl groups’ length resulted in the Martens hardness’ decline. Both Martens hardness and maximum penetration depth analyses suggested that the most homogenous from the mechanical point of view is the (CF)1 coating, for which these two values showed a very low dispersion—even much smaller than observed for the substrate.

4. Discussion

Based on the presence of characteristic bands in the FTIR spectra, one can conclude that in the fabricated layers organo-silicate networks have been formed, which include organic chains derived from organosilane precursors. All samples’ structure was based on the silica oxide network enriched by the isooctyl group; therefore, all the spectra showed the presence of silica oxide bridges as well as alkyl and silanol groups. The low intensity of the band around 3400 cm−1 (Figure S2) indicated a much lower content of hydroxyl groups (originating from the silanol groups or adsorbed water) in comparison to silica materials heat-treated at low-temperature [47,48]. Moreover, the band at 1630 cm−1, related to the –OH deformation vibrational mode of adsorbed water molecules, was very weak in the cases of (CF)0, (CF)1, and (CF)6, and not observed for (CF)10. In the latter case, the band at 3400 cm−1 is not present either, indicating a significant reduction in hydroxyls and adsorbed water molecules in fluorinated networks.
The FTIR spectra also confirmed the presence of the introduced fluoroalkyl groups in (CF)6 and (CF)10 (Figure 1) but the C–F vibration modes were not seen in the case of (CF)1, indicating a much lower concentration of the terminal –CF3 groups in this coating material. However, in the other two samples, when the number of fluorinated carbons in the alkyl chain increased, noticeable changes in the FTIR characteristics were observed. In comparison to (CF)0, the presence of the fluorinated groups can be confirmed by the following absorption bands located in the ranges: 520–730 cm−1 (bands assigned to the –CF3 rocking and the –CF2 wagging vibrations) and 1120–1250 cm−1 (the C–F stretching vibrations) [41,49,50]. The rocking bands were stronger in the case of (CF)10, which had a higher content of fluorinated groups. Moreover, the longer fluorinated chain in this sample caused a characteristic shift of the –CF2 symmetric stretching vibrations’ bands toward a higher wavenumber (from 1142 cm−1 as in (CF)6 to 1149 cm−1) [50]. Eventually, the spectrum of (CF)10 was distinguished by two strong bands related to the stretching vibrations observed at 1149 and 1204 cm−1.
Hydrophobic (and especially super-hydrophobic) coatings have attracted great attention because they can be useful in packaging, helping to avoid adhering liquids to the inside walls of containers. The hydrophobic properties of the obtained layers can be designed by using different fluoroalkyl-silane precursors. The non-fluorinated organically modified silica network with –CH2– and –CH3 groups ((CF)0) already demonstrated a much higher water contact angle (103°) than silica and polymeric foil used as a substrate (Table 2). A similar WCA was observed for the (CF)1 sample derived from the precursor with one fluorinated carbon in the structure (Table S1), but at the same time, lower surface free energy was recorded for this coating. Longer fluoroalkyl chains introduced a further increase in the WCA and decrease in the SFE values. The obtained SFE around 10.8 mN/m of the silica coatings with long polyfluoroalkyl chains is very low—lower than in the case of commercial polytetrafluoroethylene, where it is equal to 18.0 mN/m [51], or polyfluoroalkyl-silica coatings reported by Agustín-Sáenz et al. with the SFE in the range of 15–20 mN/m [52]. In comparison, according to Nishino et al. [53], the lowest surface free energy of any material based on the hexagonal closed alignment of –CF3 groups on the surface is 6.7 mN/m. The (CF)6 and (CF)10 samples showed similar SFE but the WCA was higher for the latter coating and reached 113°. Such a value is similar to polytetrafluoroethylene [51] and polydimethylsiloxane coated with PFOTES (112°) [53], but higher than in the case of other polyfluoroalkyl-silica porous coatings obtained with PFDDTES precursor (108°) [54] or a layer of hybrid coating based on silica particles modified by methyl groups (108.7°) [55]. Furthermore, it is close to the values obtained for silica coatings after vapor phase surface treatment causing a modification of the surface with alkyl groups (109°–120°) [56]. The more hydrophobic character of (CF)10 can be caused by the significantly reduced content of hydroxyl groups in this sample’s structure. On the other hand, the topography strongly affects the wetting of the surface and a rough surface (like in the case of (CF)10) presents more hydrophobic properties [57,58].
The highest Ra of 78.3 nm was observed for the (CF)10 sample, which has specific surface topography visible in the SEM image (Figure 2). However, there was no obvious direct relationship between the fluoroalkyl chain length and the roughness parameters. The (CF)0 and (CF)6 samples showed roughness parameters below 1 nm that were lower than for the PET foil (Table 2). Such a parameter is typical for sol–gel-derived silica coatings and is similar to polyfluoroalkyl-silica porous coatings on glass substrates with antireflection properties [54,59,60]. The smooth surfaces of these materials could be particularly interesting in the application as covering and packaging materials.
The thermal expansion coefficient is an important parameter in polymer materials, where polymers change their dimensions with increasing temperature. It is also crucial in coatings deposited on polymeric substrates dedicated for packaging materials often stored in changing thermal conditions. The difference between the substrate and coating materials is crucial due to the individual phases (coating and substrate), which leads to differential thermal contraction and expansion stresses during cooling and heating [61]. The expansion coefficient is significant in silica-based coatings [62], adhesives [63], and coatings for optical fiber sensors [64]. Here, the highest thermal expansion coefficient was observed for the substrate itself and the lowest for the (CF)1 sample. With the increasing number of fluoric atoms in the final coating structure, the thermal expansion coefficient was increasing. Consolati investigated the relation between free volume fraction and thermal expansion in perfluoropolyesters and showed that with the decreasing free volumes, the thermal expansion coefficient increased [65]. In our work, we observed a similar relationship. The dimensional changes in our samples were described by elongation, where the highest elongation was recorded for the substrate (PET foil) and the (CF)6 sample. On the contrary, the (CF)1 and (CF)10 coating samples showed the lowest elongation.
The glass transition temperature in polymers corresponds to the mobility of the polymer chains, and more rigid regions in the polymer structure cause an increase in the Tg temperature [66]. In other words, when the free volume in the amorphous structure increases, the Tg decreases. This value has an influence on gases’ permeation through polymeric materials dedicated for packaging structures, thus, TMA analysis was used for further understanding the correlation of these parameters. The Tg of the investigated systems increased after layers’ deposition on the PET foil, indicating that more rigid structures were formed. However, no strict dependence of the Tg on the fluoroalkyl chain length was observed. Looking at the Tg values (Table 3), one can assume that the bigger –C8F13H4 group in (CF)6 than –C3F3H4 in (CF)1 might have reduced the chain mobility, whereas the longer –C12F21H4 group in (CF)10 could induce a more flexible backbone chain, causing the lowering of the Tg of this structure in comparison to (CF)6 but maintaining the same level as for (CF)0 [67]. On the other hand, the higher Tg for the CF(6) sample may also be related to the higher thickness of the coating [67,68]. A similar phenomenon has been observed in other silica hybrids [69,70]. This can be explained due to complex molecular dynamics including both large enhancement and drastic suppression of molecular motion in the polymeric hybrids. Such molecular dynamics governing Tg are related not only to the polymeric chain length but also to the chemical structure, hybrid composition, homopolymerization, and phase separation [46,69,70].
Eventually, the permeation of gases through the polymeric structure also depends on the free volume and it should decrease at higher Tg. Such a correlation between the Tg and the OTR values was recorded looking at the samples: PET—(CF)0/(CF)1—(CF)6. However, (CF)10 had a lower OTR despite lower Tg. Thus, the changes in the free volume fraction were not the crucial parameter in the oxygen permeability of the obtained coatings. The OTR of the reference coating sample (CF)0 was lower than for the substrate and similar to the final structure of (CF)1. The oxygen transmission rate decreased further with the increasing fluoroalkyl chain length in the coatings’ structure. In the case of the (CF)10 sample, a fourfold reduction in the oxygen permeability coefficient in comparison to the bare PET foil (2.0 vs. 8.5 cm3/(m2·day·atm)) was achieved. A dependence of the oxygen permeation on the water contact angle and the surface free energy of the coatings might also be indicated, since it decreased with increasing WCA and was the lowest for the samples with low SFE. The influence of other parameters, such as roughness and diffusion path, cannot be excluded from factors modifying adsorption and diffusion of the gas molecules through the barrier. With the higher roughness, the specific surface area increased, and a higher amount of gas could diffuse into the polymer structure [71]. The barrier property of PET foil was enhanced by Wang et al. due to the elongation of the diffusion path [72]. Furthermore, the increase in the diffusion path by the polymer structure combined with the synergistic effect of hydrophobicity increased the barrier properties as well [72]. In the studied structures, the roughness was not the key parameter reducing the permeability rate, but long fluoroalkyl chains increasing the diffusion path and the hydrophobic character of the surface of the (CF)10 sample might have significantly modified the barrier properties of the coating.
The best scratch resistance was observed for the (CF)1 sample, which can suggest that the addition of short fluoroalkyl groups increased the cohesion and adhesion of the coating. Total detachment of this coating appeared at a load almost four times higher than in the case of (CF)0. However, when the length of the fluorinated group increased, the positive effect disappeared, which can be connected with the decrease in the surface energy of the materials containing a lot of fluorinated carbons. For (CF)0 and (CF)10, cracking and chipping of the coating were observed from the beginning of the scratch track, i.e., with a load of 0.03 N or lower. For the (CF)6 sample, even total detachment of the coating was observed from the beginning of the scratch track. The increase in the fluoroalkyl group length caused also a decrease in the Martens hardness of the substrate-coating systems. However, still, Martens hardness for the materials with the longest functionalized chains was higher than for the non-fluorinated sample ((CF)0), but much lower than for the uncoated PET substrate.

5. Conclusions

The use of silica precursors organically modified with fluorinated chains of different lengths allowed for the investigation of the relationship between the chemical structure of the coatings and their performance properties. One can easily observe that the polyfluoroalkyl chain length played an important role in the layers’ properties, altering, first of all, the wettability and the surface free energy. With longer chains in the coating structure, the hydrophobicity (water contact angle) increased and the SFE values decreased at the same time. Additionally, the roughness, glass transition temperature, and thermal expansion coefficient changed with different precursors. The correlation of these parameters with the chain length was not evident, but the glass transition temperature increased and the coefficient of thermal expansion significantly decreased when the foil was covered with the coatings. The decreasing oxygen transmission rate was clearly exhibited with the increase in the fluoroalkyl chain length in the structures. However, it was difficult to directly correlate the adhesion of the coating with the precursor used. Considering all the results, the (CF)1 sample with one fluorinated carbon in the layer structure would meet many criteria of the functional coating, but at the same time, it achieved the lowest reduction in the oxygen permeability coefficient. Good barrier properties were shown for the (CF)10 coating, but its mechanical properties should be improved.

Supplementary Materials

The following are available online at https://www.mdpi.com/article/10.3390/coatings11050573/s1, Equation S1: The Oxygen Transmission Rate Equation, Table S1: Silica precursors used for syntheses, Figure S1: Scheme of fabrication process and testing of coatings deposited on PET foil with (CF)10 picture, Figure S2: FTIR spectra in the whole measurement range of all coatings and bare PET foil.

Author Contributions

Conceptualization, K.S., A.S. and A.L.; methodology, K.S. and A.S.; formal analysis, K.S., A.L. and A.S.; investigation of most of the measurements, K.S.; investigation of mechanical properties, A.S.; writing—original draft preparation, K.S. and A.S.; writing—review and editing, T.N.L.T., J.K., A.B. and A.L.; visualization, K.S. and A.S.; supervision, A.L., A.B. and J.K.; funding acquisition, A.L., K.S. and A.B. All authors have read and agreed to the published version of the manuscript.

Funding

This research was funded by the Ministry of Science and Higher Education in Poland within “Application PhD programme” No. 7/DW/2017/01/1 (K.S.). The bilateral exchange of scientists was funded by CNR and PAS within the “Flexible Photonics” project for years 2020–2022.

Institutional Review Board Statement

Not applicable.

Informed Consent Statement

Not applicable.

Data Availability Statement

The data presented in this study are available on request from the corresponding author. The data are not publicly available due to privacy.

Acknowledgments

The authors wish to thank Sandeep Gorantla from Structures and Materials Research Laboratory at Łukasiewicz Research Network—PORT Polish Center for Technology Development for preparation of the graphical abstract.

Conflicts of Interest

The authors declare no conflict of interest.

References

  1. World Economic Forum; Ellen MacArthur Foundation; McKinsey Company. The New Plastics Economy: Rethinking the Future of Plastics. 2016. Available online: https://www.ellenmacarthurfoundation.org/publications/the-new-plastics-economy-rethinking-the-future-of-plastics (accessed on 23 March 2021).
  2. Katiyar, V.; Gaur, S.S.; Pal, A.K.; Kumar, A. Properties of plastics for packaging applications. In Polymers for Packaging Applications; Alavi, S., Thomas, S., Sandeep, K.P., Kalarikkal, N., Varghese, J., Yaragalla, S., Eds.; Apple Academic Press: Palm Bay, FL, USA, 2014; pp. 3–5. [Google Scholar]
  3. Kumar, R.; Münstedt, H. Silver ion release from antimicrobial polyamide/silver composites. Biomaterials 2005, 26, 2081–2088. [Google Scholar] [CrossRef] [PubMed]
  4. Azizi-Lalabadi, M.; Ehsani, A.; Divband, B.; Alizadeh-Sani, M. Antimicrobial activity of titanium dioxide and zinc oxide nanoparticles supported in 4A zeolite and evaluation the morphological characteristic. Sci. Rep. 2019, 9, 17439. [Google Scholar] [CrossRef] [Green Version]
  5. Bautista, L.; Molina, L.; Niembro, S.; García, J.M.; López, J.; Vílchez, A. Coatings and inks for food packaging including nanomaterials. In Emerging Nanotechnologies in Food Science; Elsevier BV: Amsterdam, The Netherlands, 2017; pp. 149–173. [Google Scholar]
  6. Rovera, C.; Ghaani, M.; Farris, S. Nano-inspired oxygen barrier coatings for food packaging applications: An overview. Trends Food Sci. Technol. 2020, 97, 210–220. [Google Scholar] [CrossRef]
  7. Chatham, H. Oxygen diffusion barrier properties of transparent oxide coatings on polymeric substrates. Surf. Coat. Technol. 1996, 78, 1–9. [Google Scholar] [CrossRef]
  8. Choudalakis, G.; Gotsis, A. Free volume and mass transport in polymer nanocomposites. Curr. Opin. Colloid Interface Sci. 2012, 17, 132–140. [Google Scholar] [CrossRef]
  9. Low, Z.-X.; Budd, P.M.; McKeown, N.B.; Patterson, D.A. Gas permeation properties, physical aging, and its mitigation in high free volume glassy polymers. Chem. Rev. 2018, 118, 5871–5911. [Google Scholar] [CrossRef] [PubMed]
  10. Massey, L.K. Permeability Properties of Plastics and Elastomers; Plastics Design Library/William Andrew Publishing: Norwich, CT, USA, 2003; pp. 1–18. [Google Scholar]
  11. Rezaei, M.; Mohseni, M.; Yahyaei, H. A study on water and oxygen permeability of BOPP coated with hybrid UV cured nanocoatings. Prog. Org. Coat. 2016, 99, 72–79. [Google Scholar] [CrossRef]
  12. Deshwal, G.K.; Panjagari, N.R.; Alam, T. An overview of paper and paper based food packaging materials: Health safety and environmental concerns. J. Food Sci. Technol. 2019, 56, 4391–4403. [Google Scholar] [CrossRef]
  13. Garcia, C.V.; Shin, G.H.; Kim, J.T. Metal oxide-based nanocomposites in food packaging: Applications, migration, and regulations. Trends Food Sci. Technol. 2018, 82, 21–31. [Google Scholar] [CrossRef]
  14. Kaiser, K.; Schmid, M.; Schlummer, M. Recycling of polymer-based multilayer packaging: A Review. Recycling 2017, 3, 1. [Google Scholar] [CrossRef] [Green Version]
  15. Morris, B.A. The Science and Technology of Flexible Packaging: Multilayer Films from Resin and Process to End Use, 1st ed.; Wiliam Andrew: Oxford, UK, 2017; pp. 104–115. [Google Scholar]
  16. Wang, J.; Gardner, D.J.; Stark, N.M.; Bousfield, D.W.; Tajvidi, M.; Cai, Z. Moisture and oxygen barrier properties of cellulose nanomaterial-based films. ACS Sustain. Chem. Eng. 2018, 6, 49–70. [Google Scholar] [CrossRef]
  17. NanoPack; NanoSealTM. Barrier Coating, OPP Barrier Coated Film, Polypropylene Film, Liquid Coating. Available online: http://www.nanopackinc.com/products.asp (accessed on 1 March 2021).
  18. Saes Coated Films. Trasparent Oxygen Barrier. Available online: https://www.saescoatedfilms.com/en/transparent-oxygen/ (accessed on 1 March 2021).
  19. Gholami, R.; Ahmadi, E.; Farris, S. Shelf life extension of white mushrooms (Agaricus bisporus) by low temperatures conditioning, modified atmosphere, and nanocomposite packaging material. Food Packag. Shelf Life 2017, 14, 88–95. [Google Scholar] [CrossRef] [Green Version]
  20. Farris, S.; Introzzi, L.; Fuentes-Alventosa, J.M.; Santo, N.; Rocca, R.; Piergiovanni, L. Self-assembled pullulan–silica oxygen barrier hybrid coatings for food packaging applications. J. Agric. Food Chem. 2012, 60, 782–790. [Google Scholar] [CrossRef] [Green Version]
  21. Nicole, L.; Rozes, L.; Sanchez, C. Integrative approaches to hybrid multifunctional materials: From multidisciplinary research to applied technologies. Adv. Mater. 2010, 22, 3208–3214. [Google Scholar] [CrossRef] [PubMed]
  22. Zhou, H.; Wang, H.; Niu, H.; Gestos, A.; Lin, T. Robust, Self-healing superamphiphobic fabrics prepared by two-step coating of fluoro-containing polymer, fluoroalkyl silane, and modified silica nanoparticles. Adv. Funct. Mater. 2013, 23, 1664–1670. [Google Scholar] [CrossRef]
  23. Wang, S.; Ye, X.; Zhang, H.; Qian, Z.; Li, Q.; Wu, Z.; Li, S. Superhydrophobic silane/fluorinated Attapulgite@SiO2 composite coatings on magnesium alloy for corrosion protection. ChemistrySelect 2020, 5, 10329–10338. [Google Scholar] [CrossRef]
  24. Oldani, V.; Sergi, G.; Pirola, C.; Sacchi, B.; Bianchi, C.L. Sol-gel hybrid coatings containing silica and a perfluoropolyether derivative with high resistance and anti-fouling properties in liquid media. J. Fluor. Chem. 2016, 188, 43–49. [Google Scholar] [CrossRef]
  25. Arianpour, F.; Farhadi, S.; Farzaneh, M. Effect of heterogeneity on hydro/ice-phobic properties of alkylsilane/fluoro-alkylsilane-based coatings on Al substrates. J. Coat. Technol. Res. 2017, 14, 267–275. [Google Scholar] [CrossRef]
  26. Ke, C.; Zhang, C.; Wu, X.; Jiang, Y. Highly transparent and robust superhydrophobic coatings fabricated via a facile sol-gel process. Thin Solid Films 2021, 723, 138583. [Google Scholar] [CrossRef]
  27. Hu, J.; Fang, Z.; Huang, Y.; Lu, J. Fabrication of superhydrophobic surfaces based on fluorosilane and TiO2/SiO2 nanocomposites. Surf. Eng. 2021, 37, 271–277. [Google Scholar] [CrossRef]
  28. Nguyen, H.H.; Tieu, A.K.; Wan, S.; Zhu, H.; Pham, S.T.; Johnston, B. Surface characteristics and wettability of superhydrophobic silanized inorganic glass coating surfaces textured with a picosecond laser. Appl. Surf. Sci. 2021, 537, 147808. [Google Scholar] [CrossRef]
  29. Owens, D.K.; Wendt, R.C. Estimation of the surface free energy of polymers. J. Appl. Polym. Sci. 1969, 13, 1741–1747. [Google Scholar] [CrossRef]
  30. Startek, K.; Marczak, J.; Lukowiak, A. Oxygen barrier enhancement of polymeric foil by sol–gel-derived hybrid silica layers. Polymer 2020, 195, 122437. [Google Scholar] [CrossRef]
  31. Babonneau, F.; Thorne, K.; MacKenzie, J.D. Dimethyldiethoxysilane/tetraethoxysilane copolymers: Precursors for the silicon-carbon-oxygen system. Chem. Mater. 1989, 1, 554–558. [Google Scholar] [CrossRef]
  32. Kim, M.T. Deposition behavior of hexamethydisiloxane films based on the FTIR analysis of Si–O–Si and Si–CH3 bonds. Thin Solid Films 1997, 311, 157–163. [Google Scholar] [CrossRef]
  33. Almeida, R.M.; Marques, A.C. Characterization of sol–gel materials by infrared spectroscopy. In Handbook of Sol-Gel Science and Technology; J.B. Metzler: Stuttgart, Germany, 2018; pp. 1121–1151. [Google Scholar]
  34. Li, Y.; Men, X.; Zhu, X.; Ge, B.; Chu, F.; Zhang, Z. One-step spraying to fabricate nonfluorinated superhydrophobic coatings with high transparency. J. Mater. Sci. 2016, 51, 2411–2419. [Google Scholar] [CrossRef]
  35. Criado, M.; Sobrados, I.; Sanz, J. Polymerization of hybrid organic–inorganic materials from several silicon compounds followed by TGA/DTA, FTIR and NMR techniques. Prog. Org. Coat. 2014, 77, 880–891. [Google Scholar] [CrossRef]
  36. Sanaeishoar, H.; Sabbaghan, M.; Mohave, F. Synthesis and characterization of micro-mesoporous MCM-41 using various ionic liquids as co-templates. Microporous Mesoporous Mater. 2015, 217, 219–224. [Google Scholar] [CrossRef]
  37. Fidalgo, A.; Ilharco, L.M. The defect structure of sol–gel-derived silica/polytetrahydrofuran hybrid films by FTIR. J. Non-Cryst. Solids 2001, 283, 144–154. [Google Scholar] [CrossRef]
  38. Chen, X.; Wen, S.; Feng, T.; Yuan, X. High solids organic-inorganic hybrid coatings based on silicone-epoxy-silica coating with improved anticorrosion performance for AA2024 protection. Prog. Org. Coat. 2020, 139, 105374. [Google Scholar] [CrossRef]
  39. Latthe, S.S.; Imai, H.; Ganesan, V.; Rao, A.V. Superhydrophobic silica films by sol–gel co-precursor method. Appl. Surf. Sci. 2009, 256, 217–222. [Google Scholar] [CrossRef]
  40. Purcar, V.; Rădițoiu, V.; Rădițoiu, A.; Manea, R.; Raduly, F.M.; Ispas, G.C.; Frone, A.N.; Nicolae, C.A.; Gabor, R.A.; Anastasescu, M.; et al. Preparation and characterization of some sol-gel modified silica coatings deposited on polyvinyl chloride (PVC) substrates. Coatings 2020, 11, 11. [Google Scholar] [CrossRef]
  41. Li, K.; Zeng, X.; Li, H.; Lai, X. Fabrication and characterization of stable superhydrophobic fluorinated-polyacrylate/silica hybrid coating. Appl. Surf. Sci. 2014, 298, 214–220. [Google Scholar] [CrossRef]
  42. Jeong, K.-M.; Park, S.S.; Nagappan, S.; Min, G.; Zhang, Y.; Qu, M.; Zhang, Y.; Ha, C.-S. Highly transparent, organic-inorganic hybrid UV-curable coating materials with amphiphobic characteristics. Prog. Org. Coat. 2019, 134, 323–332. [Google Scholar] [CrossRef]
  43. Brassard, J.-D.; Sarkar, D.K.; Perron, J. Synthesis of monodisperse fluorinated silica nanoparticles and their superhydrophobic thin films. ACS Appl. Mater. Interfaces 2011, 3, 3583–3588. [Google Scholar] [CrossRef] [Green Version]
  44. Kazancioglu, M.; Lehman, R.; Hara, M. Inorganic silicate polymers made directly from silica using ionic liquid as ionic plasticizer: Monovalent-only system. Mater. Today Commun. 2020, 24, 101058. [Google Scholar] [CrossRef]
  45. Bley, O.; Siepmann, J.; Bodmeier, R. Importance of glassy-to-rubbery state transitions in moisture-protective polymer coatings. Eur. J. Pharm. Biopharm. 2009, 73, 146–153. [Google Scholar] [CrossRef] [PubMed]
  46. Carja, I.-D.; Serbezeanu, D.; Bruma, M.; Ronova, I.A.; Belomoina, N.M. Influence of conformational parameters on physical properties of copolyimides containing pendant diphenylphosphine oxide units. Struct. Chem. 2016, 27, 1465–1477. [Google Scholar] [CrossRef]
  47. Innocenzi, P. Infrared spectroscopy of sol–gel derived silica-based films: A spectra-microstructure overview. J. Non-Cryst. Solids 2003, 316, 309–319. [Google Scholar] [CrossRef]
  48. Ghazzal, M.N.; Kebaili, H.; Joseph, M.; De Coninck, J.; Gaigneaux, E.M. Tuning the selectivity and sensitivity of mesoporous dielectric multilayers by modifiying the hydrophobic–hydrophilic balance of the silica layer. J. Mater. Chem. 2012, 22, 22526–22532. [Google Scholar] [CrossRef]
  49. Li, Y.-S.; Vecchio, N.E.; Lu, W. Infrared and Raman spectra of (3,3,3-trifluoropropyl)trimethoxysilane, its sol and xerogel. Spectrochim. Acta Part A Mol. Biomol. Spectrosc. 2013, 105, 213–217. [Google Scholar] [CrossRef]
  50. Fukumi, A.; Shimoaka, T.; Shioya, N.; Nagai, N.; Hasegawa, T. Infrared active surface modes found in thin films of perfluoroalkanes reveal the dipole–dipole interaction and surface morphology. J. Chem. Phys. 2020, 153, 044703. [Google Scholar] [CrossRef] [PubMed]
  51. Surface Energy Data for PTFE. Polytetrafluoroethylene, CAS # 9002-84-0 Source. Direct, 2005, 1950 (9). Available online: https://www.accudynetest.com (accessed on 1 March 2021).
  52. Agustín-Sáenz, C.; Machado, M.; Tercjak, A. Polyfluoroalkyl-silica porous coatings with high antireflection properties and low surface free energy for glass in solar energy application. Appl. Surf. Sci. 2020, 509, 144864. [Google Scholar] [CrossRef]
  53. Nishino, T.; Meguro, M.; Nakamae, K.; Matsushita, A.M.; Ueda, Y. The lowest surface free energy based on –CF3 alignment. Langmuir 1999, 15, 4321–4323. [Google Scholar] [CrossRef]
  54. Basu, B.J.; Kumar, V.D.; Anandan, C. Surface studies on superhydrophobic and oleophobic polydimethylsiloxane–silica nanocomposite coating system. Appl. Surf. Sci. 2012, 261, 807–814. [Google Scholar] [CrossRef]
  55. Cai, S.; Zhang, Y.; Zhang, H.; Yan, H.; Lv, H.; Jiang, B. Sol–gel preparation of hydrophobic silica antireflective coatings with low refractive index by base/acid two-step catalysis. ACS Appl. Mater. Interfaces 2014, 6, 11470–11475. [Google Scholar] [CrossRef]
  56. Wang, X.; Zhao, H.; Cao, Y.; Su, Y.; Hui, H.; Shen, J. Surface free energy and microstructure dependent environmental stability of sol–gel SiO2 antireflective coatings: Effect of combined vapor phase surface treatment. J. Colloid Interface Sci. 2019, 555, 124–131. [Google Scholar] [CrossRef]
  57. Miller, J.D.; Veeramasuneni, S.; Drelich, J.; Yalamanchili, M.R.; Yamauchi, G. Effect of roughness as determined by atomic force microscopy on the wetting properties of PTFE thin films. Polym. Eng. Sci. 1996, 36, 1849–1855. [Google Scholar] [CrossRef]
  58. Nosonovsky, M.; Bhushan, B. Roughness optimization for biomimetic superhydrophobic surfaces. Microsyst. Technol. 2005, 11, 535–549. [Google Scholar] [CrossRef]
  59. Szczurek, A.; Babiarczuk, B.; Kubacki, J.; Papin, P.; Renault, P.; Żak, A.; Kaleta, J.; Krzak, J. Sol-gel multilayered coatings for reduction of H2 permeation. Appl. Surf. Sci. 2019, 497, 143691. [Google Scholar] [CrossRef]
  60. Adak, D.; Bhattacharyya, R.; Saha, H.; Maiti, P.S. Sol-gel processed silica based highly transparent self-cleaning coatings for solar glass covers. Mater. Today Proc. 2020, 33, 2429–2433. [Google Scholar] [CrossRef]
  61. Bartosik, M.; Holec, D.; Apel, D.; Klaus, M.; Genzel, C.; Keckes, J.; Arndt, M.; Polcik, P.; Koller, C.; Mayrhofer, P. Thermal expansion of Ti-Al-N and Cr-Al-N coatings. Scr. Mater. 2017, 127, 182–185. [Google Scholar] [CrossRef] [Green Version]
  62. Bragaglia, M.; Cacciotti, I.; Cherubini, V.; Nanni, F. Influence of organic modified silica coatings on the tribological properties of elastomeric compounds. Wear 2019, 434–435, 202987. [Google Scholar] [CrossRef]
  63. Da Silva, L. Improving bonding at high and low temperatures. In Advances in Structural Adhesive Bonding; Elsevier: Amsterdam, The Netherlands, 2010; pp. 516–546. [Google Scholar]
  64. Li, C.; Yang, W.; Wang, M.; Yu, X.; Fan, J.; Xiong, Y.; Yang, Y.; Li, L. A review of coating materials used to improve the performance of optical fiber sensors. Sensors 2020, 20, 4215. [Google Scholar] [CrossRef] [PubMed]
  65. Consolati, G. On the thermal expansion of nanohole free volume in perfluoropolyethers. J. Phys. Chem. B 2005, 109, 10096–10099. [Google Scholar] [CrossRef] [PubMed]
  66. Recio, R.; Lozano, Á.E.; Prádanos, P.; Marcos, Á.; Tejerina, F.; Hernández, A. Effect of fractional free volume and Tg on gas separation through membranes made with different glassy polymers. J. Appl. Polym. Sci. 2007, 107, 1039–1046. [Google Scholar] [CrossRef]
  67. Goswami, S.; Ghosh, R.; Neog, A.; Das, B. Deep learning based approach for prediction of glass transition temperature in polymers. Mater. Today Proc. 2021. [Google Scholar] [CrossRef]
  68. Debot, A.; White, R.P.; Lipson, J.E.G.; Napolitano, S. Experimental test of the cooperative free volume rate model under 1D confinement: The interplay of free volume, temperature, and polymer film thickness in driving segmental mobility. ACS Macro Lett. 2018, 8, 41–45. [Google Scholar] [CrossRef]
  69. Bershtein, V.A.; Egorova, L.M.; Yakushev, P.N.; Pissis, P.; Sysel, P.; Brozova, L. Molecular dynamics in nanostructured polyimide-silica hybrid materials and their thermal stability. J. Polym. Sci. Part B Polym. Phys. 2002, 40, 1056–1069. [Google Scholar] [CrossRef]
  70. Afzal, A.; Siddiqi, H.M. A comprehensive study of the bicontinuous epoxy-silica hybrid polymers: I. Synthesis, characterization and glass transition. Polymer 2011, 52, 1345–1355. [Google Scholar] [CrossRef]
  71. Firpo, G.; Angeli, E.; Guida, P.; Savio, R.L.; Repetto, L.; Valbusa, U. Gas permeation through rubbery polymer nano-corrugated membranes. Sci. Rep. 2018, 8, 6345. [Google Scholar] [CrossRef] [PubMed]
  72. Wang, J.; Pan, T.; Zhang, J.; Xu, X.; Yin, Q.; Han, J.; Wei, M. Hybrid films with excellent oxygen and water vapor barrier properties as efficient anticorrosive coatings. RSC Adv. 2018, 8, 21651–21657. [Google Scholar] [CrossRef] [Green Version]
Figure 1. FTIR spectra of all coatings deposited on PET foil.
Coatings 11 00573 g001
Figure 2. Samples’ topography imaged using SEM (top) and 2D AFM with the height scale (bottom).
Coatings 11 00573 g002
Figure 3. Microscopic representation of the critical load for individual samples: (A)—Lc1 for sample (CF)0, (B)—Lc3 for sample (CF)0, (C)—Lc1 and Lc2 for sample (CF)1, (D)—Lc3 for sample (CF)1, (E)—Lc3 for sample (CF)6, and (F)—Lc1 and Lc2 for sample (CF)10.
Coatings 11 00573 g003
Figure 4. Coating (CF)10 at load of 5.44 N.
Coatings 11 00573 g004
Figure 5. Sample indentation curves for PET substrate and substrate + coating systems.
Coatings 11 00573 g005
Figure 6. Results of nanoindentation test, average values for each material: (A)—Martens hardness and (B)—maximum penetration depth of the indenter.
Coatings 11 00573 g006
Table 1. Main bands or band range with corresponding bond vibration in FTIR spectra.
Wavenumber (cm−1)Bonds and Vibrations
400–490Si–O–Si rocking
520–730–CF2, –CF3 rocking –CF2 wagging
800; 980–1200Si–O–Si stretching
900Si–O stretching
1120–1250C–F stretching
1350–1490C–H stretching C–H bending
2850–2980C–H stretching
3400Si–OH stretching
Table 2. Values of roughness (Ra and Rq) and wettability (water contact angle, WCA) parameters, surface free energy (SFE), and thickness of obtained layers and PET substrate for comparison.
SampleWCA (°)SFE (mN/m)Ra (nm)Rq (nm)Thickness (µm)
PET80 ± 0.531.50 ± 0.861.41.8175
(CF)0103 ± 0.626.71 ± 0.950.90.71.50 ± 0.06
(CF)1102 ± 0.523.25 ± 0.765.54.31.50 ± 0.03
(CF)6108 ± 0.610.81 ± 0.770.40.51.70 ± 0.04
(CF)10113 ± 0.910.78 ± 0.6978.363.11.50 ± 0.04
Table 3. Values of glass transition temperature, thermal expansion coefficient, elongation, and oxygen transmission rate for PET foil and PET covered by layers.
SampleGlass Transition Temperature, Tg (°C)Mean Coefficient of Thermal Expansion 30–80 °C (ppm/K) Elongation 30–140 °C (%)Oxygen Permeability Coefficient (cm3/(m2·24 h·atm))
PET73.72 ± 1.52115.34 ± 1.231.71 ± 0.098.48 ± 0.48
(CF)083.55 ± 1.3341.79 ± 2.450.94 ± 0.045.92 ± 0.70
(CF)184.7 ± 0.8431.48 ± 1.340.81 ± 0.036.80 ± 0.80
(CF)686.82 ± 1.0645.72 ± 3.501.72 ± 0.084.26 ± 0.90
(CF)1084.14 ± 1.5151.64 ± 2.381.02 ± 0.272.05 ± 0.01
Table 4. Values of critical loads determined by scratch test.
SampleLc1Lc2Lc3
Mean Value (N)Standard Error (N)Mean Value (N)Standard Error (N)Mean Value (N)Standard Error (N)
(CF)0observed from the beginning of the scratch trackdoes not occur1.580.09
(CF)10.120.060.170.095.960.41
(CF)6--observed from the beginning of the scratch track
(CF)10observed from the beginning of the scratch trackobserved from the beginning of the scratch trackdoes not occur
Publisher’s Note: MDPI stays neutral with regard to jurisdictional claims in published maps and institutional affiliations.

