Article

An Investigation on the Thermal and Solar Properties of Graphene-Coated Polyester Fabrics

Textile Engineering Department, Bursa Uludag University, 16240 Bursa, Turkey
*
Author to whom correspondence should be addressed.
Coatings 2021, 11(2), 125; https://doi.org/10.3390/coatings11020125
Submission received: 11 December 2020 / Revised: 12 January 2021 / Accepted: 19 January 2021 / Published: 23 January 2021
(This article belongs to the Special Issue Surface Treatment of Textiles)

Abstract

:
In this study, coatings were made with graphene nanopowder in two different thicknesses (0.1 and 0.5 mm) at three different concentrations (50, 100 and 150 g/kg) on polyester woven fabrics. The effects of the coating thickness and graphene concentration were examined with optical and scanning electron microscopy (SEM) images. The thermal stability properties of the samples were also evaluated by differential scanning calorimetry (DSC) and thermal gravimetric analysis (TGA). Thermal conductivity was evaluated with two different principles: contact and radiant heat transfer, according to JIS R 2618 and EN ISO 6942, respectively. Solar measurements were performed with a Shimadzu UV-3600 Plus spectrophotometer. The graphene coating improved the thermal stability of the polyester fabrics. The solar absorbance value increased by 80% compared to reference fabrics, and reached approximately 90%. One of the important results was that the thermal conductivity coefficient increased by 87% and 262% for the two coating thicknesses, respectively.

1. Introduction

Today, coating is an essential requirement of many technical textiles, which would not be capable of satisfying the strict requirements on functionality and standards without the application of special raw materials [1]. The coating enhances and extends the range of functional performance properties of textiles, and the use of these techniques is growing rapidly as the applications for technical textiles become more diverse [2]. The focus in textile coating has been on the development of new materials that provide specific characteristics such as electromagnetic shielding, electrical conductivity, thermal insulation, thermal conductivity, and sound absorption, etc. [2]. Particularly, nano-size fillers such as clay, metal oxides, carbon black have been used in composite materials. Due to their large surface area, they have a better interaction with polymer matrices and have better performance and new market interest [3].
Although graphene was discovered in 1859, there has been an explosion in the exploration of the material since 2004, with the study of A. K. Geim and K. S. Novoselov. Graphene is an excellent material and has been considered a promising candidate for the post-silicon age [4]. Graphene is the first truly 2D crystal ever observed in nature [5]. Graphene is a single layer of carbon atoms densely packed in a honeycomb lattice [6]. The term graphene is typically applied to a single graphite layer, although common references also exist to bilayer or trilayer graphene [7]. The definition of graphene nano platelets (GNP) is still under review and is subject to change. Nevertheless, this material can broadly be defined as graphene with a typical thickness of 1–3 nm and lateral dimensions ranging from approximately 100 nm to 100 µm [8]. Graphene has unique electronic, optical, thermal, mechanical properties, a stable chemical nature, and low density. Therefore, it differs from most conventional three-dimensional materials and has extensive usability [9,10].
Energy conservation and environmental protection have become the most important issues for humanity. Heat transfer rate is a vital factor in determining the efficiency of thermal energy storage system. Enhancing thermal conductivity is an effective approach to improving thermal energy storage systems [10]. Efficient heat management systems have become extremely important in various fields, such as electronic, optoelectronic, and thermoelectric applications. In this regard, the development of materials with high thermal conductivity is urgently needed [11]. Carbon allotropes and their derivatives occupy a unique place in terms of their ability to conduct heat. The thermal conductivity of carbon materials at room temperature spans an extraordinarily large range—of over five orders of magnitude—from the lowest in amorphous carbons, to the highest in graphene and carbon nanotubes [12].
The high thermal conductivity of graphene can be used within composites to create thermal interface materials for electronics, thermal sensors and energy management systems, optical devices, optoelectronics, sensors/detectors, and composites/barriers. The thermal conductivity varies with the size of graphene flake and markedly decreases with the number of carbon layers, even in clean suspended graphene [8]. Some researchers have studied coated textiles with graphene or graphene derivatives to enhance their thermal conductivity property. For example, Gan et al. [13] coated cotton fabric using the wet coating technique. The graphene nano-ribbon coating improved the thermal stability of the cotton fabric. In the study of Abbas et al. [14], graphene, multi-wall carbon nanotube (MWCNT) and fine boron nitride (BN) particles were separately applied with a resin onto cotton fabric, and the effect of the thin composite coatings on the thermal conductive property was examined. The study has indicated that the graphene-coated fabric showed the best improvement in the thermal conductivity. Gunesekara et al. [15] investigated the possibility of using graphene oxide-coated fabric for thermal conductive purposes. The thermal conductivity of coated knitted fabric was improved compared to the untreated control sample. In the study of Hu et al. [9], graphene/PU coatings were applied to cotton fabrics according to the pad-dry-cure process. The results showed that the increase in graphene-coated weight enhanced the thermo-physical properties (thermal conductivity and thermal resistance) of cotton fabrics by nearly 30%.
In this study, graphene nano platelets were applied to the polyester woven fabric by the knife-over-roll coating process. Fabrics were coated at three different graphene concentrations and two different thicknesses for each concentration rate. The thermal conductivity of graphene-coated fabrics has been evaluated, for the first time, by two methods with different principles (contact and radiant), supported by solar measurements. Additionally, DSC and TGA analyses were performed to determine the thermal stability of samples.

2. Materials and Methods

2.1. Materials

Pre-treated (desized and thermofixed) polyester fabrics, which were used in the experiments were supplied by the DKC Technical Coating Company (Bursa, Turkey). The structural properties of the base fabric are given in Table 1.
The coating chemicals such as the binder, thickener, fixation agent, anti-foam agent, and dispergator were supplied from Rudolf Duraner (Bursa, Turkey), and their properties are given in Table 2.
Graphene nanoplatelets powder, supplied by the Grafen Chemical Industries (Ankara, Turkey), was used as a filler material and its properties are given in Table 3.

2.2. Methods

2.2.1. Preparing the Coating Paste
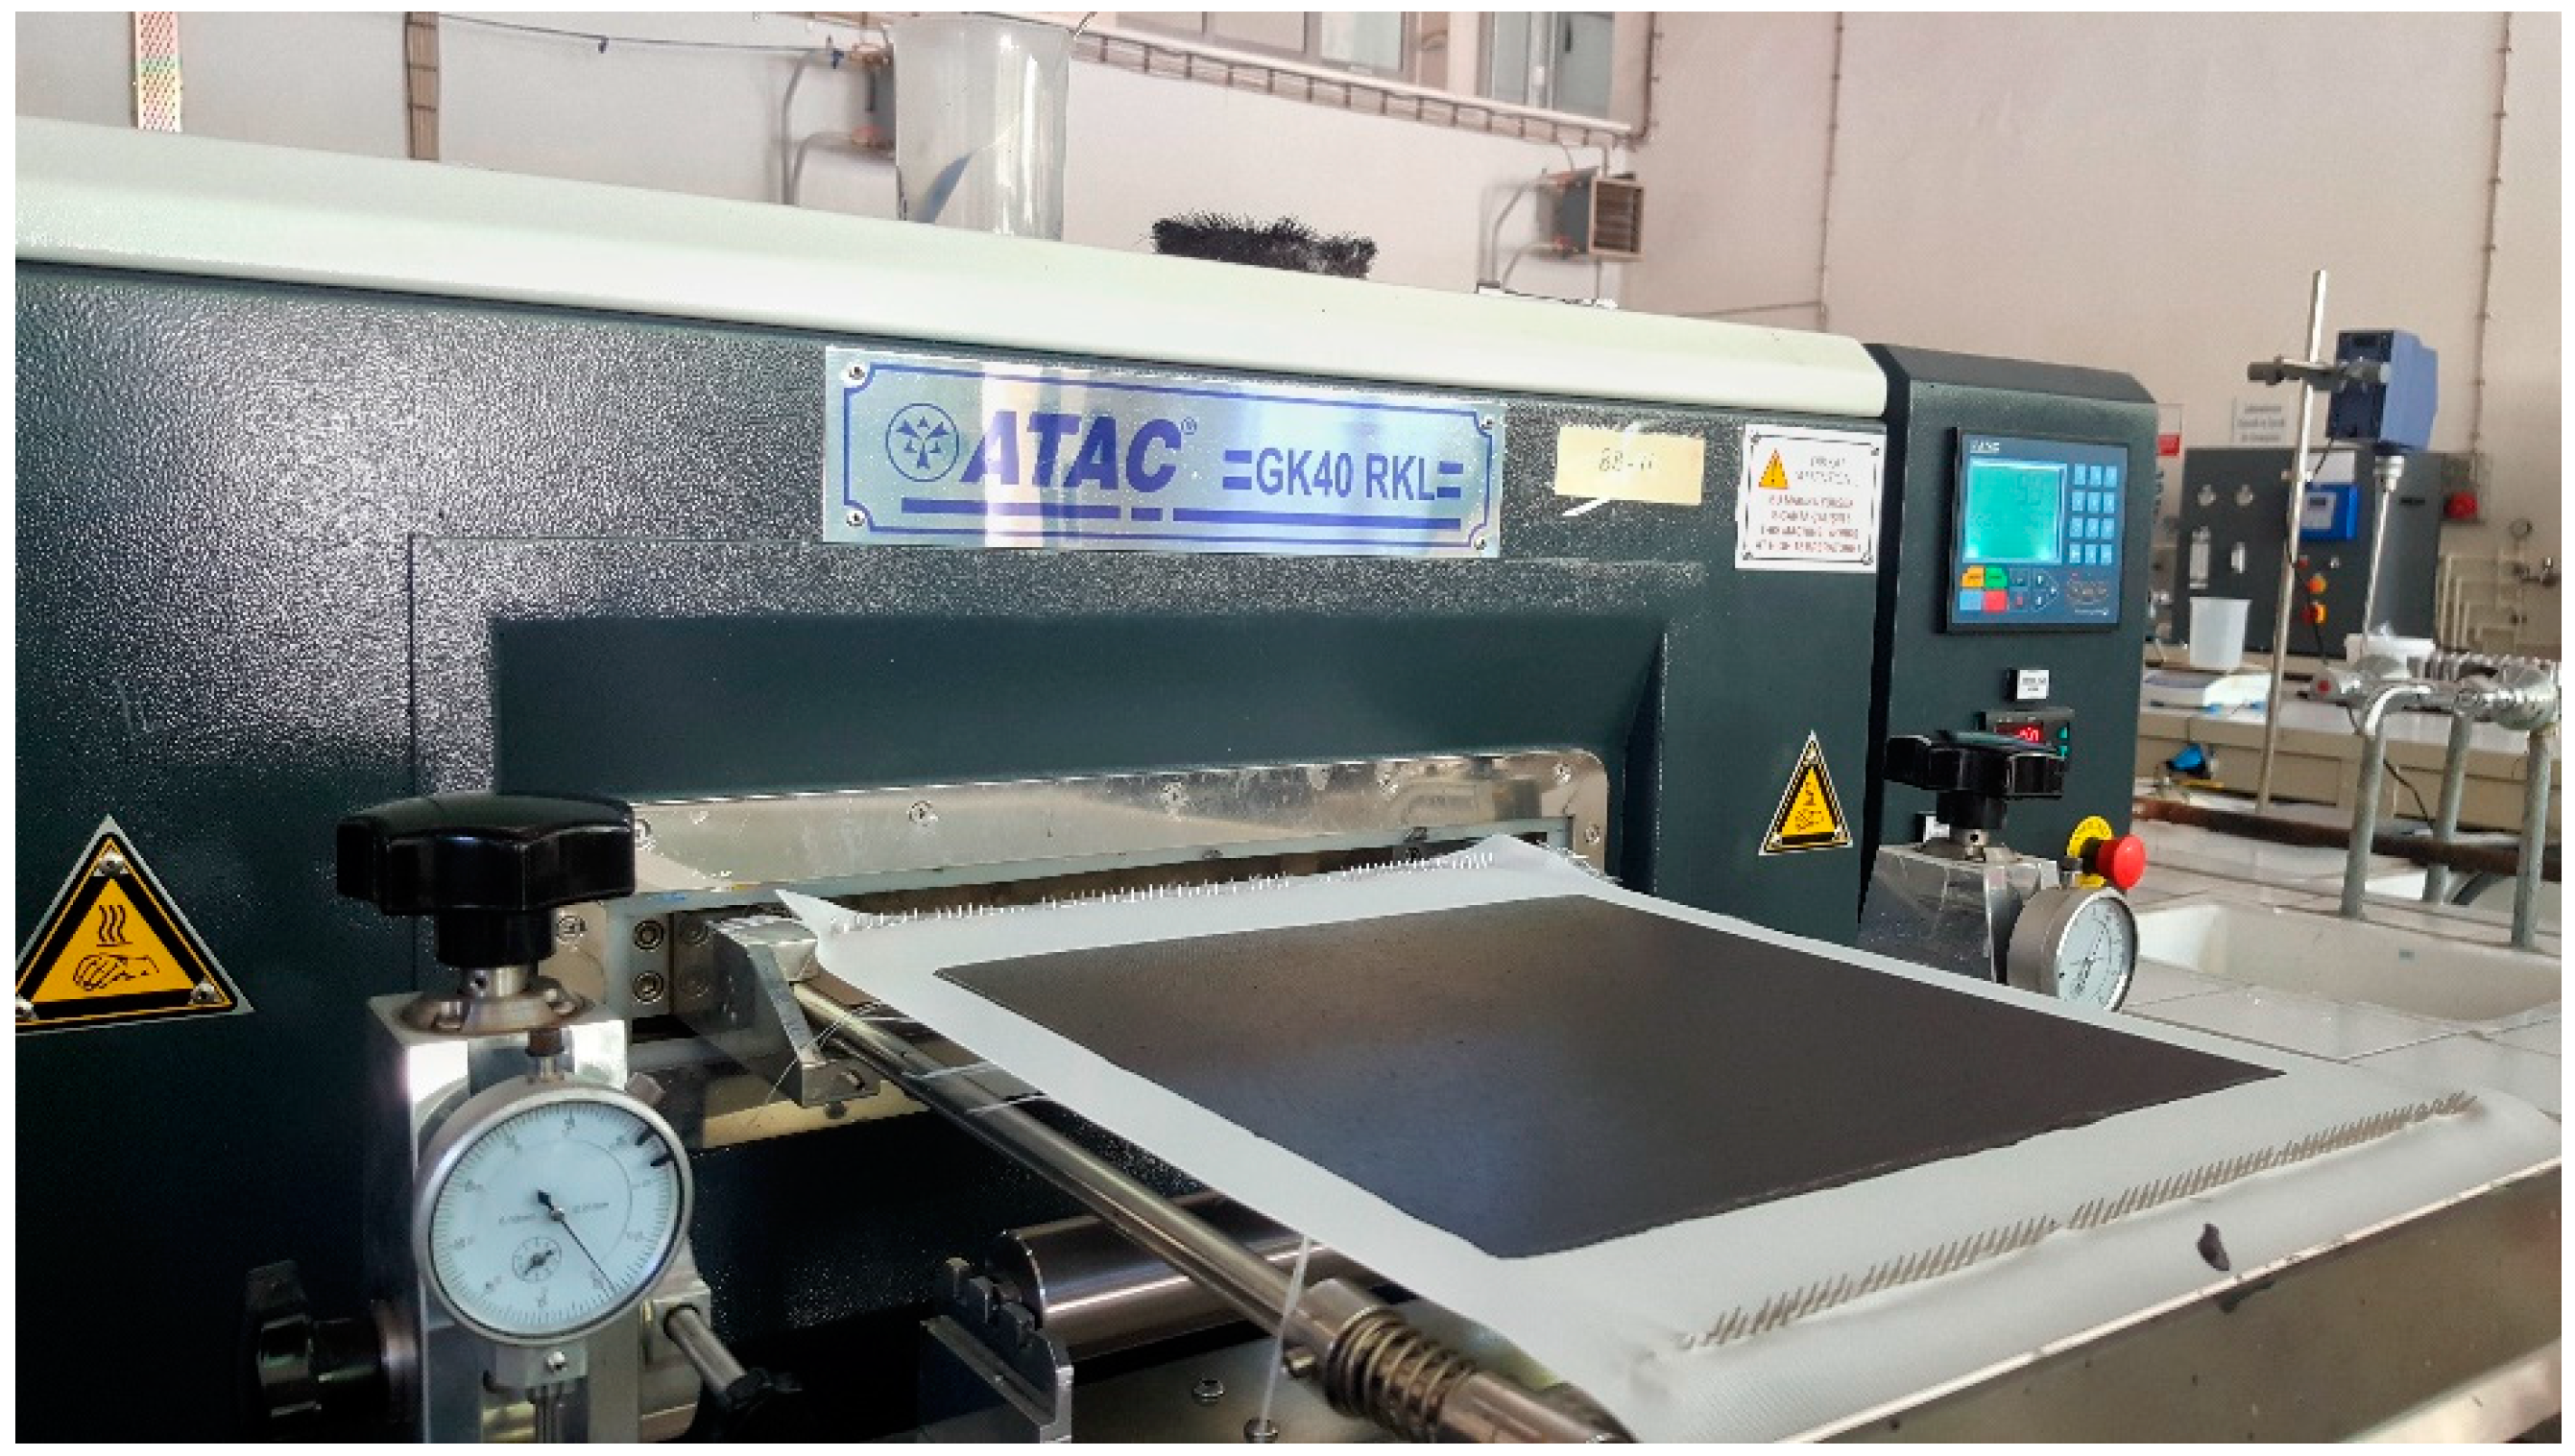
Firstly, the stock paste was prepared with mixing binder (350 g) and reverse osmosis water (597 g). Ammonia (5 g) was added to this mixture. Then the other chemicals; fixation agent (25 g), antifoam agent (6 g) and synthetic thickener (17 g) were added to the paste. Viscosity measurements were performed with Brookfield RVT analog viscometer (Middleboro, MA, USA). Viscosity value of the stock paste varied in the range of 4000 ± 200 cP. Coating pastes which had 7000 ± 200 cP viscosity were prepared by graphene powder at three different concentration. Graphene powders were dispersed in a certain amount of water and dispergator mixture and they were added to the paste. The recipe of coating paste is given in Table 4.

2.2.2. Coating

The coating process was performed according to the knife-over-roll technique on an Atac GK 40 RKL laboratory type coating machine (Figure 1). The distance between the knife and fabric was arranged as 0.1 and 0.5 mm for three concentration rates (50, 100 and 150 g/kg) to examine the effect of different coating thicknesses. Coated fabrics were dried at 100 °C for 10 min. They were fixed at 160 °C for 3 min in a Rapid H-TS-3 laboratory type steamer. Fabric codes are given in Table 5. To investigate the sole effect of graphene on measurements, coated samples were compared with the blind coatings (R2.1 and R2.5).

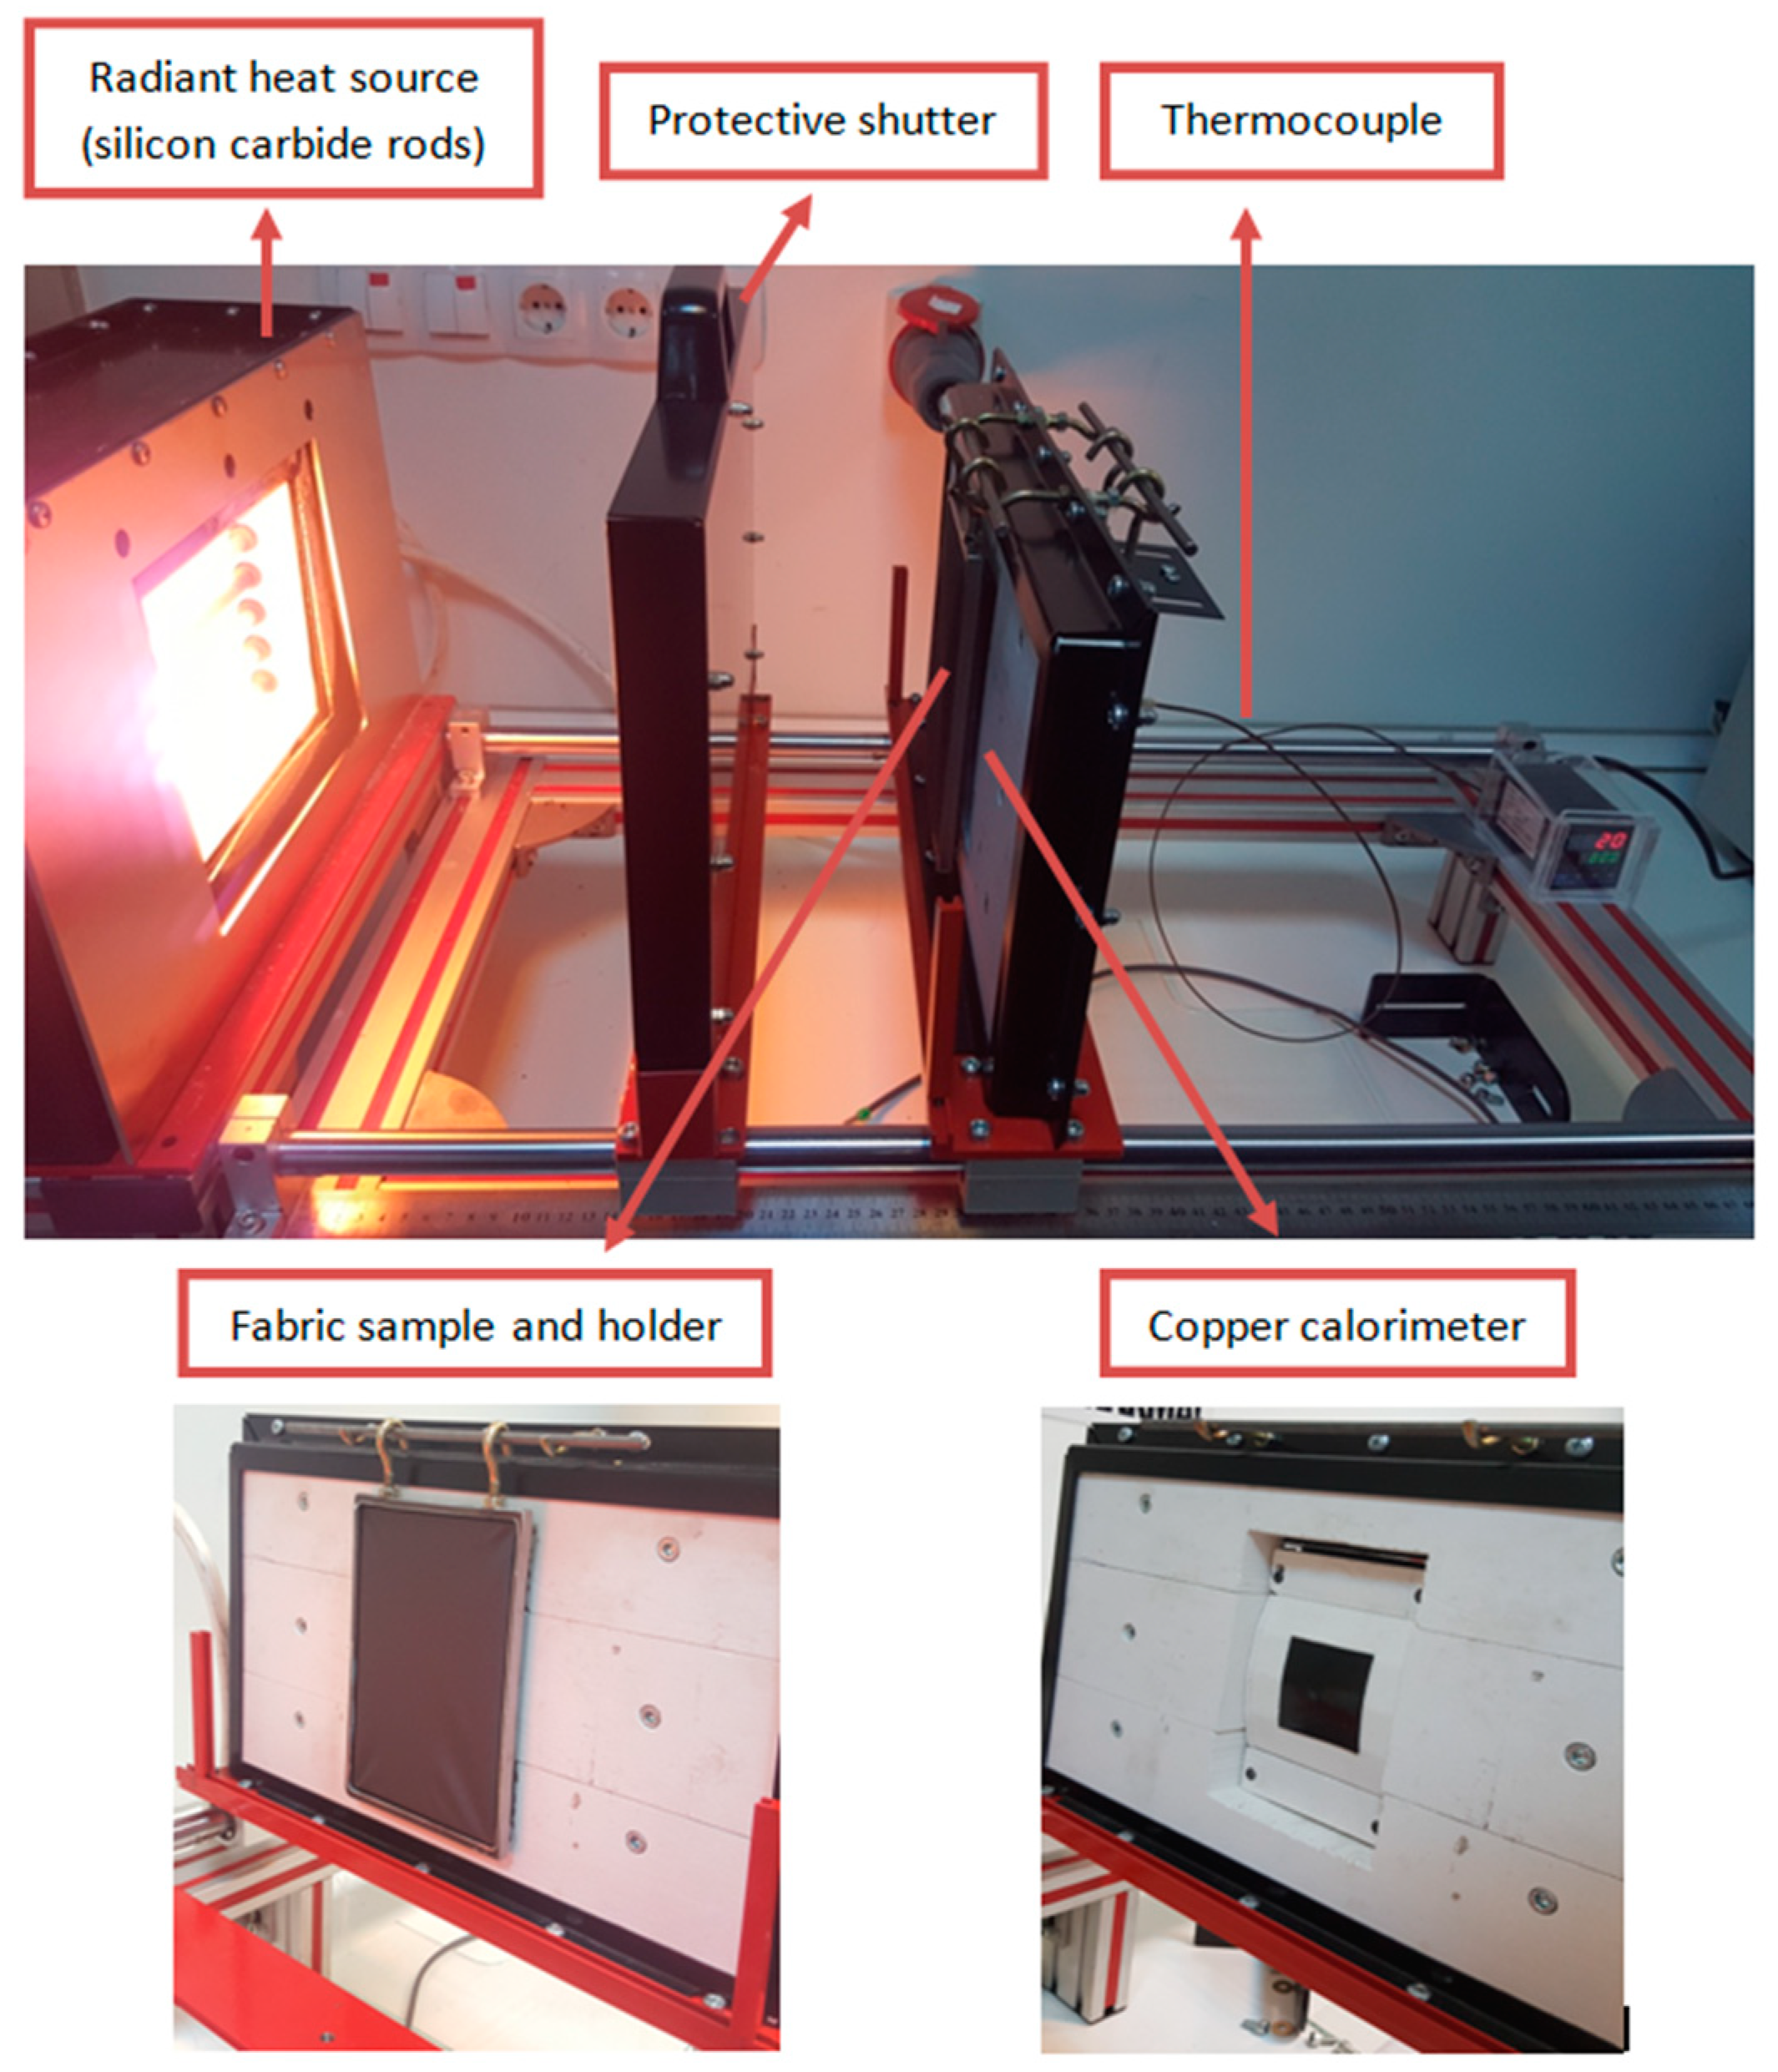
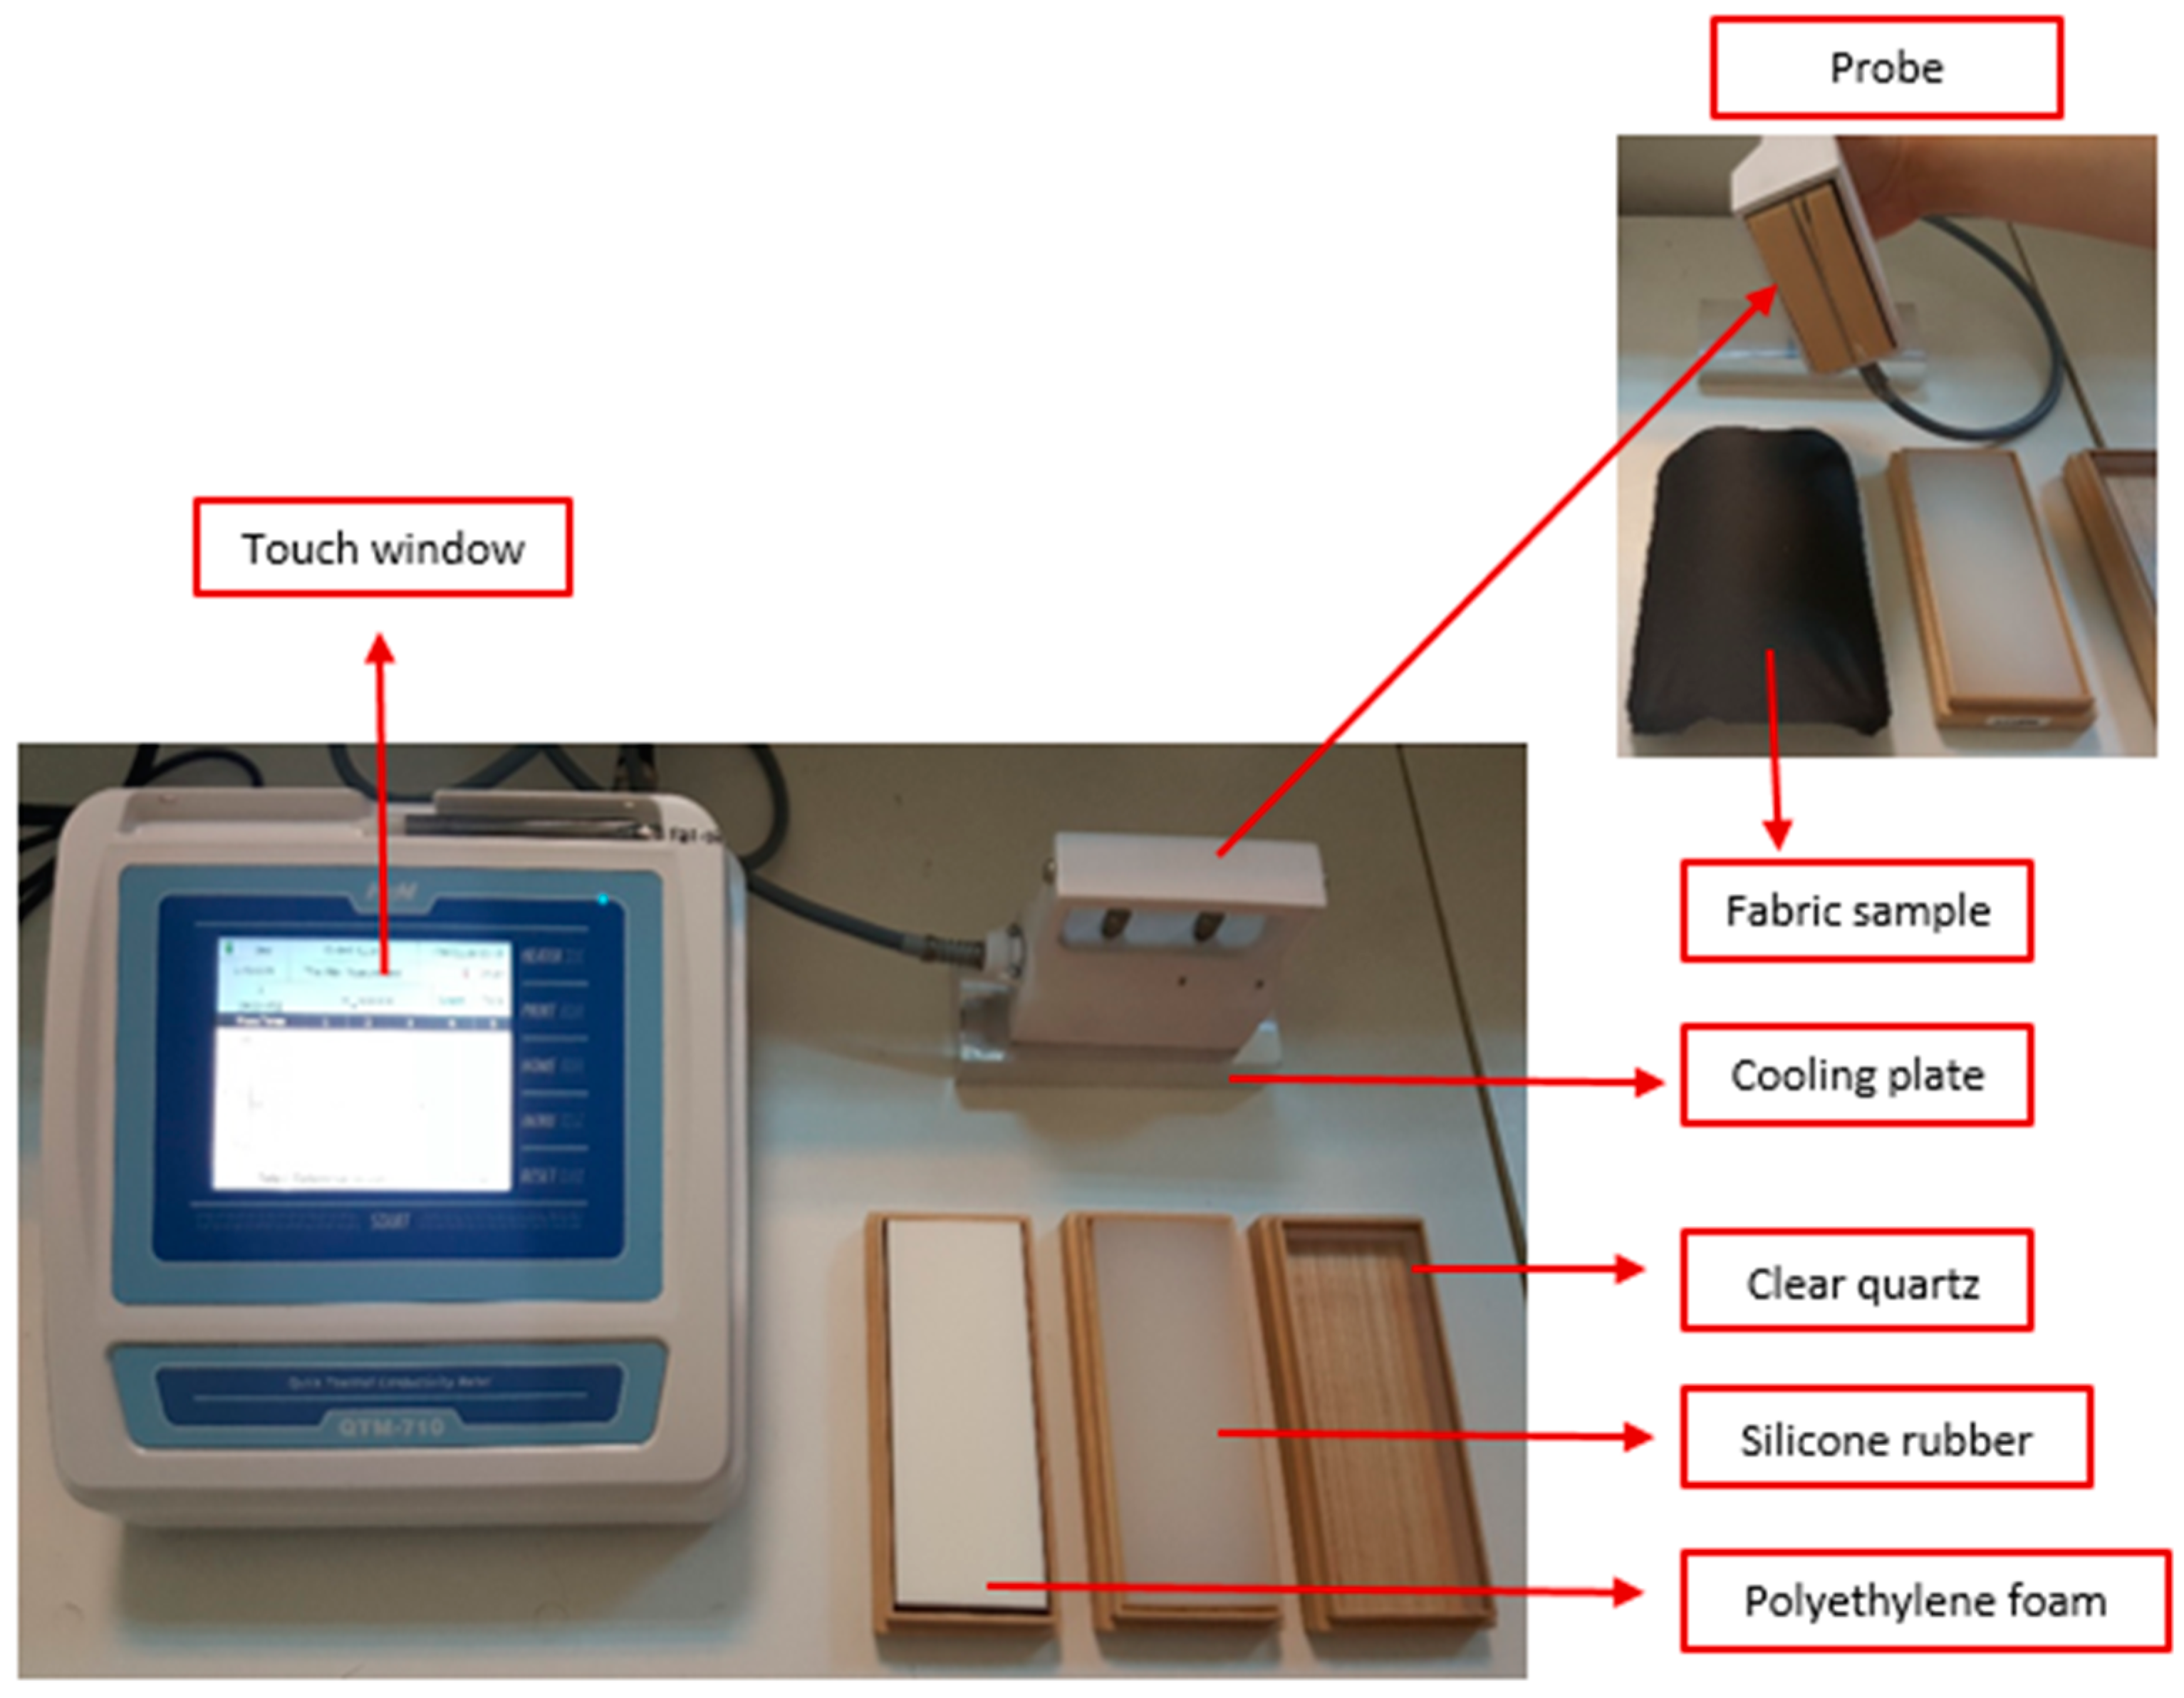
2.2.3. Test and Characterization

Thickness and mass per unit are measurements of fabrics were made according to TS 7128 EN ISO 5084 [16] and TS 251 standards [17], respectively. Equation (1) was used to determine the amount of substance transferred:
W 3   = W 2 W 1
where W1 (g/m2) is the weight of uncoated base fabric, W2 (g/m2) is the weight of the coated fabric, and W3 (g/m2) is the add-on amount (g/m2).
Optical images (both front and reverse sides) of reference fabrics (R2.1 and R2.5) and graphene-coated fabrics were taken with an Mshot Digital Microscope Camera MS60 (Guangzhou, China) with an objective of 30× magnification rate. SEM images of reference fabrics (R2.1 and R2.5) and graphene-coated fabrics were taken with a Carl Zeiss/Gemini 301 scanning electron microscope (Jena, Germany). A gold coating was applied to the samples before analysis, and the acceleration voltage was 10 kV. The magnification rates were chosen as 100× and 150×.
The DSC analyses were performed to determine the melting temperature (Tm) of the reference (R2.1 and R2.5) and graphene-coated samples using a heat flux TA/Discovery DSC 251 instrument with a heating rate of 10 °C/min from 50 to 350 °C under a nitrogen environment. The amount of test specimen was about 10 mg.
The TGA analyses were performed by a TA/SDT 650 thermo-gravimetric analyzer (New Castle, DE, USA). TGA and differential thermal gravimetric (DTG) curves, the decomposition temperatures, and total mass loss values were obtained. The amount of test specimen was about 10 mg. The initial and the final temperatures were 30 and 600 °C, respectively. The heating rate was 20 °C/min, and the gas type was nitrogen.
Thermal properties of fabrics were evaluated according to two different standards. The device (MEK model, Figure 2) that measures the radiant heat transfer according to EN ISO 6942 standard [18] was produced by Hasimoglu Mamatlar Machinery (Bursa, Turkey). In this study, method B (one of the methods related as standard) was used to estimate the heat transmission factor (TF, %) and the transmitted heat flux density (QC, kW/m2). These parameters were evaluated by measuring the time (s) necessary to obtain a temperature increase of 12 ± 0.1 and 24 ± 0.2 °C (t12 and t24). The transmitted heat flux density QC (kW/m2) was calculated according to Equation (2):
  Q C = M   ×   C P   ×   12 A   ×   ( t 24 t 12 )
where M is the copper plate (kg), CP is the specific heat of copper (kJ/kg·°C), 12/(t24t12) is the mean rate of rising of the calorimeter temperature in °C/s, in the region between a 12 °C and a 24 °C rise, and A is the area of the copper plate (m2).
The heat transmission factor TF (Q0), for the incident heat flux density level Q0 (kW/m2), was given by Equation (3):
T F ( Q 0 ) = Q C Q 0  
The incident heat flux density (Q0) was chosen as 5 kW/m2 (low level) according to the standard. Silicon carbide heating rods were used to provide the required heat flux. The samples were placed in a specimen holder (frame) and they were exposed to radiant heat. Exposure duration was controlled using a manually operated shutter. The time taken for the temperature to rise by 12 ± 0.1 and 24 ± 0.2 °C in the copper plate calorimeter were measured. All samples were conditioned at a temperature of 20 ± 2 °C and (65 ± 2) % RH (relative humidity) before testing.
The second thermal measurement method was performed according to the JIS R 2618 standard [19] with a quick thermal conductivity meter (QTM-710) (Figure 3). This is the hot wire method (also called the probe method) and can determine the thermal conductivity of the samples by Equation (4):
λ = q   ×   l n ( t 2 t 1   ) / 4 π ( T 2 T 1 )
where λ is the thermal conductivity of the sample (W/mK), q is the thermal unit of heater per time and length, t is time, and T is temperature. The measurement of samples for thermal conductivity was based on comparing the sample with three different reference plates (quartz, silicon, and polyethylene foam) in temperature rise when both were heated by the QTM-710 probe.
The solar measurements were performed with a Shimadzu UV-3600 Plus spectrophotometer (Kyoto, Japan) with an integrating sphere at 280–2500 nm wavelength according to EN 14500:2008 [20]. Barium sulphate was chosen as a white reference according to the standard. The solar transmittance (TS: 300–2500 nm), solar reflectance (RS: 300–2500 nm), solar absorbance (AS: 300–2500) and near-infrared reflectance (RNIR: 800–2500 nm) values were calculated according to the EN 410 standard [21].

3. Results

3.1. Mass per Unit Area, Add-On, and Thickness Results

Figure 4a shows the increased mass per unit area and add-on values with increasing graphene concentration. These values also increased with increasing coating thicknesses both for references (R2.1 and R2.5) and graphene-coated fabrics at each concentration rate. The amounts of solid matter that were transferred increased with increasing concentration; thus, the mass per unit area values increased by 5.36%, 17.26% and 27.38% for GR50.5, GR100.5 and GR150.5, respectively, compared to R2.5 at 0.5 mm constant coating thickness. Add-on values increased by 11.66%, 37.58% and 59.61% for GR50.5, GR100.5 and GR150.5, respectively, compared to R2.5 at 0.5 mm constant coating thickness.
The thickness results of fabrics are given in Figure 4b. It was observed that the coating process generally increased the thickness values of the fabrics, as expected. The fabrics that coated 50 g/kg (GR50.1 and GR50.5) gave close results to the thickness values of relevant blind coatings (R2.1 and R2.5) at both 0.1 and 0.5 mm coating thicknesses. When the fabrics coated at maximum graphene concentration (GR150.1 and GR150.5) were evaluated, thickness values increased by 8.57% and 27.5% compared to R2.1 and R2.5, respectively.

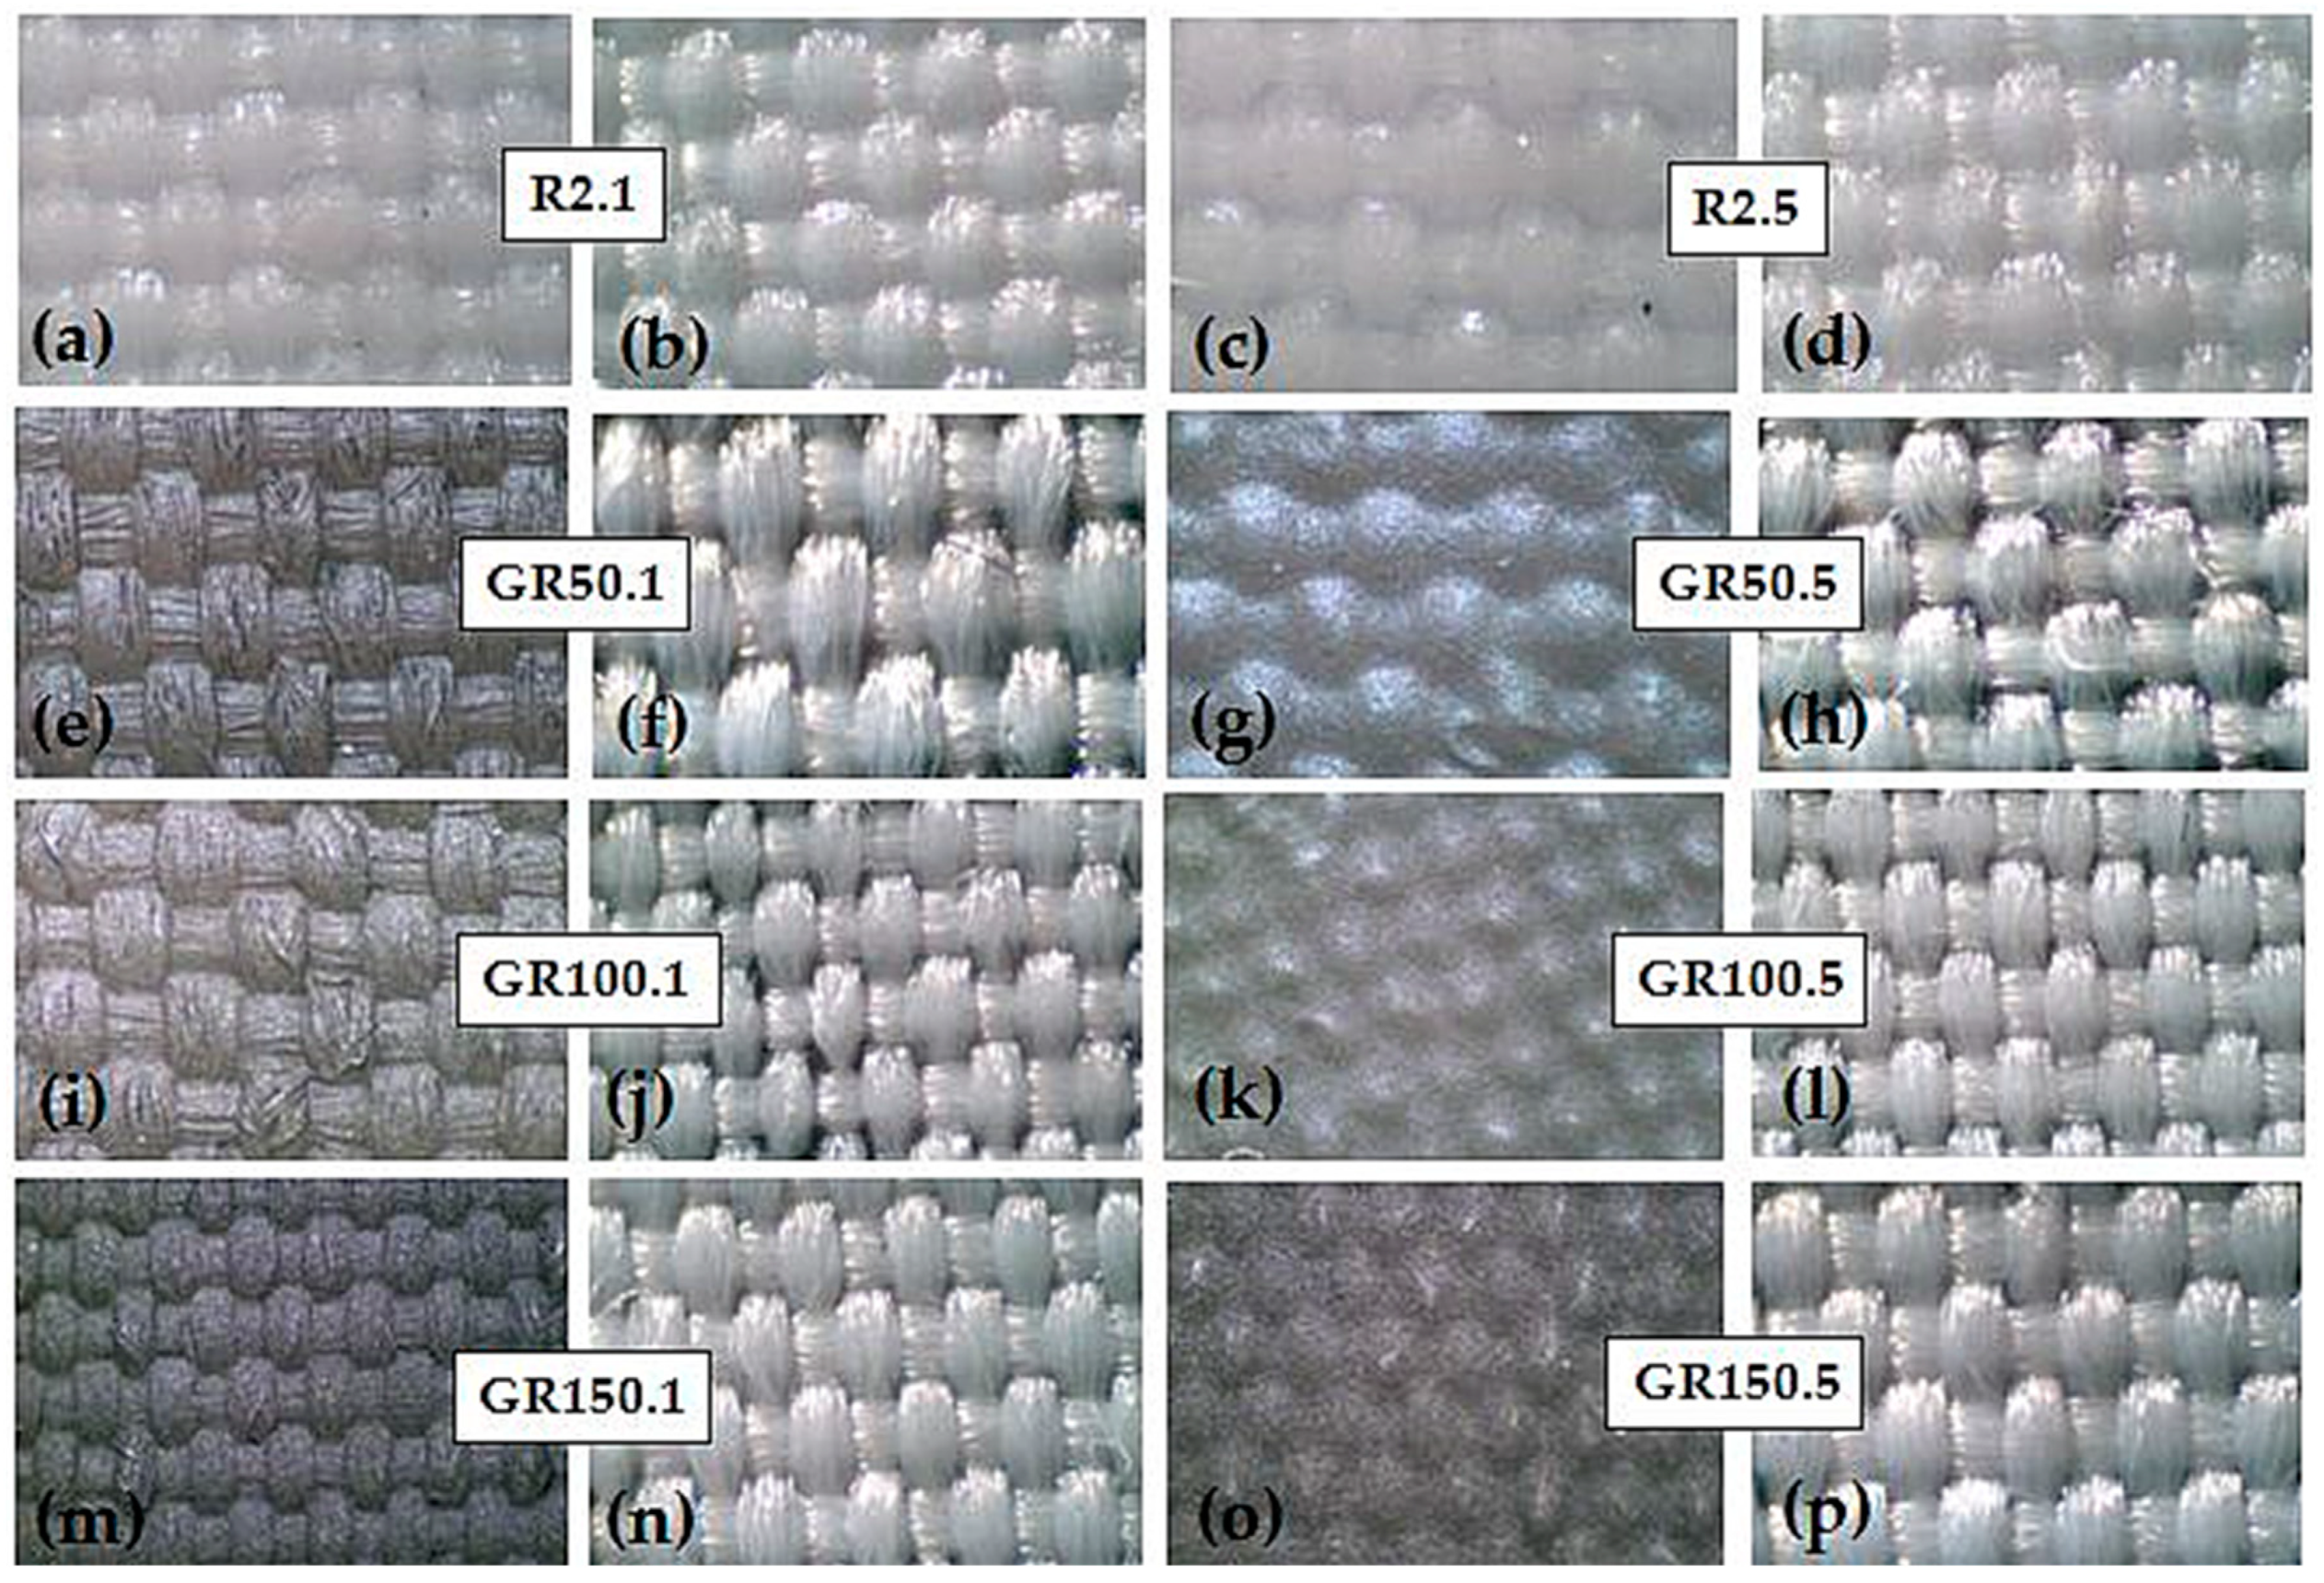
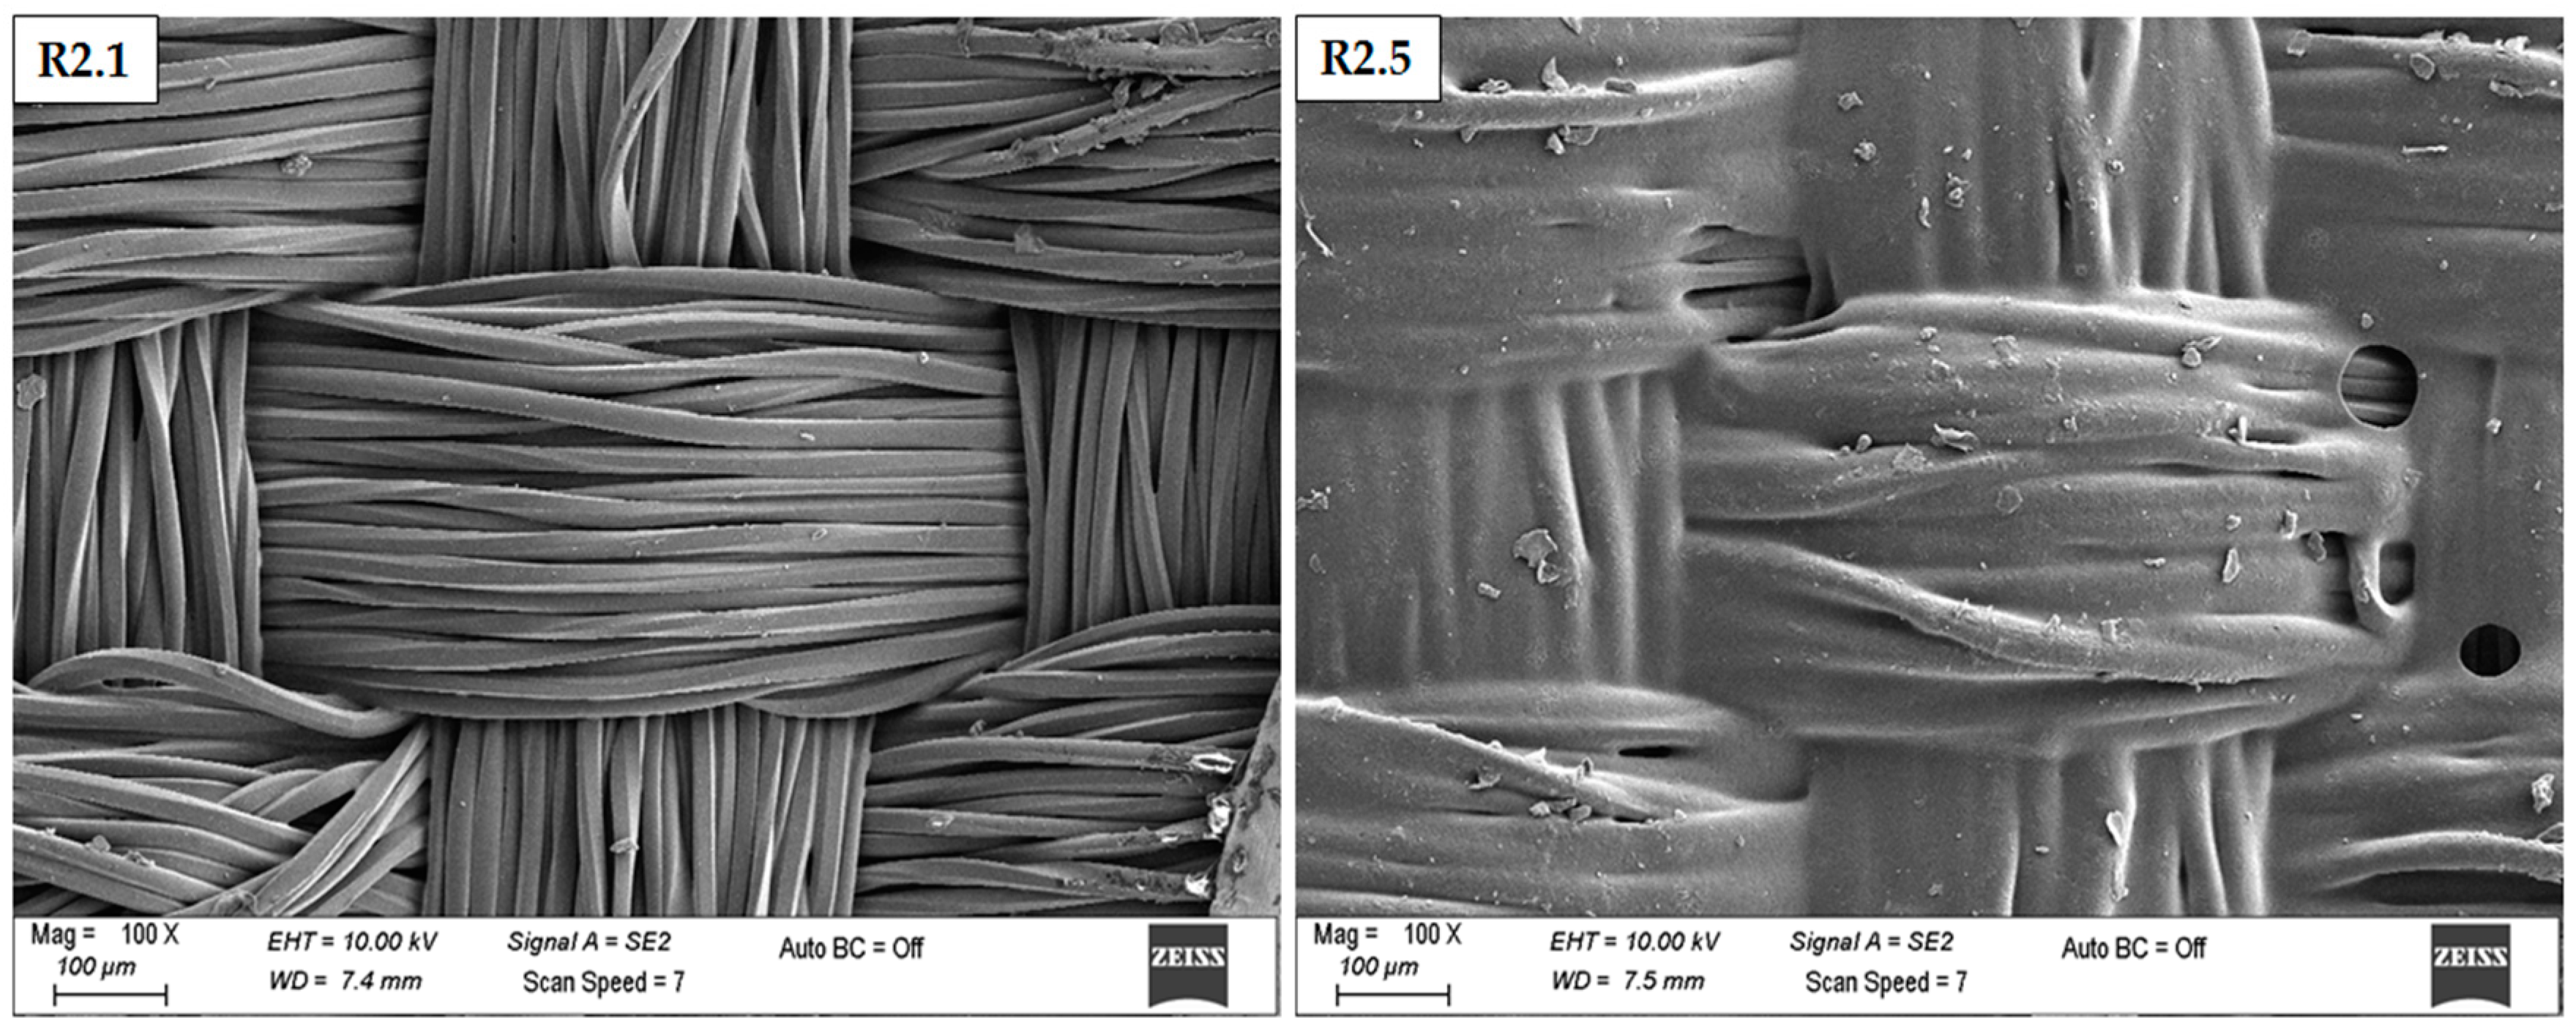
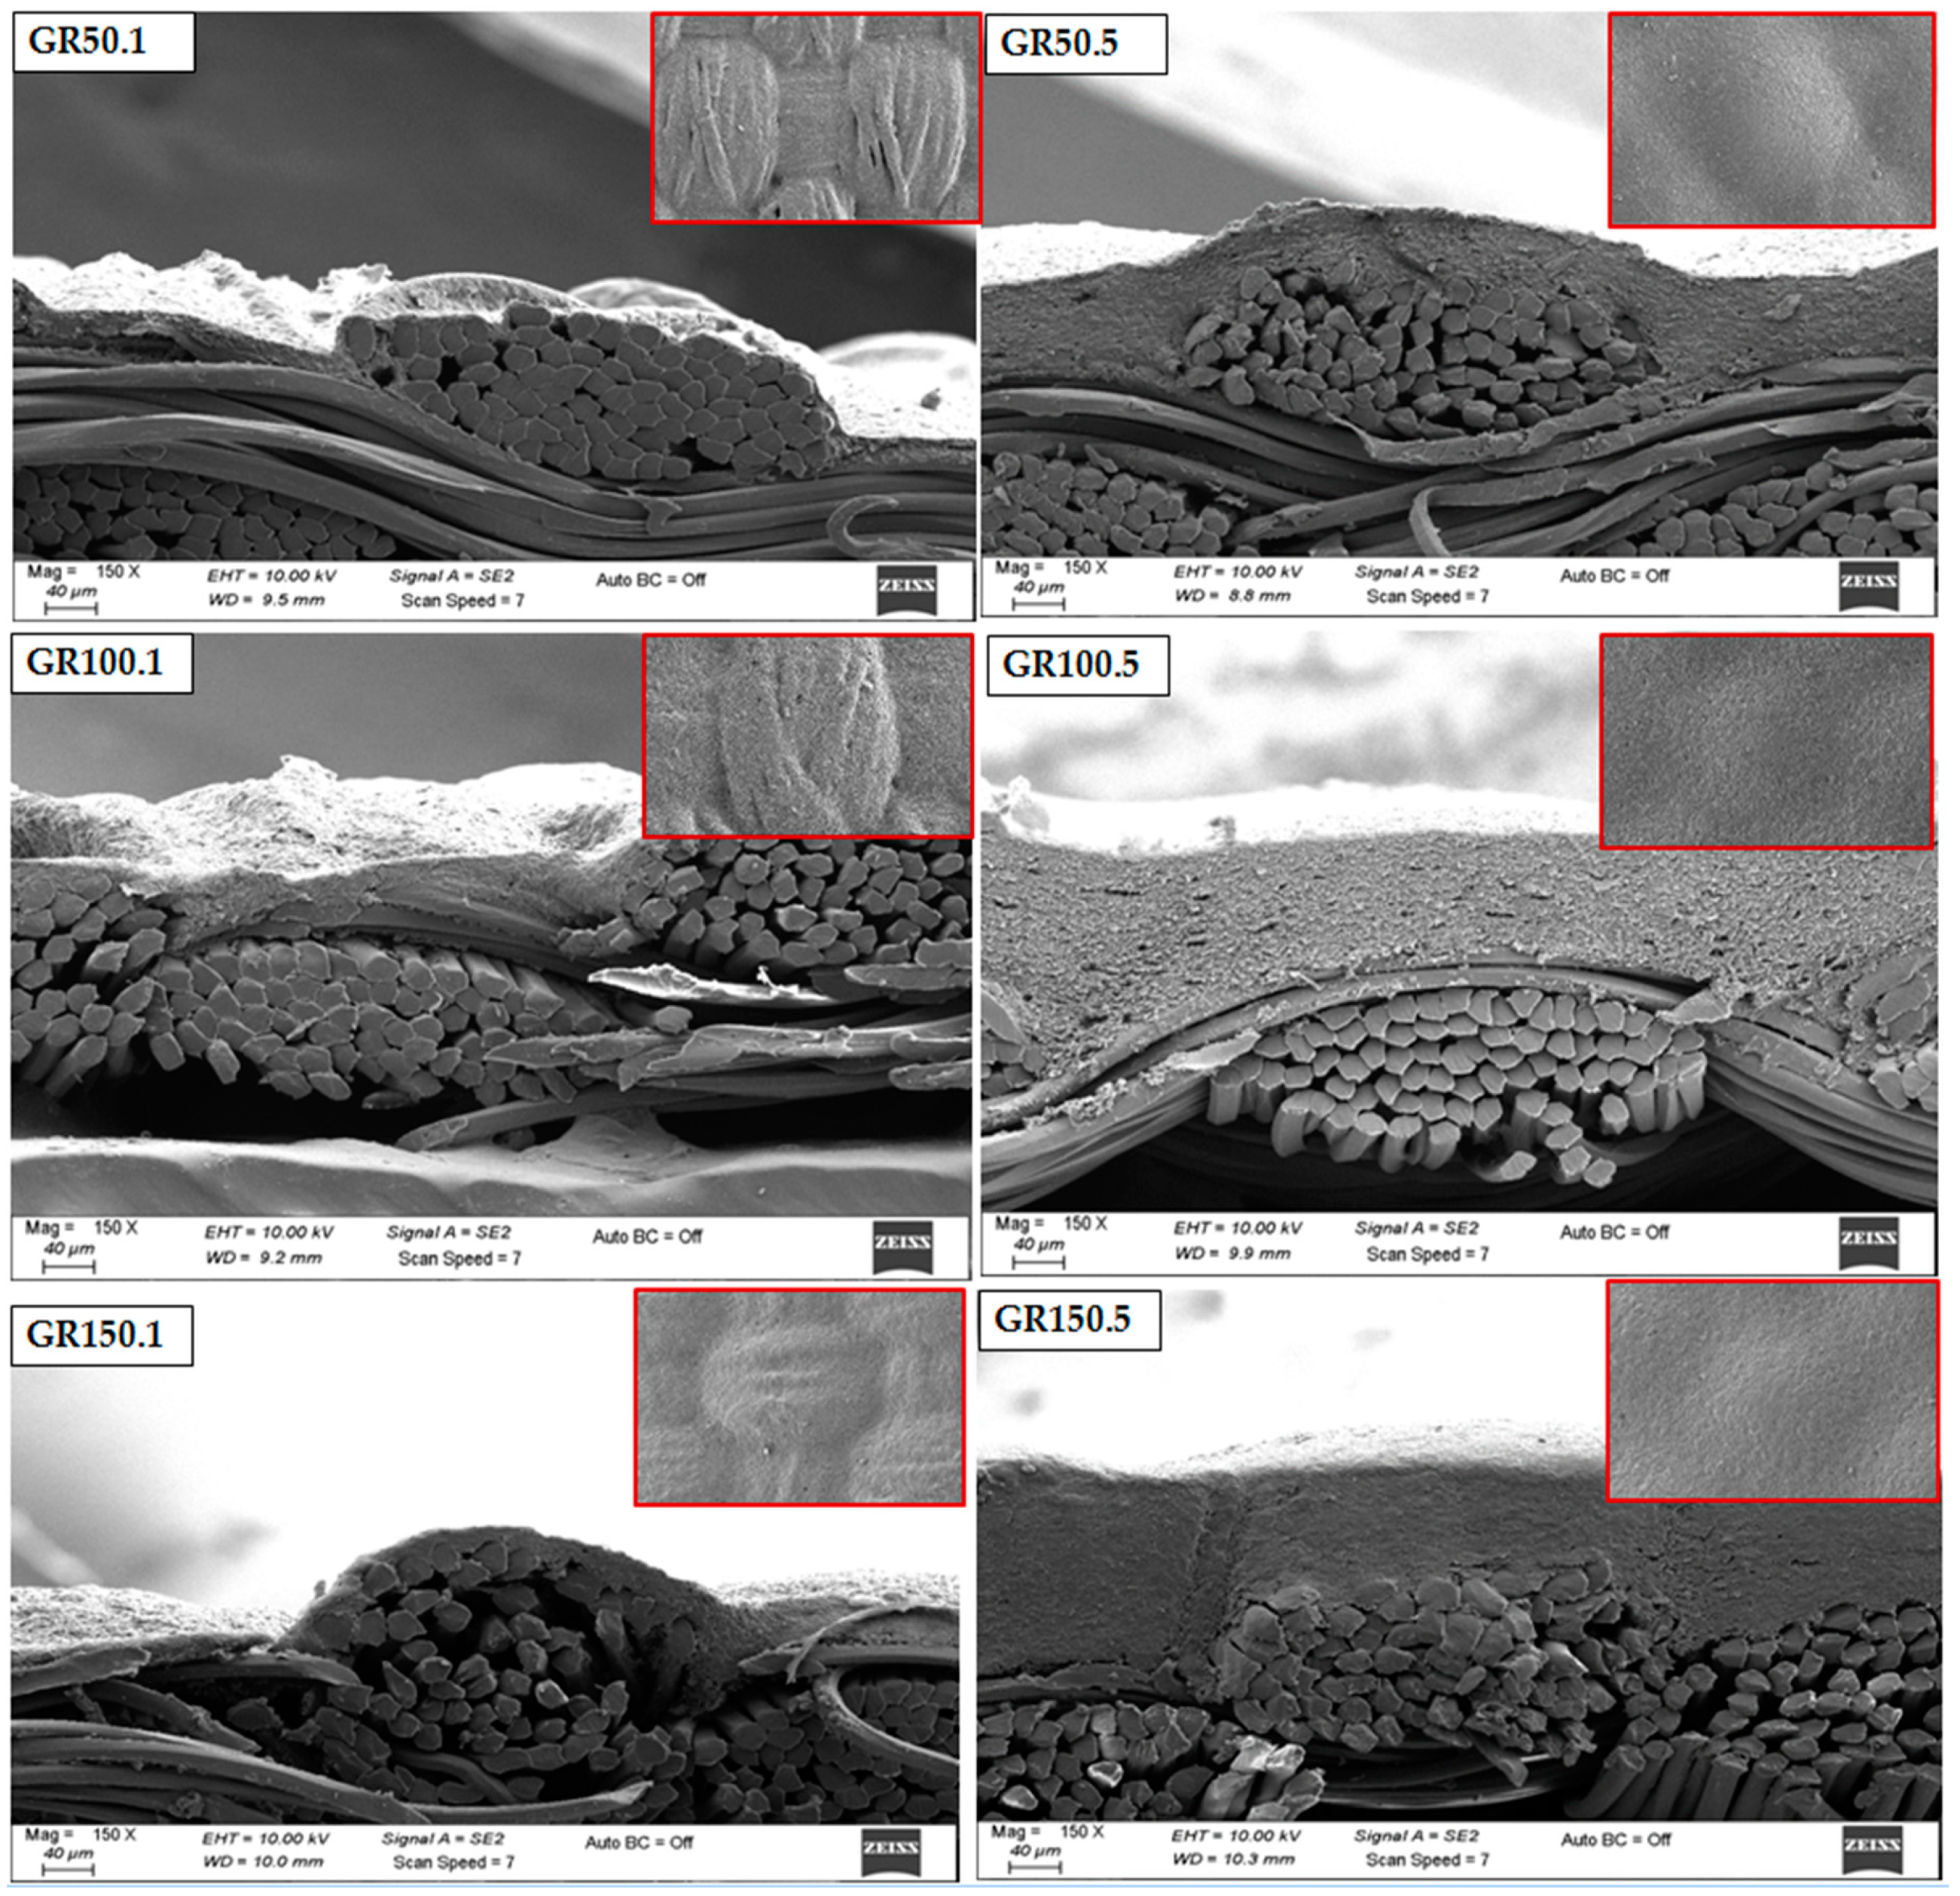
3.2. Optical and SEM Image Results

Optical images (front and reverse sides) of the reference and graphene-coated fabrics are shown in Figure 5. It was observed that the coating process was performed successfully on the polyester base fabric. Additionally, the appearance of hills and valleys on fabric structure decreased with the increasing graphene concentration and coating thickness. The optical images of the reverse sides showed that the coating paste did not penetrate to the back side of the fabric. This was also desirable, because in tests measuring from the fabric surface, passing back the coating paste could negatively affect the results.
SEM images of the reference fabrics are given in Figure 6 with 100× magnification rate. The effect of coating thickness was evident when the reference fabrics (R2.1 and R2.5) coated with stock paste were compared. The sectional views of graphene-coated fabrics with 150× and the surface views with 100× magnification rate on the top right corner are given in Figure 7. It was clearly seen that the coated surfaces were homogenous. The added paste amount increased with increasing graphene concentration and coating thickness, as expected. In Figure 7, when the surface images on the upper corner were compared between each other, it was seen that as the graphene concentration and coating thickness increased, the rate of filling the gaps between the peak and the valley at the intersection points of the fabric increased. Therefore, the surface coverage increased. It could be said that the increase in thickness played a more effective role in the difference in coverage compared to the increase in concentration. The highest coverage was achieved at the maximum concentration and thicker coating.

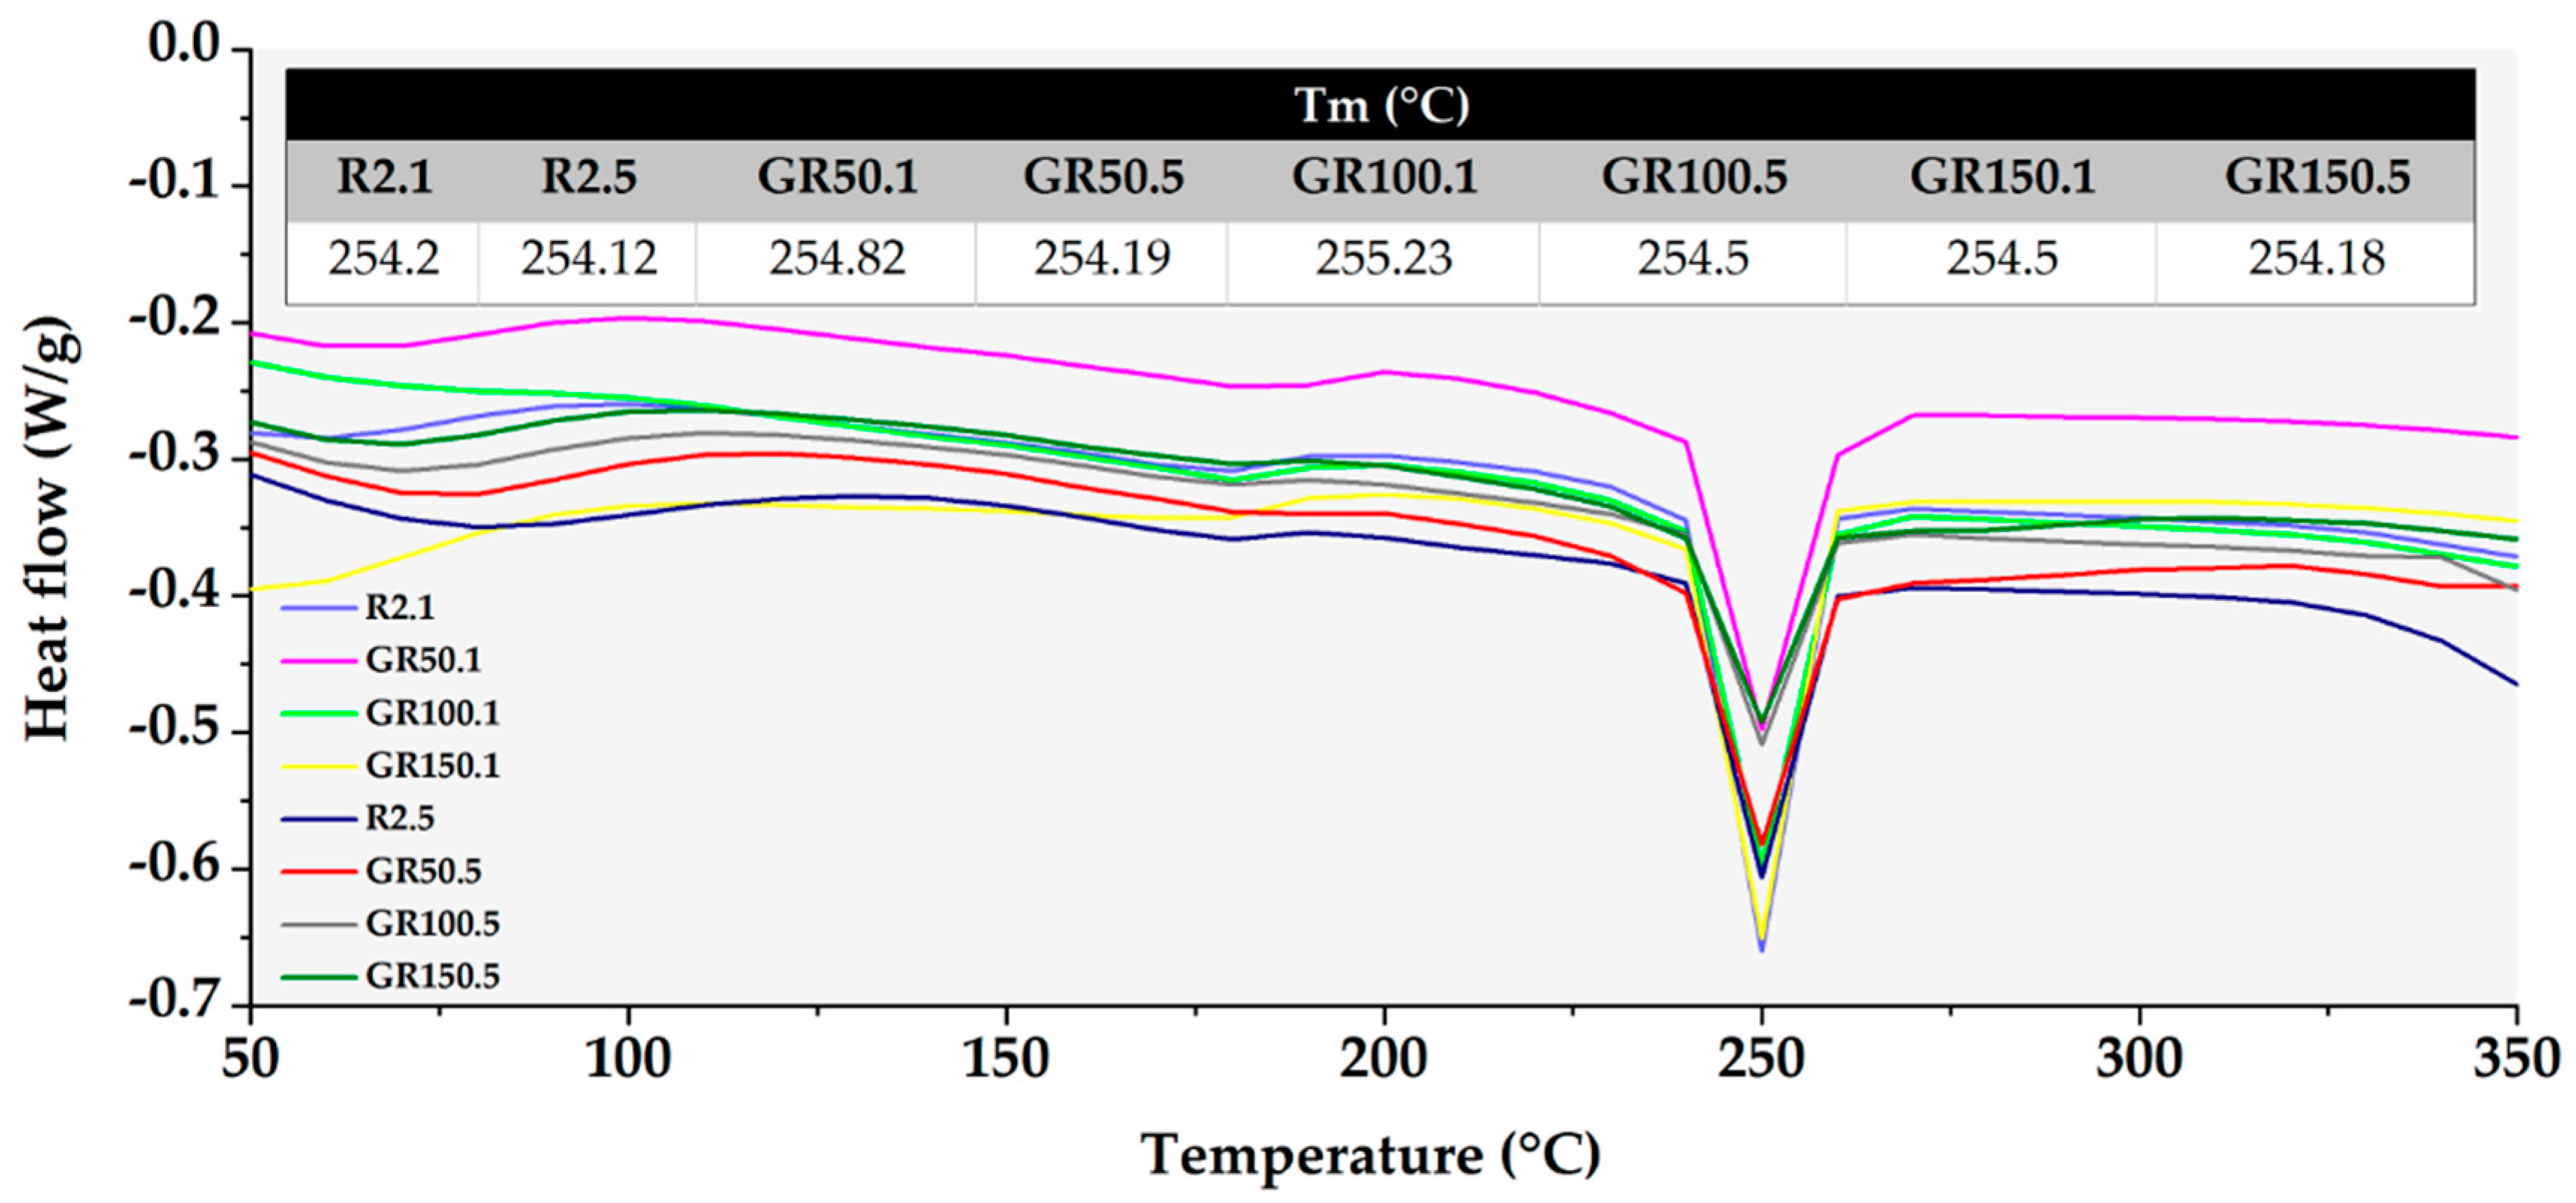
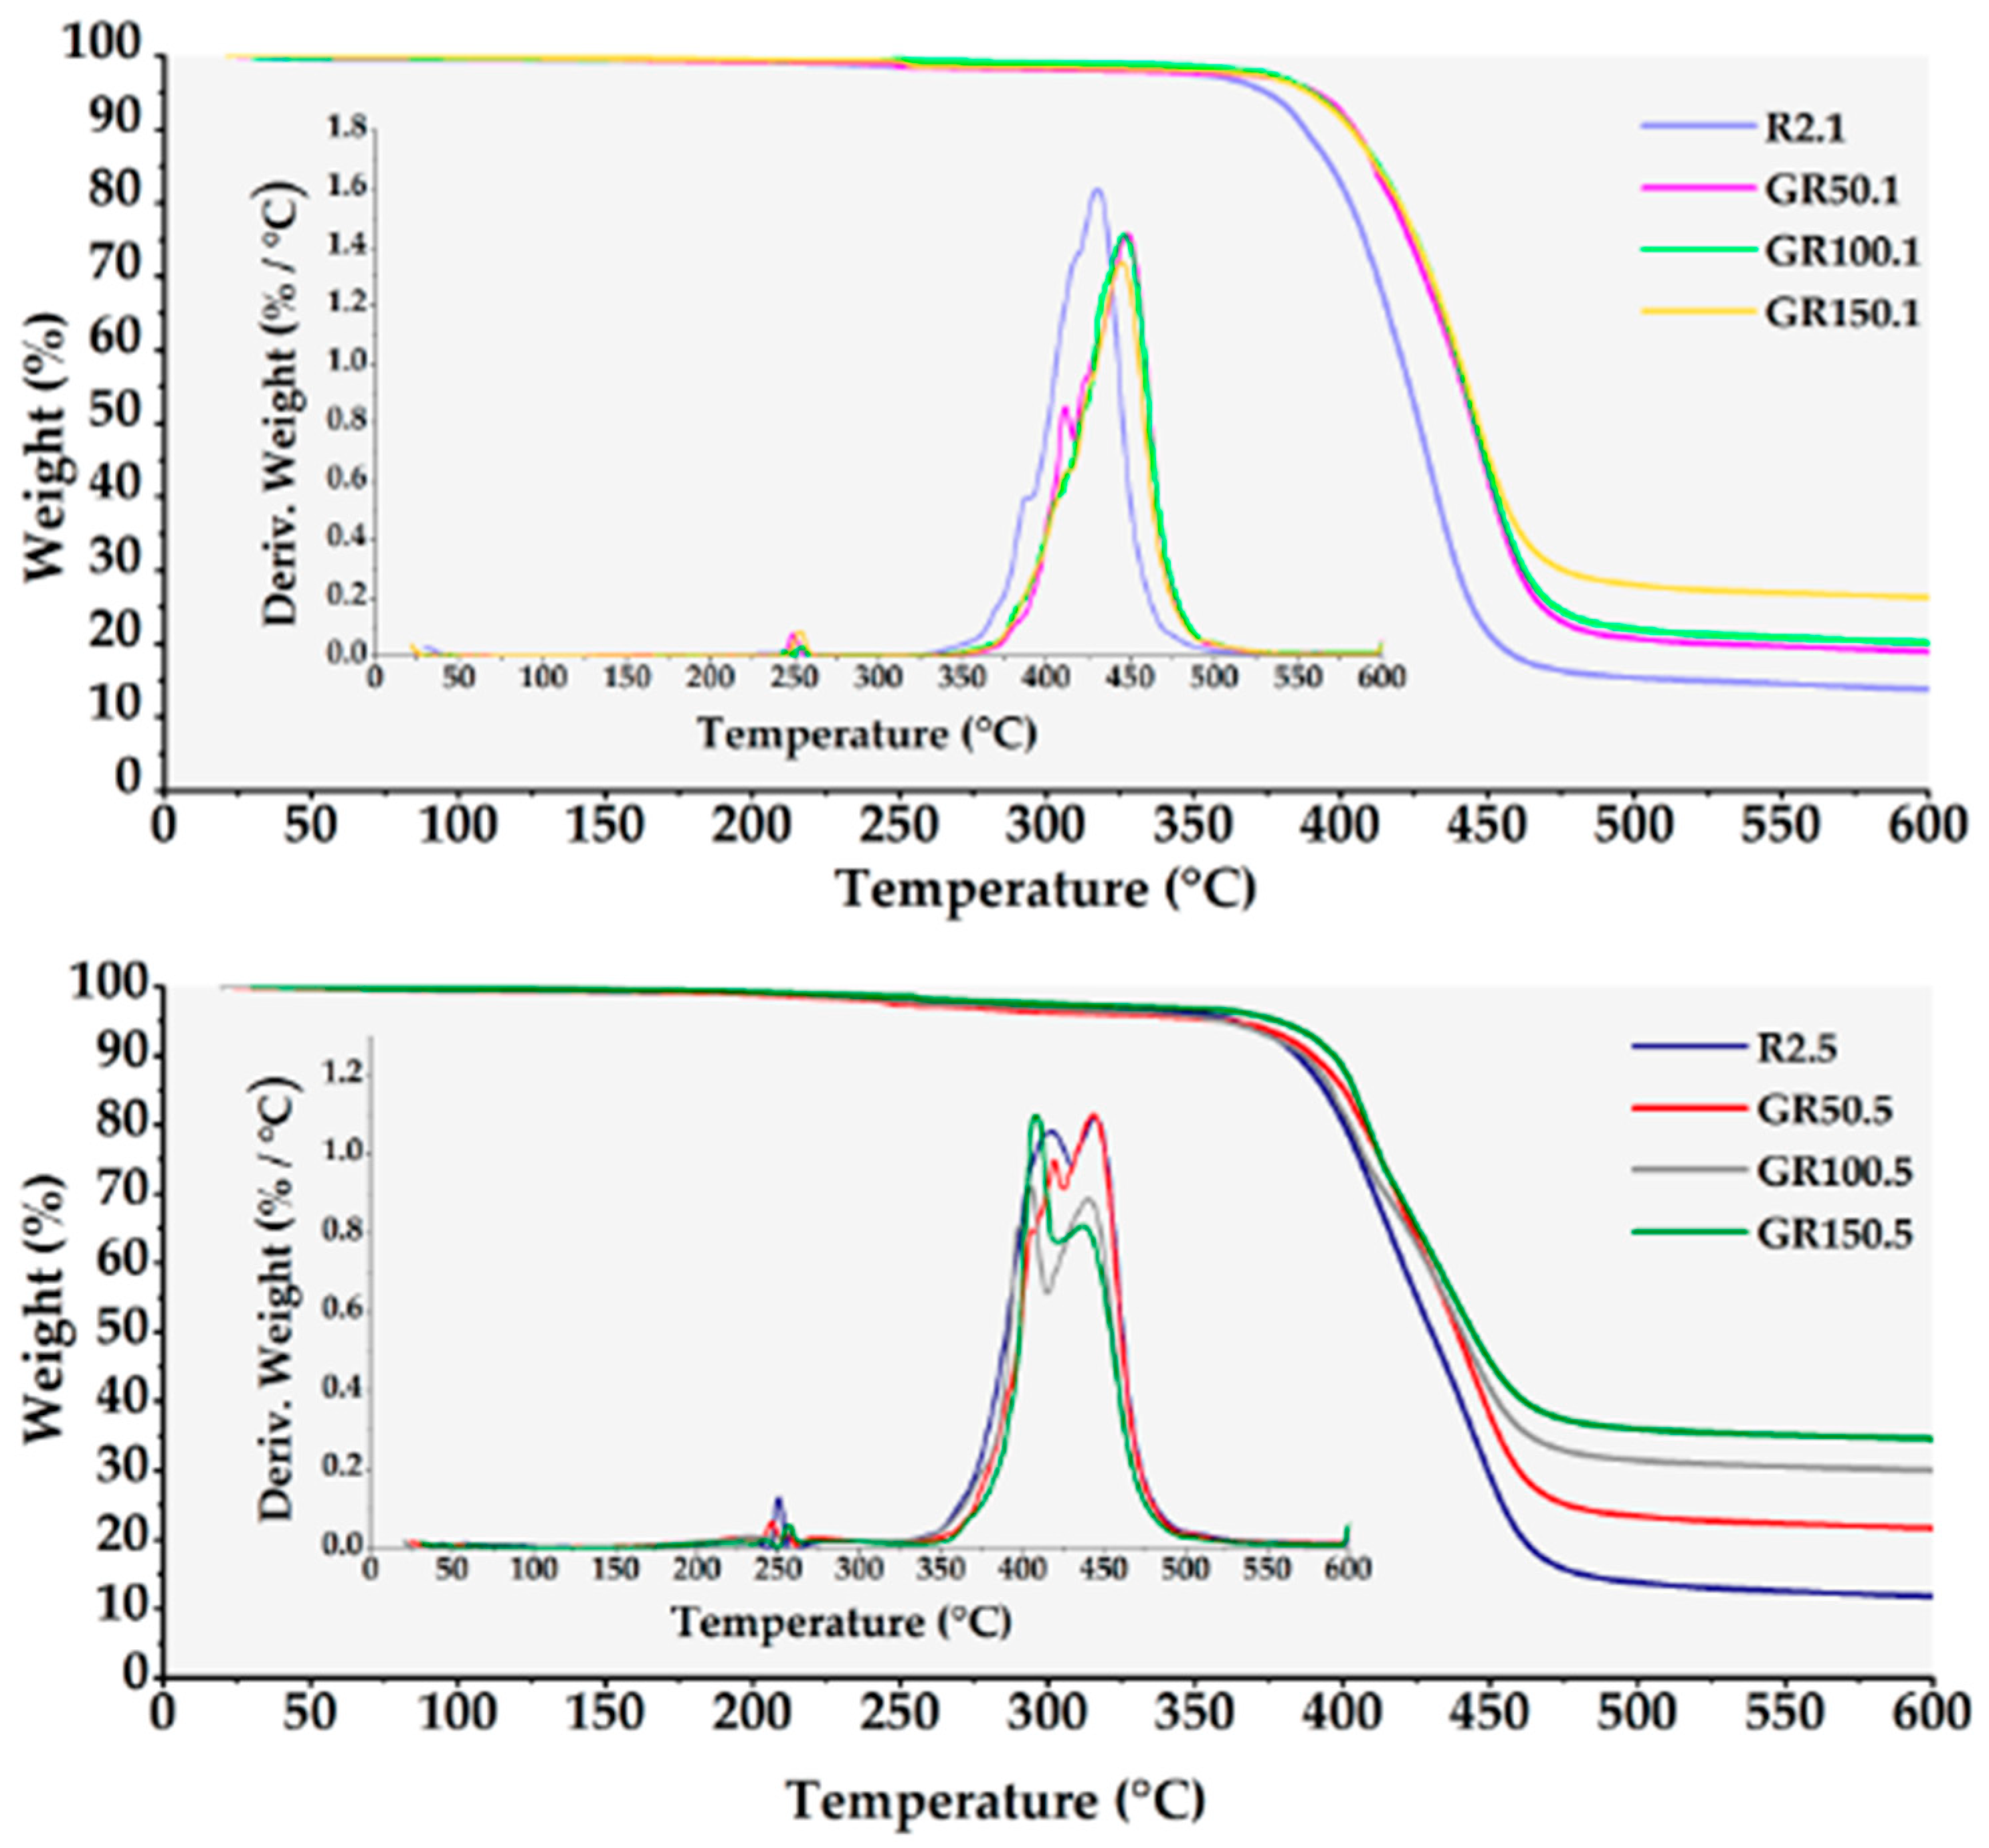
3.3. Thermal Stability Results

The DSC test results for reference and graphene-coated samples are presented in Figure 8. There was no significant difference in the melting temperature values of the fabrics coated with graphene at different concentrations in different thicknesses compared to each other and the reference fabrics, similar to the study of Yang et al. [22]. All samples gave a peak at nearly 254 °C, showing the melting temperature of the polyester fabrics.
TGA and DTG curves of samples with different coating thicknesses (0.1 and 0.5 mm) are given in Figure 9. The decomposition temperature range, DTG peak temperature, and total mass loss values are also presented in Table 6. The maximum decomposition rates are shown at the range of 350–450 °C. In this range, the mass losses were 76.03%, 55.03%, 54.76% and 52.4% for the R2.1, GR50.1, GR100.1 and GR150.1 samples, respectively, while the mass losses were 67.34%, 57.46%, 53.81% and 51.05% for the R2.5, GR50.5, GR100.5 and GR150.5 samples, respectively.
When the values were examined, it was seen that total mass loss decreased and thermal stability improved with the increase in both graphene concentration and coating thickness. The improvement in thermal stability was more significant, with increased coating thickness rather than increased concentration. This result was related to the total add-on amount (and, accordingly, the graphene content) and increased with thickness more than the concentration (Figure 4). The total mass loss at maximum concentration rates (GR150.1 and GR150.5) was reduced by 11.84% and 21.96%, respectively, compared to the related reference fabrics (R2.1 and R2.5). The TGA results conformed with some studies in the literature [13,23].

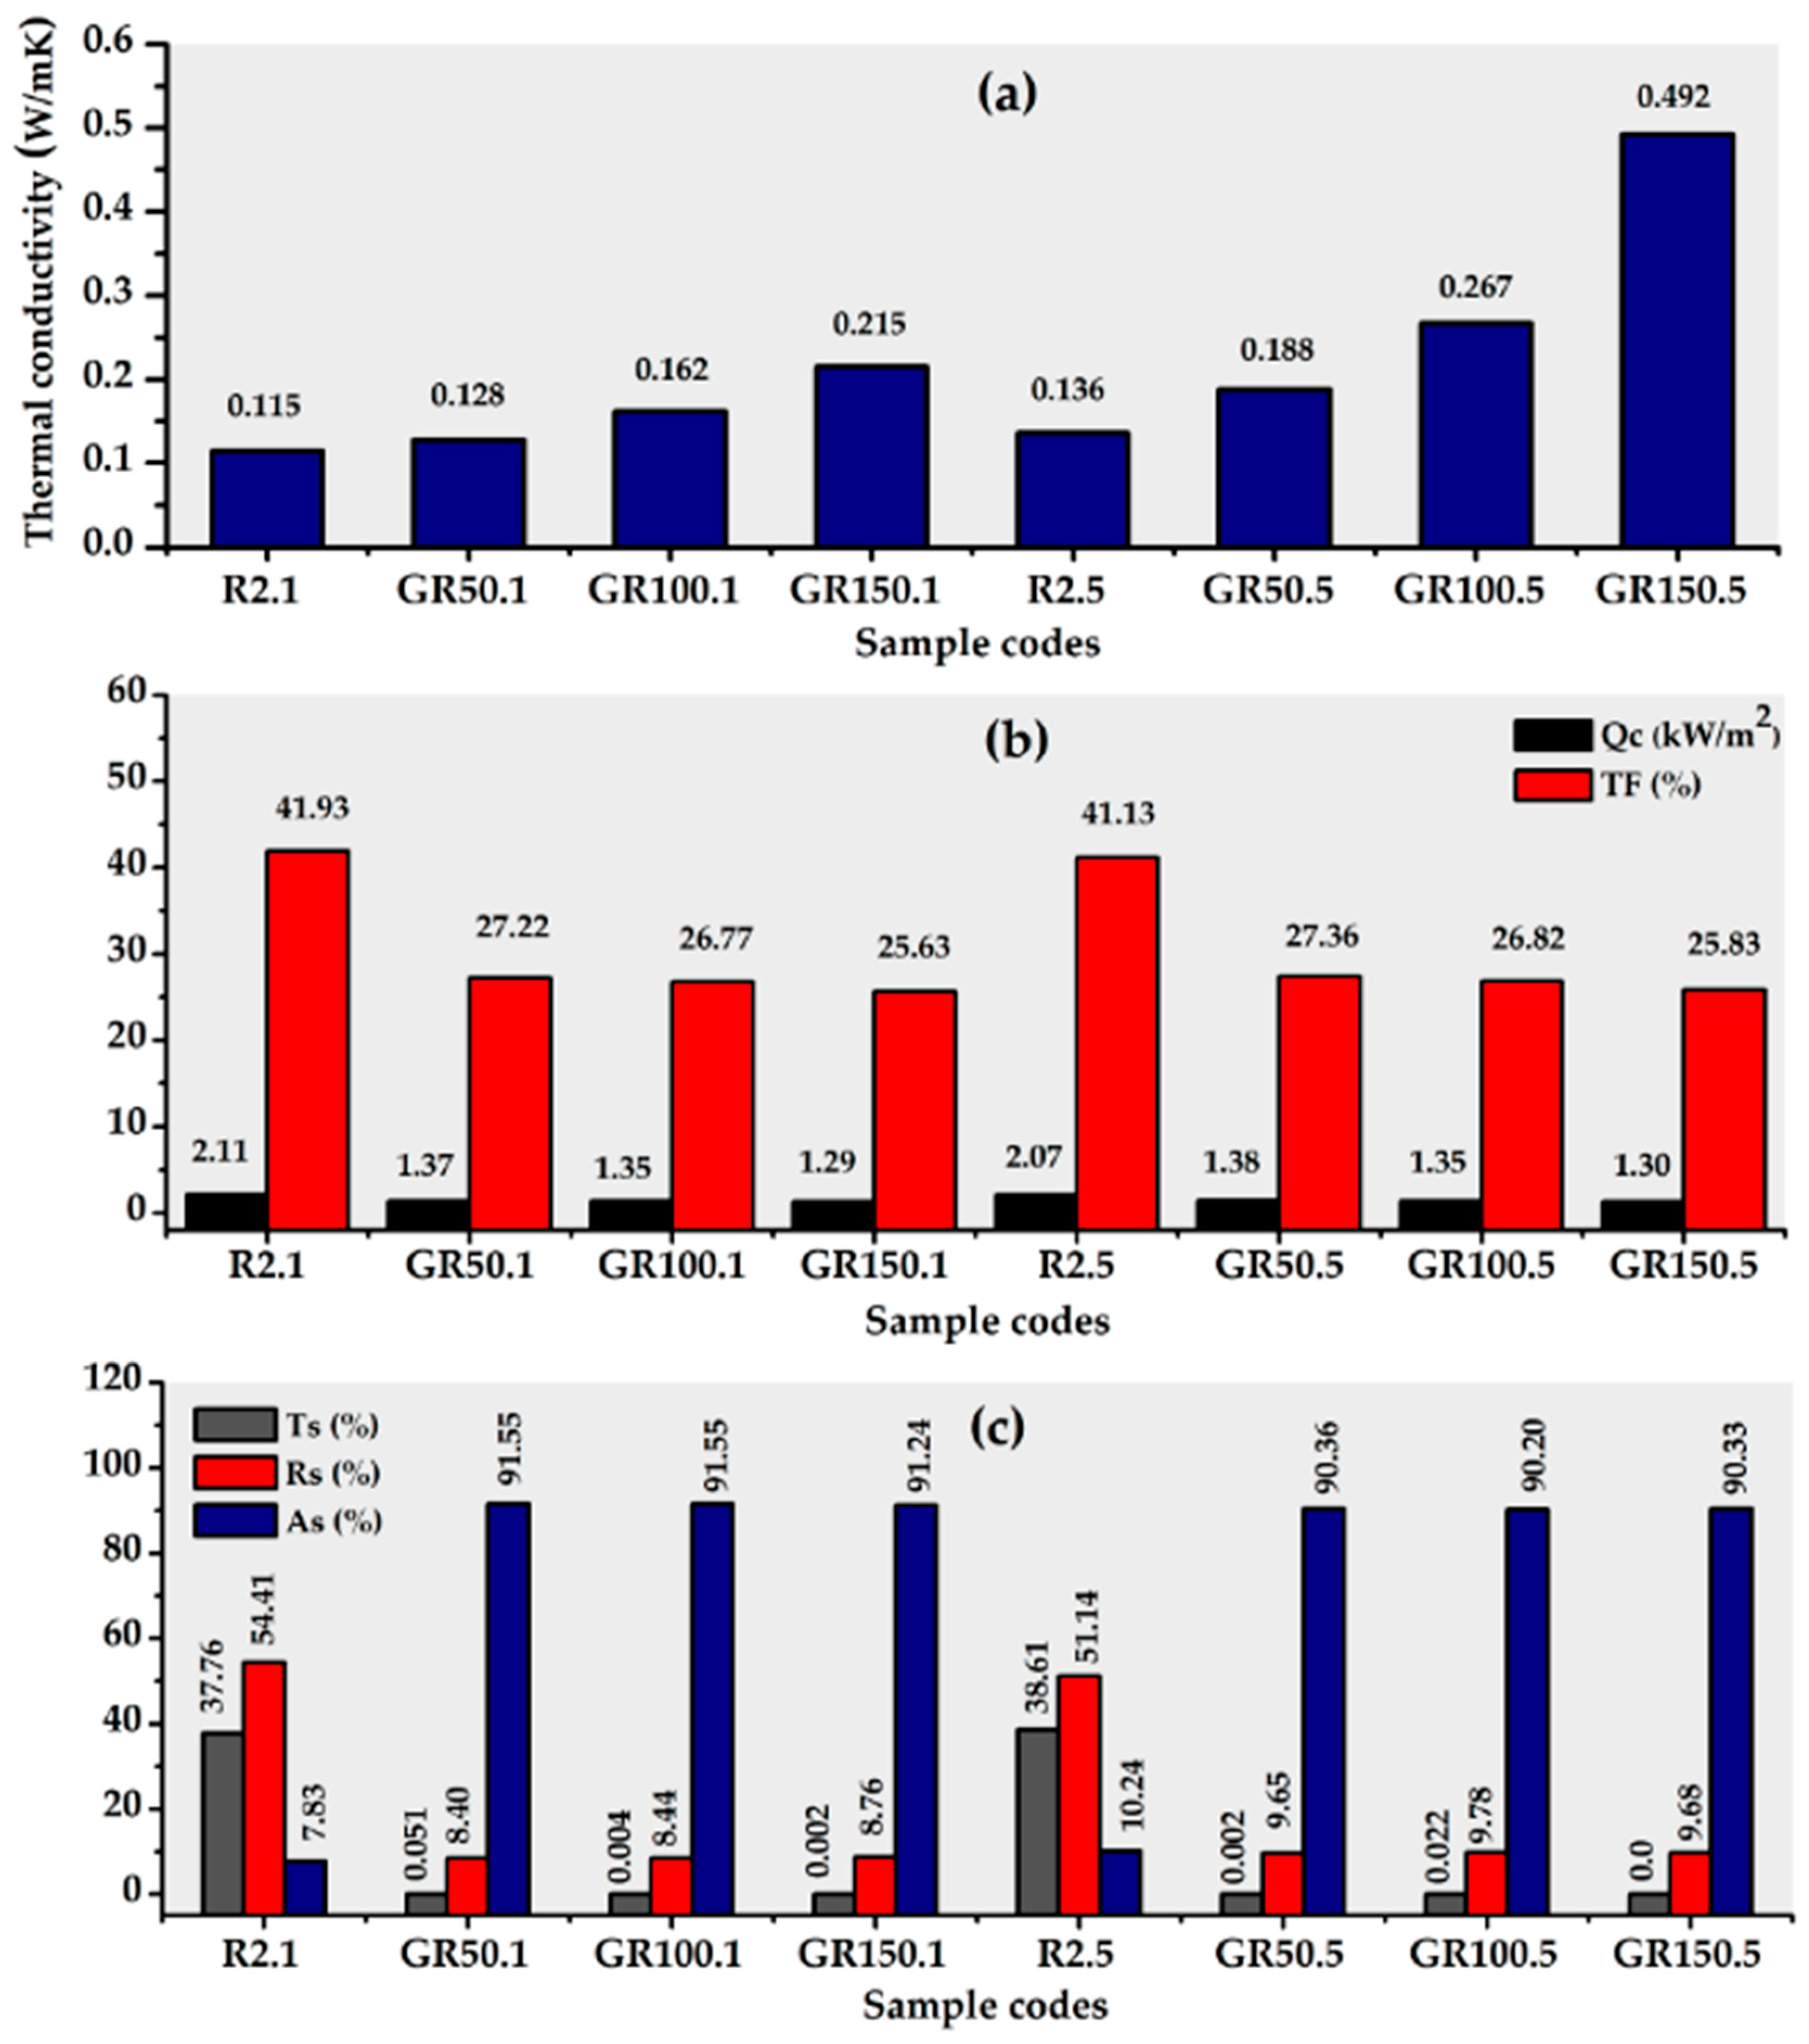
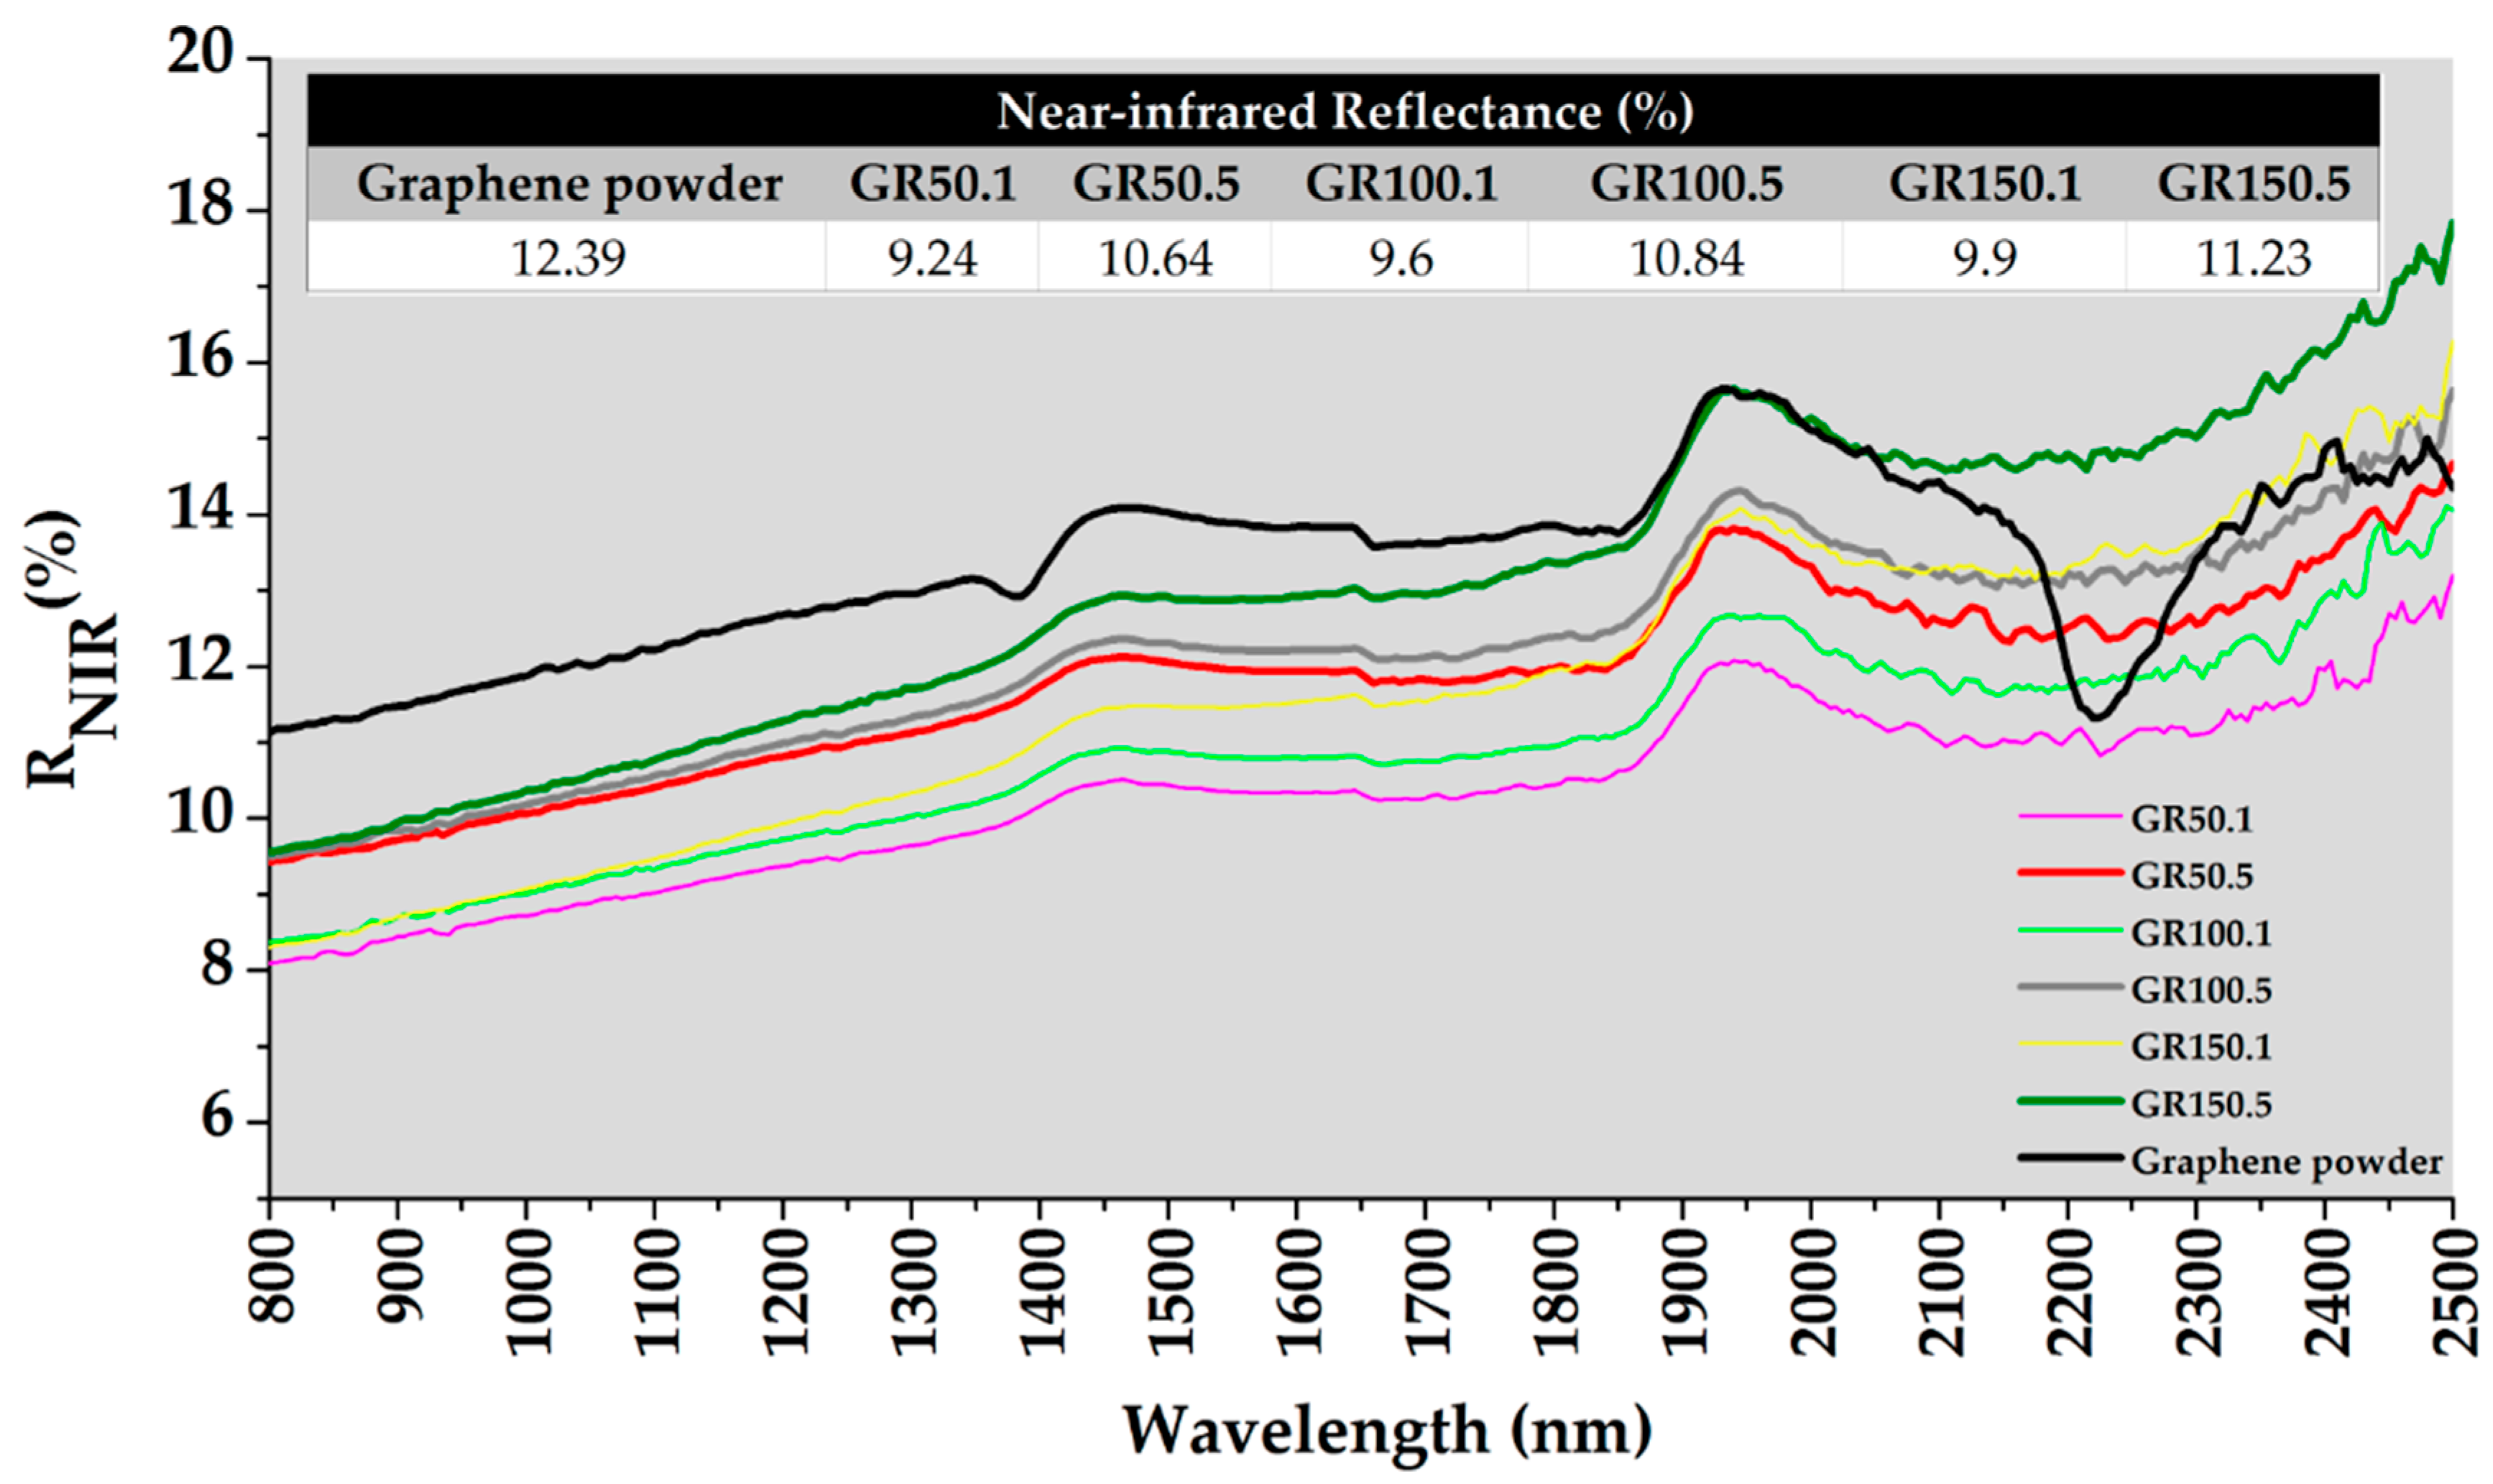
3.4. Thermal Conductivity and Spectrophotometry Results

Figure 10a shows the thermal conductivity coefficient (λ) values measured according to the hot wire method depending on the increasing graphene concentration and coating thickness. The fabrics coated at 0.1 mm coating thickness were examined; thermal conductivity values increased by 11%, 41%, and 87% for the GR50.1, GR100.1, and GR150.1 coded fabrics, respectively, compared to the R2.1 coded fabric. When the results were examined for 0.5 mm coatings, thermal conductivity values increased by 38%, 96%, and 262% for the GR50.5, GR100.5 and GR150.5 coded fabrics, respectively, compared to the R2.5 coded fabric. These results were consistent with other studies [14,15,24], showing that an increase in graphene concentration increases thermal conductivity.
The thickness is an important parameter that affects thermal conductivity. In the literature, some studies showed that the thermal conductivity changed directly proportionally with the coating thickness [25,26,27]. When the effect of coating thickness for the same concentrations was evaluated, conductivity values increased by 47%, 65% and 129% for 50, 100 and 150 g/kg rates, respectively, when the coating thickness increased from 0.1 to 0.5 mm. Therefore, these results are in-line with the previous studies.
Figure 10b shows the transmitted heat flux density (QC) and heat transmission factor (TF) values depending on the increasing graphene concentration and coating thickness.
When the graphene-coated fabrics were compared with each other, it was observed that the difference in coating thickness did not cause a significant change in the QC results. For a constant thickness value, the QC values decreased slightly as the graphene concentration increased. As can be seen from Equation (3), QC and TF values are directly proportional to each other. Therefore, TF values also showed parallel changes with QC.
It is known that graphene has a high thermal conductivity, and our results according to the JIS R 2618 standard were also consistent with this. However, according to the radiant heat transmission test results, there was no improvement in heat transmission with the increasing graphene concentration and coating thickness; on the contrary, the QC and TF values of the graphene-coated samples decreased compared to the reference fabrics. To interpret the results more comprehensively, considering the energy in the radiant heat test, it was necessary to examine the reflectance behavior of the samples in the near-infrared region. For this reason, the solar absorbance, reflectance, and transmittance values of the samples were also measured.
Figure 10c shows the solar transmittance (TS), reflectance (RS) and absorbance (AS) results of the graphene-coated and reference fabrics. Graphene concentration and coating thickness did not make a significant difference in transmittance values. Even with the lowest concentration and coating thickness, the solar transmittance values approached zero. The TS values of the samples at the maximum graphene concentration (GR150.1 and GR150.5) were almost zero and decreased by 37.76% and 38.61% compared to reference fabrics at 0.1 and 0.5 mm coating thickness, respectively. Similarly, when the graphene-coated fabrics were evaluated within themselves, there was no significant difference in reflectance results. With increasing graphene concentration compared to the R2.1 and R2.5, the RS values decreased by 46.01%, 45.97%, 45.65% and 41.49%, 41.36%, 41.46% for 0.1 mm and 0.5 mm coating thickness, respectively. It is known that carbon nanomaterials (graphene, carbon black, etc.) exhibit good optical absorption properties due to their dark colour [28]. In parallel with this fact, the solar absorbance (As) values of graphene-coated samples dramatically increased compared to the reference fabrics, even at the lowest graphene concentrations. The maximum increase rates were 83.72% and 80.12% at 0.1 and 0.5 mm thickness, respectively. All graphene-coated samples had close AS values. It was thought that because the colour reached a certain saturation with the lowest graphene concentrations, there was no significant increase in the absorbance values after 50 g/kg with increasing thickness and concentration.
The rays in the near-infrared region play an effective role in the radiant heat transmission test results mentioned above; therefore, the near-infrared reflectance (RNIR) behaviour was investigated separately from the RS. RNIR values tended to increase slightly with increasing concentration at a constant thickness, as shown in Figure 11. The increase was more apparent with increasing thickness at a constant concentration. While graphene powder had a 12.39% RNIR value, the closest sample to it was the GR150.5 sample with 11.23% RNIR.
When the radiant heat transmission results (QC, TF) given in Figure 10b and solar results were evaluated together, the following conclusions have been reached. Firstly, it was thought that the graphene-coated samples might have lower heat flux density and heat transmission factor values compared to the references due to their relatively high absorbance values. Secondly, it was concluded that the TF values, which decreased slightly with the increasing graphene concentration at the constant thickness, might be caused by the reflectance values showing small rises with increasing concentration in the near-infrared region.

4. Conclusions

The graphene nano platelet powder was successfully applied to the polyester woven fabrics by a knife-over-roll coating process. The effects of graphene concentration and coating thickness on the thermal stability, heat transmission behaviour, and solar properties of samples were examined. The structure and morphology of the coated samples were characterized by optical and SEM analysis. It was demonstrated that homogenous coating surfaces were obtained. While there was no significant change in the melting temperature according to DSC analysis, TGA results showed that graphene coating improved thermal stability.
In summary, the thermal conductivity results performed according to two different standards (JIS R 2618 and EN ISO 6942); in the contact heat transfer, extremely high rises in thermal conductivity values were observed in parallel with the increase in coating thickness and concentration. While graphene-coated fabrics showed lower radiant heat transmission rate compared to reference fabrics due to their high solar absorbance value, the heat transmission values of graphene-coated fabrics were close to each other due to slightly increased RNIR values.
As well as widely known application areas, graphene, which has superior mechanical, electronic, thermal, and optical properties, can be used in the functional textile coating and it is promising in contributing to multidisciplinary studies and open for development.

Author Contributions

Conceptualization, G.M., R.C., M.K., and Y.U.; methodology, G.M. and R.C.; investigation, G.M., R.C., M.K., and Y.U.; writing—original draft preparation, G.M. and R.C.; writing—review and editing, G.M., R.C., M.K., and Y.U.; supervision, M.K. and Y.U. All authors have read and agreed to the published version of the manuscript.

Funding

This research received no external funding.

Institutional Review Board Statement

Not applicable.

Informed Consent Statement

Not applicable.

Data Availability Statement

The data presented in this study are available on request from the corresponding author.

Conflicts of Interest

The authors declare no conflict of interest.

References

  1. Giessmann, A. Coating Substrates and Textiles: A Practical Guide to Coating and Laminating Technologies; Springer Science & Business Media: Heidelberg, Germany, 2012; p. 101. [Google Scholar]
  2. Singha, K. A review on coating & lamination in textiles: Processes and applications. Am. J. Polym. Sci. 2012, 2, 39–49. [Google Scholar]
  3. Qian, L.; Hinestroza, J.P. Application of nanotechnology for high performance textiles. J. Text. Appar. Technol. Manage. 2004, 4, 1–7. [Google Scholar]
  4. Gong, J.R. Graphene-Synthesis Characterization, Properties and Applications; InTech.: Rijeka, Croatia, 2011. [Google Scholar]
  5. Introduction to the Physical Properties of Graphene. Available online: http://web.physics.ucsb.edu/~phys123B/w2015/pdf_CoursGraphene2008.pdf (accessed on 26 November 2020).
  6. Radadiya, T.M. A properties of graphene. Eur. J. Mater. Sci. 2015, 2, 6–18. [Google Scholar]
  7. Shahil, K.M.; Balandin, A.A. Thermal properties of graphene and multilayer graphene: Applications in thermal interface materials. Solid. State. Commun. 2012, 152, 1331–1340. [Google Scholar] [CrossRef]
  8. Summary of Graphene (and Related Compounds) Chemical and Physical Properties. Available online: https://assets.publishing.service.gov.uk/government/uploads/system/uploads/attachment_data/file/627145/Summary_of_Graphene__and_Related_Compounds__Chemical_and_Physical_Properties.pdf (accessed on 5 July 2020).
  9. Hu, X.; Tian, M.; Qu, L.; Zhu, S.; Han, G. Multifunctional cotton fabrics with graphene/polyurethane coatings with far-infrared emission, electrical conductivity, and ultraviolet-blocking properties. Carbon 2015, 95, 625–633. [Google Scholar] [CrossRef]
  10. Lin, Y.; Jia, Y.; Alva, G.; Fang, G. Review on thermal conductivity enhancement, thermal properties and applications of phase change materials in thermal energy storage. Renew. Sust. Energ. Rev. 2018, 82, 2730–2742. [Google Scholar] [CrossRef]
  11. Sang, M.; Shin, J.; Kim, K.; Yu, K.J. Electronic and thermal properties of graphene and recent advances in graphene based electronics applications. Nanomaterials 2019, 9, 374. [Google Scholar] [CrossRef] [PubMed] [Green Version]
  12. Balandin, A.A. Thermal properties of graphene and nanostructured carbon materials. Nat. Mater. 2011, 10, 569–581. [Google Scholar] [CrossRef] [PubMed] [Green Version]
  13. Gan, L.; Shang, S.; Yuen, C.W.M.; Jiang, S.X. Graphene nanoribbon coated flexible and conductive cotton fabric. Compos. Sci. Technol. 2015, 117, 208–214. [Google Scholar] [CrossRef]
  14. Abbas, A.; Zhao, Y.; Zhou, J.; Wang, X.; Lin, T. Improving thermal conductivity of cotton fabrics using composite coatings containing graphene, multiwall carbon nanotube or boron nitride fine particles. Fiber. Polym. 2013, 14, 1641–1649. [Google Scholar] [CrossRef]
  15. Gunasekera, U.; Perera, N.; Perera, S.; Hareendra, Y.; Somaweera, L.; De Silva, N.; Tissera, N.; Wijesinghe, R. Modification of Thermal Conductivity of Cotton Fabric Using Graphene. In Proceedings of the Moratuwa Engineering Research Conference, University of Moratuwa, Moratuwa, Sri Lanka, 7–8 April 2015. [Google Scholar]
  16. TS 7128 EN ISO 5084-Textiles- Determination of Thickness of Textiles and Textile Products; Turkish Standard Institution: Ankara, Turkey, 1998.
  17. TS 251- Determination of Mass per Unit Length and Mass per Unit Area of Woven Fabrics; Turkish Standard Institution: Ankara, Turkey, 1991.
  18. EN ISO 6942- Protective Clothing—Protection Against Heat and Fire—Method of Test: Evaluation of Materials and Material Assemblies When Exposed to a Source of Radiant Heat; International Organization for Standardization: Geneva, Switzerland, 2002.
  19. JIS R 2618-Testing Method for Thermal Conductivity of Insulatıng Fire Bricks by Hot Wire; Japanese Standards Association: Tokyo, Japan, 1992.
  20. EN 14500:2008-Blinds and Shutters- Thermal and Visual Comfort-Test and Calculation Methods; European Committee for Standardization: Brussels, Belgium, 2008.
  21. EN 410-Glass in Building- Determination of Luminous and Solar Characteristics of Glazing; European Committee for Standardization: Brussels, Belgium, 2011.
  22. Yang, W.; Zhang, L.; Guo, Y.; Jiang, Z.; He, F.; Xie, C.; Fan, J.; Wu, J.; Zhang, K. Novel segregated-structure phase change materials composed of paraffin@ graphene microencapsules with high latent heat and thermal conductivity. J. Mater. Sci. 2018, 53, 2566–2575. [Google Scholar] [CrossRef]
  23. Moharram, M.A.; Ereiba, K.M.T.; El Hotaby, W.; Bakr, A.M. Thermal degradation studies of graphene oxide polymer composite. Middle East. J. Appl. Sci. 2015, 5, 23–30. [Google Scholar]
  24. Manasoglu, G.; Celen, R.; Kanik, M.; Ulcay, Y. Electrical resistivity and thermal conductivity properties of graphene-coated woven fabrics. J. Appl. Polym. Sci. 2019, 136, 48024. [Google Scholar] [CrossRef]
  25. Zhao, J.; Du, F.; Cui, W.; Zhu, P.; Zhou, X.; Xie, X. Effect of silica coating thickness on the thermal conductivity of polyurethane/SiO2 coated multiwalled carbon nanotube composites. Compos. Part A Appl. Sci. Manuf. 2014, 58, 1–6. [Google Scholar] [CrossRef]
  26. Rätzer-Scheibe, H.J.; Schulz, U.; Krell, T. The effect of coating thickness on the thermal conductivity of EB-PVD PYSZ thermal barrier coatings. Surf. Coat. Technol. 2006, 200, 5636–5644. [Google Scholar] [CrossRef]
  27. Griffin, A.J., Jr.; Brotzen, F.R.; Loos, P.J. Effect of thickness on the transverse thermal conductivity of thin dielectric films. J. Appl. Phys. 1994, 75, 3761–3764. [Google Scholar] [CrossRef]
  28. Chen, L.; Xu, C.; Liu, J.; Fang, X.; Zhang, Z. Optical absorption property and photo-thermal conversion performance of graphene oxide/water nanofluids with excellent dispersion stability. Sol. Energy 2017, 148, 17–24. [Google Scholar] [CrossRef]
Figure 1. Coating process on Atac GK 40 RKL.
Coatings 11 00125 g001
Figure 2. Radiant heat transmission measurement according to the EN ISO 6942 standard [18].
Coatings 11 00125 g002
Figure 3. Thermal conductivity measurement according to the JIS R 2618 standard [19] with QTM-710.
Coatings 11 00125 g003
Figure 4. Mass per unit area and add-on results (a) and thickness results of reference and graphene-coated fabrics (b).
Coatings 11 00125 g004
Figure 5. Front side images of fabrics (a,c,e,g,i,k,m,o) and reverse side images of fabrics (b,d,f,h,j,l,n,p).
Coatings 11 00125 g005
Figure 6. SEM images of reference fabrics for 0.1 and 0.5 mm coating thicknesses (Magnification: 100×).
Coatings 11 00125 g006
Figure 7. SEM images of graphene-coated fabrics (Mag: 150× for cross-section image).
Coatings 11 00125 g007
Figure 8. DSC curves of reference and graphene-coated fabrics.
Coatings 11 00125 g008
Figure 9. TGA and DTG curves of reference and graphene-coated fabrics for 0.1 and 0.5 mm coating thicknesses.
Coatings 11 00125 g009
Figure 10. Thermal results according to the JIS R 2618 standard [19] (a); thermal results according to the EN ISO 6942 standard [18] (b); and spectrophotometry results of the reference and graphene-coated fabrics [20,21] (c).
Coatings 11 00125 g010
Figure 11. Near-infrared reflection (RNIR) results of graphene powder and coated fabrics.
Coatings 11 00125 g011
Table 1. Properties of the base fabric.
PropertyWarpWeft
Yarn TypeTexturized polyesterTexturized polyester
Yarn Count (denier)300/72300/72
Yarn Density (thread/cm)3018
Yarn Crimp (%)1.160.30
Fabric Mass per Unit Area (g/m2)169
Fabric Thickness (mm)0.34
Table 2. Properties of coating chemicals.
ChemicalProperty
BinderAcrylic binder, anionic/nonionic
Synthetic thickenerNeutralized polyacrylate, anionic
Fixation agentThe butanone oxime-free blocked isocyanate-based cross-linking agent, anionic
Anti-foam agentHydrocarbons, ethoxylated fatty acids and silicic acid combination, nonionic
DispergatorAnionic
Ammonia25% liquid
Table 3. Properties of graphene.
PropertyValue
Purity (%)96–99
Surface area(m2/g)13–15
Thickness (nm)50–100
Diameter (µm)~5
Table 4. Recipe of coating paste.
Stock Paste (g)800
Graphene (g)X (50, 100, 150)
Dispergator (g)2
Anti-foam agent (g)14
Thickener/Water (g)Y
Total (g)1000
Table 5. Fabric codes.
CodeDefinition
R2.1Stock paste-coated reference fabric which has no filler (graphene) at 0.1 mm
R2.5Stock paste-coated reference fabric which has no filler (graphene) at 0.5 mm
GR50.1Coated fabric with 50 g/kg at 0.1 mm
GR50.5Coated fabric with 50 g/kg at 0.5 mm
GR100.1Coated fabric with 100 g/kg at 0.1 mm
GR100.5Coated fabric with 100 g/kg at 0.5 mm
GR150.1Coated fabric with 150 g/kg at 0.1 mm
GR150.5Coated fabric with 150 g/kg at 0.5 mm
Table 6. TGA data of samples.
SampleTemperature Range (°C)DTG Peak Temperature (°C)Mass Loss
(%)
Total Mass Loss
(%)
R2.1200–3002460.8584.73
350–45043276.03
450–600-7.85
GR50.1200–3002491.0479.98
350–45044855.03
450–600-23.91
GR100.1200–3002540.4378.90
350–45044654.76
450–600-23.71
GR150.1200–3002531.0272.89
350–45044552.40
450–600-19.47
R2.5200–3002501.6086.01
350–45044567.34
450–600-17.07
GR50.5200–3002462.5776.40
350–45044457.46
450–600-16.37
GR100.5200–3002562.3467.95
350–45044053.81
450–600-11.80
GR150.5200–3002571.7664.05
350–45043751.05
450–600-11.24
Publisher’s Note: MDPI stays neutral with regard to jurisdictional claims in published maps and institutional affiliations.

