Article

Multi-Analytical Research on the Caisson Painting of Dayu Temple in Hancheng, Shaanxi, China

1
Engineering Research Center of Historical and Cultural Heritage Protection, Ministry of Education, School of Materials Science and Engineering, Shaanxi Normal University, Xi’an 710069, China
2
Shaanxi Institute for the Preservation of Culture Heritage, Xi’an 710075, China
*
Authors to whom correspondence should be addressed.
Coatings 2021, 11(11), 1372; https://doi.org/10.3390/coatings11111372
Submission received: 14 October 2021 / Revised: 28 October 2021 / Accepted: 5 November 2021 / Published: 9 November 2021

Abstract

:
In this research, the caisson painting of Dayu Temple in Hancheng, Shaanxi, China, was analyzed via a multi-analytical methodology, using a pH meter, an ultra-depth-of-field optical microscope, a scanning electron microscope-energy dispersive spectrometer (SEM-EDS), a high-resolution X-ray diffractometer (XRD), a micro-confocal laser Raman spectrometer, a gas chromatography mass spectrometer (GC-MS), and X-ray fluorescence spectroscopy (XRF). With the corroborative evidence derived from the above analyses, it could be determined that the caisson painting of Dayu Temple was painted on bamboo paper and attached to hemlock wood substrate of the Pinaceae Tsuga genus using starch paste, with common colorants such as carbon black, cinnabar mixed with a small amount of red lead, ultramarine, and ultramarine mixed with Paris green, with animal glue having been adopted as a sizing agent. These results provide important scientific data for the production craft of precious caisson paintings, contributing to the revelation of their historic, artistic, and scientific value, and should enable conservators to make informed decisions in restoration.

1. Introduction

Dayu Temple [1] is located in the north of Zhouyuan Village, Sudong Township, Hancheng, Shaanxi Province (as is shown in Figure 1), formerly known as Daxia Yuwang Temple. DaYu was the chief of the tribe in ancient times. It is said that, during the time of Tang Yao Yu Shun, he used the method of dredging to control the catastrophic floods in the Yellow River Basin, which benefited all people. The temple is dedicated to his firm and indomitable perseverance, and hardworking and brave Chinese national spirit. It was built in the fifth year of Dade in the Yuan Dynasty (1301) and rebuilt in the seventh year of Wanli in the Ming Dynasty (1579).
The existing buildings include the dedication hall and the main hall, all of which are made up of shrines; the niches are made of wood with a brick base. The tops of the niches are made of caissons, the eaves of which are in a row, and there are five rows in the alcoves, each row containing 28 grids, with a total of 168 caisson paintings. Due to its brilliant color and exquisite brushwork, it has high historical and artistic value. The caisson paintings in the Great Hall of Dayu Temple in Hancheng are the most important part of the building. An on-site cultural relic survey found that large areas of the caisson paintings had been stripped, peeled off, polluted, warped, blistered, torn, and made brittle (as shown in Figure 2). Due to these factors, the wooden board base attached to the caisson paintings has also suffered from cracking, fracture, damage, decay, and other deterioration, placing the caisson paintings on the verge of self-destruction. If the caisson paintings are not repaired in time, they will disappear forever. This study aimed to use the multivariate analysis method to analyze and test the wooden board base, paper type, acidification degree, surface pigment, etc., of the caisson paintings of Dayu Temple in Hancheng, as the basis for analyzing the cause of the deterioration and the design of plans for restoration and protection.
The scientific analysis of cultural relics is gaining momentum, as it provides a rich source of fundamental information for art history and conservation [2,3,4,5,6,7,8,9,10,11]. There are large-scale collective efforts to preserve cultural artifacts through the multidisciplinary evaluation of material properties, so that these can be better studied and protected in the future.

2. Material Identification and Experimental Methods

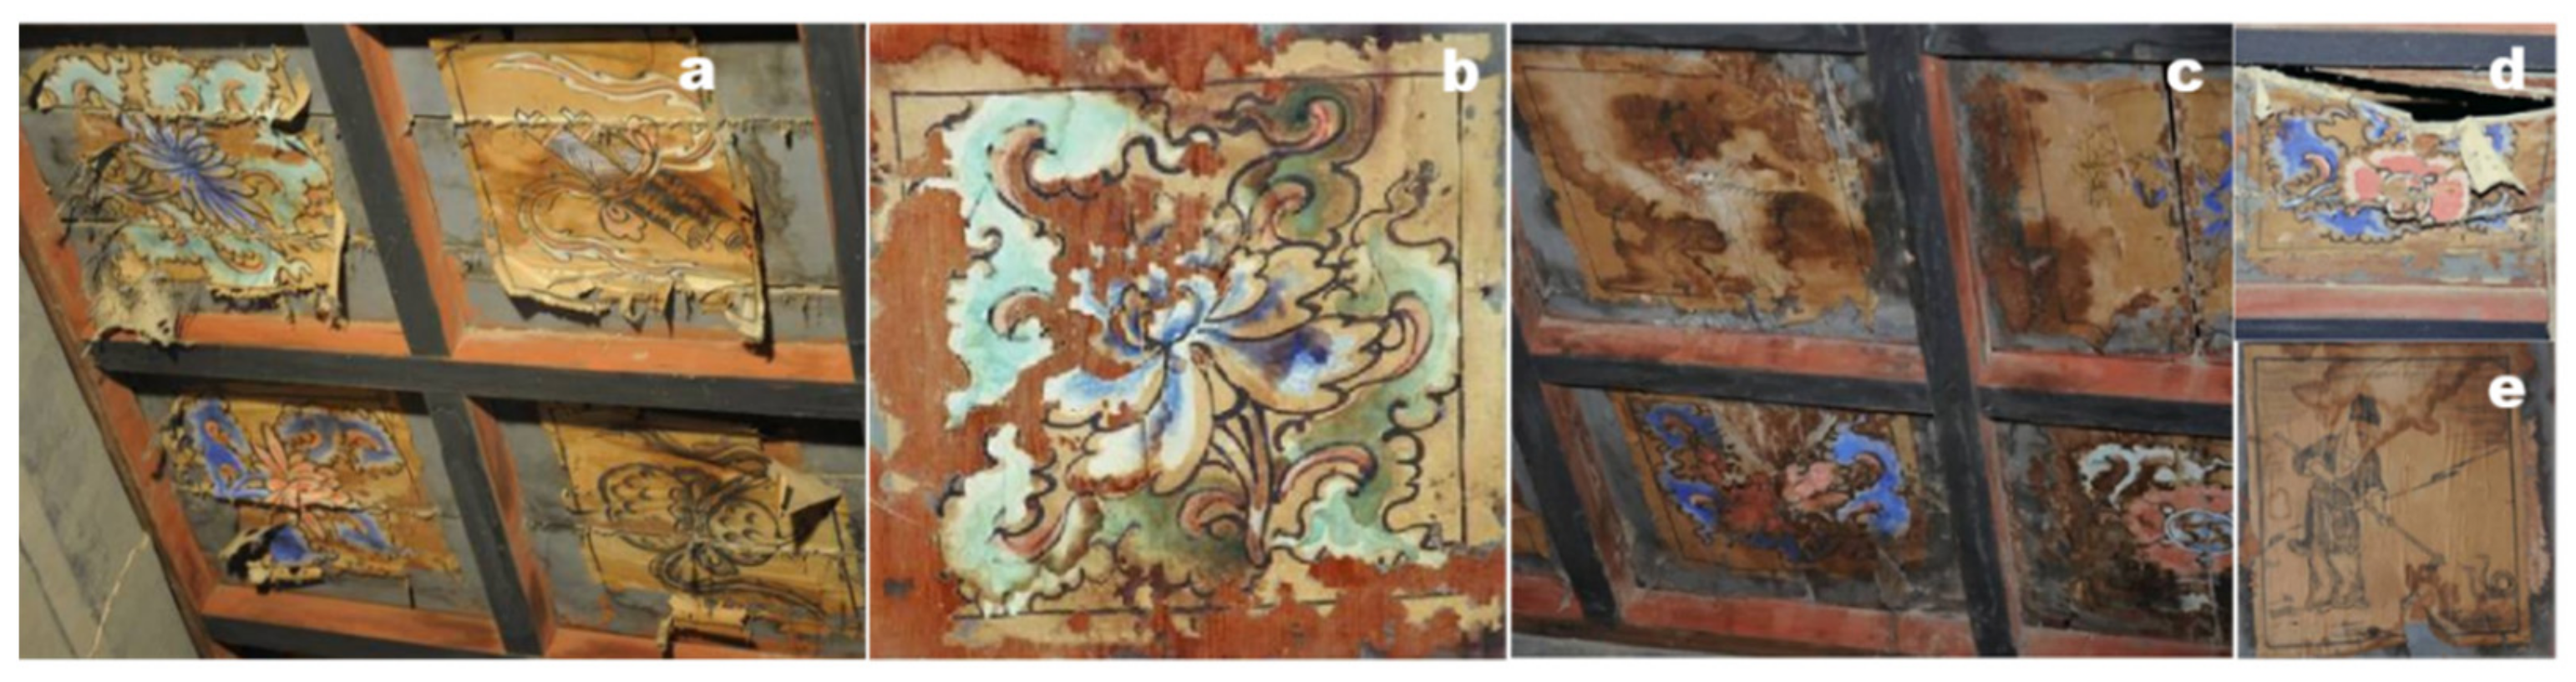
2.1. Sample Information

In order to ensure the maximum future and present aesthetic value of the caisson painting, this work analyzed fallen fragments and samples from hidden locations.

2.2. Sample Preparation

2.2.1. Wood Samples

Wood samples were collected and treated to obtain three-section standard cuboid samples (cross section, diameter section, and chord section) with thicknesses of about 15 microns by softening and cutting the bulk samples to attain observation sections. Using an optical microscope, we were then able to observe the structural characteristics of the wood using an optical microscope; we then referred to the wood database Inside Wood, “Chinese Wood History”, and a wood atlas to identify the species of the wood samples.

2.2.2. Paper Samples

After uncovering the caisson painting, it was discovered that there were also base paintings with different patterns mounted on many wooden boards, which are divided into two textures. According to the national standard GB/T4688-2002 “Analysis of Paper, Paperboard and Pulp Fiber Composition”, 0.5 g of the sample was dispersed in an aqueous solution under ultrasonic vibration and then diluted to make a fiber suspension with a mass fraction of 0.05%. Then, 1 mL of the diluted fiber suspension was dropped onto a glass slide and dispersed evenly with a dissecting needle. The Herzberg coloring agent was prepared and applied to dye the sample. The treated sample was covered with a cover glass after 1–2 min. The excess oozing solution was absorbed using filter paper, and the prepared sample was placed under an optical microscope with an ultra-high depth of field to observe the fiber structure, to determine the fiber type.
Paper fragments from a caisson painting, with no pigment attached, were taken and cut into 2 mm × 2 mm dimensions. Tweezers were used to clamp the conductive glue of the sample onto the electron microscope’s stage. An attempt was made to keep it flat. The same sample was used for SEM-EDS analysis to observe its microscopic appearance and for the determination of the elemental composition of the filler.

2.2.3. Pigment Samples

Paper samples with black, blue, red, and green pigments were picked from the fallen debris (as shown in Figure 3). One part was placed under a super-depth optical microscope to observe the particle shape, size, and morphology, and the other part, after appropriate preparation, was used for SEM-EDS analysis. Finally, a scalpel was used to gently scrape the pigment particles from the remaining fragments and place them on a glass slide. Subsequently, a few drops of alcohol were used to disperse the pigment particles. After the evaporation of the alcohol, the prepared sample was subjected to Raman analysis.

2.2.4. Sizing Sample

Paper scraps containing red, blue, and black pigments were selectively taken to test the sizing material contained in them.

2.3. Experiment Methods

pH meter: Three paintings with different sunlight intensities, water erosion degrees, and locations were selected to test the pH of the paper with a non-destructive acid meter (Sartorious PB-10, Sartorious Scientific Instruments Co., Ltd., Beijing, China) and the values at three different points for each selected sample area were measured.
Ultra-depth-of-field optical microscope: An ultra-depth-of-field optical microscope (KH-7700, Hirox Co., Ltd., Tokyo, Japan) was used to observe the macromorphology of the paper and pigments, and the magnification range was 20–120 times.
SEM-EDS: SEM-EDS (SU3500, Hitachi High-Tech Co., Tokyo, Japan) was used to detect the microscopic morphology, elemental composition, and distribution of the paper and pigments. The paper with different pigments was bonded to the metal electron microscope stage with conductive glue, and the sample was placed in an ion sputtering instrument, Baltek (SCD005). The setting conditions were vacuum mode, and the gold spraying time was 80 s, to increase the sample’s conductivity. The SEM was performed in high-vacuum mode. The working distance was 6.7 mm, and the microscopic appearance was observed in SE mode; the relevant parameters of the detector were scanning voltages of 5–15 kV and magnifications of 35–1500 times.
High-resolution X-ray diffractometer (XRD): XRD (Smart Lab (9), Rigaku Co., Tokyo, Japan) was used to detect the filler in the paper, the tube voltage was 40 kV, the tube current was 30 mA, and the scanning range of the diffraction angle was 5–90°, with a step angle of 0.02°.
Micro-confocal laser Raman spectrometer: A micro-confocal laser Raman spectrometer (in Via Reflex, Renishaw Co., Wotton-under-Edge, UK) was used to detect the Raman spectrum of the pigment. The laser wavelength was 532 nm, and the wavenumber range was 100–3200 cm−1; the objective lens was 50 times, the exposure time was 1 s, and the laser intensity was 0.005%–1%.
Gas chromatography mass spectrometer (GC-MS): A GC-MS (7890A/5975C) was used to detect the sizing material in the pigment. GC-MS was performed using a thermal pyrolysis instrument, PY-3030D (Shimadzu, Kyoto, Japan), and mass spectrometer (7890A/5975C, Shimadzu, Kyoto, Japan); the capillary column was DB-5MS UI (5% diphenyl/95% dimethicone), its inner diameter was 0.18 mm, the film thickness was 0.18 μm, and the length was 24 m (Agilent, USA). The thermal cracking furnace temperature was set to 600 °C, the interface temperature was set to 290 °C, the GC sampler temperature was set to 290 °C, and the split injection mode was adopted. The initial temperature of the column oven was 35 °C, and it was increased to 100 °C at a rate of 60 °C/min, then increased to 250 °C at a rate of 14 °C/min, and then increased to 315 °C at a rate of 6 °C/min, at which point it was held for 5 min. The carrier gas was helium, the inlet pressure was 145.3 kPa, and the split ratio was 1:20. The flow control was set to linear velocity mode. The mass detector voltage was 70 eV, and the scanning range was m/z 35–500. The interface temperature was 250 °C, and the ion source temperature was 200 °C. A sample of about 1 mm × 1 mm was taken and placed in a sample cup; 3 μL of 25% tetramethylammonium hydroxide (TMAH) methanol solution was then added with a pipette, the sample cup was placed into the pyrolysis instrument, and the instrument was started.

3. Results and Discussion

3.1. Pigments

3.1.1. Black

Figure 4a–d show the macro- and micromorphology of the black pigments. The particles of the black pigment were extremely small and dispersed on the entire paper fragments. The EDS test results show that C accounted for 54% of the sum of all the elements, which is in sharp contrast with the C content of the paper in the figure, at only 23%. Therefore, it was preliminarily speculated that the black pigment was carbon black. In the Raman spectrum, the Raman peaks of the black pigment were two small peaks, which appeared at 1358 and 1610 cm−1, which are consistent with the records in the literature. The characteristic Raman absorption peaks of carbon black at 1330 and 1580 cm−1 were similar, and the number of peaks and the peak shape were also similar. Based on the elemental composition obtained in the EDS test, carbon black could probably have been used as a black pigment [12].

3.1.2. Red

As shown in Figure 4e–h, the particle size of the red pigments varied greatly, ranging from 3 to 10 μm. The EDS results show that the elements in the red pigments were C, Hg, O, Pb, S, and Al, the contents of which were 21%, 20%, 17%, 9%, 9%, and 6%, respectively. According to the elemental composition, it was estimated that cinnabar (HgS) and red lead (Pb3O4) were both used in the red pigment. From the point of view of the contents, the content of Hg was higher than that of Pb. It was inferred that it was mainly cinnabar, mixed with a small amount of red lead.
Raman spectroscopy and analysis were performed on the different color-developing particles in the red pigment, and the results are shown in the figure. The vibration peak near 253 cm−1 was the most obvious, and the peak position and shape were determined to be cinnabar, while the strongest characteristic peaks in the other spectrum were at 393 and 551 cm−1, which was consistent with the Raman peak of the red lead, so it was determined that the red pigment was a mixture of cinnabar and red lead [13,14]. Some scholars have already studied ancient paintings for which cinnabar and red lead were simply mixed to prepare the desired color. After mixing, the discoloration of a single pigment can be inhibited, and the stability of the mixed pigment can be improved, but under light and high humidity, the deterioration of each is accelerated. This theory was also confirmed by the above analysis.

3.1.3. Blue

Figure 4i–l shows the macro- and micromorphology of the blue pigment. The color of the blue pigment was particularly bright. The particles were mostly block-shaped and granular, and the particle sizes were mostly between 3 and 7 μm. According to the EDS results, the elements were O, Si, Al, Na, S, and C, whose contents were 27%, 26%, 21%, 9%, 9%, and 3%, respectively. Among the blue mineral pigments commonly used in ancient China, it can be inferred from the elements that the mineral pigments used for blue were artificial ultramarine or lapis lazuli.
Since the Raman spectrum of the blue pigment showed absorption peaks at 547, 1096, and 1646 cm−1, and weak peaks at 258, 822, 1355, 1913, 2194, 2450, and 1734 cm−1, this corresponded to the characteristic peaks at 547, 259, 1094, and 1646 cm−1 of ultramarine [15,16,17] and lapis lazuli recorded in the literature. In addition, the absorption peaks at 547 and 258 cm−1 in the characteristic absorption peaks correspond to the symmetric stretching vibration and bending vibration of S3, respectively. However, because the peak positions of the Raman spectrograms of lapis lazuli and ultramarine were the same, it was found, through combined literature research, that Dayu Temple had undergone architectural renovations during the Ming and Qing Dynasties, and combined with the time when the artificial lapis lazuli or ultramarine was introduced into our country, it was finally determined that the blue pigment was ultramarine ((Na,Ca)8(AlSiO4)6(SO4,S,Cl)2).

3.1.4. Green

As shown in Figure 4m–p, the morphology of the green pigment shows an obvious mixture of dark blue and light green particles, and the blue was distributed throughout the whole; therefore, it was inferred that the blue had not been accidentally mixed in but had been deliberately mixed in the formulation of the pigments, and this was also proved by the EDS results. The contents of the elements O, Si, Al, As, S, Cu, and Na were 22%, 17%, 13%, 10%, 10%, 7%, and 4%, respectively. In addition to the Cu and As elements most commonly found in green mineral pigments, the contents of the elements Si, Al, S and Na were also quite high, corresponding to the elemental composition of ultramarine blue.
Moreover, the small blue particles in the green pigment were tested; the results show that the blue particles were ultramarine blue. It can also be seen from the microscopic morphology of the green pigment that, indeed, two kinds of particles with different shapes were present, one of which was blocky and granular with a particle size between 3 and 10 μm, and the other was a round particle, with a size as high as 22.5 μm. According to the elemental composition, shape, and size described in the literature, it can be determined that the light green is Paris green (Cu(CH3COO)2·3Cu(AsO2)2) [6,18]. The results show that the green pigment is a blend of ultramarine blue and Paris green according to the SEM-EDS and Raman data.

3.2. Paper

3.2.1. pH

Table 1 shows that the pH of the paper was between 3.6 and 4.1, which is far lower than 7. The lower the pH, the stronger the acidity, which indicates that the paper had been severely acidified. The H+ in the acid can easily catalyze the acid degradation of the cellulose molecules in the paper, causing the paper to become yellow, brittle, or even pulverized. Therefore, the caisson painting paper is in urgent need of protection.

3.2.2. Paper Fiber

As shown in Figure 5a,a1, there are stone cells and parenchyma cells of similar shape and size, and the content is relatively large. Based on a comparison with the “Chinese Paper Raw Material Fiber and Microscopic Atlas”, from the length and structure of the fiber and the morphological characteristics of the bamboo paper, it could be judged that the paper depicting the caisson painting was bamboo paper.
The paper of the bottom painting was obviously two materials of different appearance. Figure 5b,b1, and Figure 5c,c1 are the light-colored and dark-colored bottom-painting fiber diagrams, respectively, and the light-colored bottom painting had a rough fiber surface; it had a uniform diameter in the middle section and very small cell cavity, and sometimes, only a black line could be seen under the microscope, which was consistent with the characteristics of flax, so it was determined that the light-colored bottom-painting fiber was flax fiber.
The dark-colored bottom-painting fiber was shorter, and the cell cavity was larger than that for flax and continuous. The fiber tip was blunt and round, which is consistent with the fiber characteristics of hemp. Therefore, it was determined that the dark-colored bottom-painting fiber was hemp fiber.
Therefore, it was determined that carbon black, cinnabar mixed with a small amount of red lead, ultramarine, and ultramarine mixed with Paris green were the main pigments adopted, painted on the bamboo paper, and the bottom painting was obviously two different types of paper.

3.2.3. Filler of the Paper

The filler of the paper was added to the paper to improve the performance of the paper powder material, accounting for up to 40% of the paper stock. As shown in Figure 6, in addition to glue coating, the paper fibers were also distributed with fine particles, which were filled between interlaced fibers. However, the filler of the paper distribution was relatively loose, and the fibers were filled with larger gaps, which indicates that the glue coating was partially degraded, causing the filler to be unable to adhere to the paper, so it became less.
In addition, the EDS analysis results show that the composition of the paper included O, C, Si, S, Al, Na, and Mg, whose contents were 32.94%, 27.06%, 7.06%, 6.94%, 5.88%, 4.71%, and 4.65%, respectively. The high-resolution XRD tests show that, in addition to the diffraction angles (2θ = 16° and 22.3°) of cellulose, the main component of the paper, there were also the common fillers: talc (2θ = 9.2°), kaolin (2θ = 20.9°), barium sulfate (2θ = 26.7°, 28.2°, 31.2°, and 44.5°), etc.

3.3. Binding Media

Figure 7 shows the amino acid contents of the sizing materials in the three different samples. Asp, Gly, Val, Leu, Ile, Ser, Pro, Phe, Glu, Ala, Val, Phe, and Hyp represent aspartic acid, glycine, valine, leucine, isoleucine, proline, serine, phenylalanine, glutamic acid, alanine, valine, and hydroxyproline, respectively. The test results show that the sizing materials in the three pigments all contained Hyp, that is, hydroxyproline. Hydroxyproline is a unique amino acid of animal collagen [19,20], which confirms that the sizing material in the pigment was animal glue. Therefore, it was determined that carbon black, cinnabar mixed with a small amount of red lead, ultramarine, and ultramarine mixed with Paris green were the main pigments, with animal glue as a sizing agent.

3.4. Substrate

Figure 8a shows that the wood sample had no duct holes and had obvious growth rings, and there was a rapid transition from early wood to late wood; the early wood belt was wider; the early wood tracheal cell cavity was large and thin; the cross section was rectangular, square, and polygonal; and the pits on the diameter wall were typically arranged in one column, occasionally two columns, and were round to oval. The latewood belt was narrow, only 1/4 to 1/3 of the width of the growth ring, the color was darker, the tracheal cavity was small, the wall was thick, and it is obvious that the wood was denser than the early wood. The cross section was oblong, the diameter wall pits were in one column and round, and the pit aperture was lens-shaped; the pits on the tracheid chord wall of the last series of the wheel were obvious. Figure 8b shows that the axial parenchymas were very few, and were round-shaped, often containing dark resin, and the parenchyma cell end wall was obviously thickened. Figure 8f shows that the wood rays were a single column (rarely in pairs), typically 1–23 (mostly 5–13) cells or more. The wood ray cells were composed of ray tracheids and ray parenchyma cells. The ray tracheids were mostly found on the upper and lower edges of ray parenchyma cells. The low rays were composed of ray tracheids, the inner wall had no serrations, the outer edge was wavy, and the cell wall had marginal pits; Figure 8c shows the ray parenchyma cells. Horizontal wall pits and nodular thickening of the end wall were obvious; the wall contained dark resin, and no crystals were seen. Figure 8d shows that, for the cross-field pitted cypress wood type, usually two to four pits, resin channels were not seen. By combining GB/T 16734-1997 “Main Timber Names in China” and the monograph “Chinese Timber History”, it was determined that the caisson painting of Dayu Temple in Hancheng, Shaanxi, China, was painted on a wood substrate, which are hemlocks of the Pinaceae Tsuga genus [21,22,23,24,25].

4. Conclusions

This work performed a preliminary investigation of the caisson painting of Dayu Temple in Hancheng, Shaanxi, China. The pigments, paper, and wood substrate were identified by using multi-analytical methods to extract information on its historic and artistic value, thus providing valuable information for understanding the level of craftsmanship and cultural features. It was determined that carbon black, cinnabar mixed with a small amount of red lead, ultramarine, and ultramarine mixed with Paris green were the main pigments, with animal glue as a sizing agent, painted on bamboo paper and attached to wooden substrates of hemlocks of the Pinaceae Tsuga genus with starch paste. Moreover, identifying the material composition of a caisson painting can form a basis for effective conservation and preservation.

Author Contributions

J.L. conceived the research, designed the research methodology, performed experiments, performed data acquisition and processing, and drafted the manuscript; B.M., P.F., Y.L. (Yanli Li) and G.T. performed measurements and data acquisition and processing; Y.L. (Yanli Li) discussed the results and reviewed and corrected the manuscript; J.W. and J.C. designed the research methodology, conducted data analysis, and revised the manuscript; Y.L. (Yuhu Li), J.C., and J.W. contributed equally to this work. All authors have read and agreed to the published version of the manuscript.

Funding

The authors gratefully acknowledge the financial support by the National Natural Science Foundation of China (No. 22102094), the Fundamental Research Funds for the Central Universities (No. GK 202103061 and GK 202103058), and the Key Research and Development Program of Shaanxi Province, China (No. 2021SF-457).

Institutional Review Board Statement

Not applicable.

Informed Consent Statement

Not applicable.

Data Availability Statement

The datasets used and/or analysis results obtained in the current study are available from the corresponding author on request.

Acknowledgments

The authors thanks to Han Cheng Dayu Temple Cultural Relic Management Institute of China for their support and help in this project.

Conflicts of Interest

The authors declare that they have no conflicts of interest related to this work. We declare that we do not have any commercial or associative interest that represents a conflict of interest in connection with the work submitted.

References

  1. Wang, J.; Hu, D.; Xing, H.; Qi, Y.; Li, Y. Facile and scalable conservation of chinese ancient paintings using water-borne fluoropolymer. ACS Omega 2020, 5, 33162–33169. [Google Scholar] [CrossRef] [PubMed]
  2. Brocchieri, J.; Viguerie, L.; Sabbarese, C.; Boyer, M. Combination of noninvasive imaging techniques to characterize pigments in buddhist thangka paintings. X-ray Spectrom. 2020, 50, 320–331. [Google Scholar] [CrossRef]
  3. Ilmi, M.M.; Nurdini, N.; Maryanti, E.; Saiyasombat, C.; Setiawan, P.; Kadja, G.T.M.; Ismunandar. Multi-analytical characterizations of prehistoric rock art pigments from karim cave, sangkulirang–mangkalihat site, east kalimantan, indonesia. Microchem. J. 2020, 155, 104738. [Google Scholar] [CrossRef]
  4. Izzo, F.; Germinario, C.; Grifa, C.; Langella, A.; Mercurio, M. External reflectance ftir dataset (4000–400cm−1) for the identification of relevant mineralogical phases forming cultural heritage materials. Infrared Phys. Technol. 2020, 106, 103266. [Google Scholar] [CrossRef]
  5. Levy, I.K.; Neme Tauil, R.; Valacco, M.P.; Moreno, S.; Siracusano, G.; Maier, M.S. Investigation of proteins in samples of a mid-18th century colonial mural painting by maldi-tof/ms and lc-esi/ms (orbitrap). Microchem. J. 2018, 143, 457–466. [Google Scholar] [CrossRef]
  6. Liu, Z.-f.; Zhang, H.; Zhou, W.-h.; Hao, S.-c.; Zhou, Z.; Qi, X.-k.; Shi, J.-l. Pigment identification on an undated chinese painting by non-destructive analysis. Vib. Spectrosc. 2019, 101, 28–33. [Google Scholar] [CrossRef]
  7. Mai, H.; Yang, Y.; Jiang, H.; Wang, B.; Wang, C. Investigating the materials and manufacture of jinzi: The lining of futou (chinese traditional male headwear) from the astana cemeteries, xinjiang, china. J. Cult. Herit. 2017, 27, 116–124. [Google Scholar] [CrossRef]
  8. Moyo, S.; Mphuthi, D.; Cukrowska, E.; Henshilwood, C.S.; van Niekerk, K.; Chimuka, L. Blombos cave: Middle stone age ochre differentiation through FTIR, ICP-OES, ED-XRF and XRD. Quat. Int. 2016, 404, 20–29. [Google Scholar] [CrossRef]
  9. Fazlali, F.; Gorji Kandi, S. Identification of pigments in artworks by inverse tangent derivative of spectrum and a new filtering method. Herit. Sci. 2020, 8, 93–103. [Google Scholar] [CrossRef]
  10. Ricca, M.; Paladini, G.; Rovella, N.; Ruffolo, S.A.; Randazzo, L.; Crupi, V.; Fazio, B.; Majolino, D.; Venuti, V.; Galli, G.; et al. Archaeometric characterisation of decorated pottery from the archaeological site of villa dei quintili (rome, italy): Preliminary study. Geosciences 2019, 9, 172–187. [Google Scholar] [CrossRef] [Green Version]
  11. Tarquini, O.; Pronti, L.; Lorenzetti, E.G.; Felici, A.C. Pigment identification on campana reliefs from the palatine hill and colosseum valley in rome. J. Cult. Herit. 2020, 43, 294–302. [Google Scholar] [CrossRef]
  12. Zhang, Y.; Wang, J.; Liu, H.; Wang, X.; Zhang, S. Integrated analysis of pigments on murals and sculptures in mogao grottoes. Anal. Lett. 2015, 48, 2400–2413. [Google Scholar] [CrossRef]
  13. Wang, X.; Zhen, G.; Hao, X.; Tong, T.; Ni, F.; Wang, Z.; Jia, J.; Li, L.; Tong, H. Spectroscopic investigation and comprehensive analysis of the polychrome clay sculpture of hua yan temple of the liao dynasty. Spectrochim. Acta A Mol. Biomol. Spectrosc. 2020, 240, 118574. [Google Scholar] [CrossRef]
  14. Lau, D.; Villis, C.; Furman, S.; Livett, M. Multispectral and hyperspectral image analysis of elemental and micro-raman maps of cross-sections from a 16th century painting. Anal. Chim. Acta 2008, 610, 15–24. [Google Scholar] [CrossRef]
  15. Ernst, R.R. In situ raman microscopy applied to large central asian paintings. J. Raman Spectrosc. 2010, 41, 275–284. [Google Scholar] [CrossRef]
  16. Fu, P.; Teri, G.-L.; Li, J.; Li, J.-X.; Li, Y.-H.; Yang, H. Investigation of ancient architectural painting from the taidong tomb in the western qing tombs, Hebei, China. Coatings 2020, 10, 688. [Google Scholar] [CrossRef]
  17. Zhou, W.-h.; Gan, Q.; Ji, J.-x.; Yao, N.; Wang, J.-g.; Zhou, Z.; Qi, X.-k.; Shi, J.-l. Non-destructive identification of pigments printed on six imperial china engraved coiling dragon stamps. J. Raman Spectrosc. 2016, 47, 316–320. [Google Scholar] [CrossRef]
  18. Fu, P.; Teri, G.; Li, J.; Huo, Y.; Yang, H.; Li, Y. Analysis of an ancient architectural painting from the jiangxue palace in the imperial museum, beijing, china. Anal. Lett. 2020, 54, 684–697. [Google Scholar] [CrossRef]
  19. Arjonilla, P.; Domínguez-Vidal, A.; Correa-Gómez, E.; Rubio-Domene, R.; Lluveras-Tenorio, A.; Ayora-Cañada, M.J.; Colombini, M.P. Characterization of organic materials in the decoration of ornamental structures in the alhambra monumental ensemble using gas-chromatography/mass spectrometry (gc/ms). Microchem. J. 2018, 140, 14–23. [Google Scholar] [CrossRef]
  20. Brecoulaki, H.; Andreotti, A.; Bonaduce, I.; Colombini, M.P.; Lluveras, A. Characterization of organic media in the wall-paintings of the “palace of nestor” at pylos, greece: Evidence for a secco painting techniques in the bronze age. J. Archaeol. Sci. 2012, 39, 2866–2876. [Google Scholar] [CrossRef]
  21. Cao, J.; Wang, J.; Li, Y.; Du, D.; Wang, S.; Qiang, L.; Feng, D. Identification of architectural heritage of ancient wood components from xi’an tang the imperical city hanguang entrance remains museum. J. Northwest For. Univ. 2015, 30, 234–241. [Google Scholar] [CrossRef]
  22. Cao, J.; Li, Y.; Wang, P. Identification of the wood species of the ancient buildings in zhaojia temple of qinghai. J. Northwest For. Univ. 2019, 34, 236–238. [Google Scholar] [CrossRef]
  23. Giachi, G.; Capretti, C.; Lazzeri, S.; Sozzi, L.; Paci, S.; Mariotti Lippi, M.; Macchioni, N. Identification of wood from roman ships found in the docking site of pisa (Italy). J. Cult. Herit. 2017, 23, 176–184. [Google Scholar] [CrossRef]
  24. Machado, J.S.; Pereira, F.; Quilhó, T. Assessment of old timber members: Importance of wood species identification and direct tensile test information. Constr. Build. Mater. 2019, 207, 651–660. [Google Scholar] [CrossRef]
  25. Mizuno, S.; Torizu, R.; Sugiyama, J. Wood identification of a wooden mask using synchrotron x-ray microtomography. J. Archaeol. Sci. 2010, 37, 2842–2845. [Google Scholar] [CrossRef]
Figure 1. The location of Dayu Temple in Hancheng, Shaanxi Province, China.
Coatings 11 01372 g001
Figure 2. Deterioration of Caisson Paintings. (a) Falling off; (b) missing; (c) pollution; (d) plank cracking; (e) blistering.
Coatings 11 01372 g002
Figure 3. The sampling points for the pigment samples.
Coatings 11 01372 g003
Figure 4. Macro- and micromorphology and elemental compositions of pigments. Macro-morphology (a,e,i,m), SEM (b,f,j,n), EDS (c,g,k,o) and Raman (d,h,l,p) of the Black (1), Red (2), Blue (3), Green (4) pigments.
Coatings 11 01372 g004
Figure 5. The morphology of the paper fiber (a,a1) is the caisson painting paper; (b,b1) and (c,c1), are the light-colored bottom painting with a rough surface and the dark-colored bottom painting with a smooth surface and brittle texture, respectively).
Coatings 11 01372 g005
Figure 6. SEM-EDS and XRD of the paper. (a,b) are magnified 500 and 1500 times, respectively.
Coatings 11 01372 g006
Figure 7. The amino acid contents of the pigments (red, blue, and black).
Coatings 11 01372 g007
Figure 8. Microscopic morphology of the wood sample. (a) Non-porous wood; rapid change from early wood to late wood. (b) Axial parenchyma like a wheel border. (c) The horizontal wall pits of the ray parenchyma cells and the nodular thickening of the end wall are obvious. (d) Cross-field cypress wood pattern. (e) The end wall of the axial parenchyma cell end wall is obviously thickened. (f) Single row of wooden rays.
Coatings 11 01372 g008
Table 1. pH values of the paper.
SamplepHAverage
14.0073.8754.3574.080
23.8423.4153.7493.669
34.0413.9784.0144.011
Publisher’s Note: MDPI stays neutral with regard to jurisdictional claims in published maps and institutional affiliations.

