Article

Prediction of Dissolved Impurities and Movement of Oxide Particles in the Primary Circuit of LBE Fast Reactor

1
Sino-French Institute of Nuclear Engineering and Technology, Sun Yat-Sen University, Zhuhai 510080, China
2
The Wuhan Second Boat Institution, Wuhan 430200, China
3
China Nuclear Power Technology Research Institute Co., Ltd., Shenzhen 518000, China
*
Author to whom correspondence should be addressed.
These authors contributed equally to this work and should be considered co-first authors.
Coatings 2021, 11(10), 1263; https://doi.org/10.3390/coatings11101263
Submission received: 8 September 2021 / Revised: 5 October 2021 / Accepted: 13 October 2021 / Published: 18 October 2021
(This article belongs to the Special Issue Friction, Wear Properties and Applications of Coatings)

Abstract

:
To better understand the corrosion and corrosion products behavior in the primary circuit of lead-bismuth eutectic (LBE) coolant reactor, the concentration distribution of soluble impurities and the transport of solid particles are investigated through the finite-element method. An axisymmetric model of the primary circuit of an LBE reactor was constructed to accelerate the calculation of the thermal hydraulic filed of the circuit. The saturation concentration of solute Fe, Cr and Ni in LBE coolant are identified through the equilibrium of their oxides and PbO, and the very different saturation concentrations of Fe/Cr/Ni in LBE will lead to significant element-selective corrosion. The migration of solid oxide particles in the primary circuit is also investigated by the Euler–Lagrange tracing model. The simulation shows that driving force for the movement of particles >100 μm is buoyancy, which lets particles float on a free surface, while particles <10 μm tend to suspend in coolant. However, the behavior of particles also depends on the formation position, the particles formed above the core have a high possibility of re-entering in the core.

1. Introduction

Lead-bismuth eutectic (LBE) alloy is the main candidate coolant for advanced fast reactor and candidate spallation target of high-energy neutron source because of its excellent thermal conductivity, chemical inertness and good neutronic characteristics [1]. However, in the high-temperature environment, the LBE coolant has a strong corrosive effect on the structure materials since main steel elements are soluble in LBE [2]. In a non-isothermal circuit, the LBE will corrode the material in the high-temperature zone, and the impurities will precipitate in the low-temperature zone due to the reduced solubility of the impurities, forming corrosion products (CPs) [3,4,5]. The main compositions of the CPs are PbO, Fe, Ni, Cr and their oxides [6]. The continuous precipitation of CPs in the cold zone and the growth of existed oxides particles can lead to severe blockages in the heat exchangers (HX) and fuel assemblies (FA), which may reduce flow and cooling efficiency [7].
Microscopic experiments had revealed the corrosion mechanism in LBE [8,9,10,11]. While steel is exposed to the oxygen containing LBE, duplex oxides layers are formed on the steels where the out layer is magnetite and the inner layer is spinel (Fe2+O[Fe3+,Cr3+]2O3). The experiments result directly showed the corrosion mechanism and the formation of a 15–20 μm spinel layer on steel in flowing oxygen containing an LBE environment (velocity of LBE is 2 m/s, co is about 1.6 × 10⁻⁶ wt.%, corrosion time is 503 h and temperature is 550 °C) [12]. For long-term corrosion, the thickness of the corrosion layer on 316 L steel can reach to about 60 μm (10,000 h corrosion in flowing LBE at 470 °C and 2 m/s [1]). The corrosion rate decreases with the growth of the oxide layer and, during the first 1000 h, the corrosion rate is about 0.011 μm/h [1]. Müiller proposed a reasonable theoretical explanation for the mechanism of duplex oxide layers formation, e.g., the diffusion of iron and oxygen [8]. The spinel forms firstly and grows inwards from the surface. Then, the thin spinel layer is formed, and iron diffuses from steel bulk to the outside surface and reacts with oxygen to form magnate. The corrosion mechanism diagram is shown in the Figure 1. And our static experiment result corroborated that clearly (experiment duration is 3300 h, the temperature is 550 °C and the oxygen is saturated).
According to previous studies, controlling the oxygen concentration in LBE is an effective method to reduce the corrosion on structure materials [13]. Gorynin discovered in 1999 that there were three types of corrosion, depending on the concentration of oxygen in LBE [14]. While oxygen concentration is too low to form a stable magnetite layer, the steel will continuously be dissolved by LBE; while the oxygen concentration is too high, steel will rapidly oxidize and a large amount of PbO will form; while the oxygen concentration is moderate, a protective oxide layer will form on the steel surfaces without a large amount of PbO formation. For a typical LBE reactor working in the temperature range of 300 to 500 °C, the ideal oxygen concentration in LBE is from 10−7 to 10−6 wt.% [2]. Even if keeping a moderate oxygen concentration in LBE, corrosion and corrosion products (CPs) are still a safety problem for long term operation [15]. A preliminary experiment has discovered that MYRRAH releases about 10−7 kg/s of iron in the primary circuit under normal operating conditions, which causes a safety concern in the long-term operation [7].
In order to provide important information for the design of impurity filtration and removal systems so as to ensure the stability of long-term operation, it is necessary to investigate the structure corrosion and CPs’ behavior in the primary circuit of the reactor [16,17,18]. Marino has investigated the concentration distribution of Fe in MYRRHA primary circuit in 2014 [7]. In the research, the heat field and the solubility equilibrium equation are combined to calculate the Fe concentration distribution, and the maximum concentration obtained is about 4 × 10⁻⁷ wt.%, which occurs above the core; otherwise, the research lacks other important impurity elements such as Ni and Cr which are studied in this article. The migration of oxide particles in LBE has not yet received enough attention. In this article, based on a normal LBE fast reactor design, the global corrosion in the structure was investigated, the concentration distribution of impurity was modeled and, finally, the migration behavior of corrosion products was predicted.

2. Service Condition of Structure Materials in LFR

2.1. Operation Condition of Typical LFR

A two-phase 2-D asymmetrical model was constructed by a finite-element-method (FEM) software COMSOL Multiphysics 5.5. The height of the reactor is 5.5 m and the radius is 2.484 m. Based on the dynamic unstructured grid method, a total mesh number of 70,000 was generated and a mesh refinement at the boundary layer of liquid LBE was made. The number of refined layers is 6 and the thickness of the outer layer is set to 2 mm to obtain a good representation of LBE flow. The interface between liquid LBE and cover gas is set to slip boundary condition to simulate the 2 phases of flow. The y+ algebraic turbulence model was used to simulate the turbulent flow within a RANS framework in that it is suitable for the internal flow and it supports the porous medium approximation.
The radius of the core is 0.7 m and the height is 1.7 m. The HX area is defined to 0.35 m × 1.7 m. The core is composed of a large number of fuel rods arranged in parallel vertically and the HX is of U-shape tubes with complex geometry. Thus, detailed simulation of the core and HX will consume a large amount of computing resources. To resolve this problem, a porous medium approximation was used to model the core and HX to match the expected pressure drops, which had shown good reliability according to [17,19].
To realize the porous medium approximation, porosity and the permeability of the core and HX were described as Equation (1):
ε = 1 V s V t K = Q μ L Δ P A
where ε is porosity (dimensionless,0 < ε < 1); Vs is volume of solid part; Vt is total volume of material; K is permeability; Q is volume flux through porous material; μ is fluid dynamic viscosity; L is length of the pressure drop; ∆P is pressure difference of the fluid passes caused by the porous material; A is cross section of porous material.
The mainstream conceptual design in the world and their principal parameters are listed in Table 1. A reference case was utilized as baseline model, the porosity of the reactor core is calculated as 0.3 and the porosity of HX is 0.62 according to the design of MYRRHA [19,20]. Permeability means the resistance of fluid flowing through porous medium in three dimensions. Lower permeability means a stronger resistance. The coolant flow in the core is assumed heterogenous: horizontal flow is very weak, referring to LFR operation experience, and the permeability is set to a very small value, 1 × 10⁻¹² m2; the strong vertical flow makes the pressure drop of the core equal to 1.7 bars.
Primary pump was simulated by applying volume force to the domain of the pump to match the total pressure drop of the primary circuit. The volume force of the pump was set to 1.2 × 10⁶ Pa/m and the height was 0.2 m. However, it was found in the simulation result that the flow velocity through the pump was incorrect and divergency happened. To improve the model, another porous model was utilized to configure the LBE flow in the pump [17]. To compensate for the pressure drop, the vertical permeability of the pump was set to 10−8 m2 and the volume force was set to 1.3 × 10⁶ Pa/m to assure that the flow field matched the design requirements.
The thermal power of the core was set as 100 MW. The temperature of the secondary loop was 593.15 K and the heat exchange coefficient was 0.85 × 10⁵ W/(m3·K) to maintain the thermal circuit in the reactor.

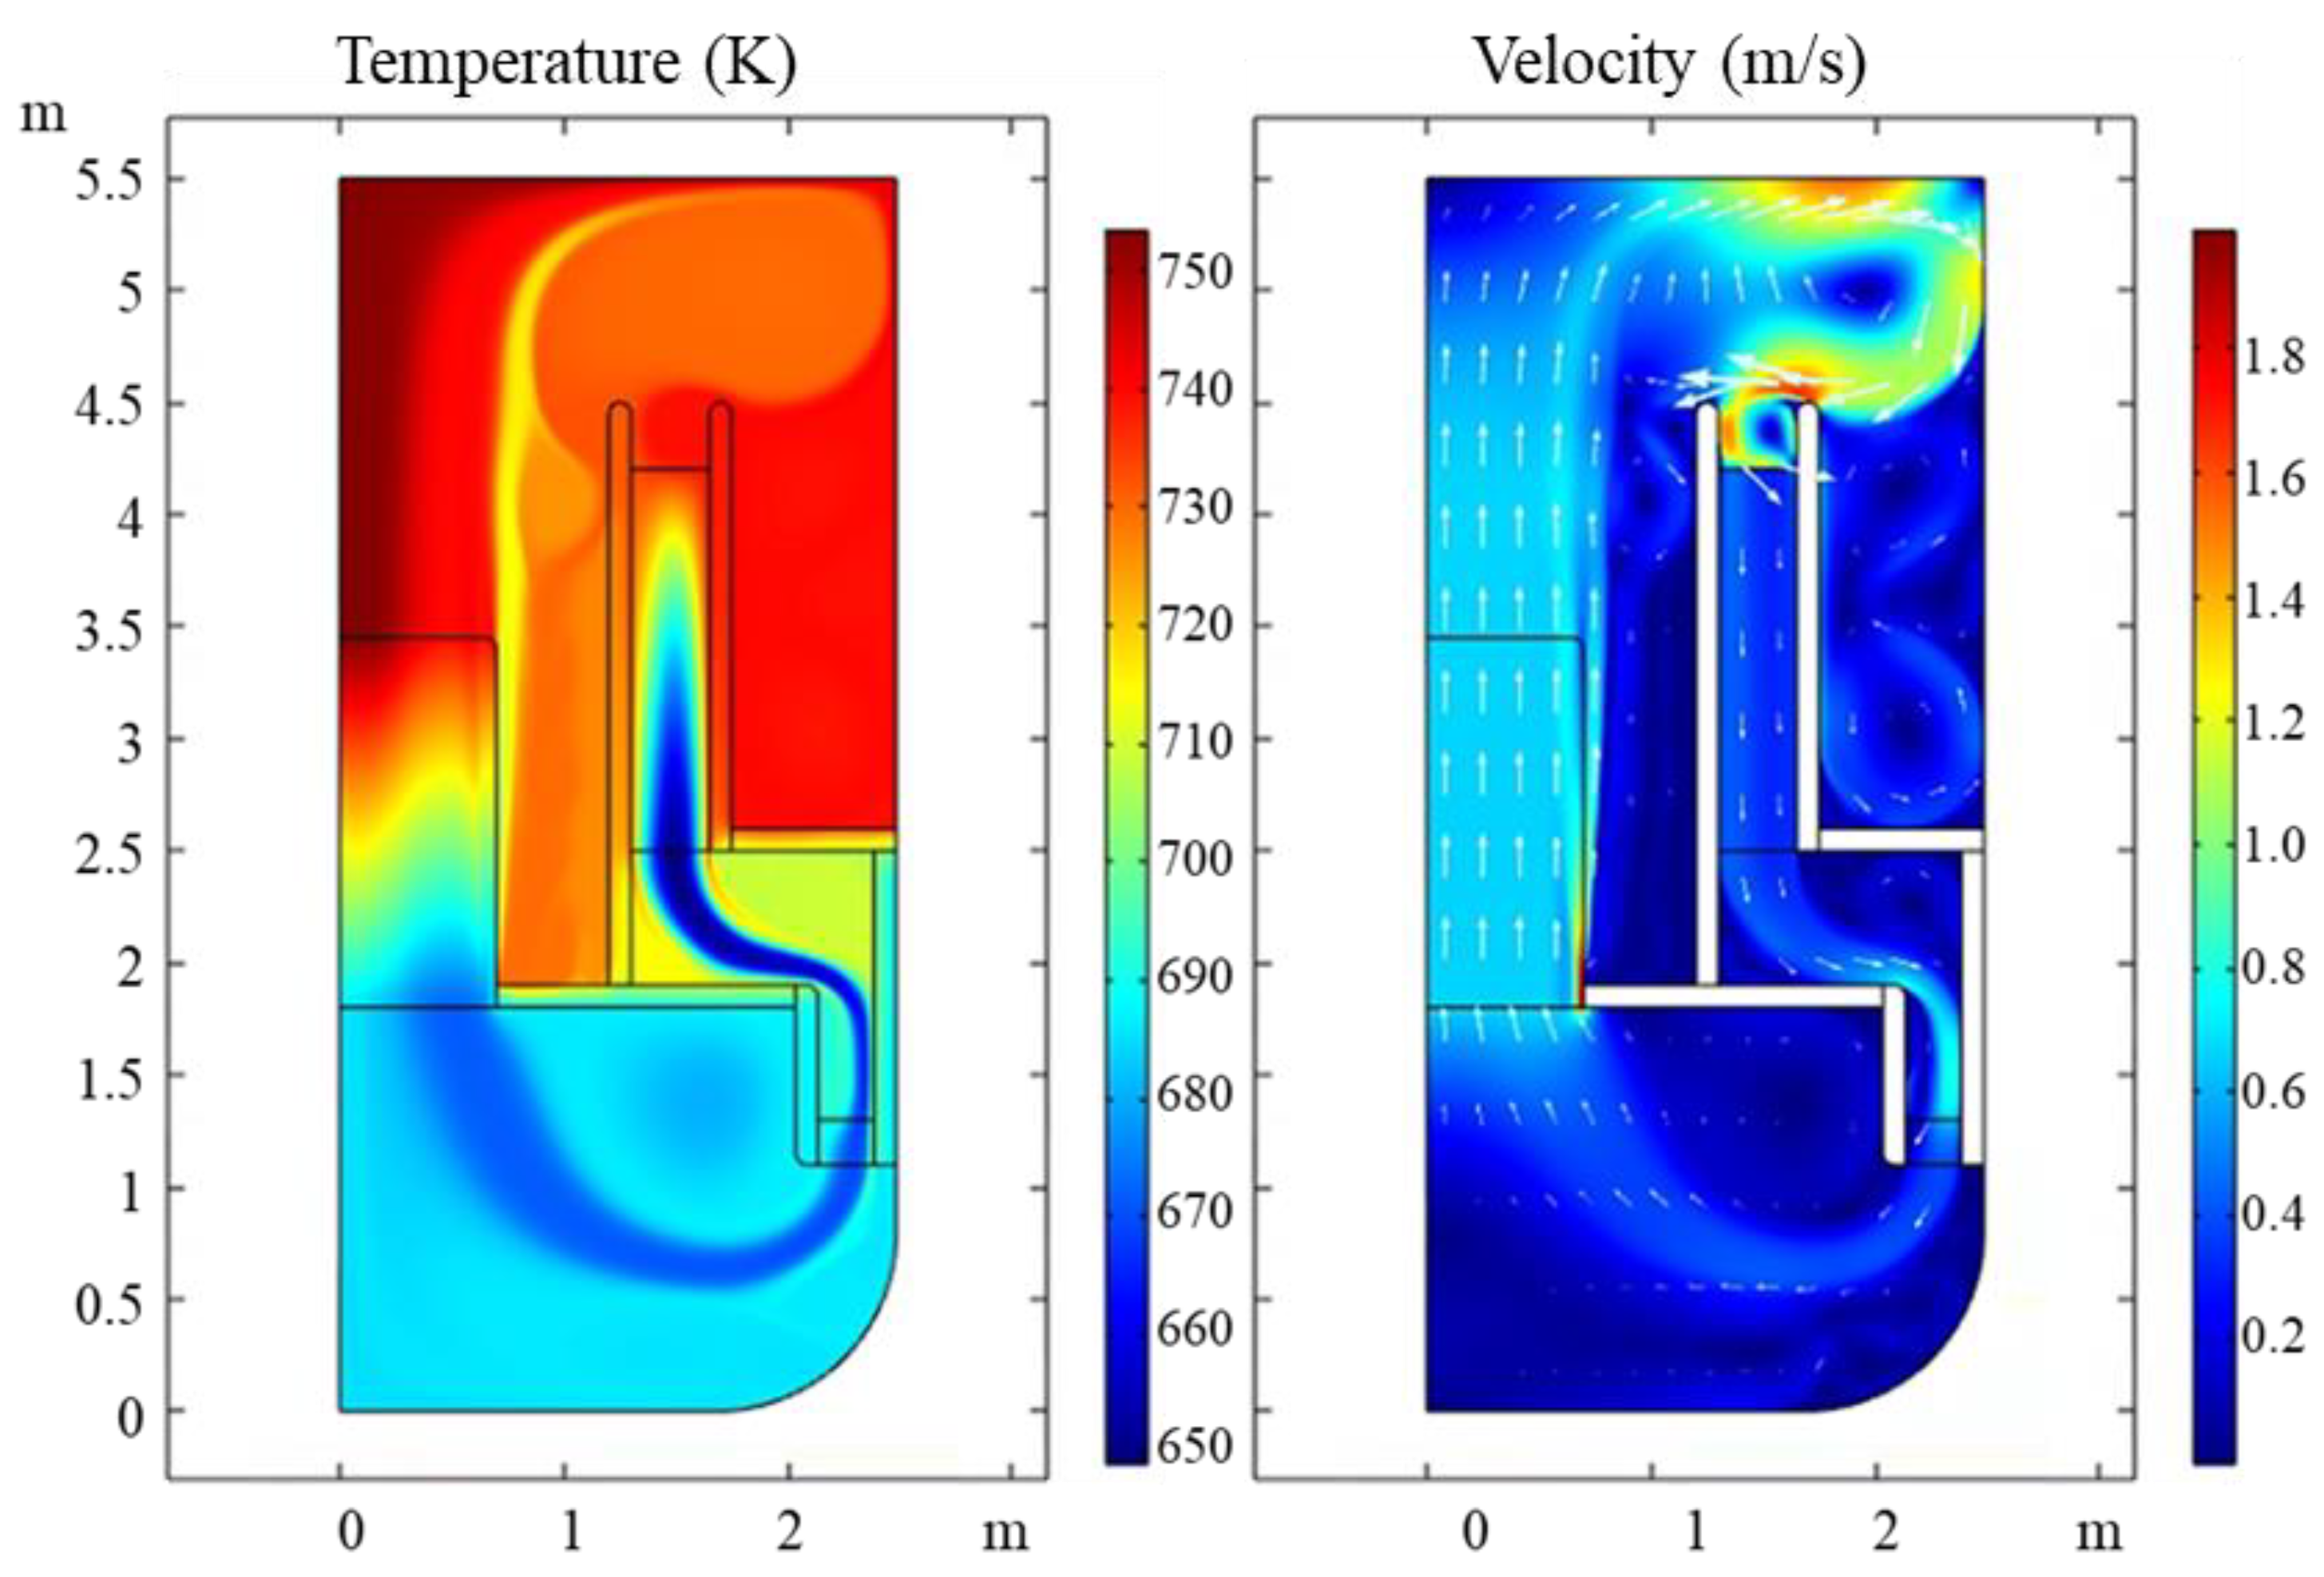
2.2. Flow Field and Temperature Field

As shown in the Figure 2, the maximum temperature appears at the outlet of the core as 753 K and the minimum temperature is in the HX as 650 K. The temperature difference is around 103 K. The maximum velocity in the circuit is 1.5 m/s at the inlet of the HX. We can also see that the horizontal flow velocity in the HX is almost 0 which means that the porous medium approximation can control very well the flow direction.
Meanwhile, the pressure of the primary circuit is calculated to verify whether the porous medium approximation is set correctly. The reference value of pressure is set to 0 at the top of the reactor. The pressure distribution in the primary circuit and on the line r = 0.1 m are shown in Figure 3, and we can see that the pressure decreases more quickly in the core and that the porous medium causes another pressure drop of 1.7 bars. Consequently, desired pressure drops are gained through porous medium approximation.

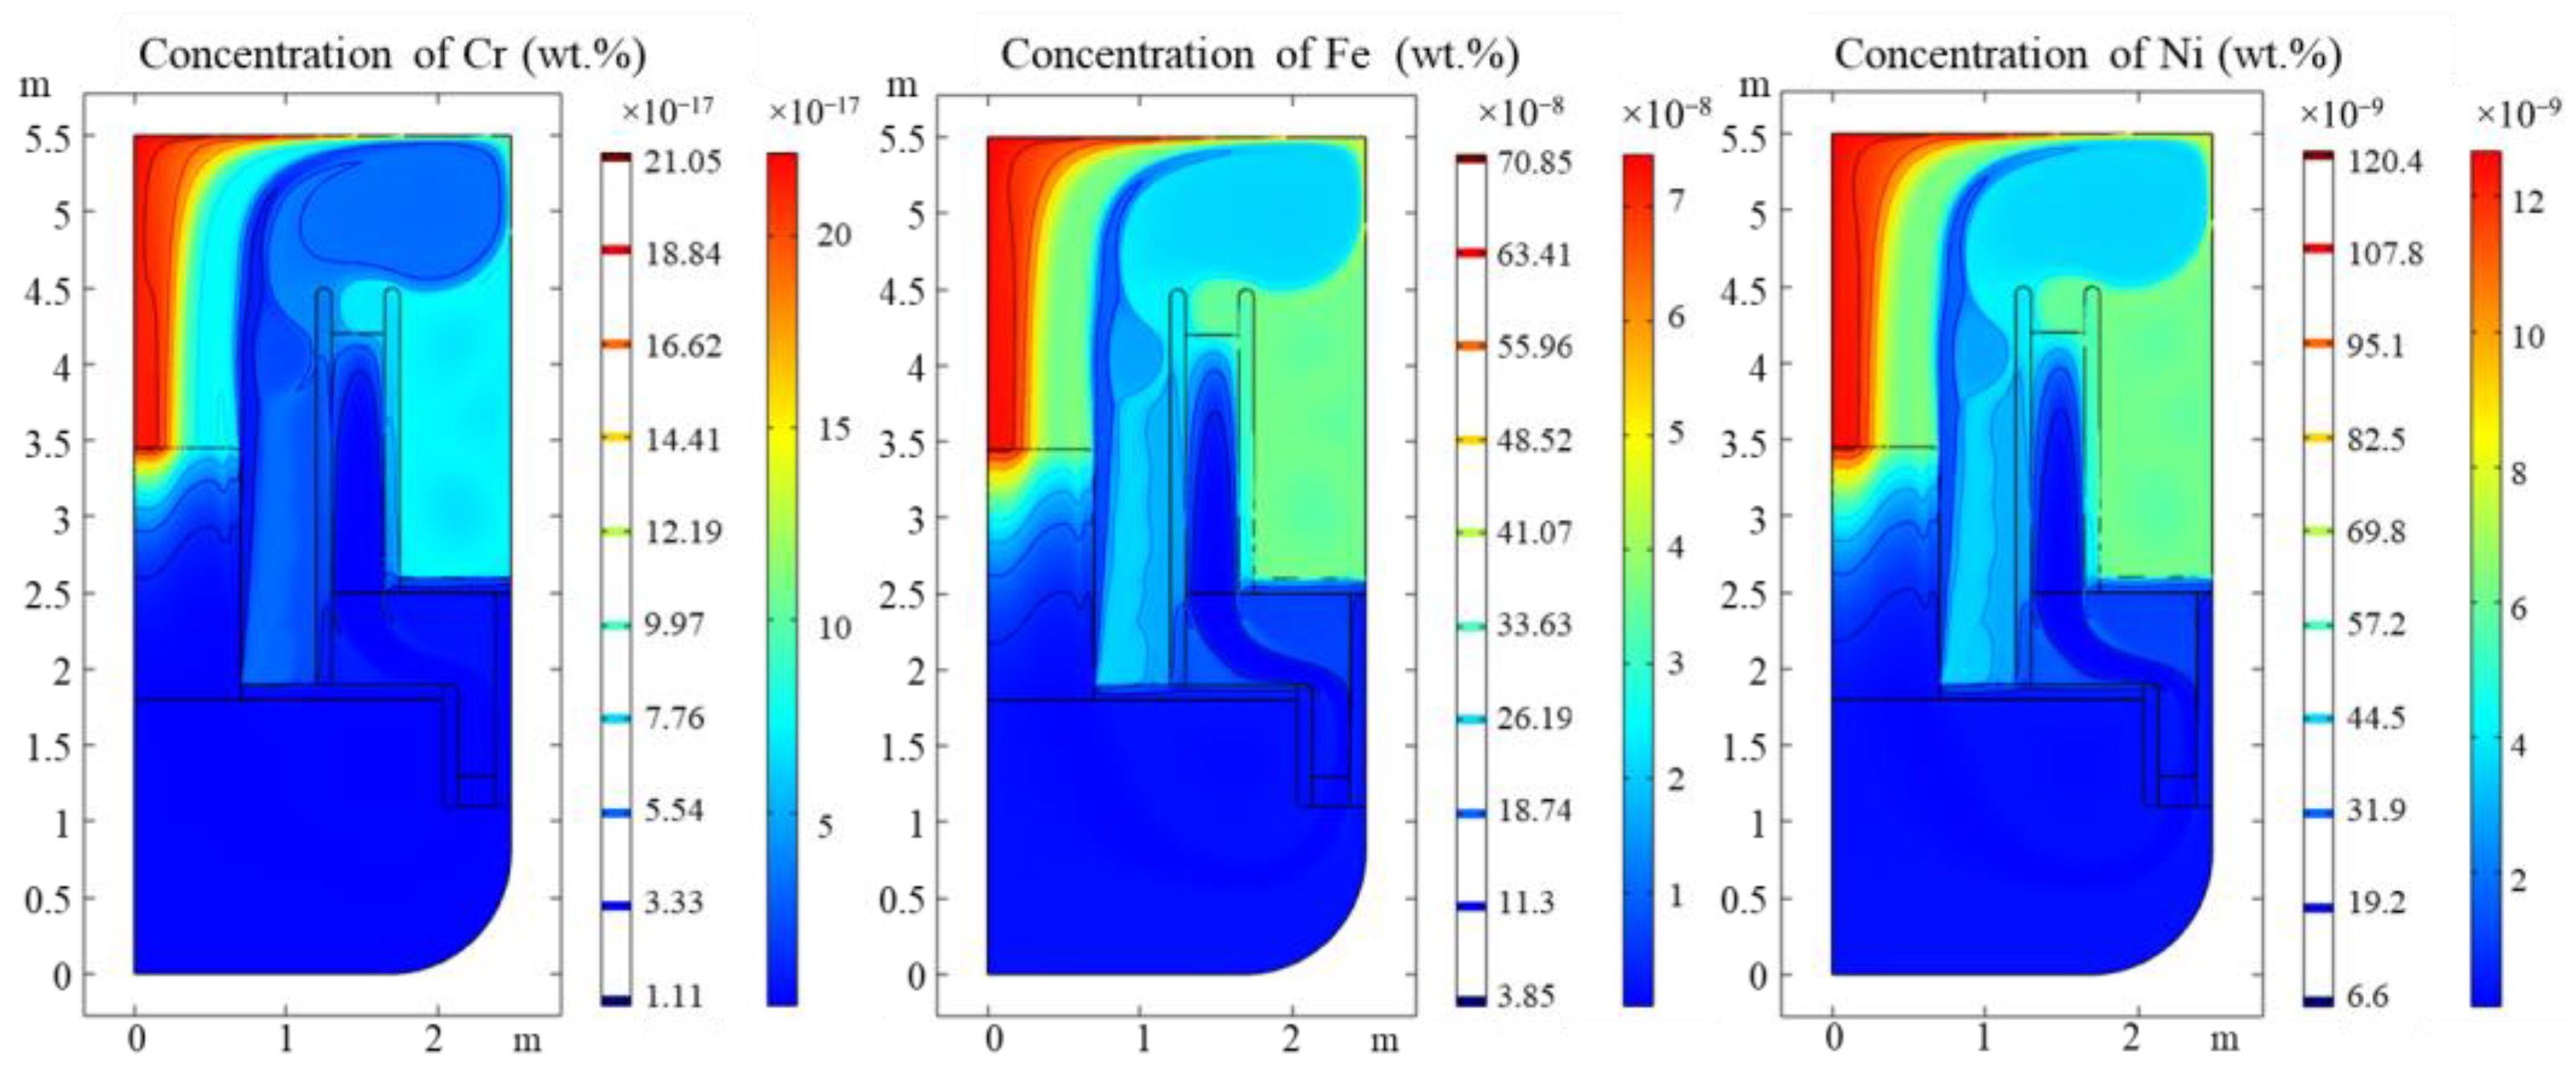
3. Corrosion Products Concentration Distribution

The structural material used in the LBE reactor is typical austenitic steel or martensitic steel [7]. Therefore, the main impurity dissolved into the LBE reactor will be Fe, Cr and Ni. The elements dissolved in the LBE will react with oxygen in the LBE. The reaction equations are shown in Equation (2):
3 F e + 4 O = F e 3 O 4 N i + O = N i O 2 C r + 3 O = C r 2 O 3
In 2016, SCK-CEN investigated the saturation concentration of Fe in LBE of different oxygen concentrations [11] and the relation is given by Equation (3).
log ( c F e ( L B E ) 3 c O ( L B E ) 4 ) = 10.5 42935 / T
However, because of the lack of Cr2O3 and NiO dissolution equilibrium constant, Zhang [1] developed a chemical kinetics model to predict the concentration of Cr, Fe and Ni in different oxygen concentrations. Based on the kinetics equilibrium of different oxides, the equations are shown in Equations (4)–(6):
C F e = C F e , s a p b 4 / 3 ( C O , s C O ) 4 / 3 exp [ 1 3 R T ( Δ F Fe 3 O 4 4 Δ F P b O ) ]
C C r = C C r , s a p b 3 / 2 ( C O , s C O ) 3 / 2 exp [ 1 2 R T ( Δ F Cr 2 O 3 3 Δ F P b 0 ) ]
C N i = C N i , s a P b ( C O , s C O ) exp [ 1 R T ( Δ F N i O Δ F P b O ) ]
where C s is the saturation concentration in the oxygen-free environment, a is the chemical activity in LBE and Δ F is the formation energy, and they can all be found in the Handbook [21].
We checked the Fe concentration calculated by Equations (3) and (4) under the same oxygen concentration and the result at 10−7 wt.% is shown in Figure 4. The kinetics models show good agreement with the experimental data and we can also use them to calculate the saturation concentration of Cr and Ni.
For LBE fast reactor, oxygen control system is a key subsystem to maintain the oxygen concentration within 10−9 to 10−5 wt.% to mitigate the structure corrosion [21]. In the baseline simulation, the oxygen concentration was, hence, set to 10−7 wt.%. Since the oxygen concentration is too low to form NiO, the equilibrium concentration of Ni was assumed to be similar to the oxygen-free condition which is shown in Equation (7).
log ( C N i , s [ wt . % ] ) = 1.53 843 / T
According to Equation (7), the saturation concentration of Ni is much greater than that of Fe. As a result, the dissolution of Ni is limited by the dissolution of Fe and we can assume that the concentration ratio of these two metals in the coolant is almost equal to the ratio of element concentration in the structure material. Typically, the Fe–Ni ratio in the steel is 70:12 [1] and, accordingly, the Fe–Ni concentration ratio in the primary circuit is set to this value.
Coupled with thermal fluid analysis, the surface corrosion flux was established and the dynamic impurities concentration and distribution were calculated and shown in Figure 5.
It was found that the maximum concentration of impurities occurs above the core because of the maximum temperature. The concentration gradient of Fe is also greater compared to other regions of the reactor, i.e., there is a greater possibility of forming solid particle oxides of impurity. It is mentioned in the introduction that the maximum Fe concentration calculated of MYRRHA is 4 × 10⁻⁷ wt.%, which is quite close to our results, which can sustain the validity of our simulation. There are no other experiments which measured the concentration of impurities in that their concentrations are lower than the detection limit available of a mass spectrometer [21].
The saturation of nickel in LBE is almost impossible to reach, unless a large amount of structural material was dissolved, which has never been observed in former experiments. In the corrosion process, a layer of Fe–Cr spinel forms [22], which can restrain the concentration of Ni near the surface of the material, thereby reducing the dissolution of Ni from the structure material [1]. Consequently, in the conceptual design stage of the LBE fast reactor, the content of nickel in the structure material should be restrained to prevent excessive dissolution and corrosion once the oxide film is destroyed.

4. Tracing of CPs

4.1. Numerical Model and Basic Assumptions

According to previous research, in the non-isothermal loop, particles directly formed in the reactor have a diameter from 0.01 to 40 μm and, because of the agglomeration of elementary particles, the upper limit of particle diameter can even reach up to 1 mm [23]. Thus, the particle diameter is set from 0.01 to 1000 μm in the following simulations. The density of the particle is set from 5200 to 9530 kg/m3 because the main compositions of oxide particles in LBE reactor are Fe3O4 and PbO [21].
Under the normal operation conditions, the volume fraction of solid particles in the primary circuit is quite low, which is about 10−6 [7]. The particles in LBE are dilute enough for a one-way coupling approach, i.e., the flow of coolant is not influenced by the movement of particles.
The equation describing the movement of particles is shown in Equation (8).
( m p v ) t = F
where m p is the mass of the particle, v is the velocity of the particle and F is the forces on the particles.
The forces on the particles are buoyancy, drag forces, virtual masses, pressure gradient and Brownian motion force [24]. The particles are assumed to be spherical and the drag force equation is shown in Equation (9):
  F D = 1 τ p m p ( u v ) τ p = ρ p d p 2 18 μ
where τ p is the response time of particles; u is the velocity of fluid; v is the velocity of particle; ρ p is the density of particle; d p is the particle diameter; μ is the viscosity of fluid.
Because the particle size can be as low as 0.01 μm, the influence of the Brownian motion force must be considered and the formula is shown in Equation (10)
F b = ς 12 π k B μ T r p Δ t
where t is time-step that solver takes; k B is Boltzmann constant, 1.380649 ×   10 −23 J/K; T is temperature of coolant; r p is radius of particle; ζ is Gaussian distribution with average 0 and standard deviation.
Particle collisions with walls were approximated as elastic, which means the conservation of tangential momentum after the rebound. All interactions between particles are neglected because of the low concentration of particles. When the particles re-enter the core, they will be stopped by the sticky boundary condition in that the porous medium approximation is not accurate enough to predict the particle behavior in the core.
Due to the existence of turbulence and Brownian motion force, particles move constantly. There is thus no steady state solution for particle tracing. Besides, the particle release number will influence the accuracy of the simulation results. Consequently, simulation time and release number should be determined before investigation of particle behavior in the primary circuit. The simulation is stopped when the system reaches the pseudo-steady state, which means that the particles will vibrate around one place without going too far away, i.e., as the simulation goes on, the particle number in different zones is almost invariant with time.
A few particles are randomly released in the whole primary circuit except the core. The release number should be set large enough to obtain a statistically significant simulation result. The circuit is divided into five zones, core, HX and zone 1 to 3, shown in Figure 6, and we count the particle number at the end time of simulation. When the particle number is greater than 500, the results vary slightly, which means that 500 is large enough to predict the behavior of particles. The reason for not using 1000 is that it would cost a large amount of computing resources.

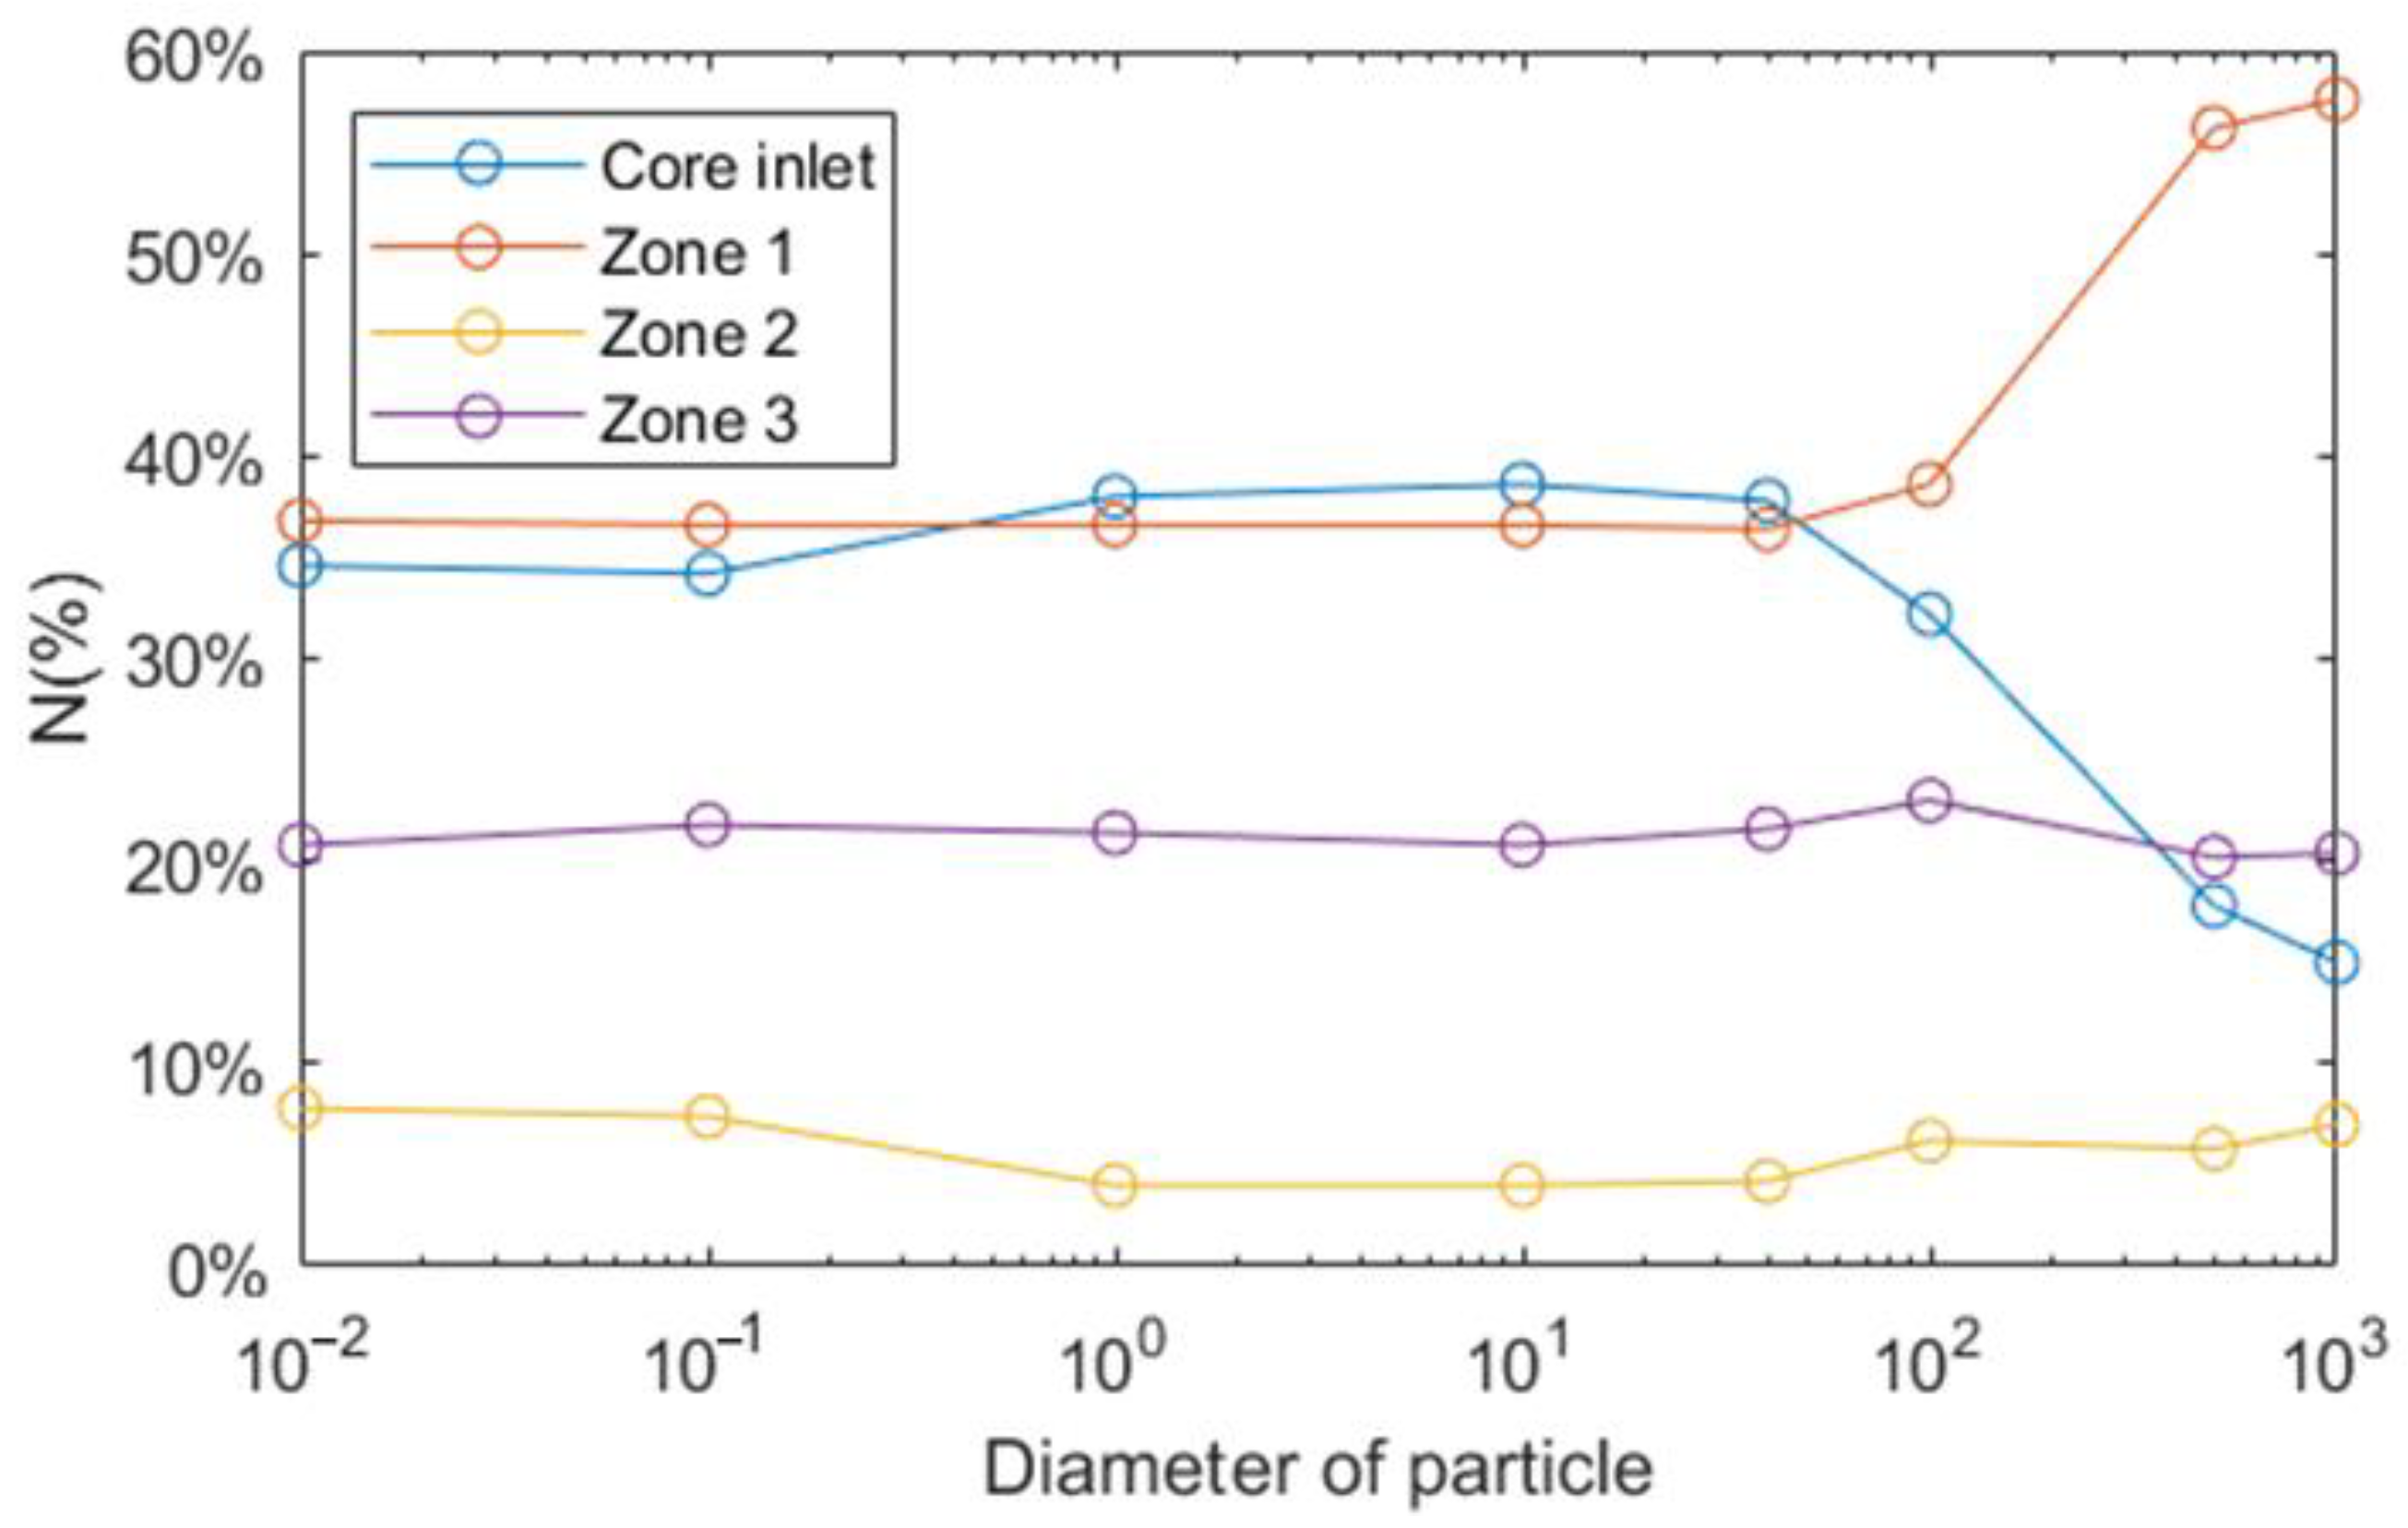
4.2. Particles Behavior in the Primary Circuit

4.2.1. Random Particle Release

For the investigation of particle size influence, the oxide particles are assumed to be spherical and eight diameter points are chosen to investigate, which are 0.01, 0.1, 1, 10, 40, 100, 500 and 1000 μm. The density of the particles is set to 5200 kg/m3. The final distribution of particles of diameter 0.01, 40 and 1000 μm is shown in Figure 7.
It can be seen in Figure 7 that the final distributions with diameters of 0.01 and 40 μm are slightly different, while the particles of 1000 μm tend to float up, due to the influence of buoyancy, and, finally, gather on the free surface or the interfaces between liquid and solid.
The particle distribution of different particle diameters is shown in Figure 8. The results are almost the same for the diameter smaller than 40 μm, which is correspondent to Figure 7. On the contrary, when particle diameter is greater than 100 μm, particles behave totally differently. More specifically, larger particles tend to float on free surface or liquid-solid interfaces because the buoyance becomes the dominating driving force for the particle movement. From Equation (9), it can be found that, while particle diameter increases, drag force decreases and the buoyance become decisive on particles behavior. To be more specific, drag force and buoyance are two principle forces which determine the movement of particles in LBE. Drag force comes from the velocity difference between particles and liquid LBE and it forces particles to move with LBE while buoyance forces particles to float up. With the variation in particle size, the values of these two forces also vary and, for this reason, particles of different sizes move differently. We can also conclude that there is a threshold diameter which is from 40 to 100 μm, below which the movement of particles is driven by drag force and particles tend to move with LBE.
For the investigation of the influence of particle density, three densities were chosen, 5200 kg/m3, 7400 and 9530 kg/m3. The main compositions of oxide particles in LBE reactor are Fe3O4 and PbO and their densities are, respectively, 5200 and 9530 kg/m3. For particles whose diameter is smaller than 1 mm, the content of these two oxides are not the same. As a result, the density of the particle is not a constant and it is between 5200 and 9530 kg/m3. Consequently, three densities were chosen to study the influence of density.
As shown in Figure 9, when the particle diameter is smaller than 100 μm, the ratio of re-entering the core is not significantly related to the particle size. For the particles of diameter greater than 100 μm, the proportion of re-entering decreases significantly with the increase of particle density. As explained in the above section, the dominating driven force for the particle movement is buoyance and smaller density has greater buoyance, leading to more particles floating on the free surface and less particles re-entering the core.

4.2.2. The Influence of Initial Position

In the previous section, the particles released randomly from the core and HX positions in the primary loop, while the formation position of the particle is not random in the LBE reactor. For example, above the core of the LBE reactor, impurity is more likely to be precipitated because of the large concentration difference. In order to explore the distribution of particles formed in different regions, the impact of different initial positions of particles with a diameter of 10 μm on the final result was explored because, when the particle diameter is greater than 100 μm, the buoyancy is greater and, finally, all float on the free surface or the interface between liquid and structure material, which is of little research significance. Consequently, the particle with a particle diameter of 10 μm was selected.
According to the previous section, the influence of density on the particle of a diameter smaller than 100 μm is not great, therefore the particles with a density of 5200 kg/m3 are taken as the research object. The initial position of the particles is divided into the following six regions. The regions are marked with different colors to distinguish them, and the particle distribution of the initial and final time are drawn, as shown in the Figure 10. To make the description easier, the particles released at different regions are numbered from 1 to 6.
Figure 11 shows the proportion of particles re-entering the core in different regions:
As shown in Figure 11, it can be obtained that the orange and green particles have a low probability of re-entering the core, while the particles above the core (yellow) have a higher probability of re-entering the core. We can see in Figure 2 that there are lots of stagnant regions where orange and green particles are formed and, for this reason, the particles are trapped by the eddies and they cannot re-enter the core while, for the particles formed above the core, they flow with the coolant and have greater possibility of re-entering the core. We can also see that the ratio of particles re-entering the core is not negligible, about 40% of particles formed above the core may re-enter the core, which stresses the importance of implementation of a purification system in the LBE reactor.

5. Conclusions

Limited by the low accuracy of concentration measurement of metallic impurities in LBE, no experiments have yet been undertaken to study the concentration of impurities. At the same time, due to the lack of observation methods for small-size particles in LBE, the behavior of solid impurities also lacks experimentation. Meanwhile, the migration behavior of metal impurities is very important in that the aggregation of large-diameter solid particles may cause direct blockage of the circuit, which may lead to severe accidents.
This article proposes preliminary ideas for the investigation of the behavior of impurities in LBE that are temporarily impossible to implement or experiment on, and interesting conclusions are disclosed which are stressed as follows:
Firstly, impurities saturation concentration distribution is investigated in this work. The impurity concentrations of different elements differ a lot, which may help to explain the formation of a Fe–Cr layer on the material surface and the element selective corrosion.
Secondly, the solid particle migration is studied. When the particle diameter is greater than 100 μm, the driving force for the particle movement is buoyancy. The buoyancy will increase compared to other forces as the diameter augments. Consequently, the large particles tend to float on the free liquid surface or the solid-liquid interface.
This simulation provides preliminary information for the concentration of impurity and the movement of solid particles, which can support the design of a filtering system in the reactor.
As an outlook, a developed multi-phase model which combines the nucleation, dissolution and coagulation of solid impurities should be proposed to describe and predict more accurately and subtly the impurity behaviors.

Author Contributions

Conceptualization, M.N.; methodology, J.W.; software, Y.W., J.H.; validation, R.W., X.Z., and C.H.; resources, R.W.; writing—original draft preparation, J.W.; writing—review and editing, M.N. All authors have read and agreed to the published version of the manuscript.

Funding

This research was funded by Science and Technology on Reactor System Design Technology Laboratory, grant No.HT-KFKT-24-2021008 and National Defense Pre-Research Foundation of China, grant No.201-XXXX0404-fzsdx-Tm06.

Institutional Review Board Statement

Not applicable.

Informed Consent Statement

Not applicable.

Data Availability Statement

The data presented in this study are available on request from the corresponding author. The data are not publicly available due to the confidential reactor design parameters.

Conflicts of Interest

The authors declare no conflict of interest.

References

  1. Zhang, J.; Li, N. Review of the studies on fundamental issues in LBE corrosion. J. Nucl. Mater. 2008, 373, 351–377. [Google Scholar] [CrossRef]
  2. Ballinger, R.G.; Lim, J. An overview of corrosion issues for the design and operation of high-temperature lead-and lead-bismuth-cooled reactor systems. Nucl. Technol. 2004, 147, 418–435. [Google Scholar] [CrossRef]
  3. Gromov, B.; Orlov, Y.; Martynov, P.; Gulevsky, V. The problems of technology of the heavy liquid metal coolants. In Proceedings of the Heavy Liquid Metal Coolants in Nuclear Technology Conference, Obninsk, Russia, 5–9 October 1998; pp. 87–100. [Google Scholar]
  4. Schroer, C.; Voß, Z.; Wedemeyer, O.; Novotny, J.; Konys, J. Oxidation of steel T91 in flowing lead–bismuth eutectic (LBE) at 550° C. J. Nucl. Mater. 2006, 356, 189–197. [Google Scholar] [CrossRef]
  5. Zhang, J.; Li, N. Corrosion/precipitation in non-isothermal and multi-modular LBE loop systems. J. Nucl. Mater. 2004, 326, 201–210. [Google Scholar] [CrossRef]
  6. Orlov, Y.I.; Efanov, A.D.; Martynov, P.N.; Gulevsky, V.A.; Papovyants, A.K.; Levchenko, Y.D.; Ulyanov, V.V. Hydrodynamic problems of heavy liquid metal coolants technology in loop-type and mono-block-type reactor installations. Nucl. Eng. Des. 2007, 237, 1829–1837. [Google Scholar] [CrossRef]
  7. Marino, A.; Buckingham, S.; Gladinez, K.; Keijers, S.; Planquart, P.; Van Tichelen, K.; Aerts, A. Numerical modeling of iron-based corrosion product oxides mass transport in the MYRRHA reactor during normal operation. Nucl. Eng. Des. 2018, 338, 199–208. [Google Scholar] [CrossRef]
  8. Schroer, C.; Konys, J.; Furukawa, T.; Aoto, K. Oxidation behaviour of P122 and a 9Cr–2W ODS steel at 550 C in oxygen-containing flowing lead–bismuth eutectic. J. Nucl. Mater. 2010, 398, 109–115. [Google Scholar] [CrossRef]
  9. Müller, G.; Schumacher, G.; Zimmermann, F. Investigation on oxygen controlled liquid lead corrosion of surface treated steels. J. Nucl. Mater. 2000, 278, 85–95. [Google Scholar] [CrossRef]
  10. Li, N. Active control of oxygen in molten lead–bismuth eutectic systems to prevent steel corrosion and coolant contamination. J. Nucl. Mater. 2002, 300, 73–81. [Google Scholar] [CrossRef]
  11. Gorynin, I.; Karzov, G.; Markov, V.; Lavrukhin, V.; Yakovlev, V.Y. Structural materials for power plants with heavy liquid metals as coolants. JOM 1999, 1, 372. [Google Scholar]
  12. Martynov, P.; Askhadullin, R.S.; Simakov, A.; Chaban’, A.Y.; Legkikh, A.Y. Designing mass exchangers for control of oxygen content in Pb-Bi (Pb) coolants in various research facilities. In Proceedings of the International Conference on Nuclear Engineering, Brussels, Belgium, 12–16 July 2009; pp. 555–561. [Google Scholar]
  13. Aerts, A.; Gavrilov, S.; Manfredi, G.; Marino, A.; Rosseel, K.; Lim, J. Oxygen–iron interaction in liquid lead–bismuth eutectic alloy. Phys. Chem. Chem. Phys. 2016, 18, 19526–19530. [Google Scholar] [CrossRef] [PubMed]
  14. Zhang, J.; Hosemann, P.; Maloy, S. Models of liquid metal corrosion. J. Nucl. Mater. 2010, 404, 82–96. [Google Scholar] [CrossRef]
  15. Lyutyi, E. Problems of high-temperature liquid-metal corrosion of refractory metals and alloys. Sov. Mater. Sci. A Transl. Fiz.-Khimicheskaya Mekhanika Mater. Acad. Sci. Ukr. SSR 1989, 24, 441–445. [Google Scholar] [CrossRef]
  16. Zrodnikov, A.; Efanov, A.; Orlov, Y.I.; Martynov, P.; Troyanov, V.; Rusanov, A. Heavy liquid metal coolant–lead–bismuth and lead–technology. At. Energy 2004, 97, 534–537. [Google Scholar] [CrossRef]
  17. Koloszar, L. CFD simulation of the thermohydraulics of the MYRRHA reactor. In Proceedings of the THINS 2014 International Workshop, Modena, Italy, 20–22 January 2014. [Google Scholar]
  18. Saeidi, S. Study of MHD Corrosion and Transport of Corrosion Products of Ferritic/Martensitic Steels in the Flowing PbLi and Its Application to Fusion Blanket; University of California: Los Angeles, CA, USA, 2014. [Google Scholar]
  19. Deng, L.; Wang, Y.; Zhai, Z.; Huang, B.; He, J.; Wu, J.; Ni, M. Multi-physics model development for Polonium transport behavior in Lead-cooled Fast Reactor. Front. Energy Res. 2021, 9, 365. [Google Scholar]
  20. Koloszar, L.; Buckingham, S.; Planquart, P.; Keijers, S. MyrrhaFoam: A CFD model for the study of the thermal hydraulic behavior of MYRRHA. Nucl. Eng. Des. 2017, 312, 256–265. [Google Scholar] [CrossRef]
  21. Fazio, C.; Sobolev, V.; Aerts, A.; Gavrilov, S.; Lambrinou, K.; Schuurmans, P.; Gessi, A.; Agostini, P.; Ciampichetti, A.; Martinelli, L. Handbook on Lead-Bismuth Eutectic Alloy and Lead Properties, Materials Compatibility, Thermal-Hydraulics and Technologies, 2015th ed.; Organisation for Economic Co-Operation and Development: Paris, France, 2015. [Google Scholar]
  22. Crespo, L. Compatibility of structural materials with LBE and Pb: Standardization of data, corrosion mechanism and rate. In Handbook on Lead–Bismuth Eutectic Alloy and Lead Properties, Material Compatibility, Thermal-Hydraulics and Technologies; Nuclear Energy Agency, Nuclear Science Committee: Paris, France, 2007; pp. 231–274. [Google Scholar]
  23. Martynov, P.N.; Askhadullin, R.S. Filtration purification of heavy liquid metal coolants from impurities. Probl. At. Sci. Technol. Ser. Nucl. React. Constants 2015, 1, 129–213. [Google Scholar]
  24. Morsi, S.; Alexander, A. An investigation of particle trajectories in two-phase flow systems. J. Fluid Mech. 1972, 55, 193–208. [Google Scholar] [CrossRef]
Figure 1. The corrosion mechanism diagram at the steel surface (a) and the surface of steel exposed to LBE at 500 °C in the oxygen saturation environment (b,c).
Coatings 11 01263 g001
Figure 2. Flow field and temperature field of a typical LBE reactor section.
Coatings 11 01263 g002
Figure 3. Relative pressure distribution in the LBE reactor and pressure drop on line r = 0.1 m.
Coatings 11 01263 g003
Figure 4. The concentration of Fe calculated by Equation (3) (Experiment temperature is from 673.15 to 773.15 K) [11] and Equation (4) (Used in the work) [1].
Coatings 11 01263 g004
Figure 5. Concentration of Cr, Fe and Ni in LBE primary circuit.
Coatings 11 01263 g005
Figure 6. The relationship between the distribution of particles and the release number at the state of pseudo-equilibrium. N% = Nparticle in each zone/Ntotal particle × 100%.
Coatings 11 01263 g006
Figure 7. Final distribution of particles, dp 0.01 μm (left), dp 40 μm (middle), dp 1000 μm (right).
Coatings 11 01263 g007
Figure 8. Distribution of particles of different diameter (μm).
Coatings 11 01263 g008
Figure 9. The ratio of re-entering the core for particles of different diameter (μm) and density.
Coatings 11 01263 g009
Figure 10. The final distribution of particles from different release positions.
Coatings 11 01263 g010
Figure 11. The ratio of particles re-entering the core in different regions.
Coatings 11 01263 g011
Table 1. Operation parameters of current LBE reactor designs [19].
Design ParametersCLEAR-ISVBR-100MYRRHAThis Case
CountryChinaRussiaBelgium
Thermal capacity (MWth)10280100100
System pressure (MPa)0.056.70.173
inlet/outlet (°C)260/390340/490270/410250/350
Primary circulationNaturalForcedForcedForced
Reactor vessel D/H (m) 4.53/6.928.0/125/7
Flow rate of LBE coolant (kg/s)529.511,7609400529.5
Core: D/H (m) 1.64/0.91.83/1.751.4/1.75
LBE inventory (ton)70018.44500110
Average coolant flow rate (m/s) 0.550.27
The high coolant flow rate (m/s) 2.371.88
Publisher’s Note: MDPI stays neutral with regard to jurisdictional claims in published maps and institutional affiliations.

