1. Introduction
Gypsum is a good material in terms of its thermal–acoustic behavior and fire resistance. Additionally, it was developed in a parallel manner to the work of our engineering department, namely as part of the study of vibration behavior in earthquake-resistant elements or elements resistant to high-intensity fire exposure.
Generally, a reduction of the mixing water in the calcium sulfate results in increased mechanical properties, although this also leads to decreased setting time or handling time.
The setting mechanism has been analyzed for some time [
1,
2,
3,
4], as well as the workability and physical behavior of plaster mortar when it is additive.
Additionally, there have been numerous studies involving additives that improve or modify some of gypsum’s properties; for example, the use of glucose, citric acid, and sodium bicarbonate to delay hydration [
5] or the use of melanin formaldehyde to manufacture plasterboard [
6] in order to meet the minimum resistance requirements demanded by the related standard [
7].
Some of these additives can be used to improve the outdoor durability [
8], such as hydrated lime and very fine aggregates of crusher powder, in order to increase the resistance. Feng-Qing [
9] used granulated blast furnace slag, ash, and cementitious additives to produce water-resistant plasters. Li [
10] used a complex water-repellent gypsum additive designed to change the water resistance based on gypsum’s microstructural properties.
The study by Schneider [
11] on the effects of retarders focused on the configuration process for hemihydrate gypsum, using citric acid and tartaric acid as additives. In this case, mechanical resistance improvements (the object of this work), as compared with other additives, were not reflected in the results.
We found a parallel study to that published by [
12] on the effects of additives on the mechanical properties of gypsum produced from flue gases as compared to natural gypsum. In this case, in addition to the micrographs, only the flexural strength values were analyzed, using sulfuric acid, potassium sulfate, acetic acid, citric acid, and methylcellulose as additives, achieving flexural strengths values of around 6 N/mm
2 with 5–8 min of setting time.
Merino [
13] also studied the effects of the addition of glass fibers to the gypsum matrix using a superplasticizer as the base, indicating that the use of these additives improves and favors the inclusion of other additives by reducing the water in the setting matrix and increasing the setting time.
Lanzón [
14] studied different concentrations of citric acid and evaluate its mechanical behavior, as well as its microstructure and setting time.
Other studies dealing with the effects of the use of additives systematically focused on the setting structure in the formation of crystals, as well as the influence of certain additive bases on the general behavior of the microstructure [
5,
15,
16,
17,
18,
19].
The variations in the hygrothermal behavior of the plaster are due to the porosity caused by the filling of the intercrystalline spaces. If this space is filled by polymer molecules, this causes decreases in both the water absorption capacity in the liquid state and the numbing capacity of the generated structure. If the internal porosity is reduced, increasing the contact surfaces of the crystalline aggregates of the gypsum (e.g., for plasters), this leads to an increase in the mechanical resistance [
20].
Another study [
21] investigated the effects of the addition of a polyacrylic ester emulsion on the mechanical properties of desulfurized gypsum. The results showed that the addition of 1% polyacrylic ester by weight led to a compressive strength of 46.9 MPa in the gypsum.
Another study [
22] investigated self-leveling mortars based on phosphoric gypsum (alpha-hemihydrate gypsum—α-HH), analyzing the effects on the setting time of three retarders, namely protein salt, citric acid, and sodium tripolyphosphate. The flowability was investigated individually using three different types of superplasticizer, namely naphthalene, polycarboxylate, and melamine, achieving 80 min delays and corresponding compressive strengths values of 54.25, 53, and 52.25 MPa.
In [
23], a relationship was developed between the density reduction in clarified plaster and the addition of expanded polystyrene or extruded polystyrene residues from the construction sector, as well as the mechanical behavior of the additive (achieving compressive strength of 5.59 MPa). The purpose of this study was to investigate recycling, in addition to the fact that the production of calcium sulfate uses much less energy than the production of cements (70–90% less).
In this paper, different mortars will be compared with each other at different concentrations by statistically analyzing the following properties, according to UNE EN 13279-2 [
24] and UNE-EN 196-1 [
25]: Shore C hardness, flexural strength, modulus of elasticity, density, compressive strength, and setting time.
As indicated, the objective is to improve the mechanical properties; however, the most important thing will be to reduce the amount of water while maintaining the sufficient workability of the paste.
As a reference, the amount of water required for a hemihydrate to become a dihydrate is 18.6 g of water per 100 g of gypsum [
1]. This is the minimum limit of the water necessary for setting, although kneading water must also be provided.
Although currently there are hemihydrates that can work with minimal amounts of water, in general for specific and small applications, the normal procedure is to use between 60 and 80 g of water per 100 g of hemihydrate. This is a very high hydration range that results in plasters of low mechanical resistance, which is precisely what we want to avoid.
In this sense, it is also possible to increase the water demands by adding flocculating agents such as polyethylene oxide, and thickening chemicals such as cellulose and starches, which can be added to stabilize the water and gypsum paste or to prevent sedimentation; however, these products have very little influence on the mixing water requirements and will not be used in this work.
2. Materials and Methods
2.1. Materials
The materials used to carry out the test, as well as the equipment and instruments used, are listed in this section.
2.1.1. Water
Water is one of the basic components required for the formation of the paste. The water used in our tests was obtained from the supply network, without any special treatment. The temperature at which it is added must be taken into account, since this affects the amount of calcium sulfate that dissolves. The laboratory temperature here was 25 °C.
Table 1 shows the analytical parameters of the water used in the laboratory tests for the different batches.
2.1.2. Plaster
The base material used was calcium sulfate, the nominal characteristics of which were defined according to EN UNE 13279-1 [
7], with type B1 gypsum used for construction as follows: thick gypsum made up of semi-hydrate (SO
4Ca·1/2H
2O) with more than 50% hemihydrate, with the possible incorporation of regulation setting additives, with a minimum mechanical resistance required at flexion of 1 N/mm
2 and 2 N/mm
2 at compression (
Table 2). This type of plaster is used for bonding paste in the construction of partition walls, in interior cladding, as an auxiliary construction binder, and also in prefabricated elements. In
Table 2, the minimum requirements are indicated in terms of the flexural strength, compressive strength, and hardness values that construction plasters must meet according to European regulations.
2.1.3. Additives
Two additives supplied by two reference companies (Basf and Sika) were studied.
Melment was supplied by Basf® (Madrid, Spain). According to this manufacturer, this is a liquid-based synthetic melamine polymerswith a pH of 9.5 ± 1 and density (20 °C) of 1.2 ± 0.03 kg/L. Its setting-retarding function is due to its high molecular weight, which acts as a protective colloid during crystallization. In addition, melanin is a wetting compound for the dihydrate, which makes it more soluble, containing less water. The batches were composed of 9 specimens of identical composition and dimensions, with the lots listed by the following letters: A1 (0.2%), A2 (0.6%), A3 (1.2%) (percentages of additive based on the weight of calcium sulfate).
The second melamine additive was from Sika (SikaMix®) (Zurich, Switzerland). The manufacturer classifies it as a so-called superfluidizer. This additive is used in the manufacture of plasterboard plates, having a pH of 12 and a density (20 °C) of 1.2 kg/L. Here, the lots were denoted by the following letters: C1 (0.2%), C2 (0.6%), C3 (1.2%).
Another of the tested compounds supplied by the Sika company (Sikatard 930) was a polycarbonate salt, which is also used as a setting-retarding element for plasters. This additive tries to control the dissolution of the plaster; in this way, mortar mixtures can be stabilized for a certain period of time without setting. The function of this additive is to prolong the induction period by acting as a “poison” of the crystallization nucleus. The pH of this compound is 3 and the density (20 °C) is 1.12 kg/L. Here, the lots were denoted by the following letters: TAR1 (0.2%), TAR2 (0.6%), TAR3 (1.2%).
Viscocrete G-2 (VP) was also supplied by the Sika company, for which we analyzed polycarboxylates. This compound has the function of being a dispersant for plasters. It is specially formulated to provide maximum water reduction and stabilization properties in the manufacture of gypsum-based products. It is a salt that acts as a retardant, having a pH of 3.5 and a density (20 °C) of 1.05 kg/L. Here, the lots were denoted by the following letters: VS1 (0.2%), VS2 (0.6%), VS3 (1.2%).
Finally, we compared the above compounds with an organic acid (citric acid), which can be used in a liquid phase in 25% solution or directly as a ground solid. This base has a retarding effect on the setting process. It can also be mixed with other organic acids such as acetic or tartaric acid. This base has a pH of 3 and a density (20 °C) of 1.02 kg/L. Here, the lots were denoted by the following letters: I1, I2, I3.
Table 3 shows the names of the additives tested together with the percentages used to obtain the different batches, which were tested to assess their mechanical properties.
2.2. Methods
For the preparation of test specimens and test protocols, the UNE EN 13279-2 [
24] standard was followed, which establishes a minimum of three values per test. Three batches were made for each compound, with a total of twelve test tubes per batch. The dimensions were 40 × 40 × 160 mm.
In
Figure 1, sample specimens can be seen, which were tested in order to assess their parameters. In
Figure 1a, the untested and referenced specimen can be observed, while
Figure 1b shows one of the specimens after the bending test to which they were subjected.
The gypsum water ratio (W/P) in reference to the weight was set at 0.5 or 50/100 (50 g of water per 100 g of calcium sulfate) for all tests using additives; in this way, the results could be compared, since water has a marked effect on the result. The reference test (involving only calcium sulfate and water) was designated Y1.
Following the recommendations of the manufacturers (additive suppliers), differences in dosages were observed; however, the percentages were unified for comparison at 0.2%, 0.6%, and 1.2% of the weight of gypsum, except for citric acid bases, whose percentages were notably reduced to 0.02%, 0.06%, and 0.12%. This decision was made based on our experience to achieve adequate working times, as greater additive quantities result in unmanageable times.
All of the manufactured specimens were subjected to the below tests.
Shore C hardness test: This test was carried out in accordance with the procedure stipulated under by UNE-EN196-1: 2005 [
25] and UNE-EN 13279-2 [
24] using a Baxlo Shore C Durometer.
Flexion and modulus of elasticity test: This test was carried out in accordance with the procedure indicated by UNE EN 196-1: 2005 using a IMAL Universal Testing Machine.
Compression test: The test pieces were tested according to the UNE -EN 13279-2 [
24] standard. A universal compression testing machine was used with a load speed ≥ 1 N/mm
2/s.
Setting time test: The standardized knife method was used as stated in UNE-EN 13279-2 standard [
24]. This was carried out in parallel at the same time as the formation of the specimens.
Micrograph test: Schottky hot cathode field emissions were obtained using a Zeiss Sigma 300 VP scanning electron micrograph (ZEISS, Oberkochen, Germany).
The tested specimens all measured 40 × 40 × 160 mm. For each dosage, 12 specimens were made in three test batches, providing 36 units in total for the flexural strength, direct modulus of elasticity, compression, and Shore hardness, tests.
For the statistical study, SPSS was used, allowing comparison of the means using ANOVA with Duncan’s test for a confidence interval of 95%, as well as Tukey’s test for multiple comparisons of the t levels of each factor. In addition, the independent cases were obtained to allow a summary of the means and standard deviation.
4. Discussion
By analyzing
Table 4 in relation to the reference (SUL) Y1, using the same percentage of mixing water, we can observe that the calcium sulfate already has good mechanical properties, for example compression resistance of 10.07 N/mm
2 and flexure resistance of 5.12 N/mm
2; however, the workability time of this reference of only 1.35 min makes it impractical.
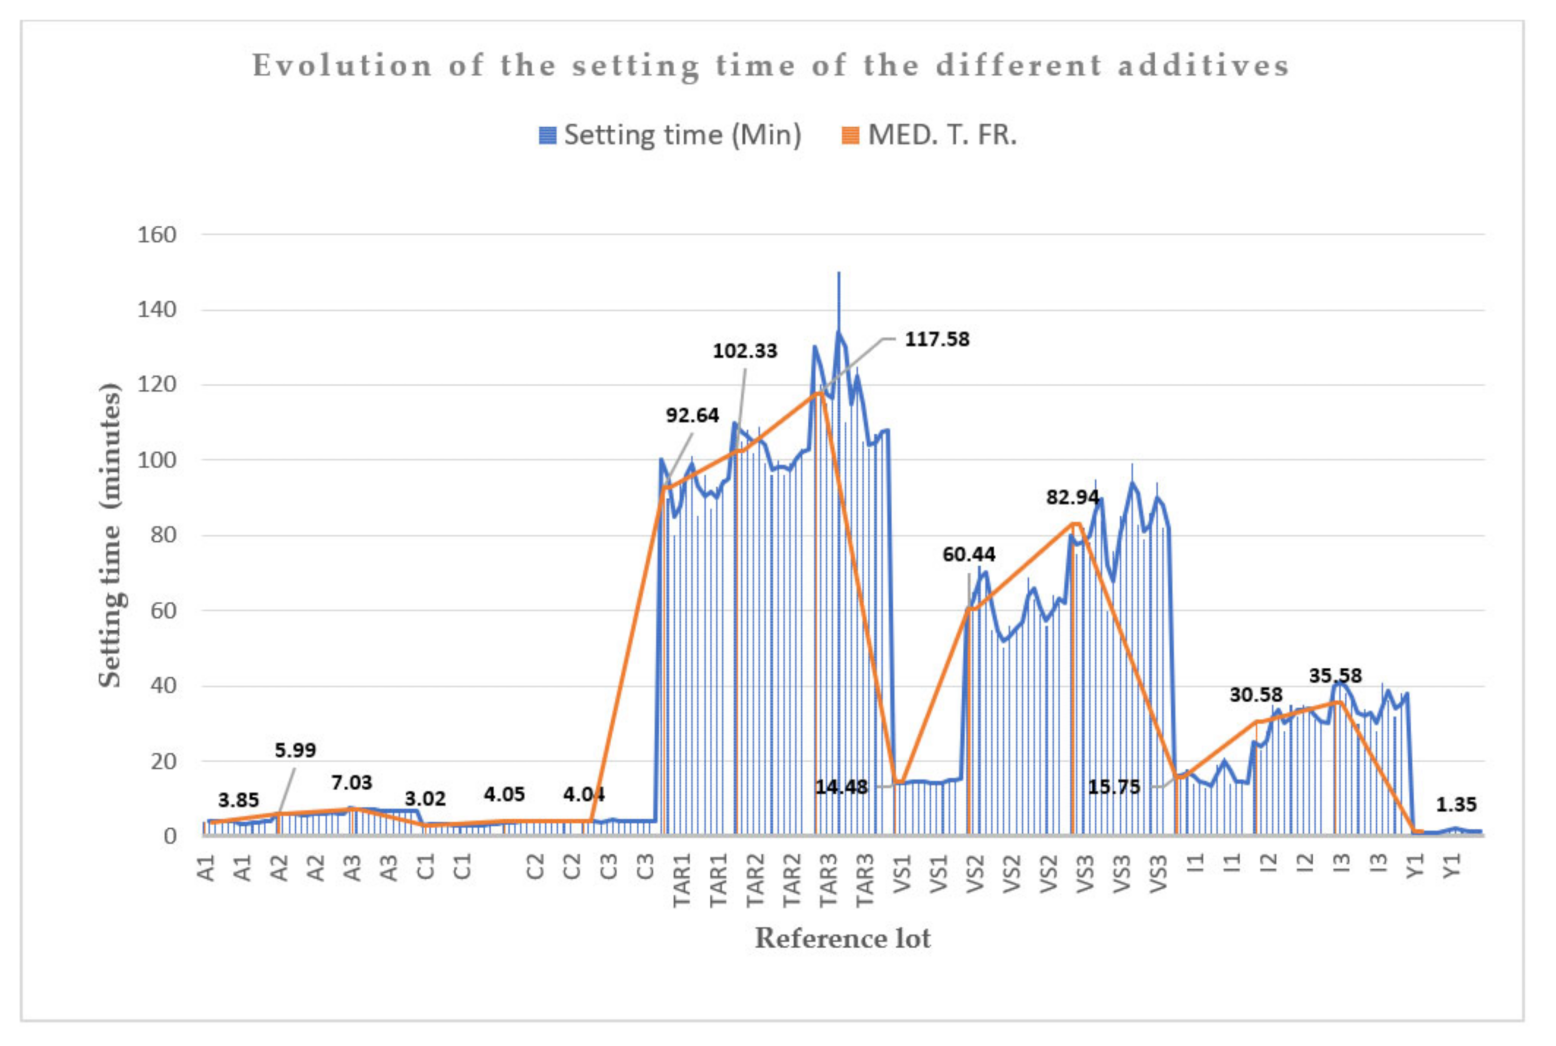
Regarding the setting times, the orange line shown in
Scheme 1 represents the average values of the different batches containing different additives, while the blue bars indicate their individual setting times.
As already indicated and as can be seen in
Scheme 1, for the reference test involving only gypsum without additives at a W/P ratio of 50%, the workability times for reference Y1 were between 1 and 2 min (indicating that it is not workable; therefore, the mechanical results obtained were a mere reference, since they could not be used in practice).
For polycarbonate salts, the workability times increased considerably with respect to the rest of the bases. The reference that offered the best workability was TAR3 (1.2%), with a mean time of 117.58 min (
Table 4). The polycarboxylates followed, with times ranging up to 92.94 min. Regarding citric acid, which only reached a maximum of 35.58 min, we observed that the maximum percentage used in the compound was 0.12%. If this percentage were to be increased, the time would be considerably higher; therefore, this reference was biased (
Table 4).
Melamines, on the other hand, did not present significant handling times, with the maximum obtained being 7.03 min for sample A3.
Next, we analyzed the flexural strength results (
Scheme 2). There was a certain coherence between all of values. The lowest results were obtained with polycarbonate salts. Citric acid at a low percentage (I1, 0.02%) gave a value of 5.83 N/mm
2, which was not very far from melamine at 6.88 N/mm
2 (C1), also with a low percentage of additive (0.2%). The VS1 polycarboxylates presented a similar resistance value of 5.79 N/mm
2, coinciding with the 0.2% dosage (values shown in
Table 4). The maximum strengths corresponded to the decreases in setting times and the low additive percentages.
In
Scheme 2, the average values obtained in the flexural strength tests are indicated by the orange line for the different batches containing different additives, while the blue bars indicate the individual values.
Regarding the Shore C hardness values (
Scheme 3), the results were related to the percentages of additive used, decreasing slightly as additive % increased, with the highest Shore C hardness index value being achieved with C1 melamines, with a value of 93.19.
Scheme 3 shows the average values obtained in the hardness tests (orange line) for the different batches containing different additives, while the blue bar indicates the individual values.
Scheme 4 shows interesting values for the compression failure tests due to the high results obtained, as we were able to refer to the concrete itself. Regarding the synthetic polymers of melanin, sample A1 at 0.2% by weight gave a value of 18.38 N/mm
2, while for pure melamines, sample C1, also at 0.2% by weight, gave a value of 19.32 N/mm
2.
The rest of the trial results were far from these significantly high values; the resistance values for polycarboxylates and citric acid were 13.27 N/mm
2 and 13.72 N/mm
2, respectively. We also observed that when increasing the dosage of the synthetic melamine polymer (1.2%), the resistance dropped sharply by 9.07 N/mm
2 (A3). In
Scheme 4, the average values obtained in the compressive strength tests (orange line) for the different batches containing different additives are shown, whereby the blue bars indicate the individual compressive strength values for each batch.
In terms of the objective that was indicated at the beginning of the document, it is important to achieve a high level of mechanical resistance to be able to include calcium sulfate at higher use stages. The other factor to take into account is the modulus of elasticity.
In
Scheme 5, the values for the modulus of elasticity are shown. Again, the melamines provide higher deformation moduli, with values in the range of 707–796 N/mm
2, although as the additive doses increased, the mechanical properties decreased. For the melamines from tests C1, C2, and C3, the behavior was opposite, since the deformation increased as the percentage of additive increased. This was not the case for the rest of the compounds.
Scheme 5 shows the average values obtained in the modulus of elasticity tests (orange line) for the different batches containing different additives, whereby the blue bars indicate the individual modulus of elasticity values for each batch.
Making a comparison between the test groups, in
Scheme 6 one can observe the mean mechanical resistance values (flexion and compression, N/mm
2) shown for the different compounds and the proportionality between both. Also in
Scheme 6, an overlay of Schemes can be seen that shows the average values obtained in the compressive strength tests (orange line) for the different batches containing different additives, along with the flexural strength values (blue line). As can be seen, the flexural strength are lower than the compressive strength values for all batches analyzed in the tests, although they are always greater than the minimum value established by the regulations.
The coherence between the behavior and distribution of values is shown in
Scheme 6, with the maximum compression values coinciding with the maximum bending values (at smaller additive percentages).
In general, different flexural strength ranges are achieved in the tests compared to the results obtained by Prakaypun and Jinawath [
9], with our results being below 6 N/mm
2.
The study carried out by Lanzón [
11] was comparable, whereby different proportions of citric acid were studied in mechanical tests, obtaining a maximum bending strength value of 3.98 N/mm
2 with 125 ppm of citric acid, with the values decreasing as the acid concentration increased, finally reaching a Shore hardness of 58.4, compressive strength of 10.08 N/mm
2, and workability time of 50 min.
In
Scheme 7, one can observe the relationship between the setting time and the influence on the mechanical resistance. As can be seen, the green line indicates the setting times in min for the different batches of plaster containing different additives, which are contrasted with the reference plaster without additives. These results are discussed in the following paragraph.
In relation to the mechanical resistance (
Scheme 7), one can see a degree of absolute independence, with an inversely proportional response with respect to the setting time; as the time increases, the resistance decreases. As indicated, good results were obtained for the TAR polycarbonate salt plasticizers in relation to the setting time. In this sense, interesting data were also obtained for the polycarboxylates, finally reaching the same level as citric acid; however, in terms of the mechanical resistance, the opposite was true, whereby melamines offered greater mechanical capacity.
4.1. Micrograph Analysis
We started with the test reference sample Y1, containing calcium sulfate without additive, with a W/P ratio of 0.5, i.e., 50% water.
Figure 2 shows the micrographs of the plaster specimen without additives; that is, the plaster specimen that served as the reference for comparison with the results for the different batches of plaster containing additives.
The setting speed of 1.35 min implied a matrix of small and compact crystals.
Figure 3,
Figure 4 and
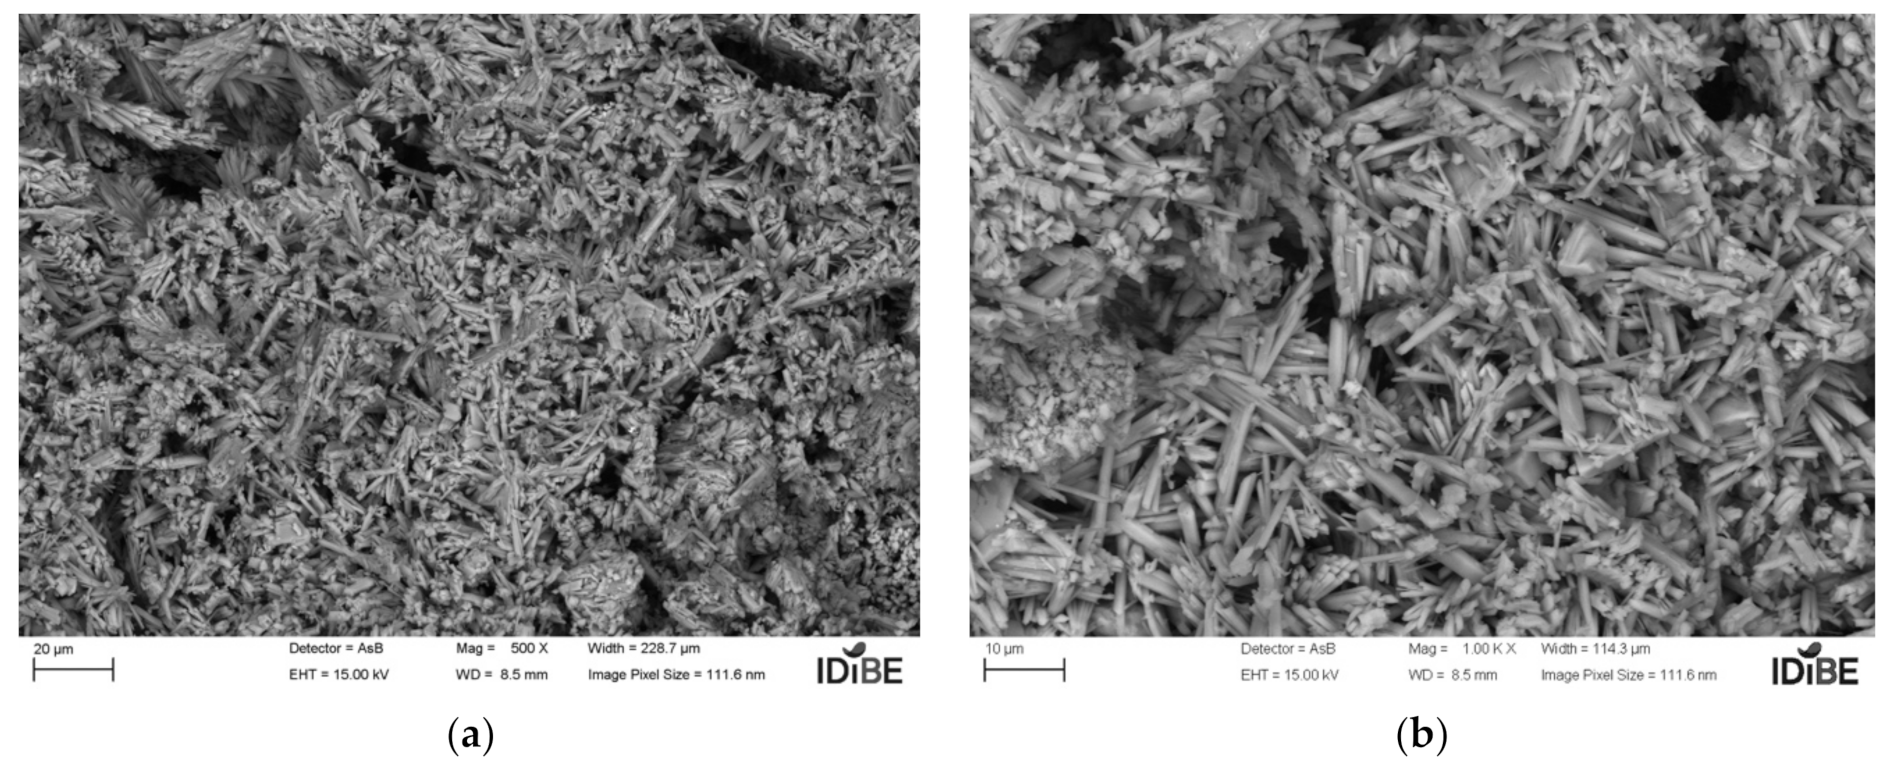
Figure 5 show the micrographs of the melamines modified with 0.2%, 0.6%, and 1.2% additive, respectively, which gave slightly longer times than for the reference Y1, ranging from 3.85 min to 7.03 min, providing a different micrograph network. The crystals were larger and longer than in the reference. As the dose increased, the structure appeared to be less compact and with slightly larger crystals.
As can be seen in
Figure 6,
Figure 7 and
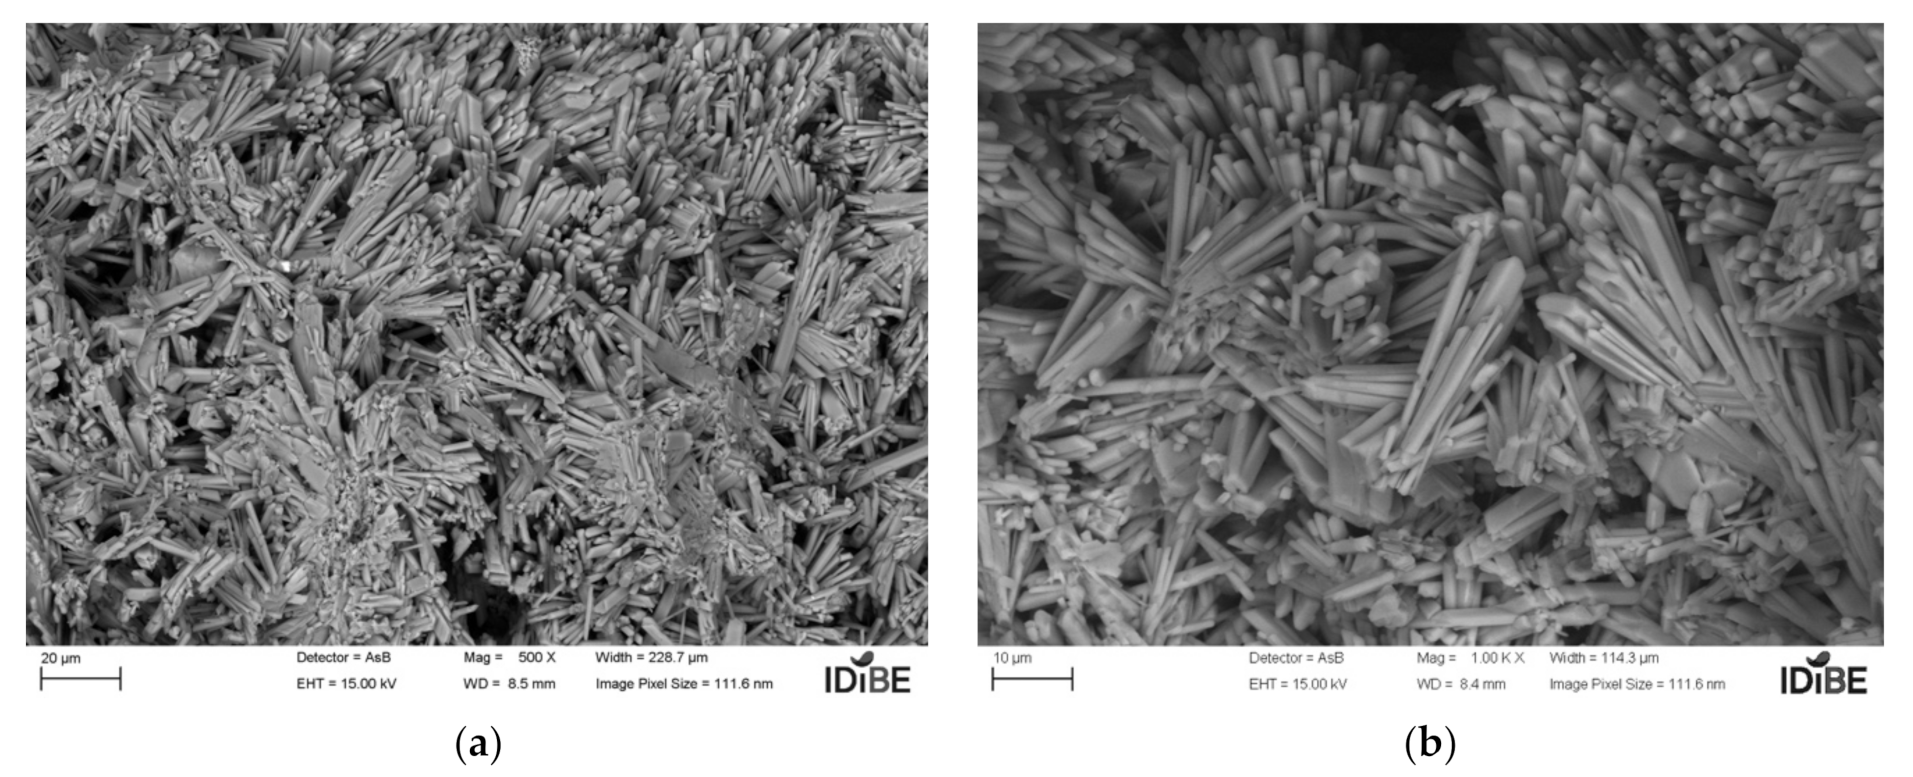
Figure 8, which showed the micrographs of the mixtures of plaster with melamine at dosages of 0.2%, 0.6%, and 1.2%, respectively, the same pattern is repeated as for crystal growth. As the setting time increased, these values also increased (compared to the reference). By increasing the percentage of additive, this resulted in larger crystals.
Figure 9,
Figure 10 and
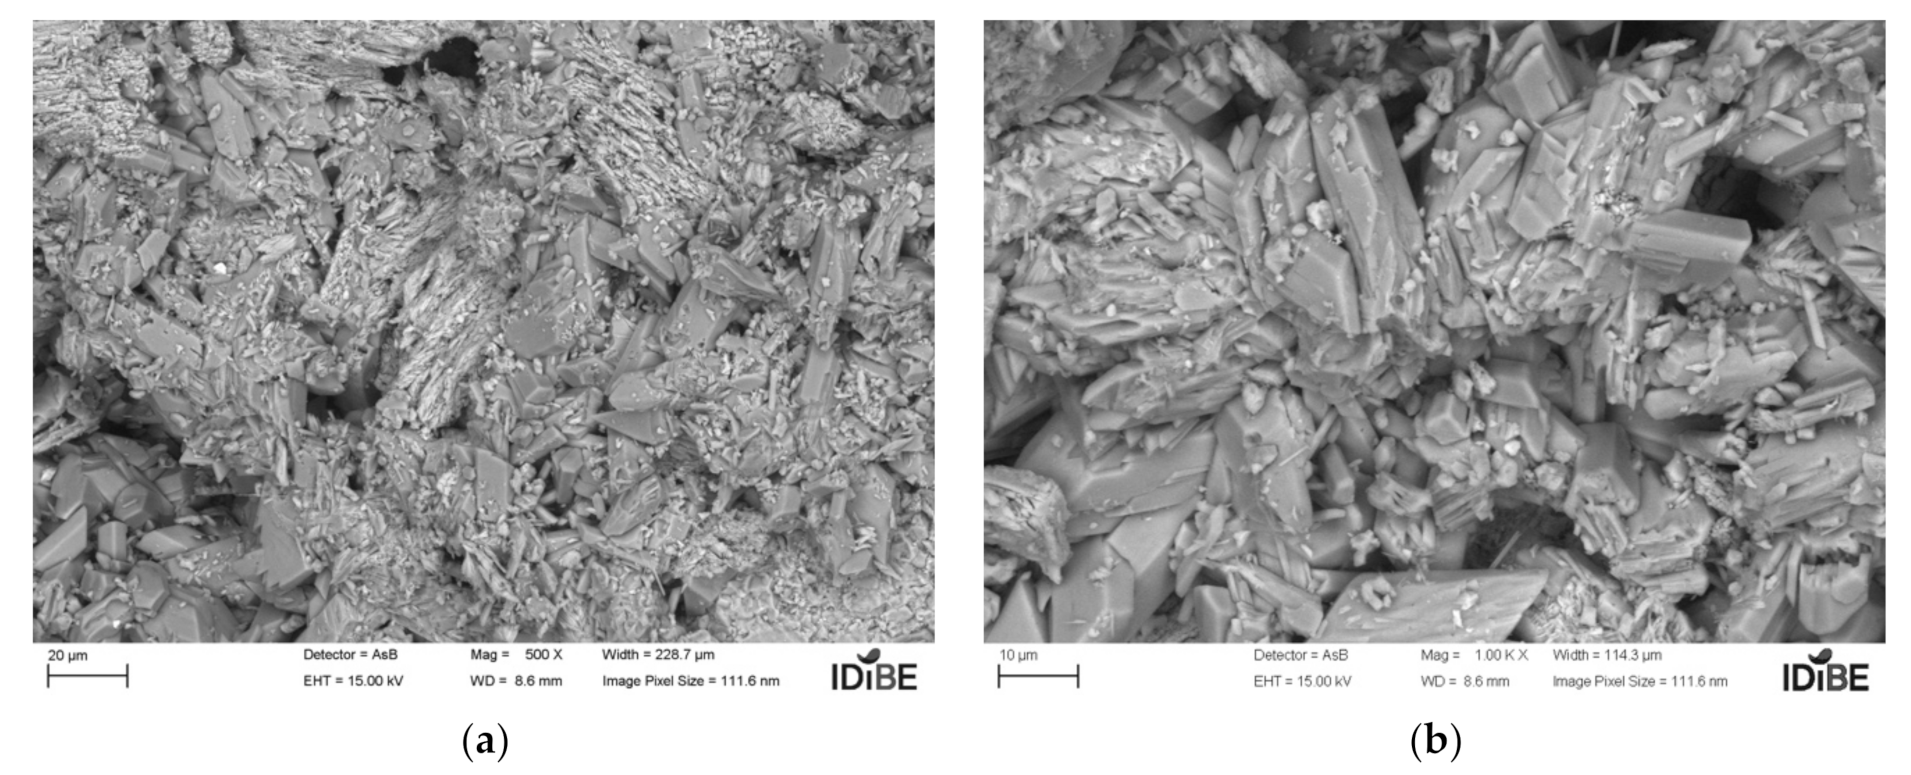
Figure 11 show the micrographs of the mixtures of gypsum with polycarbonate salts at dosages of 0.2%, 0.6%, and 1.2% of additive, respectively. By significantly increasing the setting times (92.64–117.58 min), in relation to the tests shown, the structures are very different, with huge crystals that partially reduce the resistance values, as already seen above.
Figure 12,
Figure 13 and
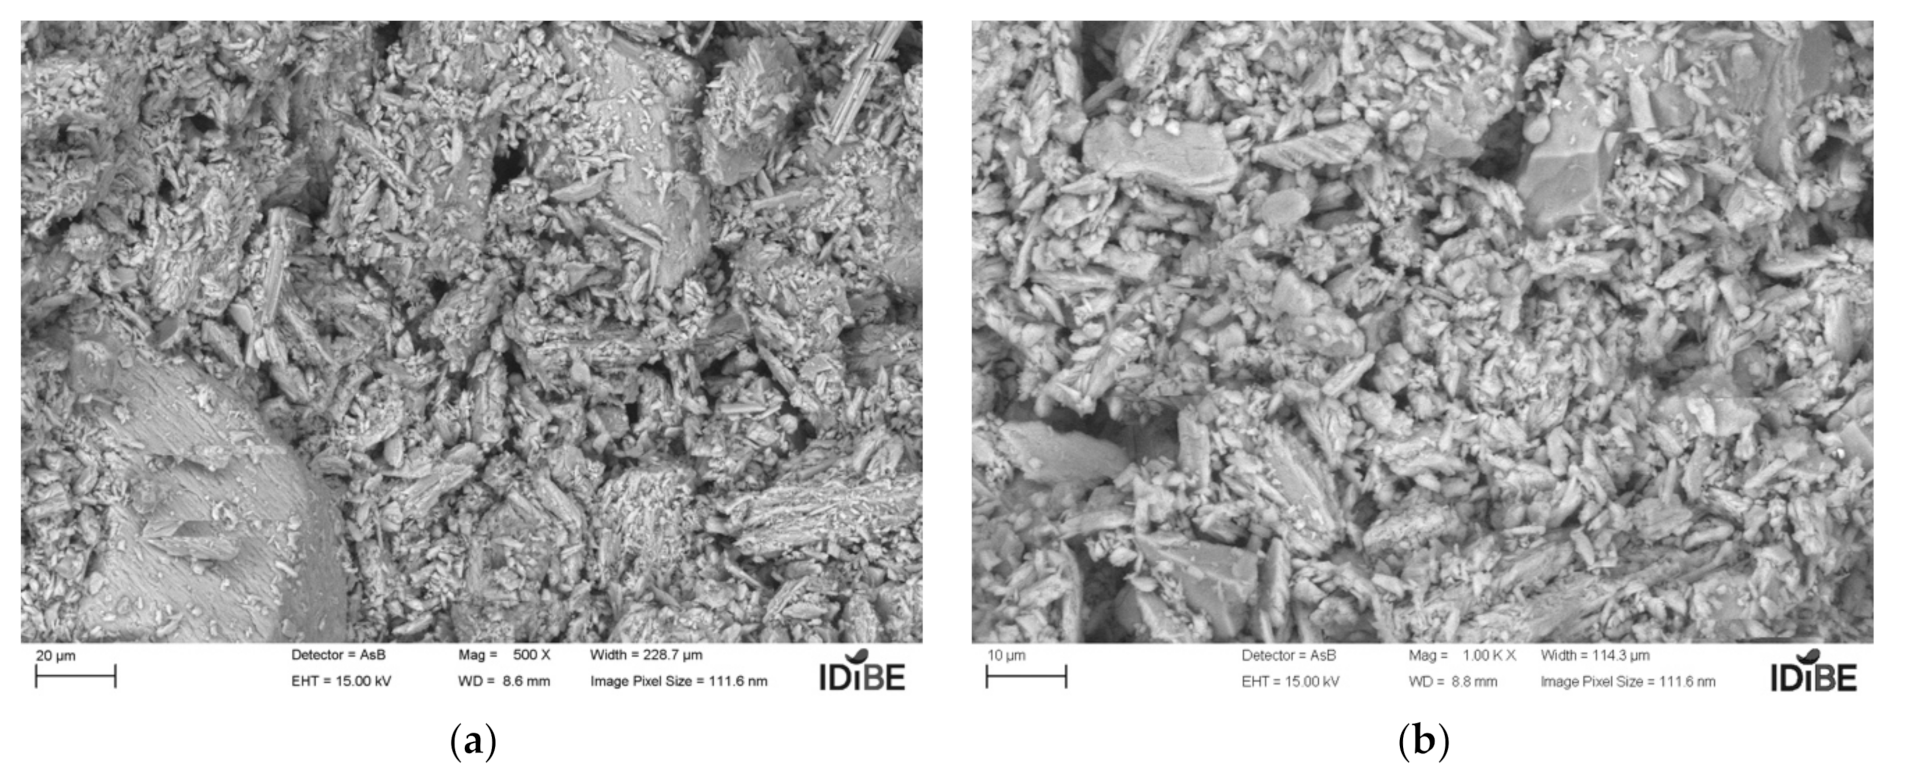
Figure 14 show the micrographs of the mixtures of gypsum with polycarboxylates at dosages of 0.2%, 0.6%, and 1.2% of additive, respectively. The polycarboxylate changes its structure again via the formation of perfectly defined compact blocks.
Figure 15,
Figure 16 and
Figure 17 show the micrographs of the mixtures of gypsum with citric acid at dosages of 0.02%, 0.06%, and 0.12% of additive, respectively. For citric acid, we can see a structure full of internal voids, which explains the lower mechanical resistance. The size of the crystals increases with the setting time, as can be observed in the micrographs.
It has been established that the additives including Melamine compound. Polycarboxylate compound and citric acid significantly affect the dispersion of microstructure elements and porosity, which can radically change mechanical properties and hygrothermal behavior.
4.2. X-ray Chemical Analysis
A general analysis with a Sigma 300 VP scanning micrograph and a vacuum using the energy-dispersive X-ray technique indicated the following chemical compositions, as reflected in the attached figures. For analysis, the samples were chromium-coated.
We started with the test reference Y1, namely calcium sulfate sample without additive, with an A/Y ratio of 0.5, i.e., 50% water.
Figure 18a shows a micrograph of calcium sulfate without additive, while
Figure 18b shows the chemical composition of the reference gypsum.
In
Figure 19, the X-ray spectrum shows the transition of the electrons, with K being the type of transition from the highest to the innermost layer. Chromium, as already stated, is part of the coating material of the sample and is not part of the composition.
In
Figure 20a–c, a micrograph of the mixture of gypsum with modified melamine and the percentages of the chemical elements as assessed using X-ray spectrography are shown.
In
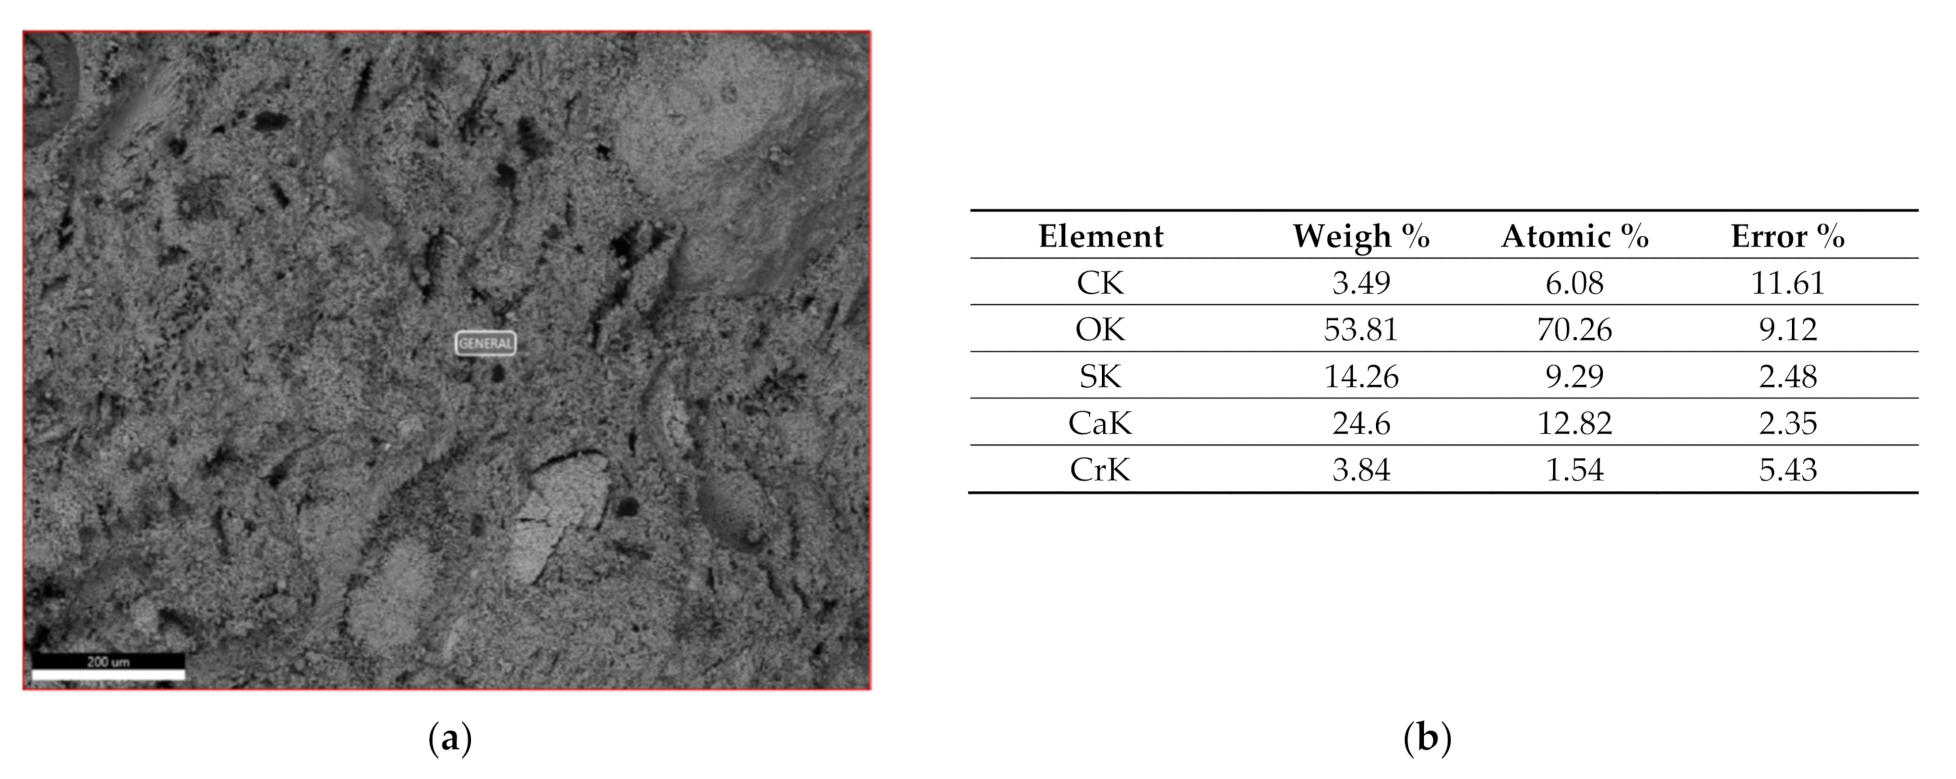
Figure 21a–c, the micrograph of the mixture of gypsum with polycarbonate salts and the percentages of the chemical elements as assessed by X-ray spectrography are shown.
In
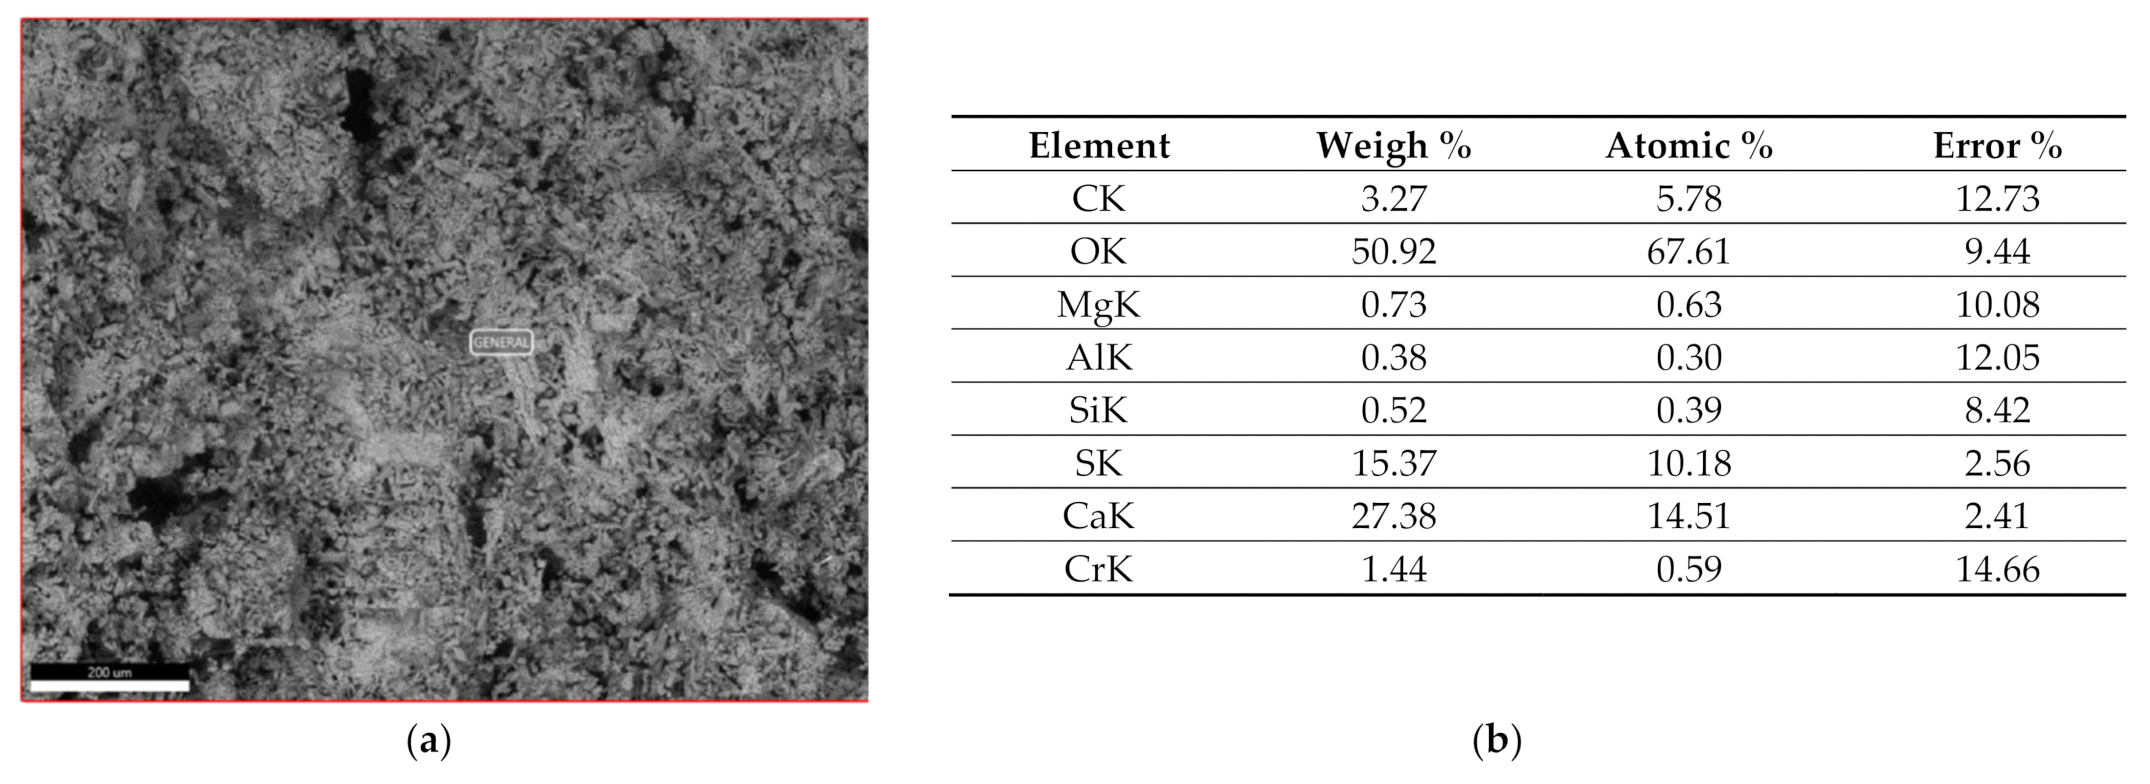
Figure 22a–c, the micrograph of the mixture of gypsum with polycarboxylate and the percentages of the chemical elements as assessed using X-ray spectrography are shown.
In
Figure 23a–c, the micrograph of the mixture of gypsum with citric acid and the percentages of the chemical elements as assessed using X-ray spectrography are shown.
5. Conclusions
All the bases tested improved and modified the mechanical properties (bending strength, compressive strength, and Shore C hardness) of the mortar (plaster) as compared to the reference without additives at the same water/plaster (W/P) ratio, providing better workability (greater fluidity and longer setting time).
The Shore C hardness values in all tests exceeded 80 units. The Shore C hardness index values decreased significantly as we increased the proportions of additives in the mortars.
The best mechanical resistance results in terms of flexural strength and compressive strength were obtained with melamine compounds, whose values were well above the minimum values required by the regulations, although the most negative aspect was the setting times, which varied from 3 to 7 min, depending on the percentage of additive used; on the contrary, the setting times for the polycarboxylates, citric acid, and polycarbonate salts increased considerably, depending on the proportion of the mixture, reaching values of up to 117.58 min.
Both melamines and synthetic melamine polymers provided good results in terms of compressive strength (9–19 N/mm2) and flexural strength (3.55–6.88 N/mm2), as did naphthalenes in terms of compressive strength (13.88–14.39 N/mm2) and bending (3.83–5.61 N/mm2). These results were much higher than the rest of the test compounds. Citric acid showed stable behaviour and was close to naphthalene in terms of its compressive strength (7.9–13.77 N/mm2) and bending (3.15–5.83 N/mm2) values.
Comparing the results of the different additives used in these tests with other innovative additives that can be found today on the market, such as graphene powder, which can be used as an additive in gypsum [
26], it can be seen that the bending resistance values for the additives tested were in line with the flexural resistance values, with these values being higher than those required by the regulations.
The setting time was inversely proportional to the mechanical resistance of the calcium sulfate additive, so by increasing the setting time the mechanical resistance of the plaster was decreased, although its values were always above the minimum required by the current regulations.


 ,
, 


