1. Introduction
Ni-based alloys have attracted increasing attention as new candidates for high-temperature materials due to their high hardness, low density, good corrosion resistance and good dimensional stability [
1]. The addition of molybdenum (Mo) to Ni-based alloys is of great importance due to its wide range of applications, especially under long-term high-temperature heat treatment [
2]. Among the different alloys containing molybdenum, Ni-Mo alloys are of great interest due to their high corrosion resistance and low overpotential for hydrogen evolution reaction [
3]. The content of Mo in Ni-based alloys is closely related to the grain size, lattice defect structure and hardness [
4]. Moreover, the effects of the addition of niobium (Nb) on the microstructures of Ni–based alloys were systematically investigated by Wei et al. [
5]. In an Ni–based alloy with the addition of Nb, needle-like Mo-rich MC carbides and granular Nb-containing M2C carbides were found to form in the matrix and at the grain boundaries, respectively. Based on the interface energy analyses, the morphological differences between the MC and NbC carbides were found to result from their different orientation relationships and interface structures.
The present work was to investigate the effects of two kinds of Ni-based alloys. First one with the addition of ~8 wt.% Mo, and ~4 wt.% Nb. The second specimen was ~16 wt.% Mo without Nb contained. They are tested under long-term heat treatment in the field of medical thermal packaging.
2. Materials and Methods
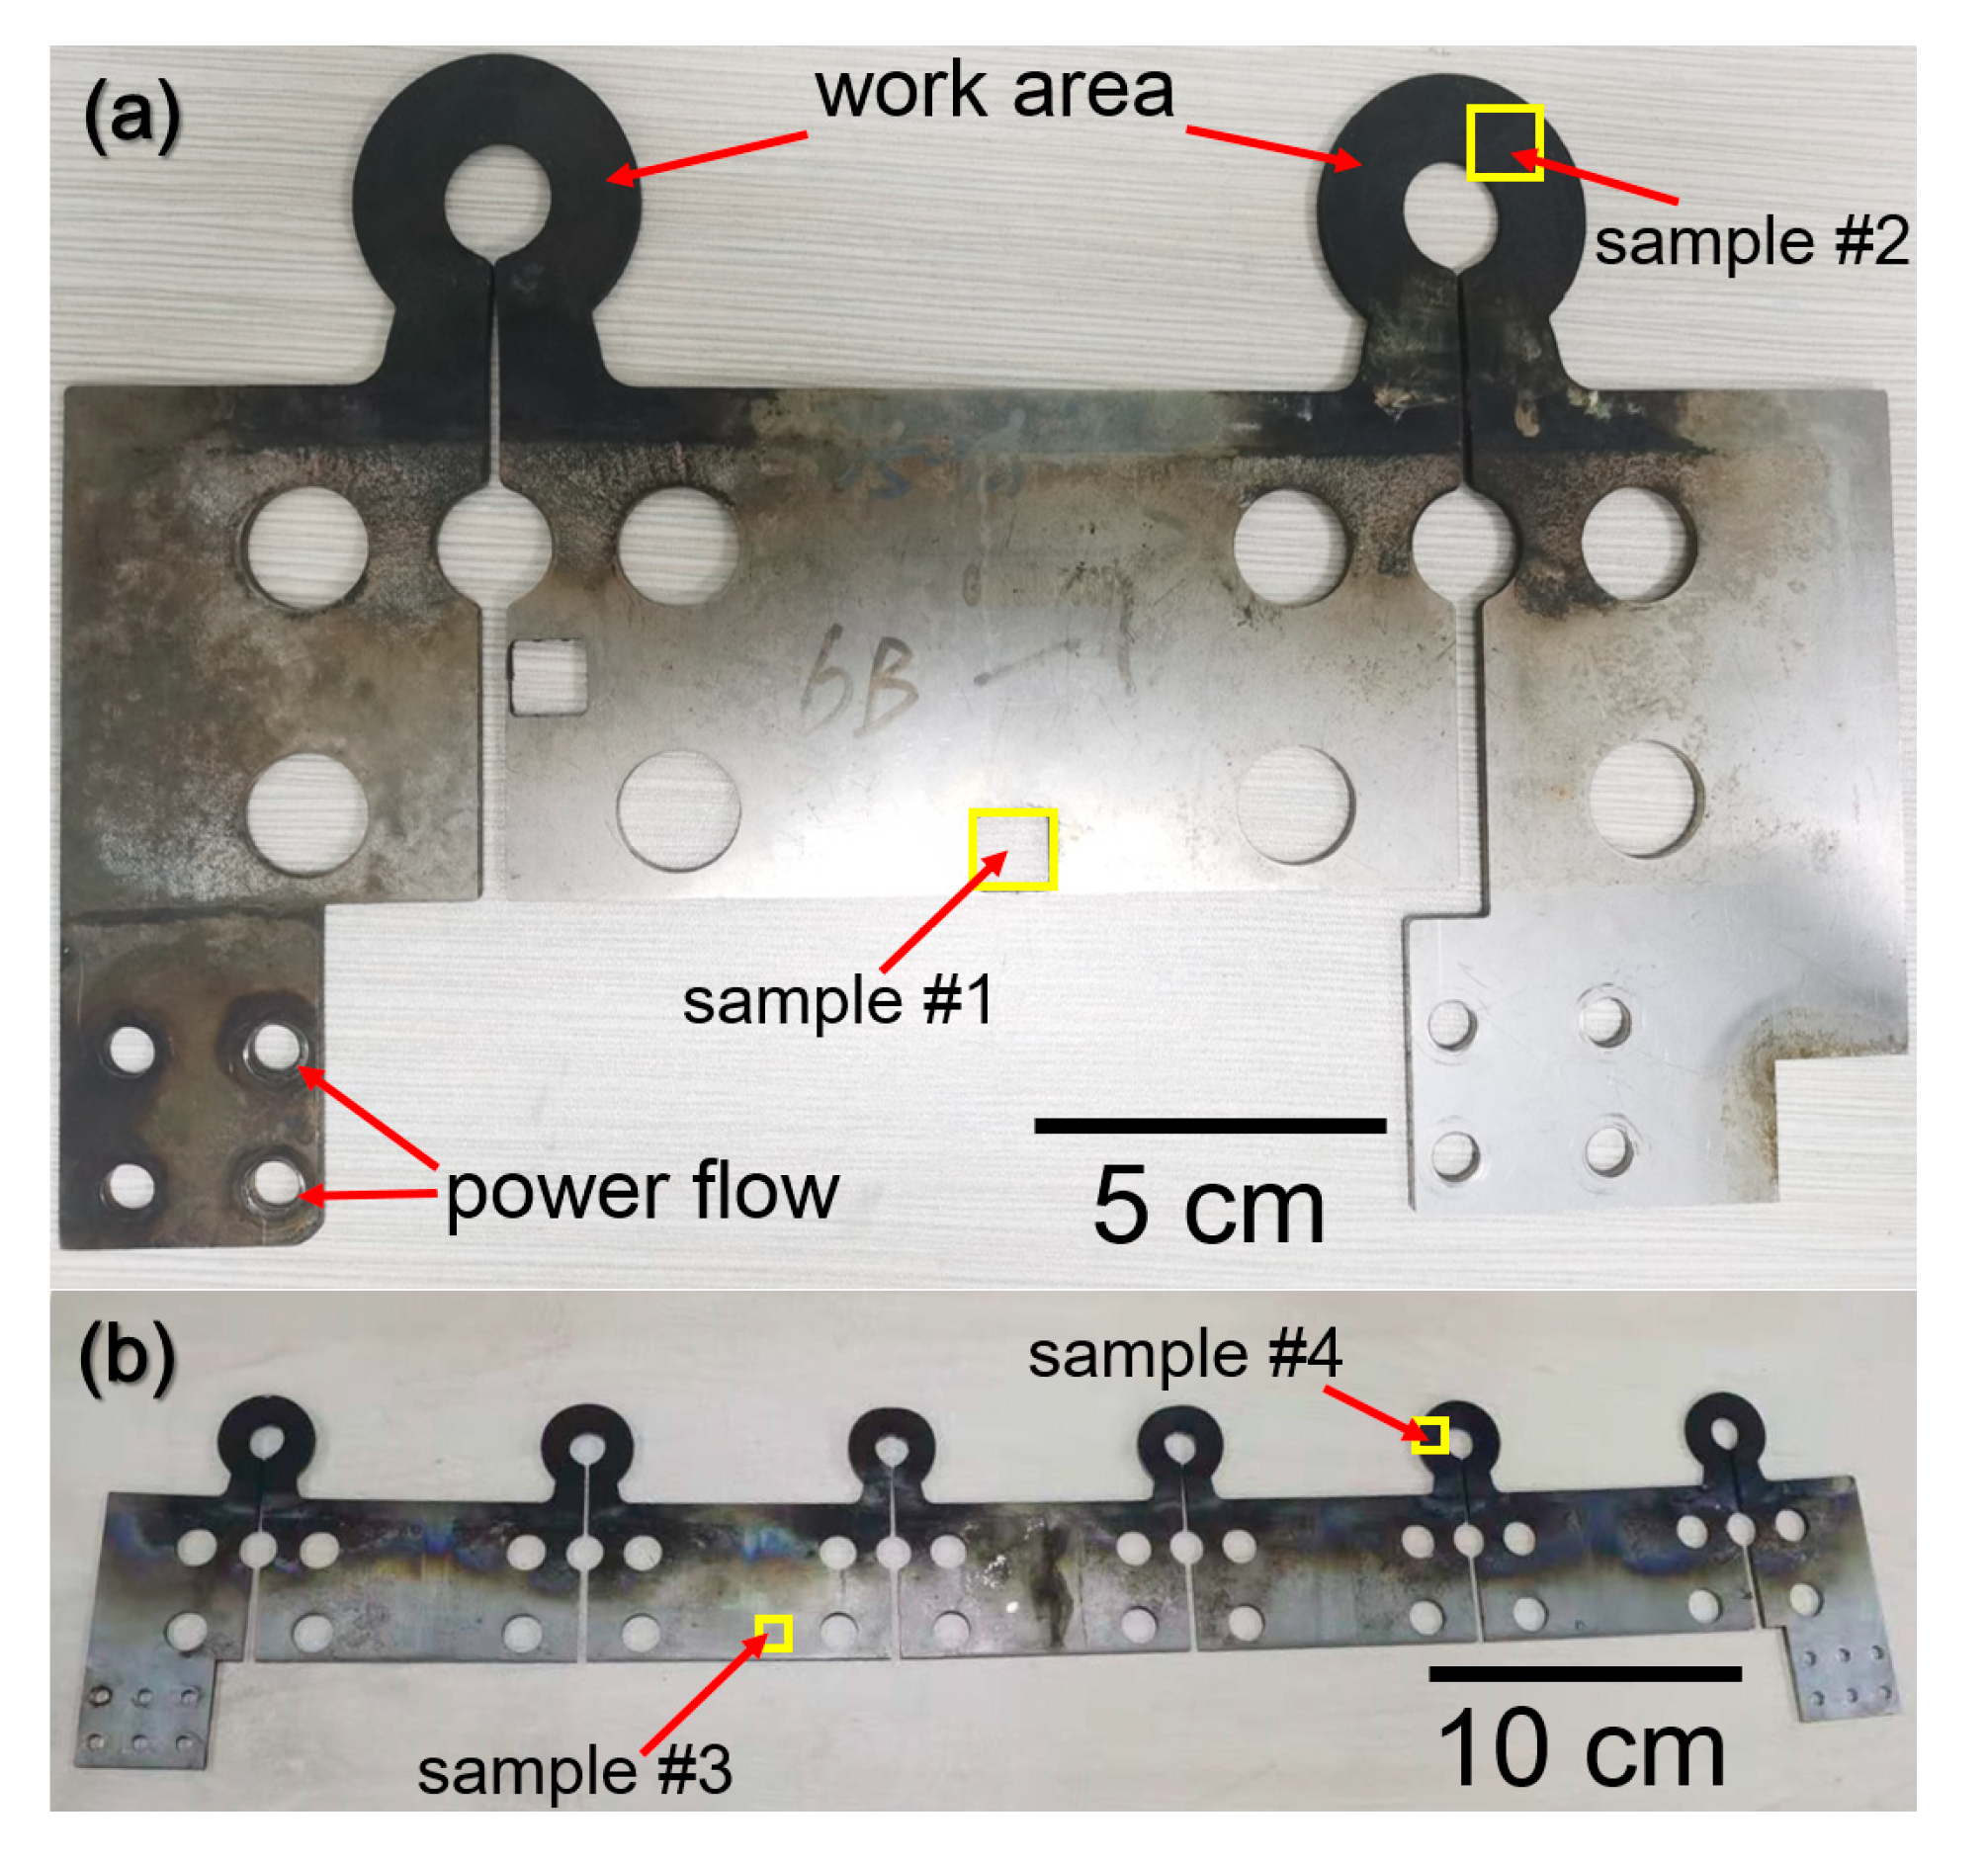
The tested specimens were heating plates taken from a packaging production line, as displayed in
Figure 1. The working environment of the tested samples was a temperature of 1000 °C for 7 months (approximately 5000 h). Four samples from the working area and the original area were, respectively, marked as samples #1–4. The grain size was measured by scanning electron microscopy (SEM, JSM-7800F, Tokyo, Japan) and electron back-scatter diffraction (EBSD), which were performed by a field emission scanning electron microscope (FESEM) (a JSM-7800F system installed with an oxford scan mode and a beam step size of 300 nm, Oxford, UK). The acceleration voltage of SEM image mode was at 5 kV, working distance was 10 mm, magnification ranges from ×100 to ×1000, scale bar was attached to each image, and resolution of image was 640 × 480 pixels. The precipitated phase was analyzed by transmission electron microscopy (TEM, JEOL 2100F, Tokyo, Japan) operated at 200 kV. For the TEM sample preparation, the tested specimens were first mechanically polished to 100 μm in thickness, after which they were polished by a Struers TenuPol-5 electrolytic polishing device at room temperature with an electrolyte solution of 10% perchloric acid and 90% acetic acid. For the phase analysis, X-ray diffraction (XRD) analyses of the surface layers were conducted using a X-ray (Rigaku Smart Lab-9, Tokyo, Japan) diffractometer with Cu Kα radiation.
3. Results
The main chemical compositions of the tested materials are reported in
Table 1. Specimens #1 and #3 were the matrixes, and specimens #2 and #4 were the surfaces of after heat treatment, respectively.
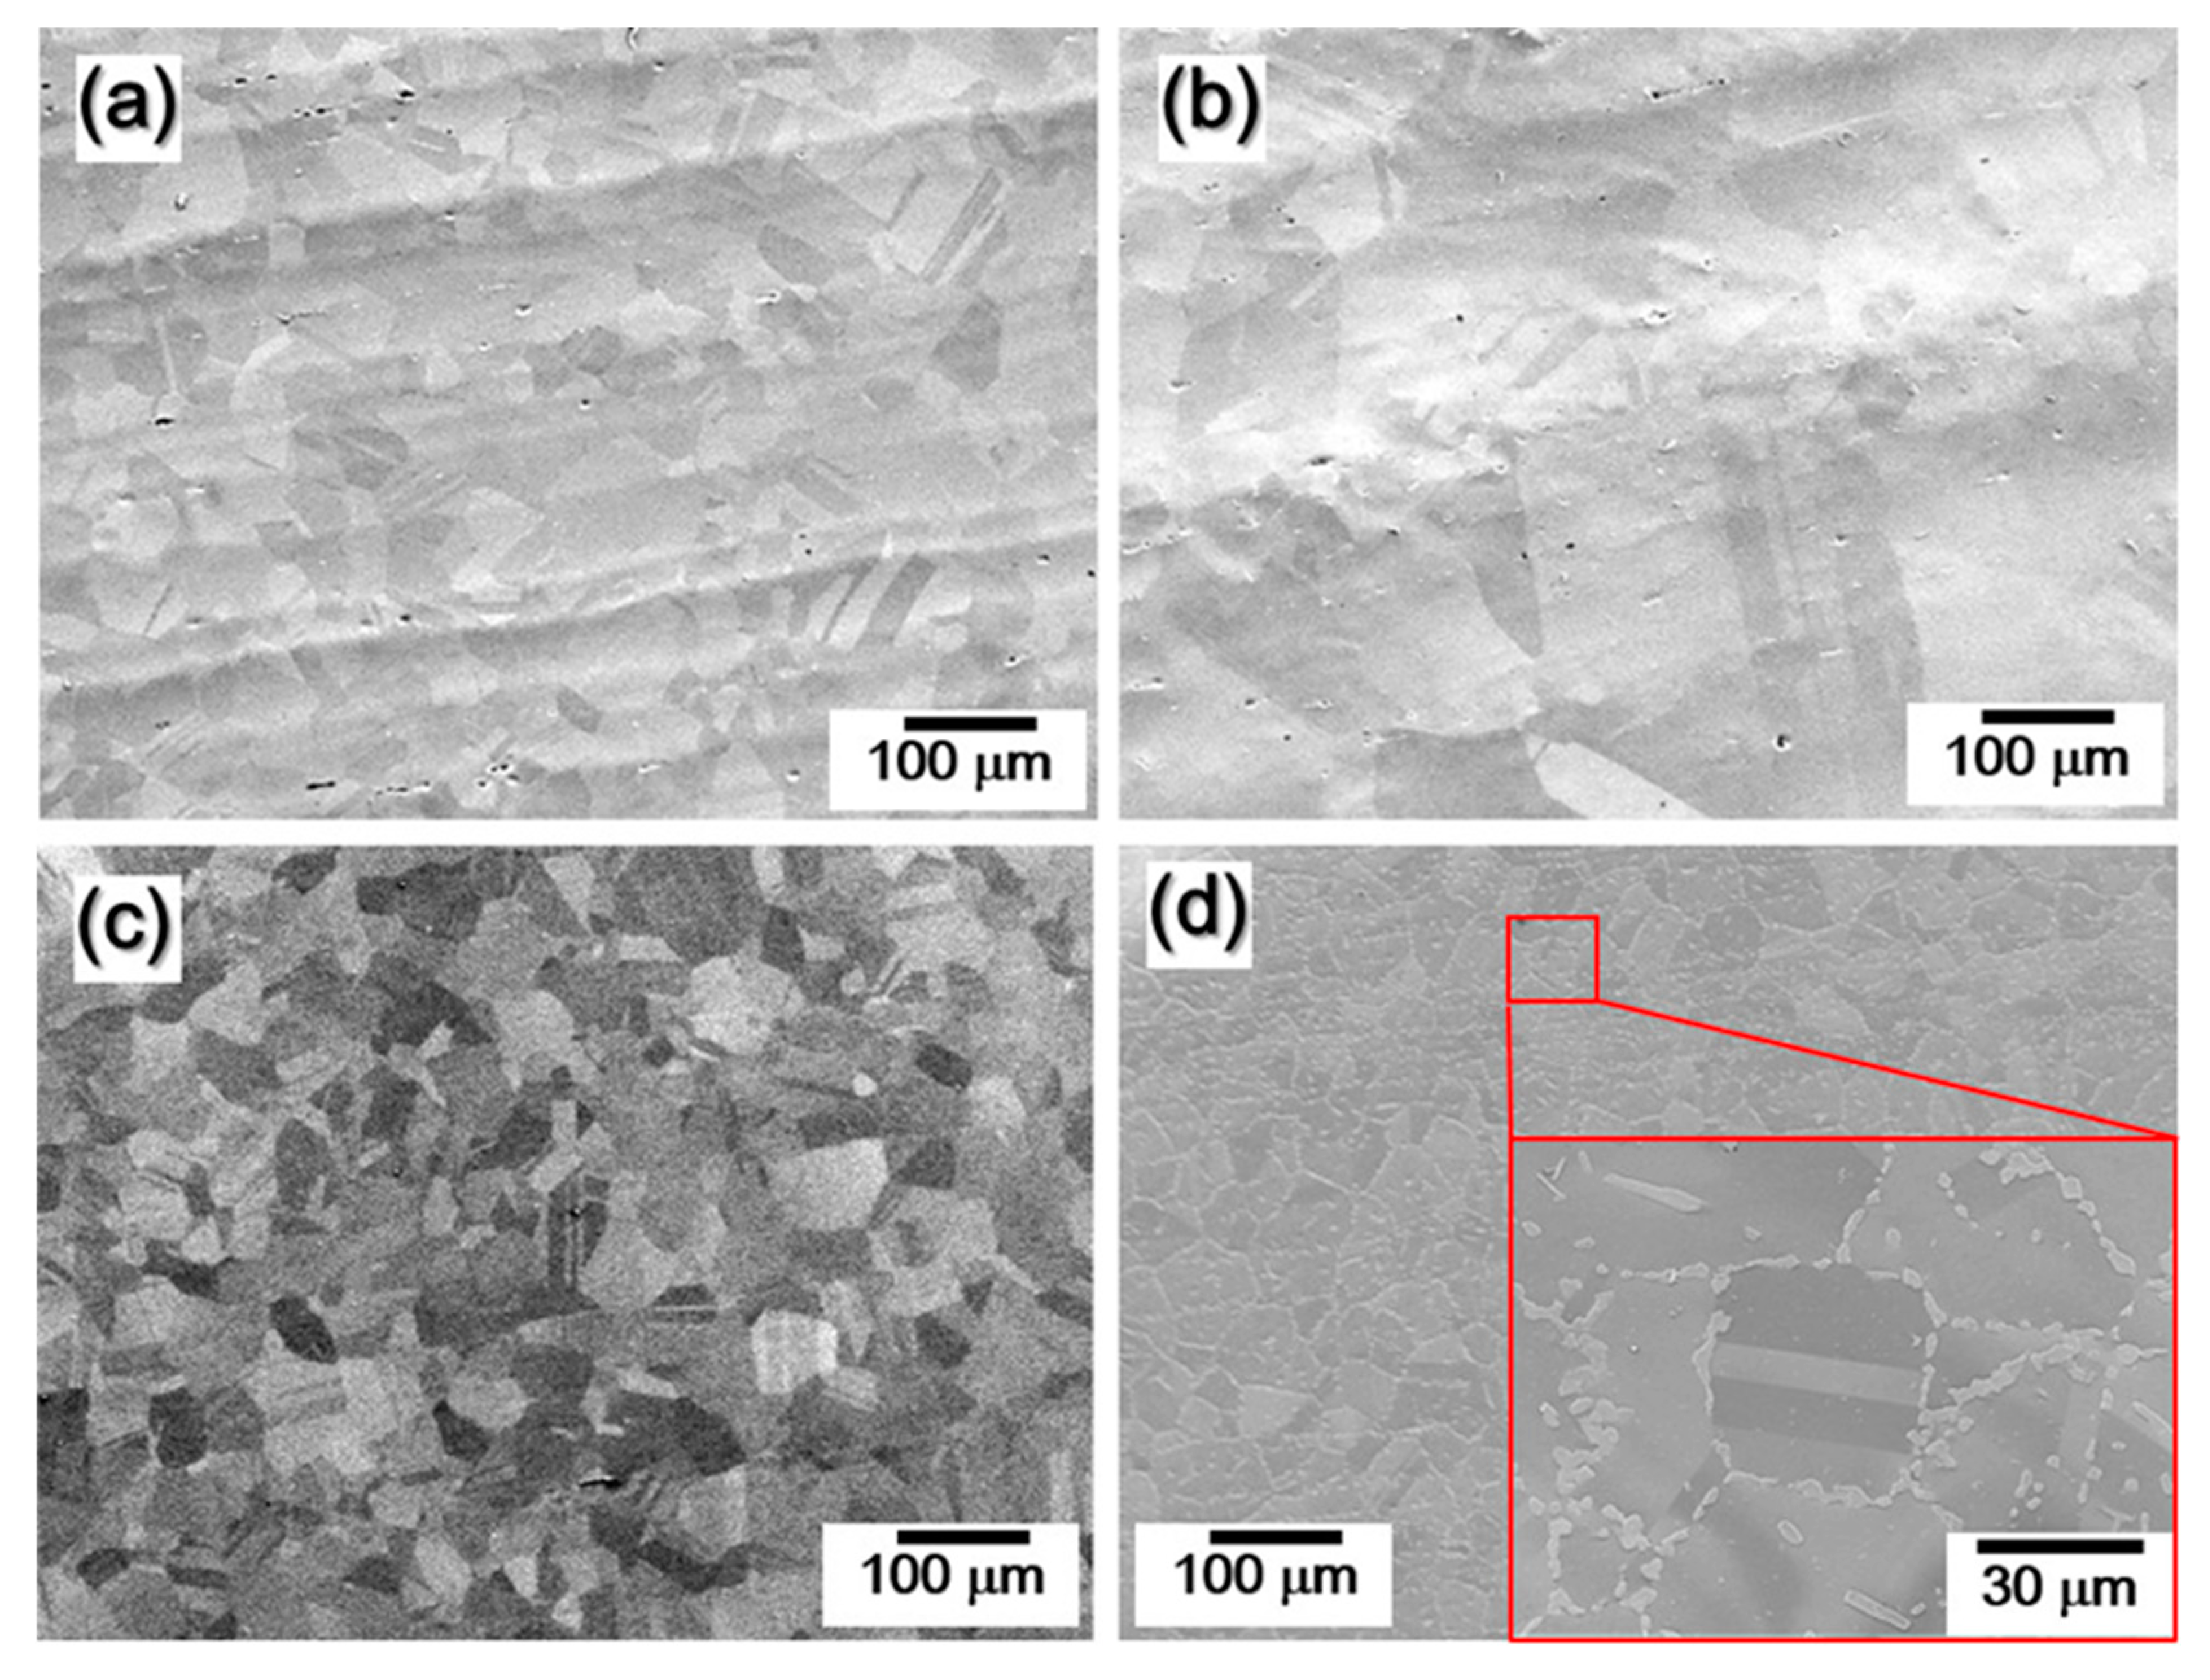
Figure 2 presents the SEM characterization of the specimens before and after heat treatment; based on the comparison of
Figure 2a,b, it is evident that the grains grew obviously after heat treatment. The grains in sample #1 were homogeneous and had twin structures, and the grain size of sample #2 was around 100 μm. However, as shown in
Figure 2c,d, there was no obvious change in grain size between specimens #3 and #4, except that many precipitates were found at the grain boundary (GB). To determine why the grains of sample #3 did not grow up after high-temperature heat treatment, the microstructures of samples #2 and #4 were analyzed in detail.
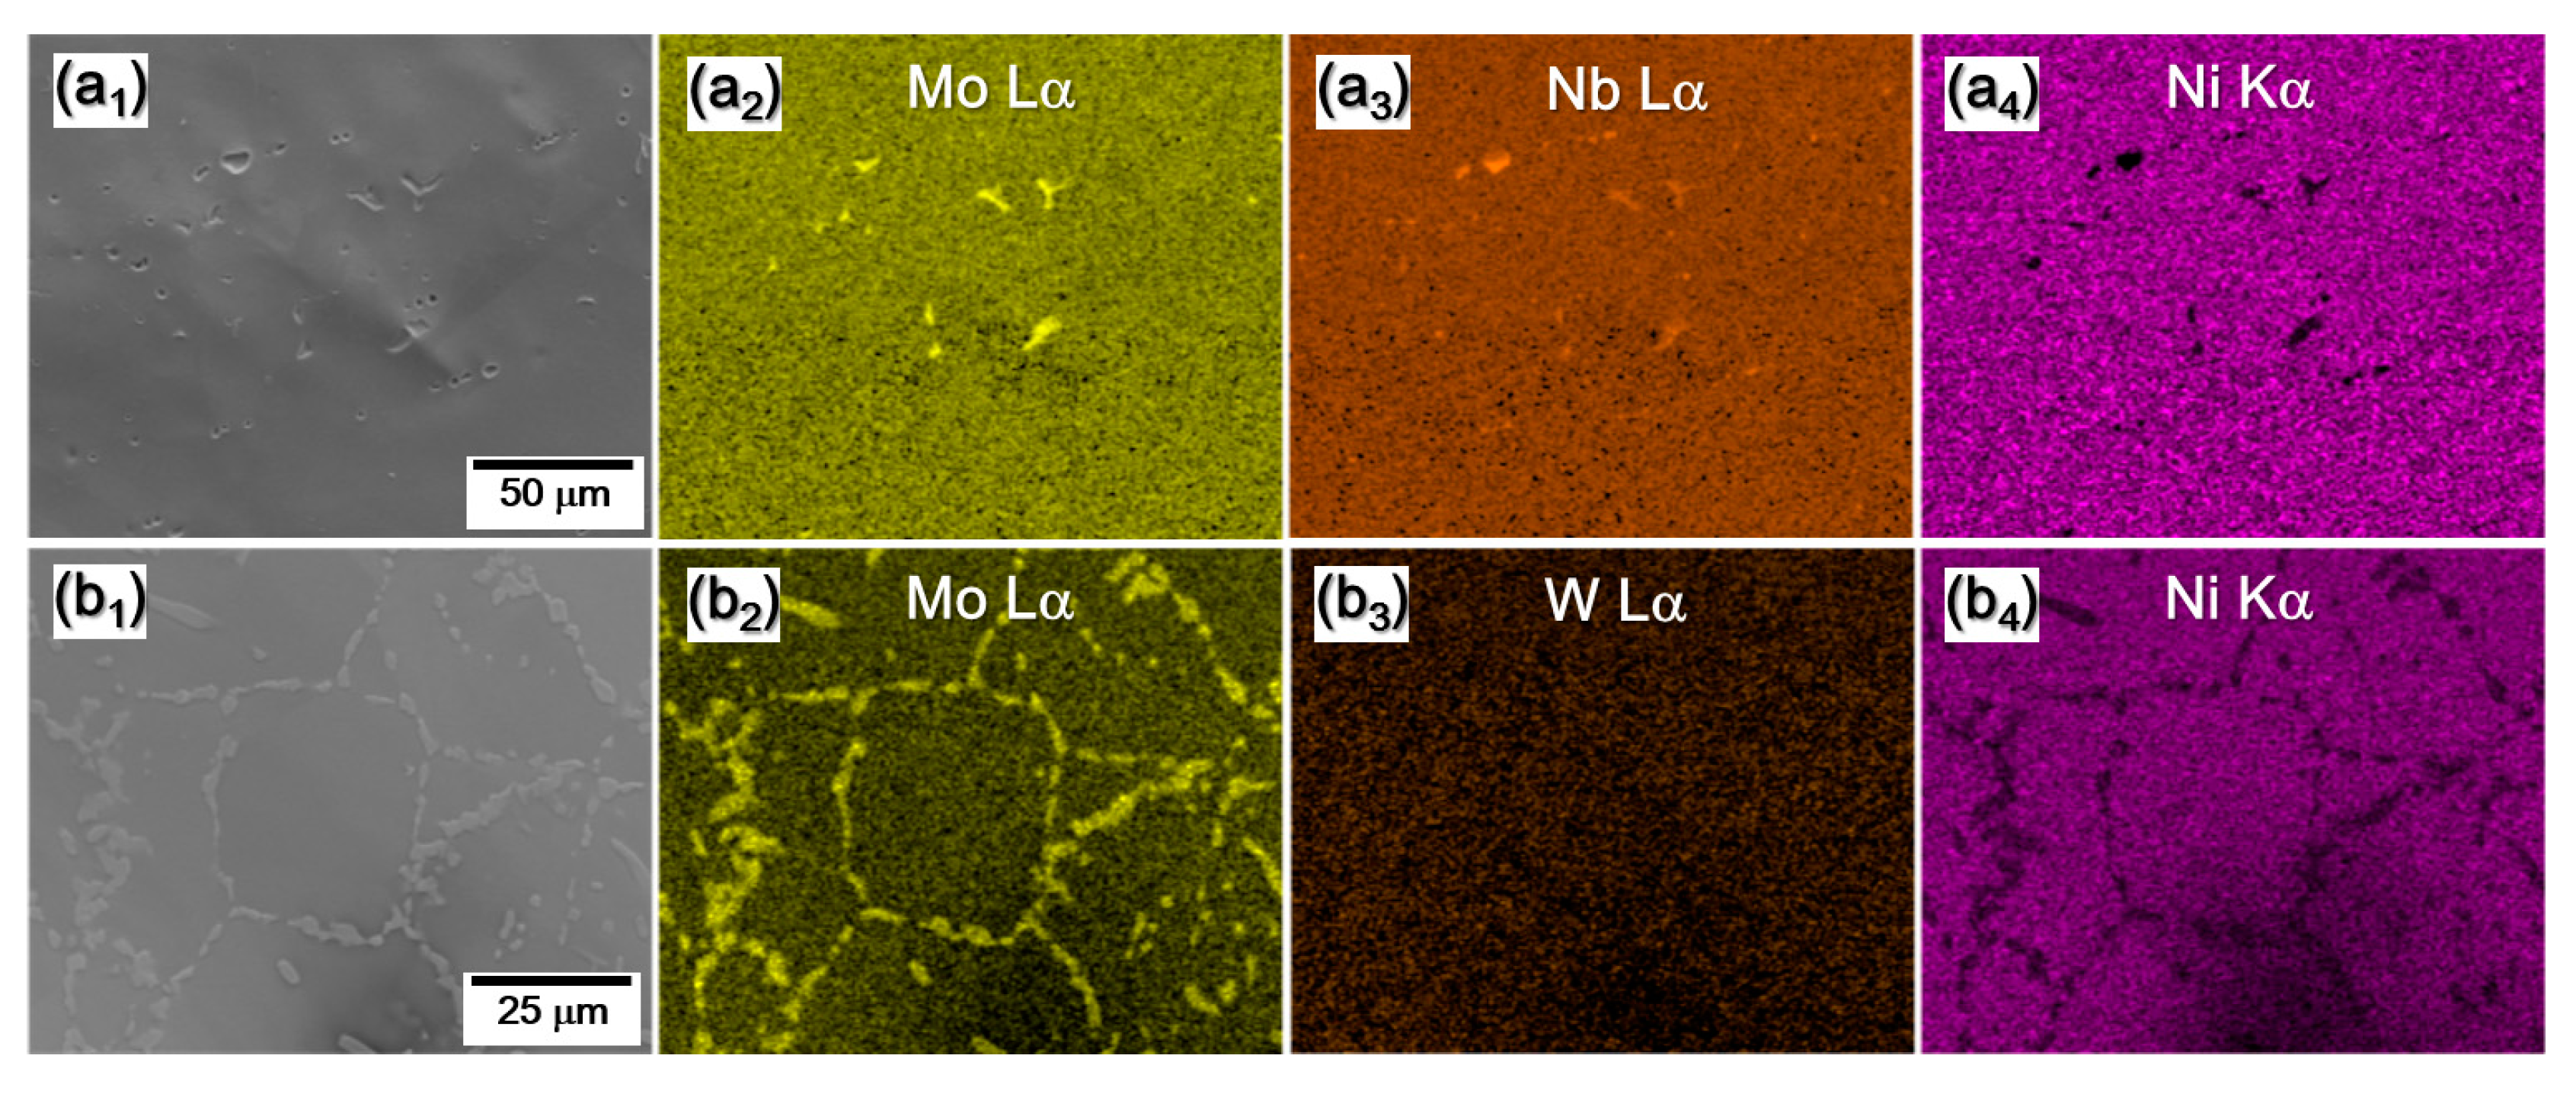
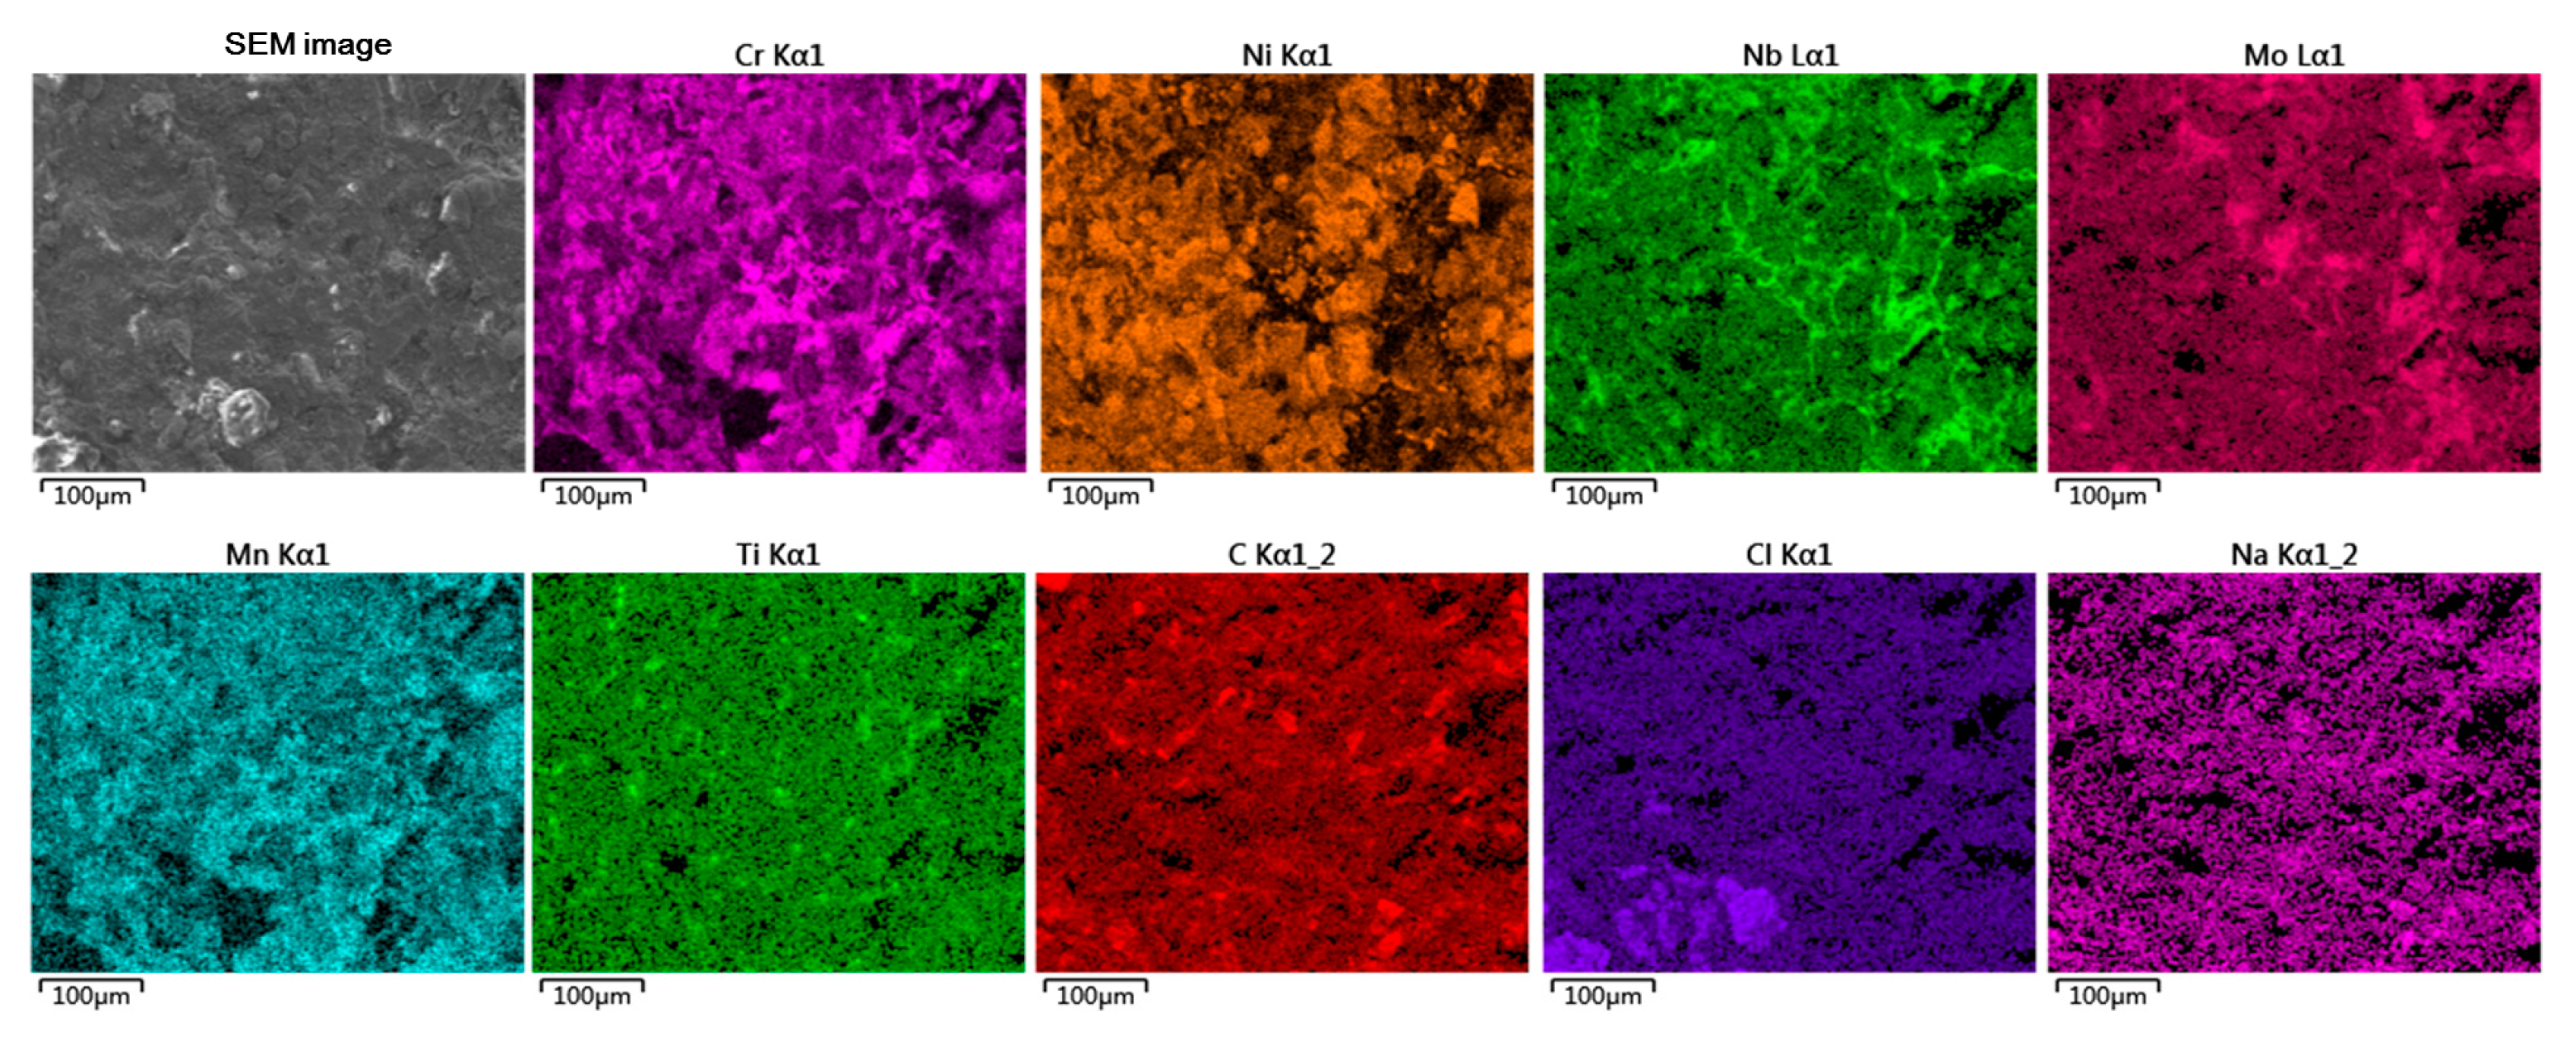
Figure 3 presents the results of SEM/EDS mapping, which reveal that the surface enrichment of Mo and Nb was obvious after high-temperature heat treatment, and no significant local enrichment of W and Ni was found. As shown in
Figure 3(b
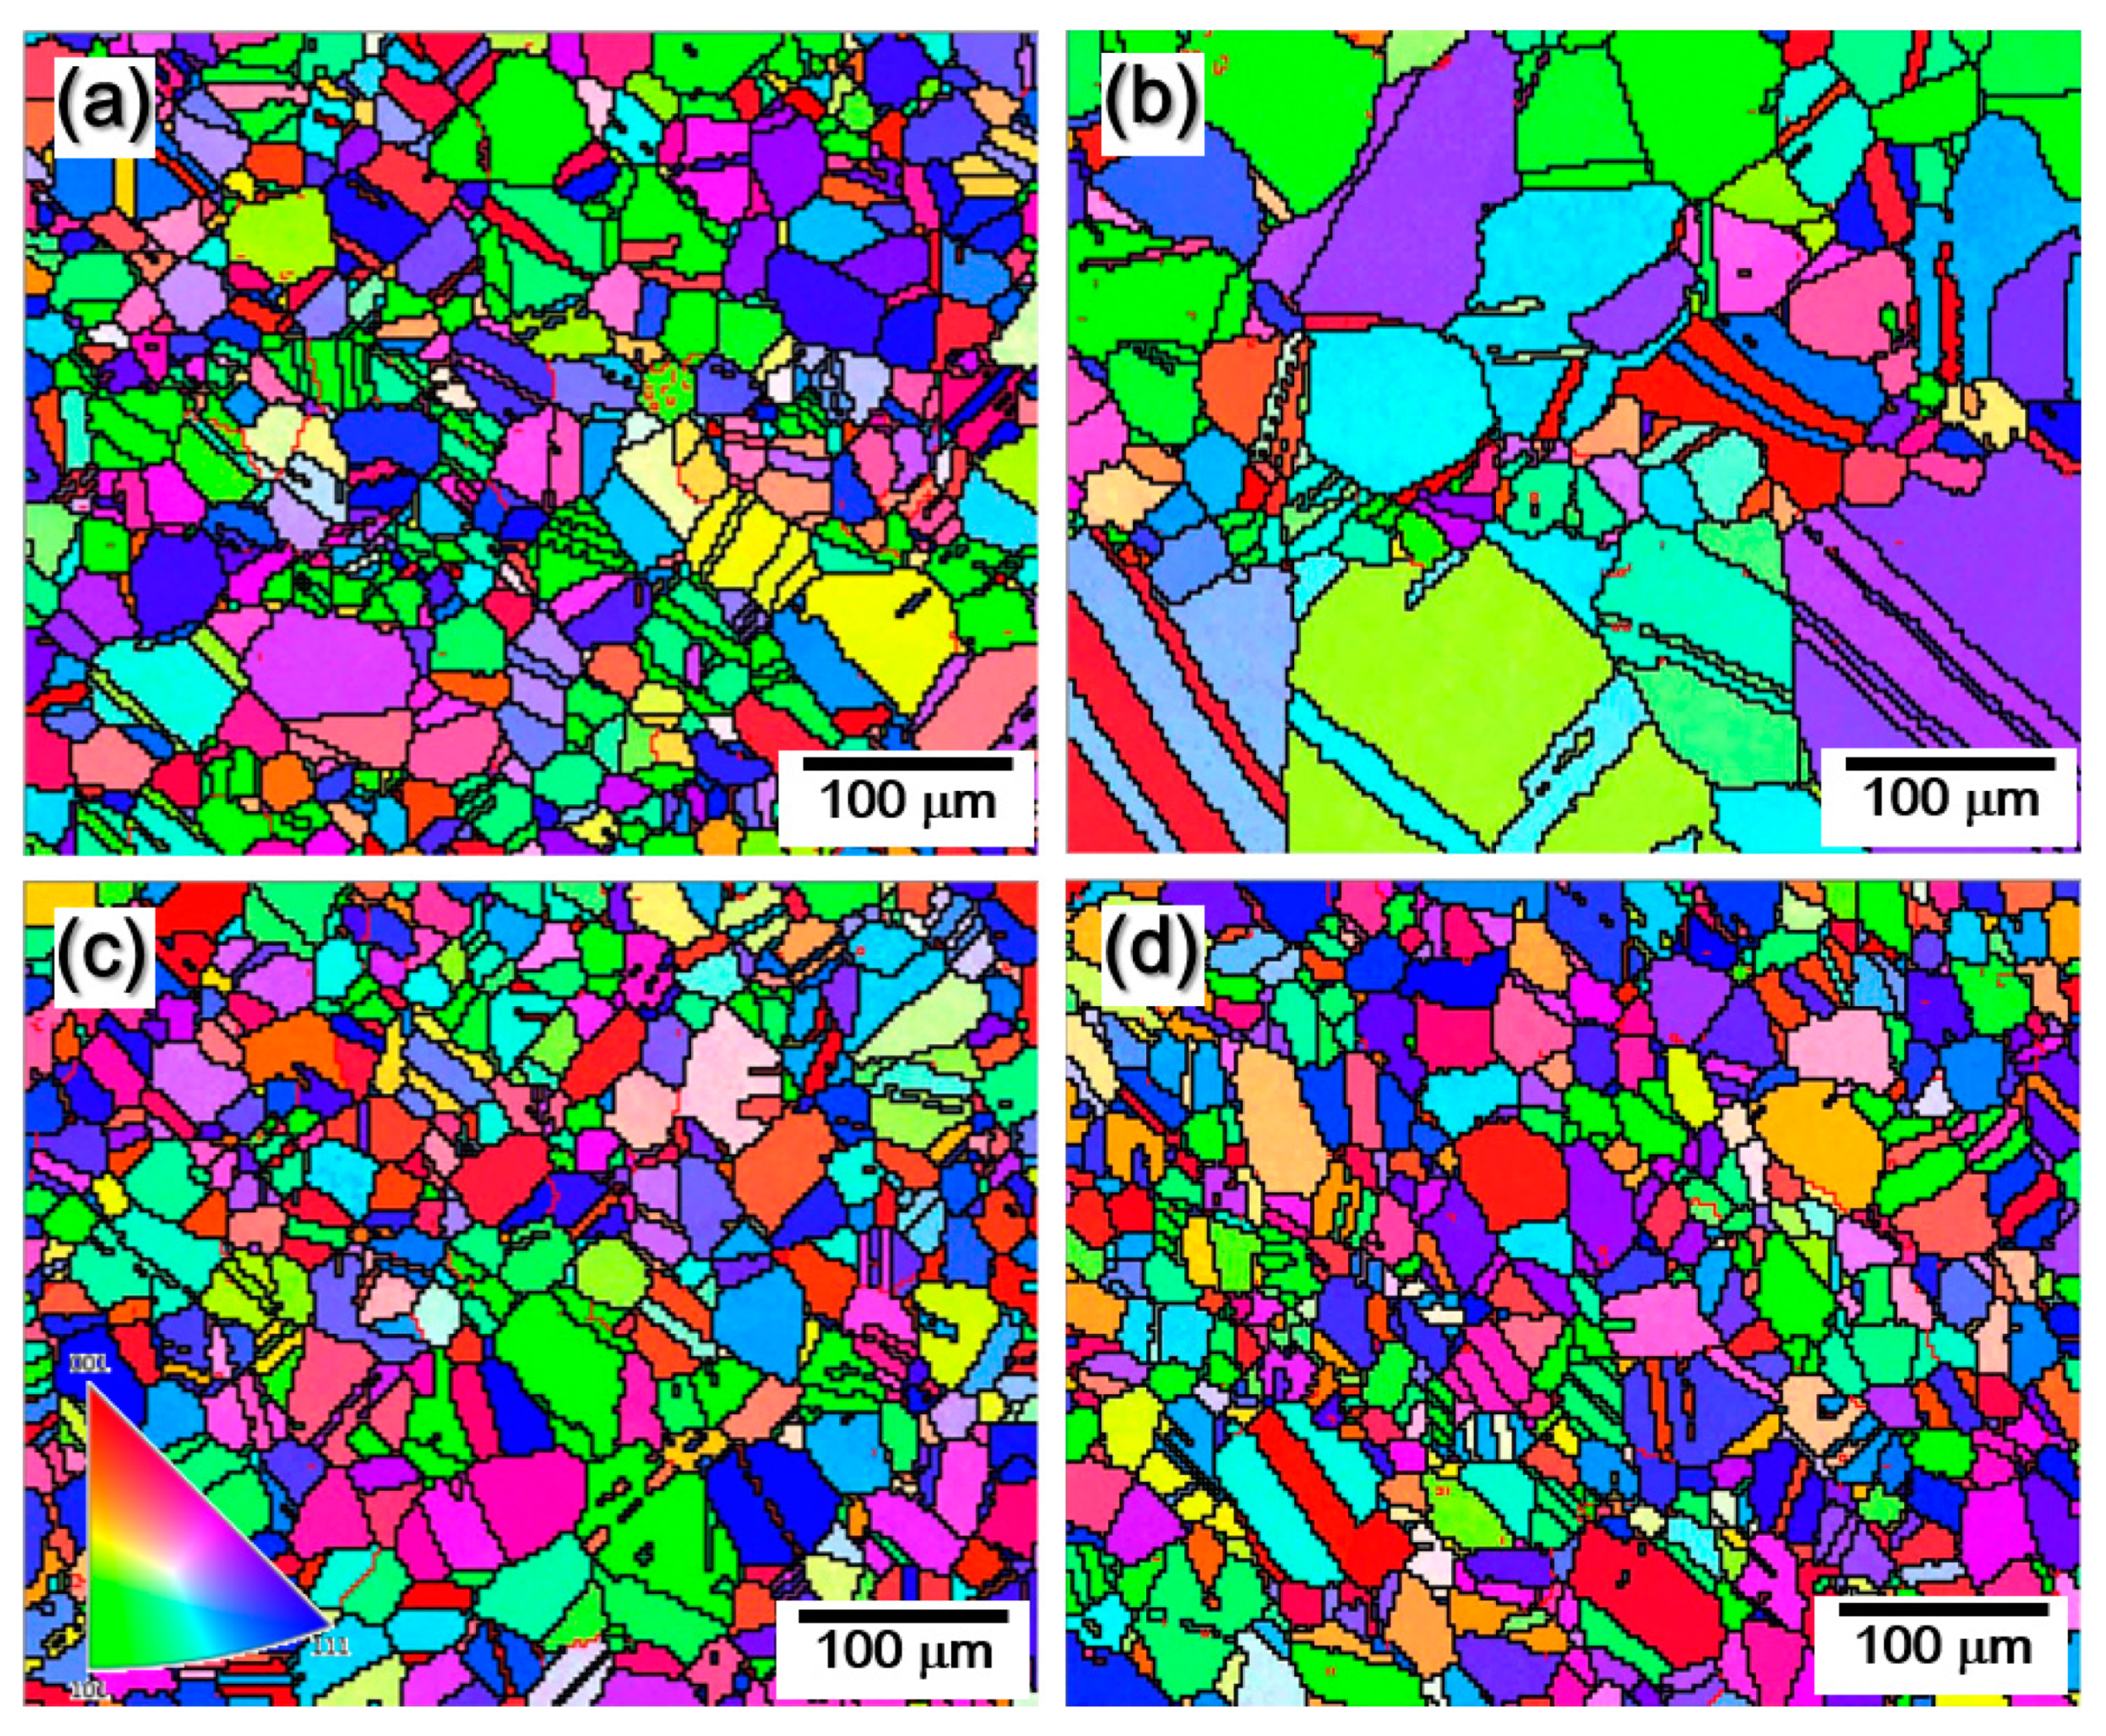
2), a large amount of Mo was precipitated at the GB and covered almost the whole grain. Grain growth was also obvious from the EBSD analysis, as shown in
Figure 4. Therefore, it is speculated that a large amount of Mo and Nb will precipitate at the GB in a long-term high-temperature environment, thereby hindering the growth of grains.
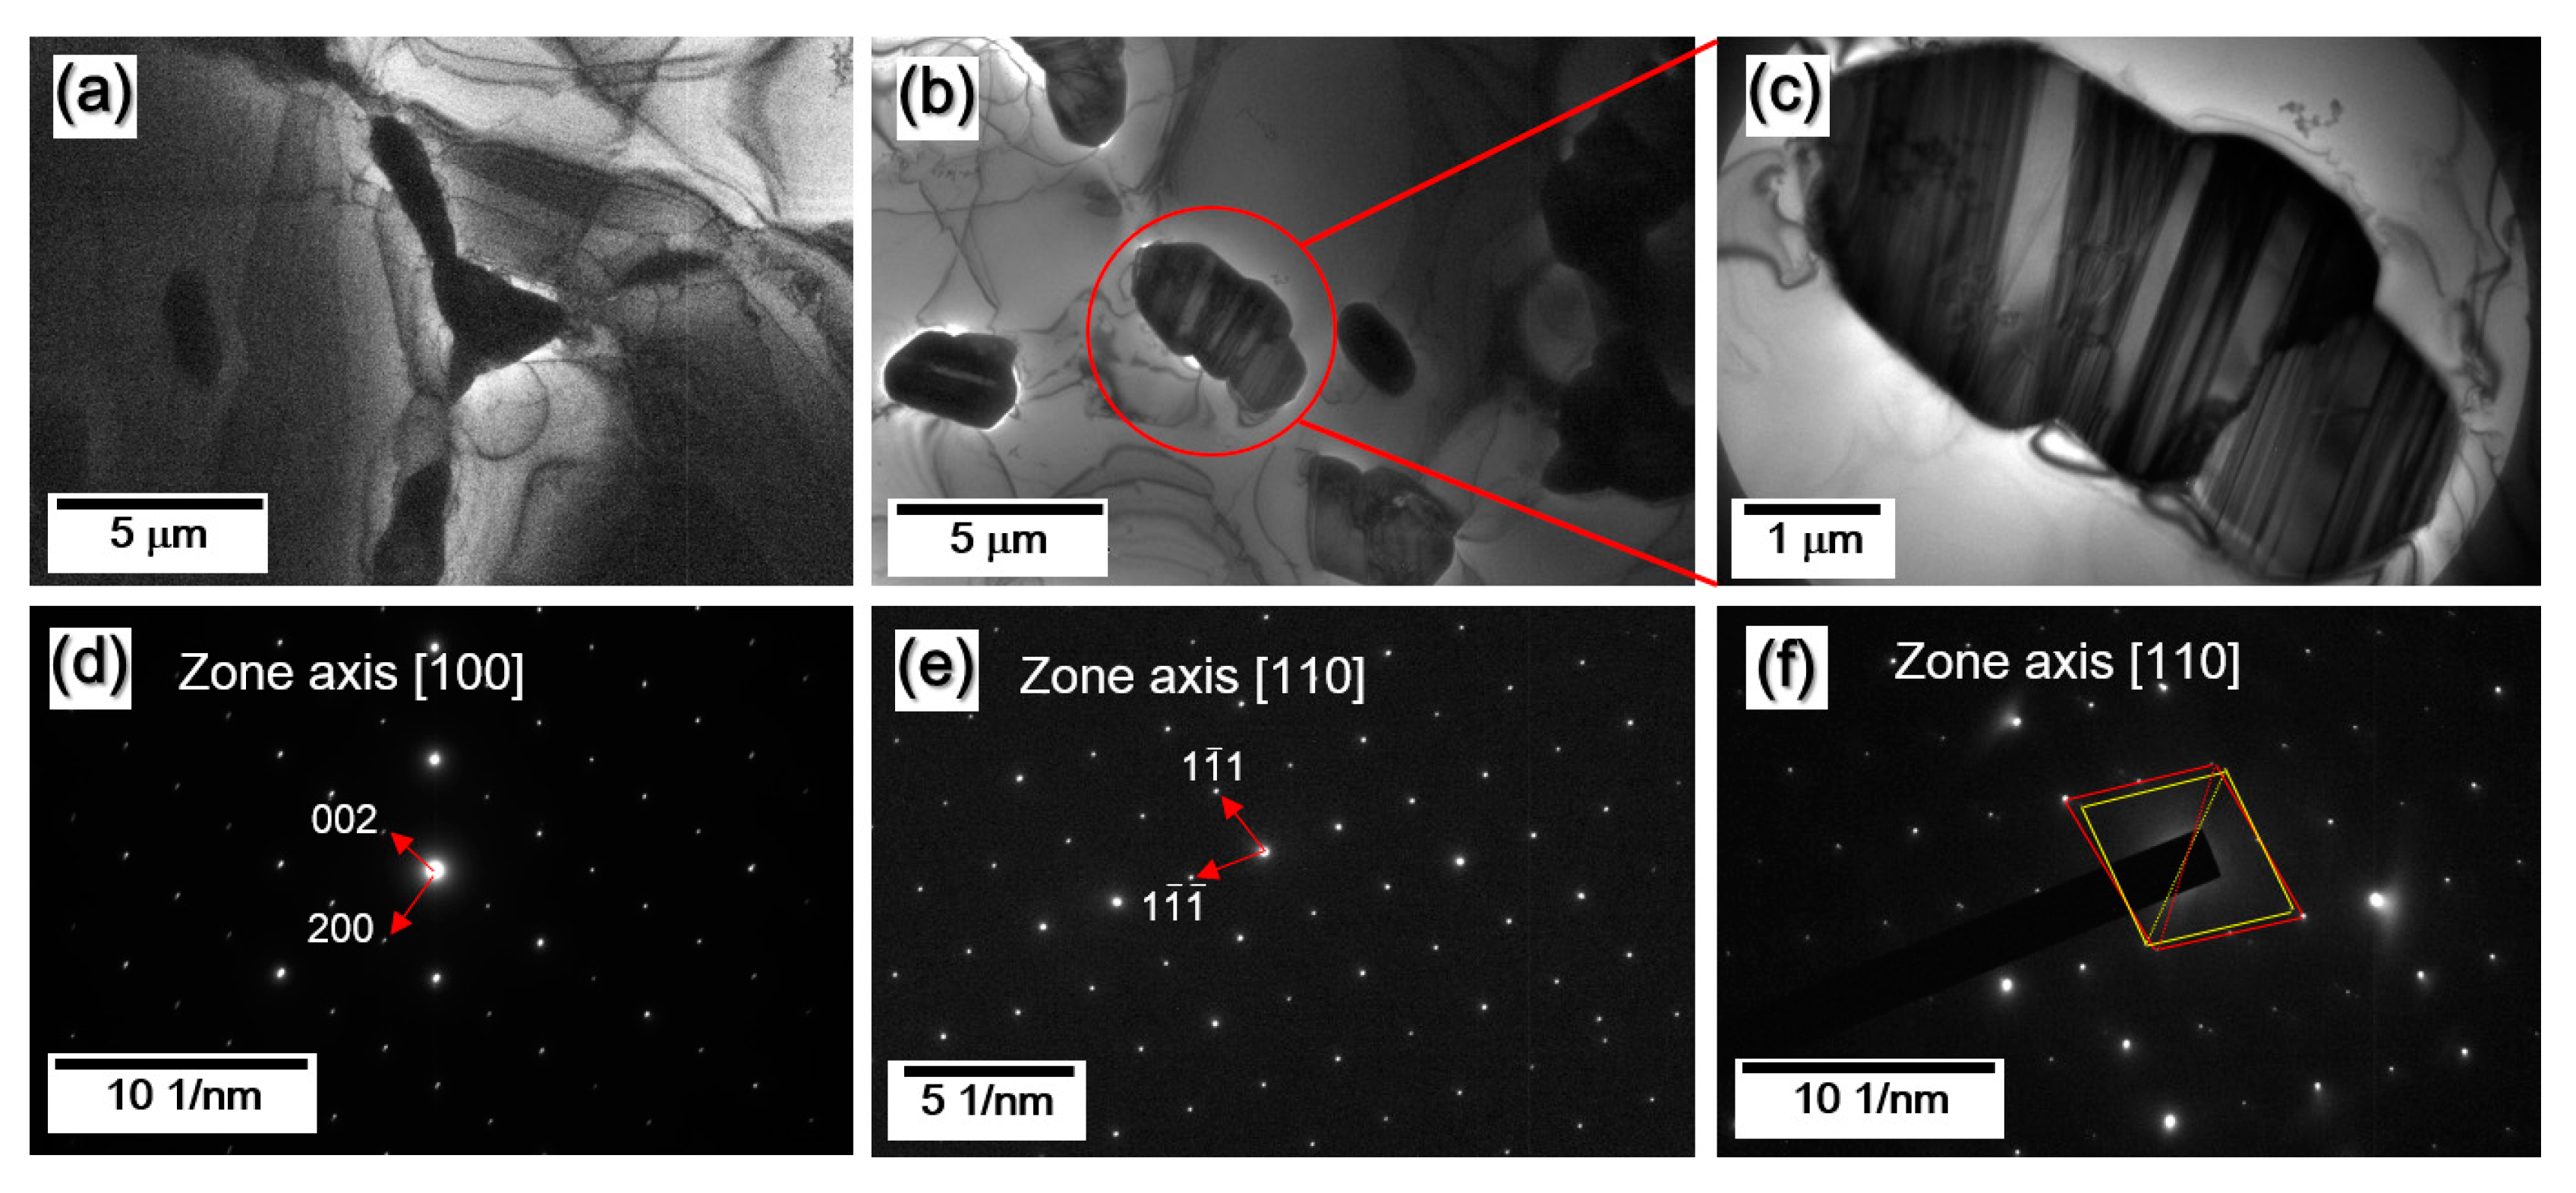
Figure 5 presents the TEM analysis, which also confirms the presence of a large number of precipitates near the grain boundaries. Twin structures were identified inside of the precipitated phase. The selected area diffraction pattern (SADP) in
Figure 5f reveals double bright spots, which correspond to the twin structure shown in
Figure 5c. Preliminary research has confirmed the distribution of granular and thin rod-like M
2C carbides in the matrix and at the grain boundaries [
5]. However, in this work, most of the precipitates were found to be located at the GB.
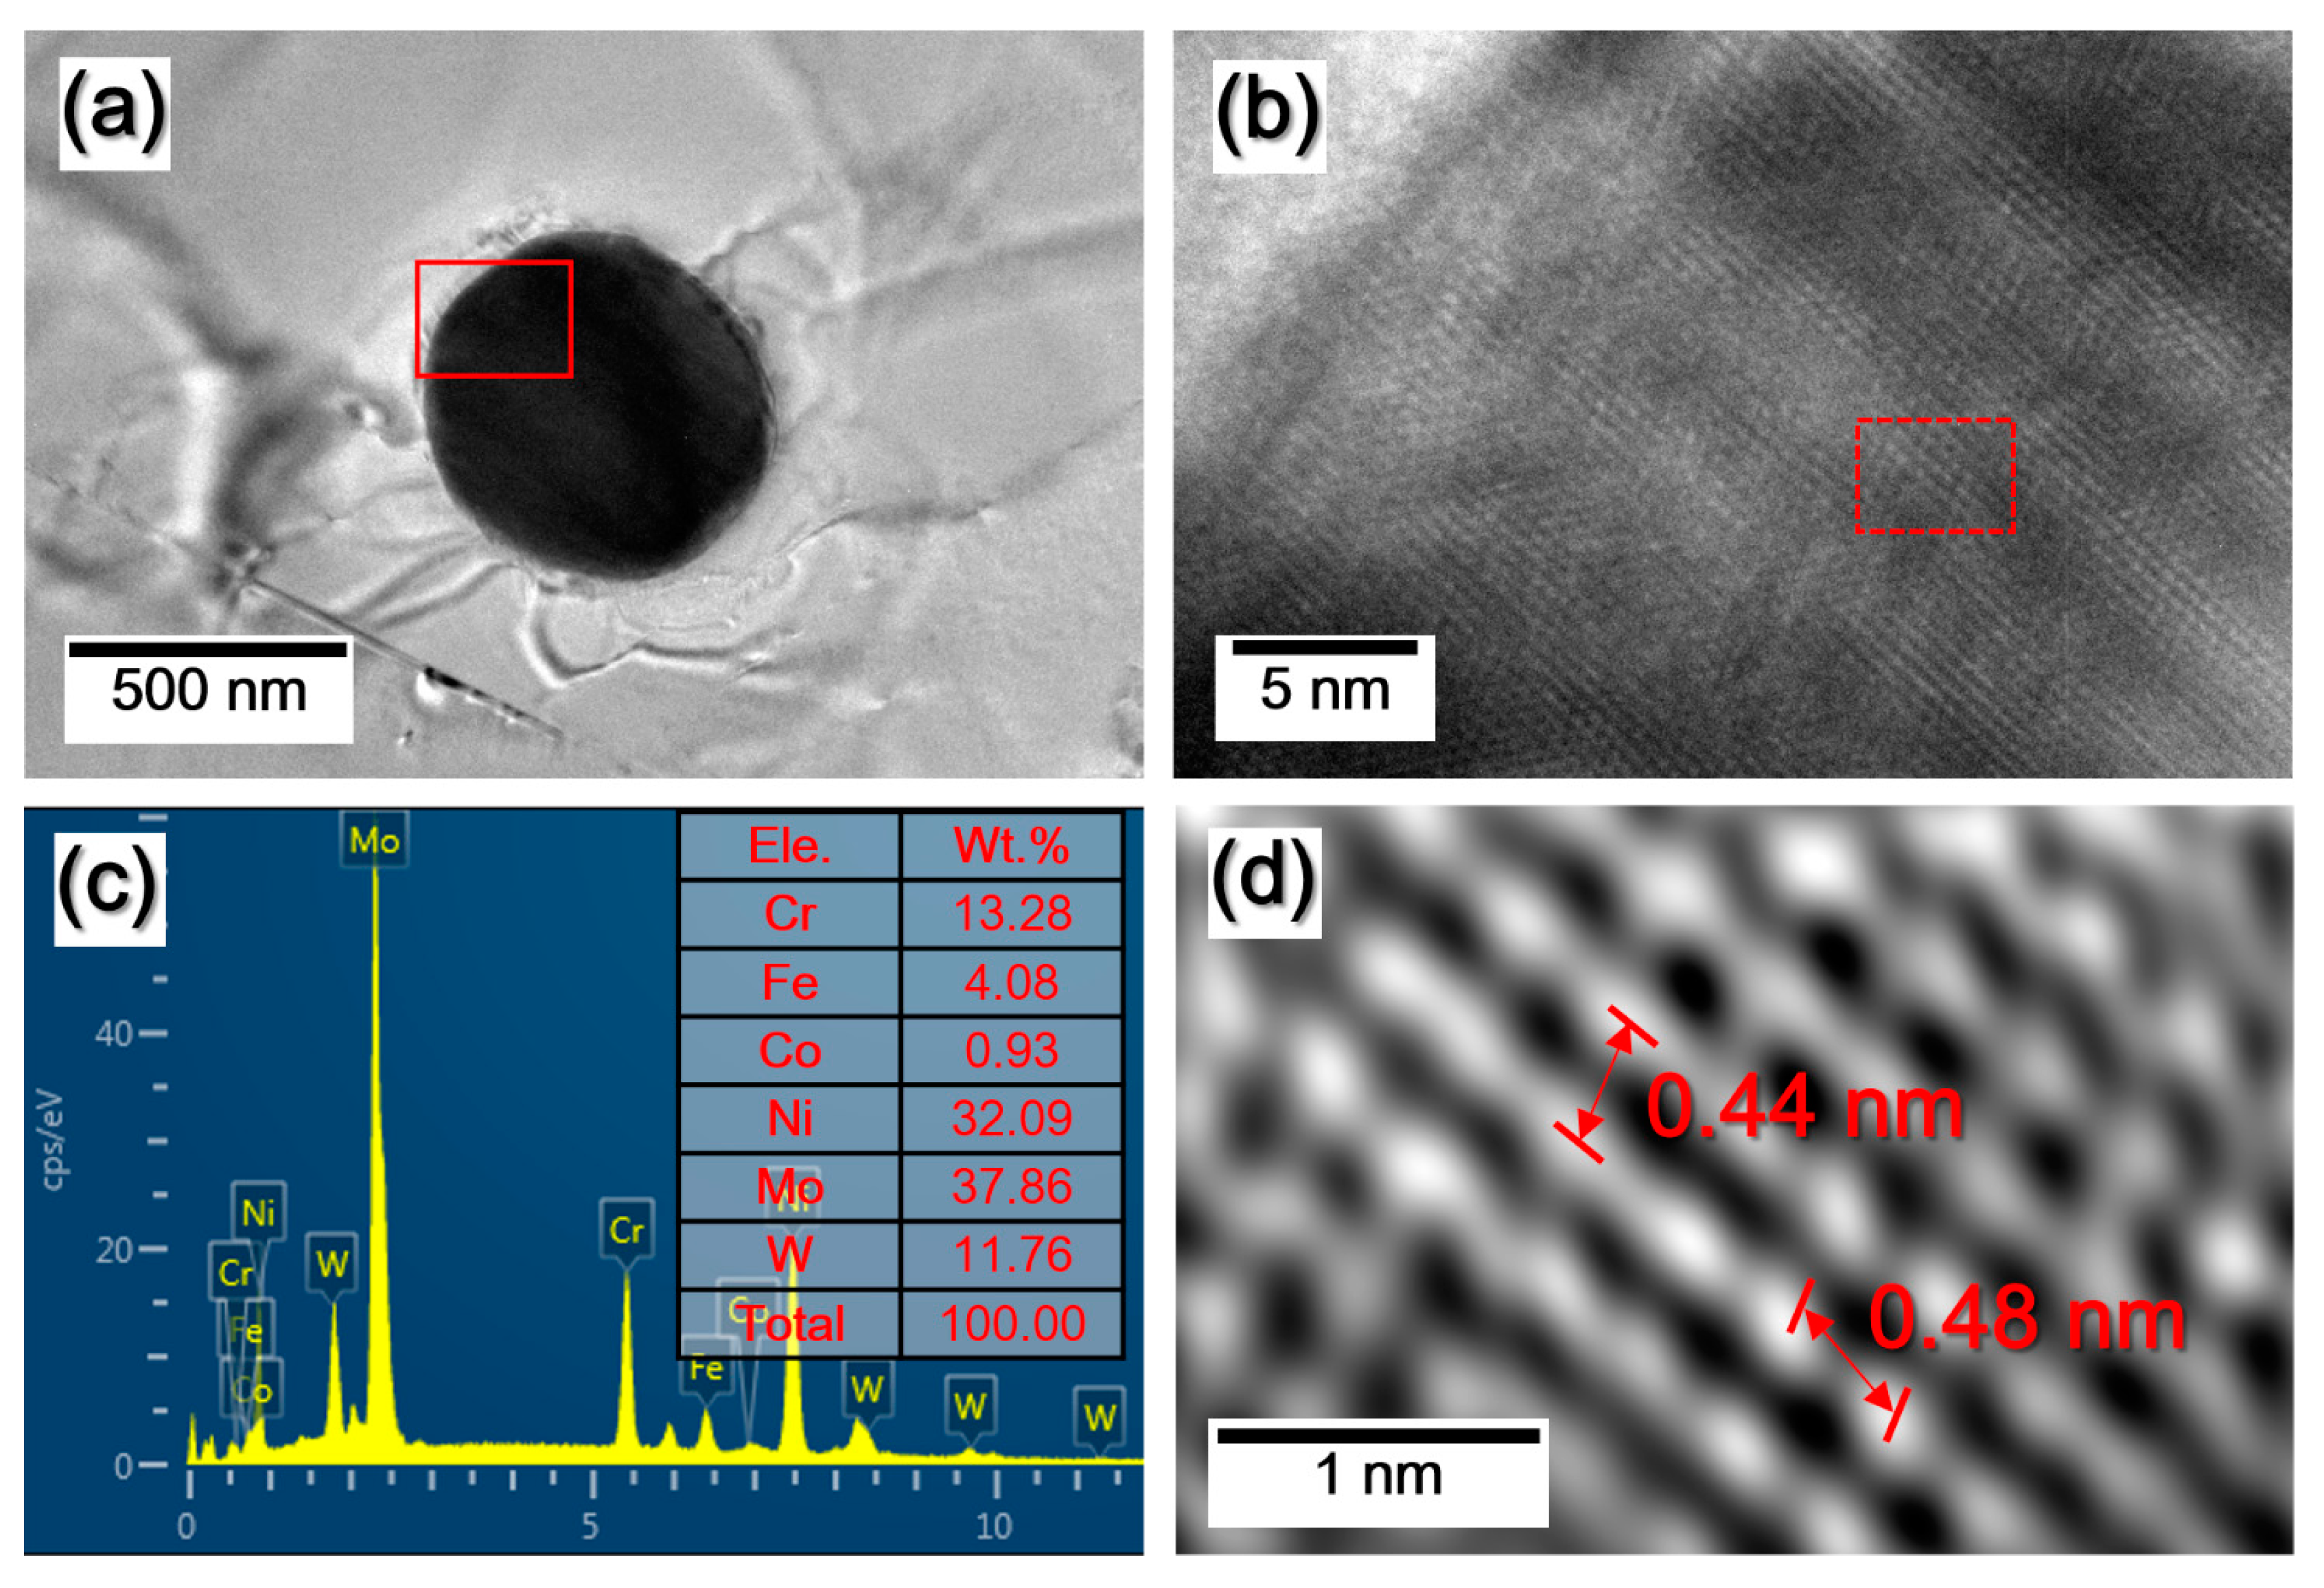
Figure 6a presents a closer observation of one particle as revealed by TEM. In the high magnification image (b), the chemical composition (c) and atomic arrangement spacing of the precipitated phase are proved (d). Based on the results, the precipitates were not only Mo carbides, but also W carbides. The distances between their atoms were, respectively, 0.44 and 0.48 nm.
XRD and SEM were employed to observe and compare the surface phases and corrosion products of the Ni-based alloys before and after working in a high-temperature environment.
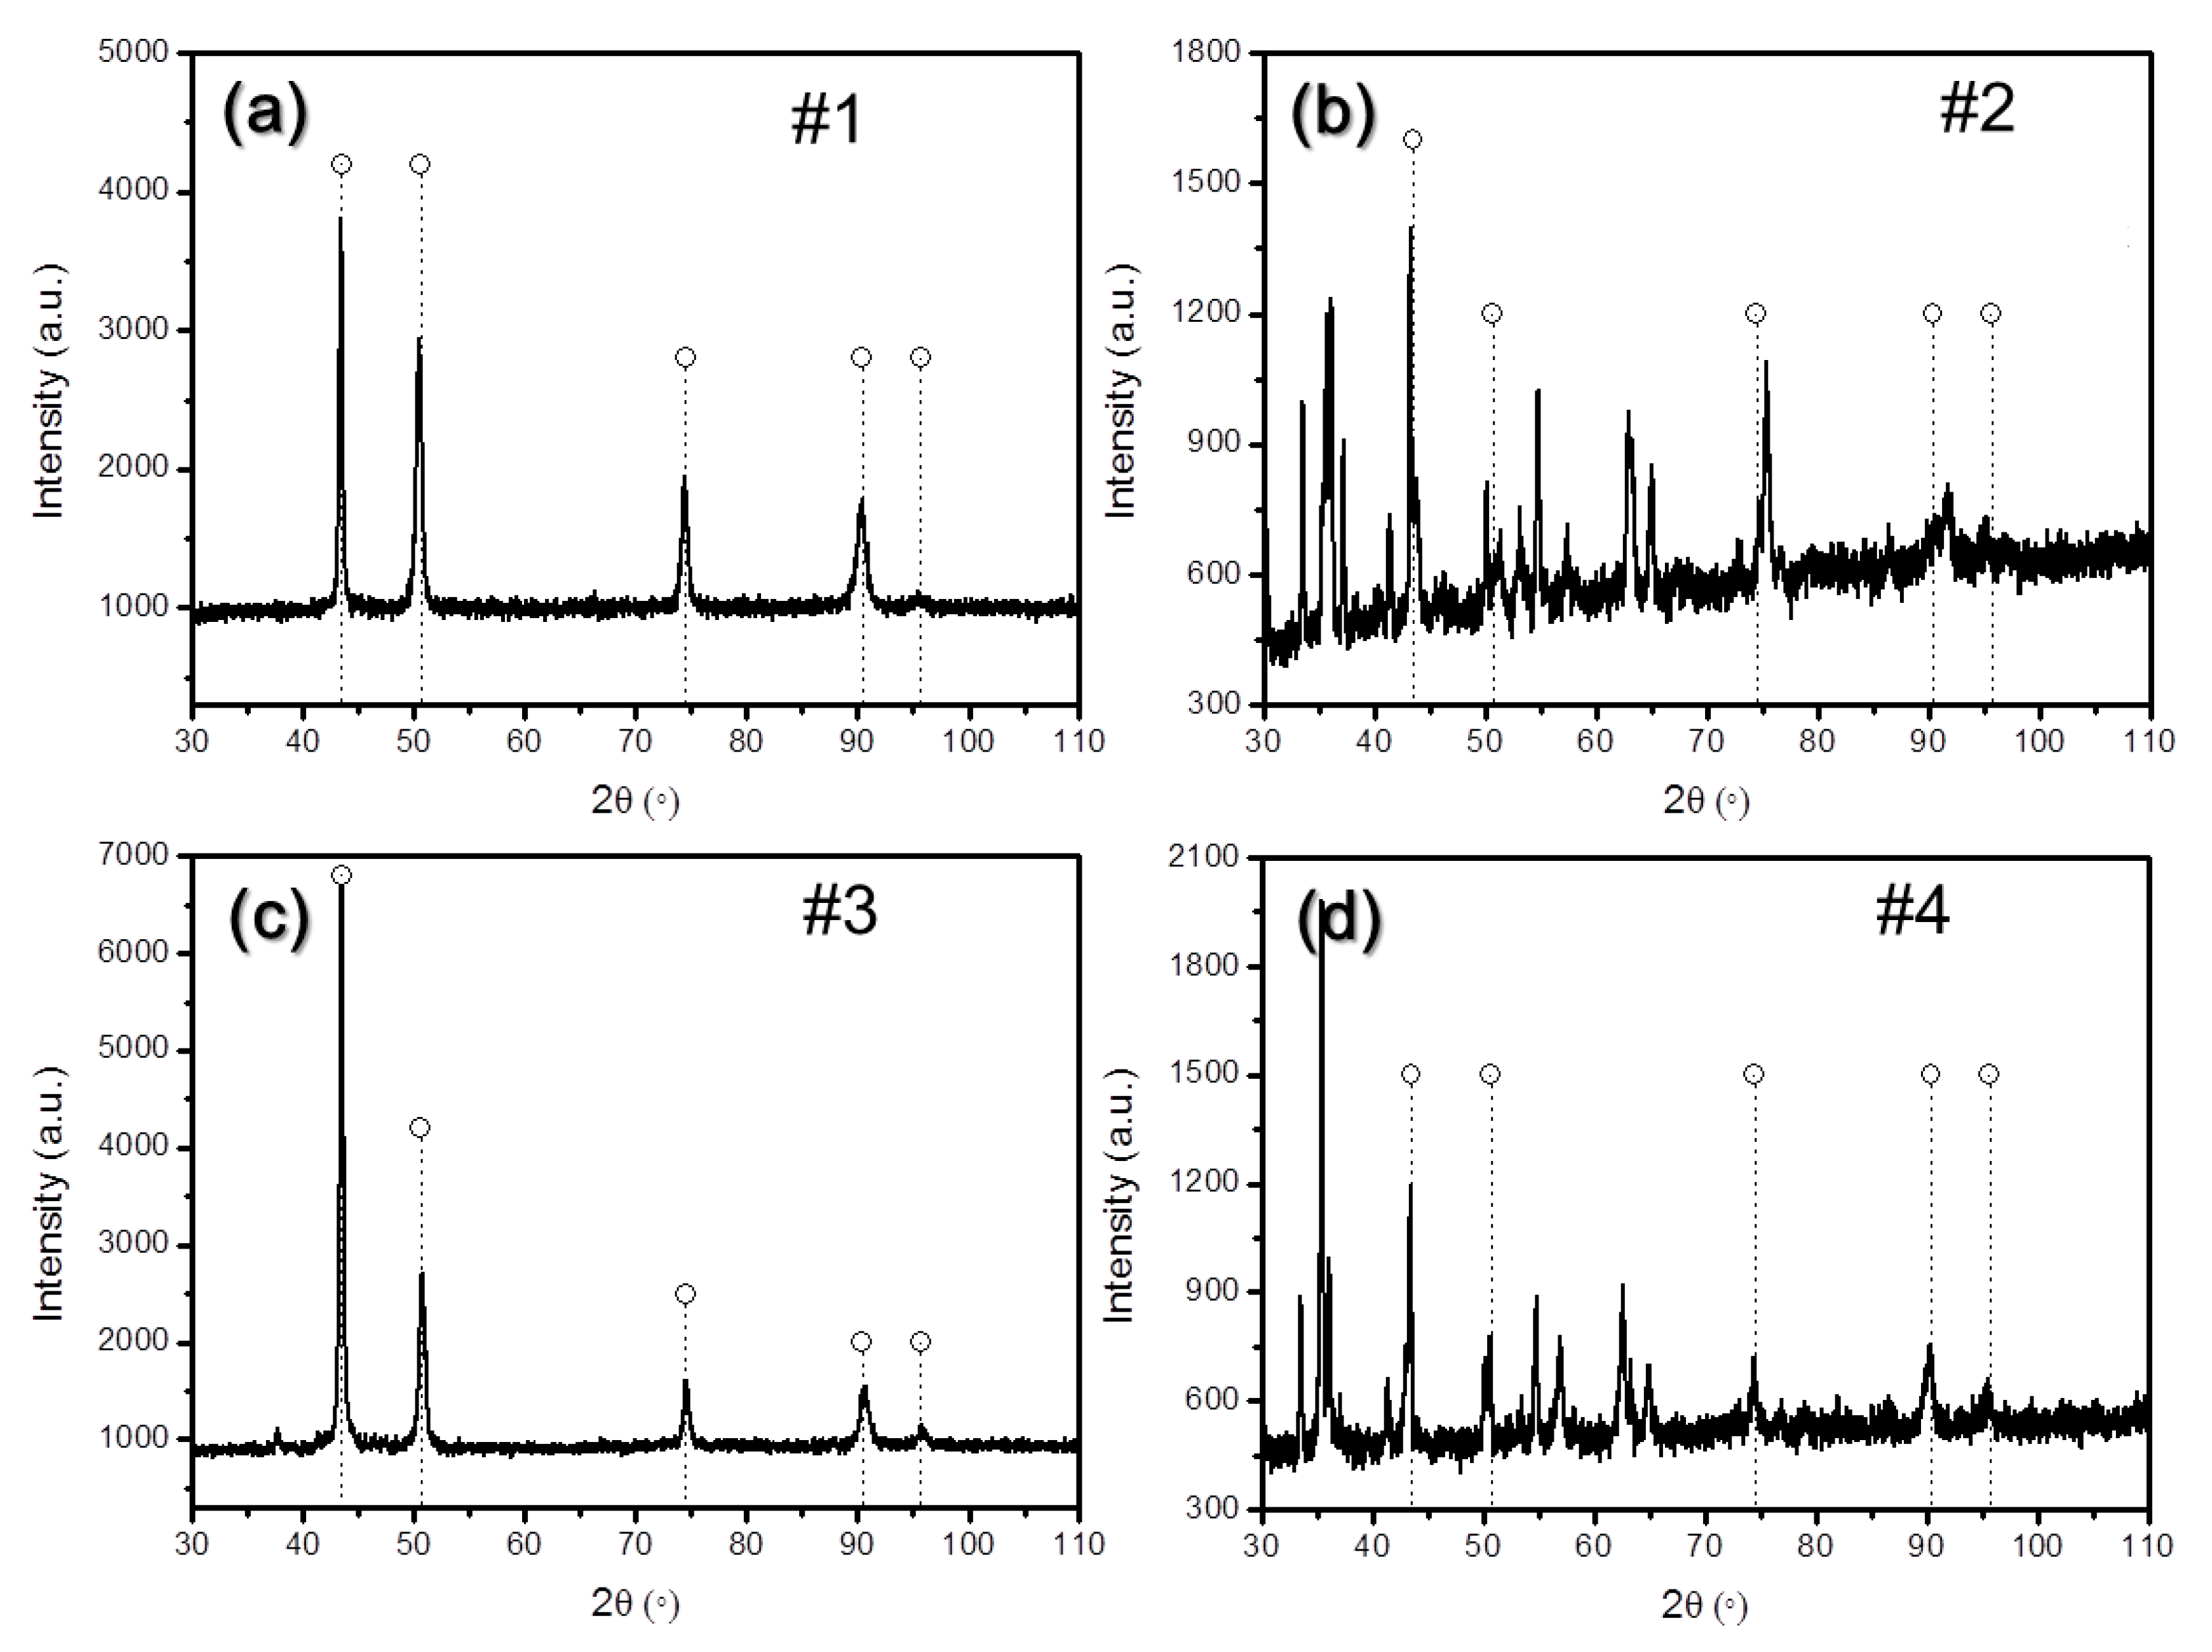
Figure 7 presents the XRD analysis of the surfaces of the materials. Specimens #1 and #3 mainly exhibited an Ni matrix phase, while specimens #2 and #4 mainly exhibited an oxide phase sintered after high-temperature treatment. The signal peak positions of the matrix are marked in the figure. By comparing the maps of specimens #2 and #4, it can be seen that there were significant differences between the products of high-temperature oxidation in the two groups of samples. However, because the composition was very complex, the oxidized surface of the material was not a single oxidized product.
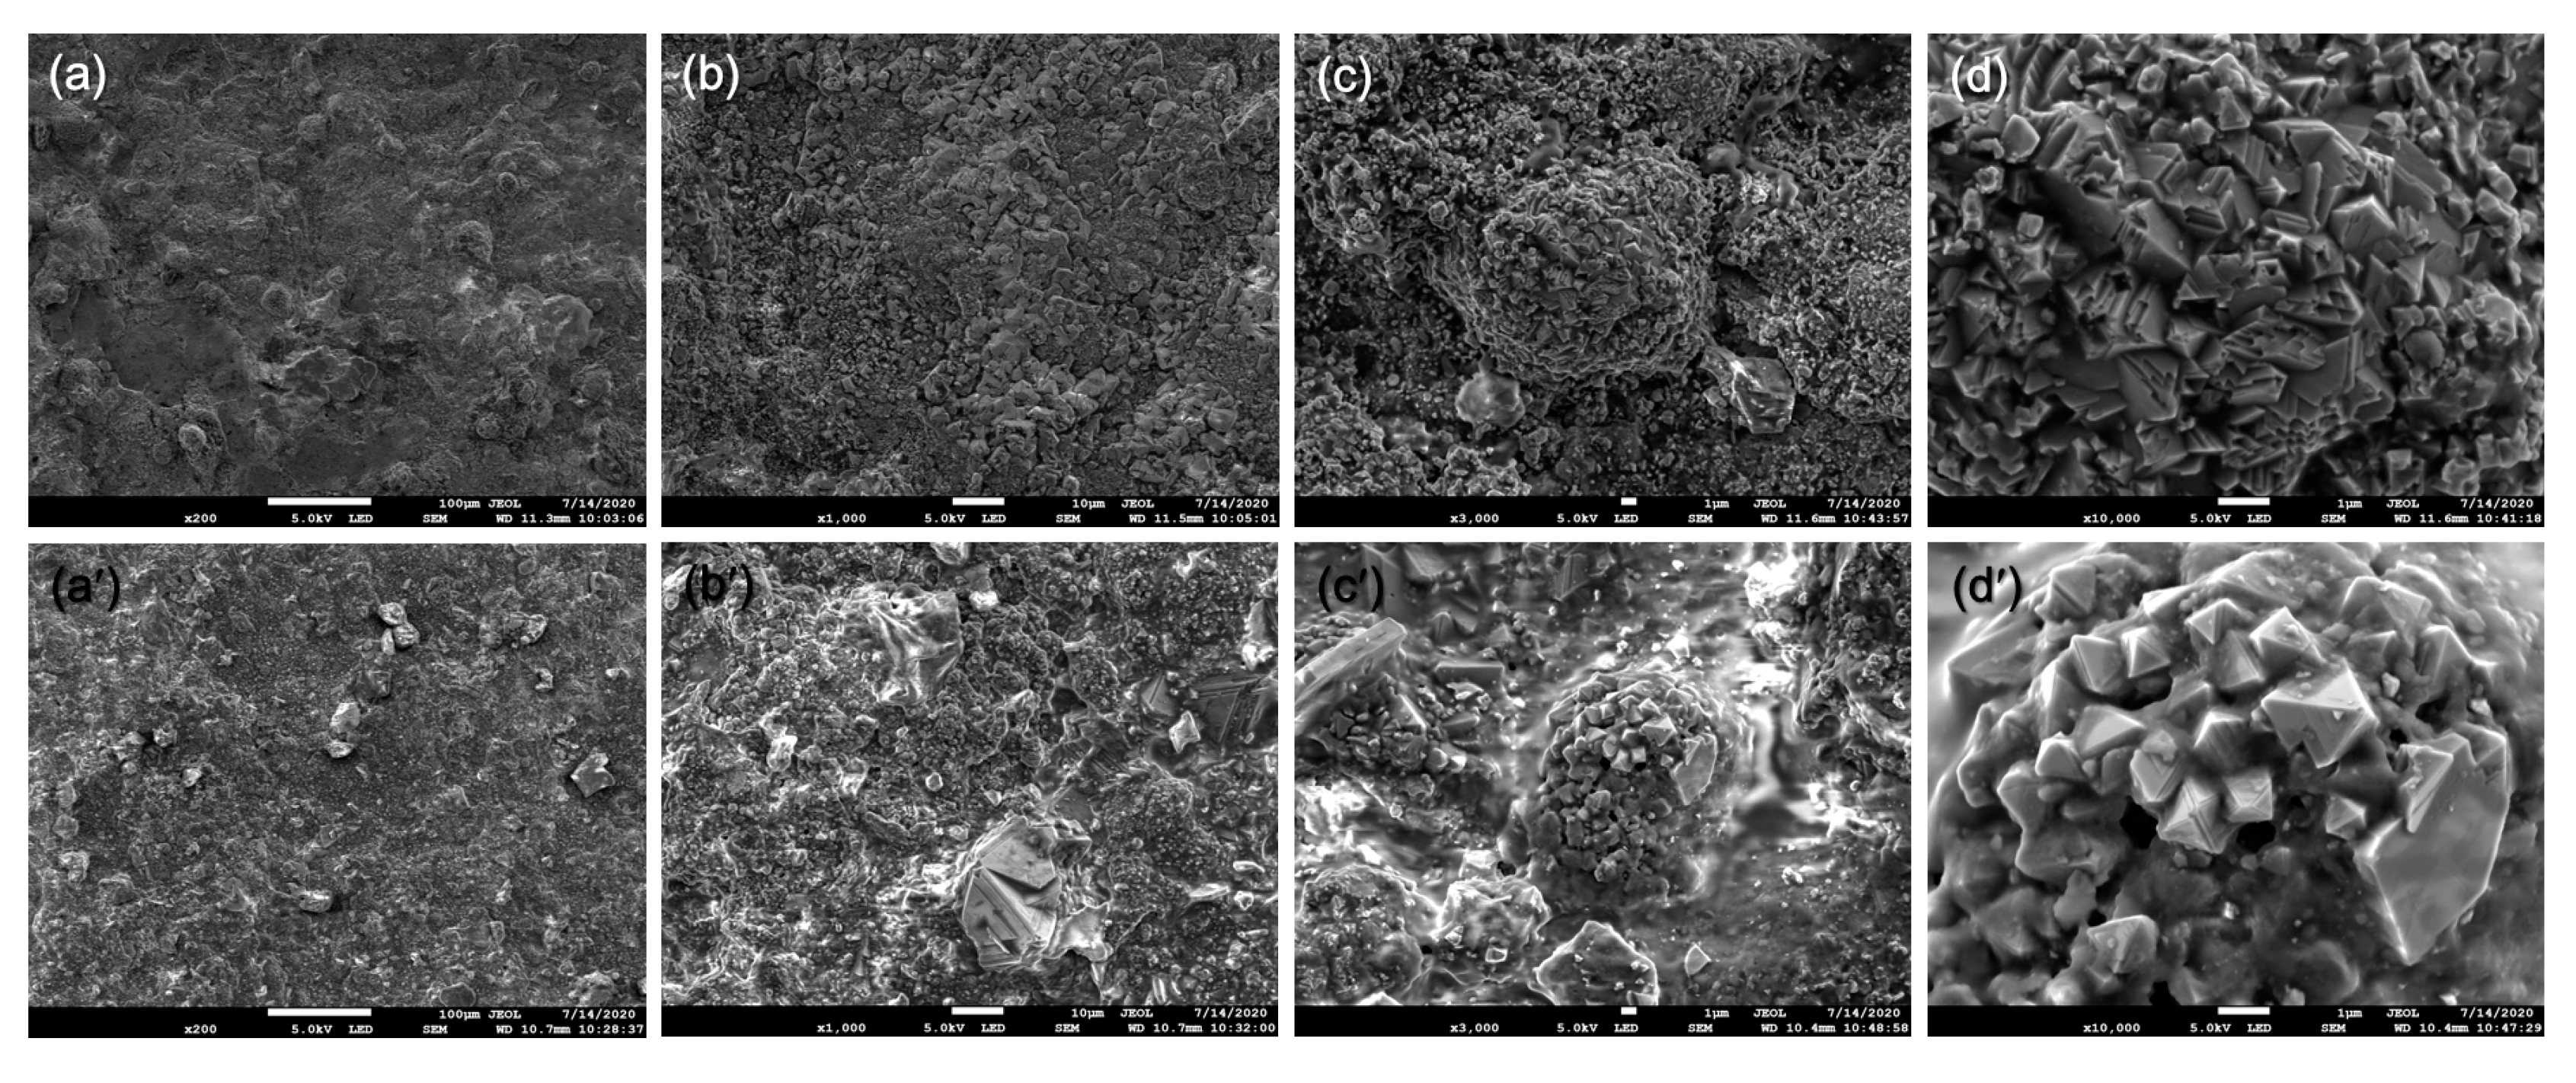
Figure 8 is SEM images to observe the surfaces of specimens #2 and #4, and the comparison of the surface morphologies of the material oxides reveals that the products on the surfaces of the two samples were very continuous and dense. Crystallization of corrosion products were obviousd, and their roughness parameter and surface texture analysis [
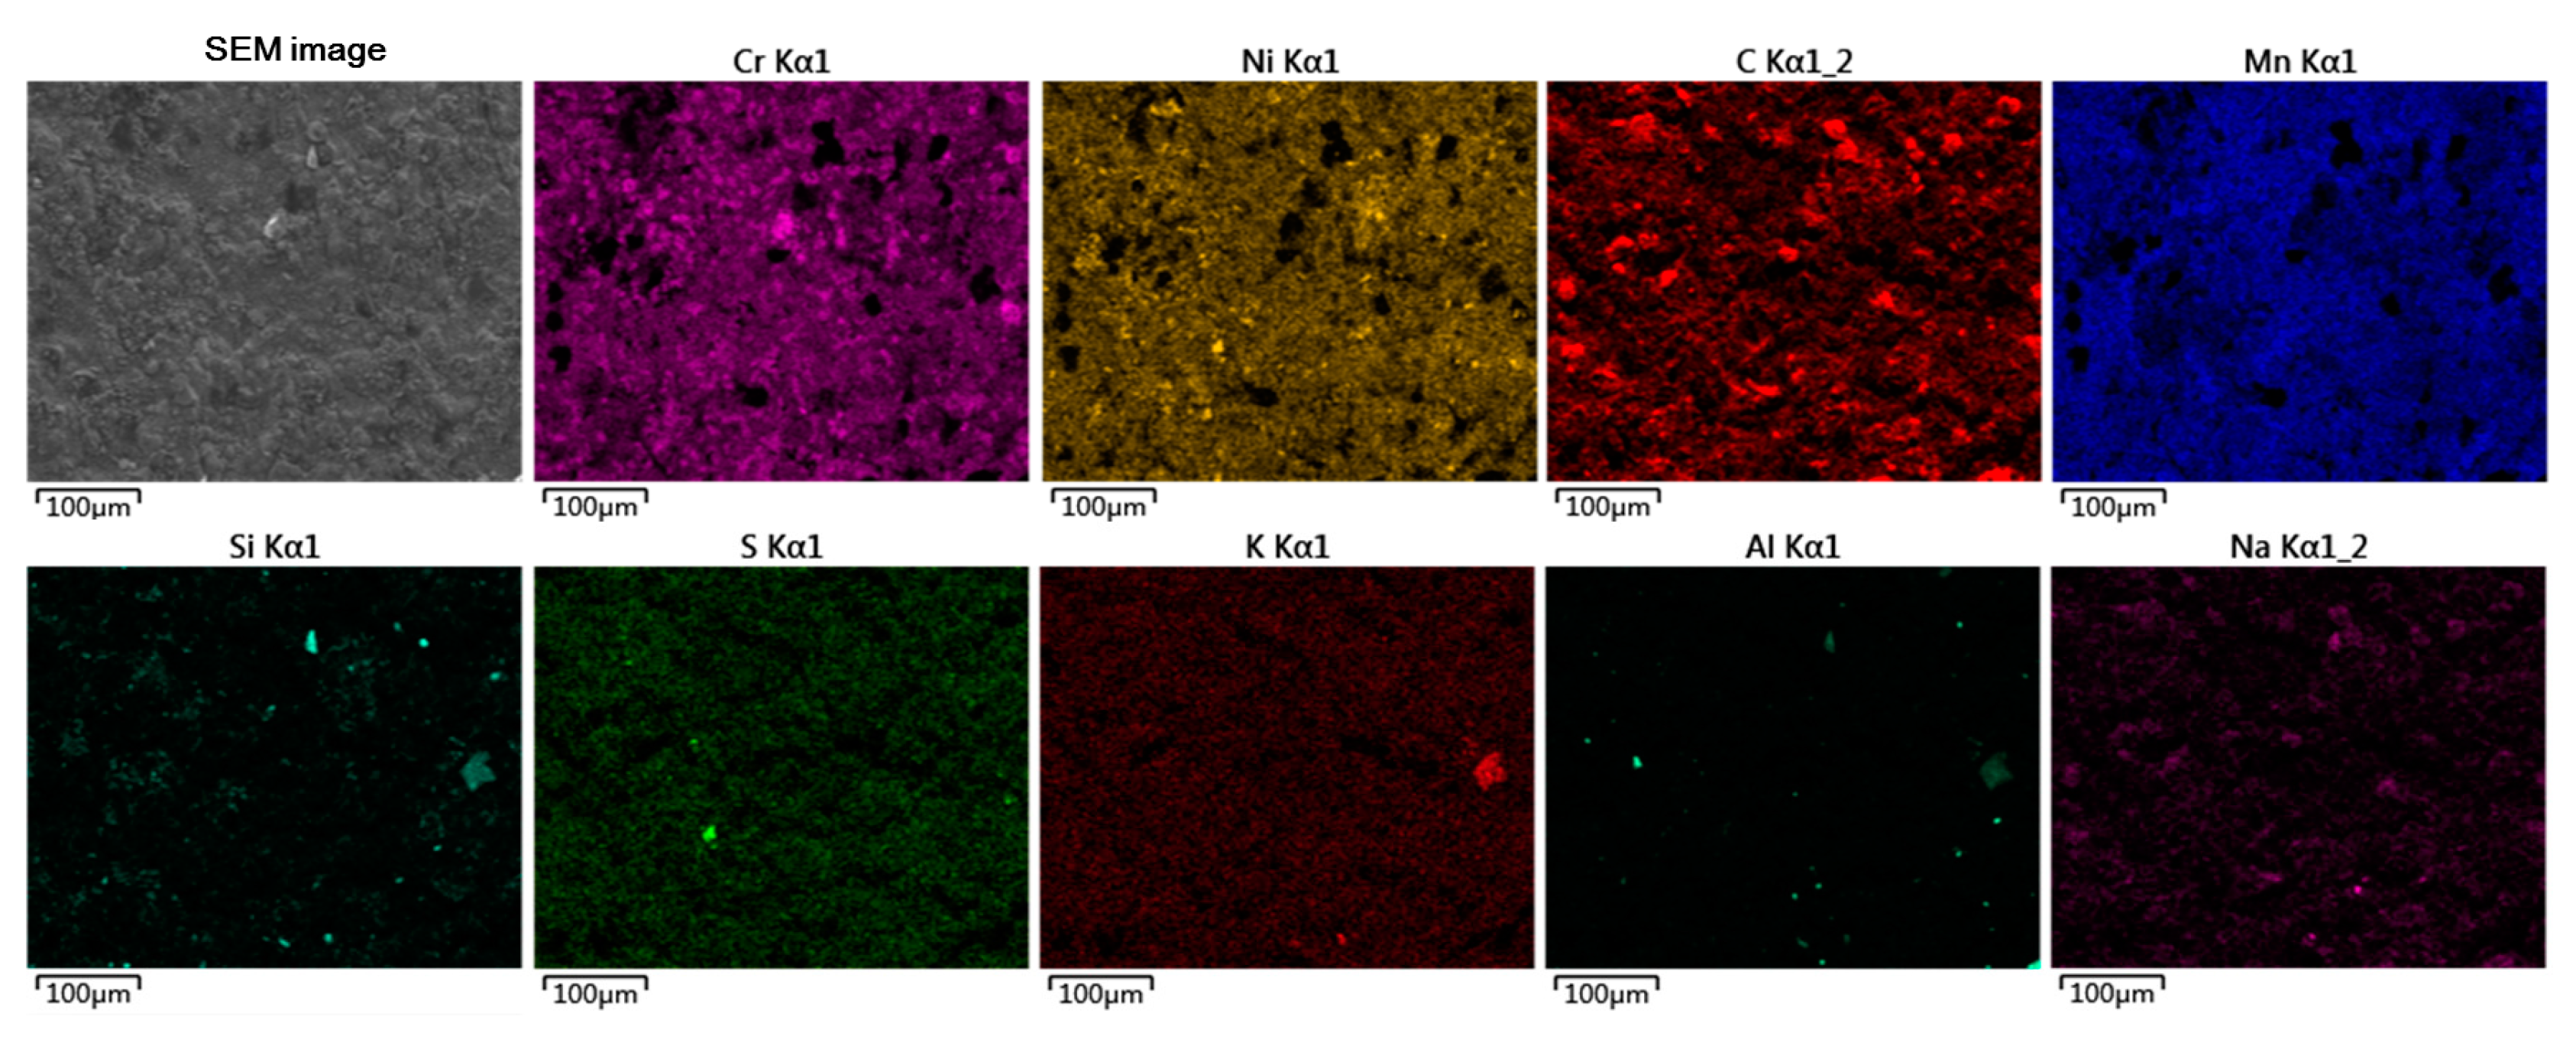
6] will be shown in future work. EDS surface scanning revealed continuously distributed Cr and Nb oxides on the substrate surface (see
Figure 9). Particle enrichment was obvious in specimen #3, and EDS surface scanning proved that the enrichment was mainly of Cr and C, as well as some granular impurities (see
Figure 10). In the research by Ye [
7], the influence of Nb on the oxidation behavior of a novel Ni-based superalloy at 1000 °C was investigated in detail. Even though the alloy with 2 wt.% Nb (2Nb) exhibited significantly higher weight gain than the alloy without Nb (0Nb), the oxide scale of 2Nb was more continuous and compact. In contrast, 0 Nb underwent severe vaporization and spallation in the oxide scale. Nb was found to accelerate the formation of compact TiO
2 on the Cr
2O
3 layer, leading to inhibited vaporization and spallation in the oxide scale. Nb was also found to accelerate the formation of a continuous Cr oxide layer, thereby enhancing the oxidation resistance via the inhibition of the interdiffusion of oxygen, nitrogen and metallic elements. However, in the present study, Cr, Nb and Mo oxides were obvious as the continuous oxide layer in specimen #2. Most of the elemental enrichment in specimen #4 was in the form of particles. Therefore, the samples with low and high contents of Mo studied in this work exhibited different corrosion mechanisms.
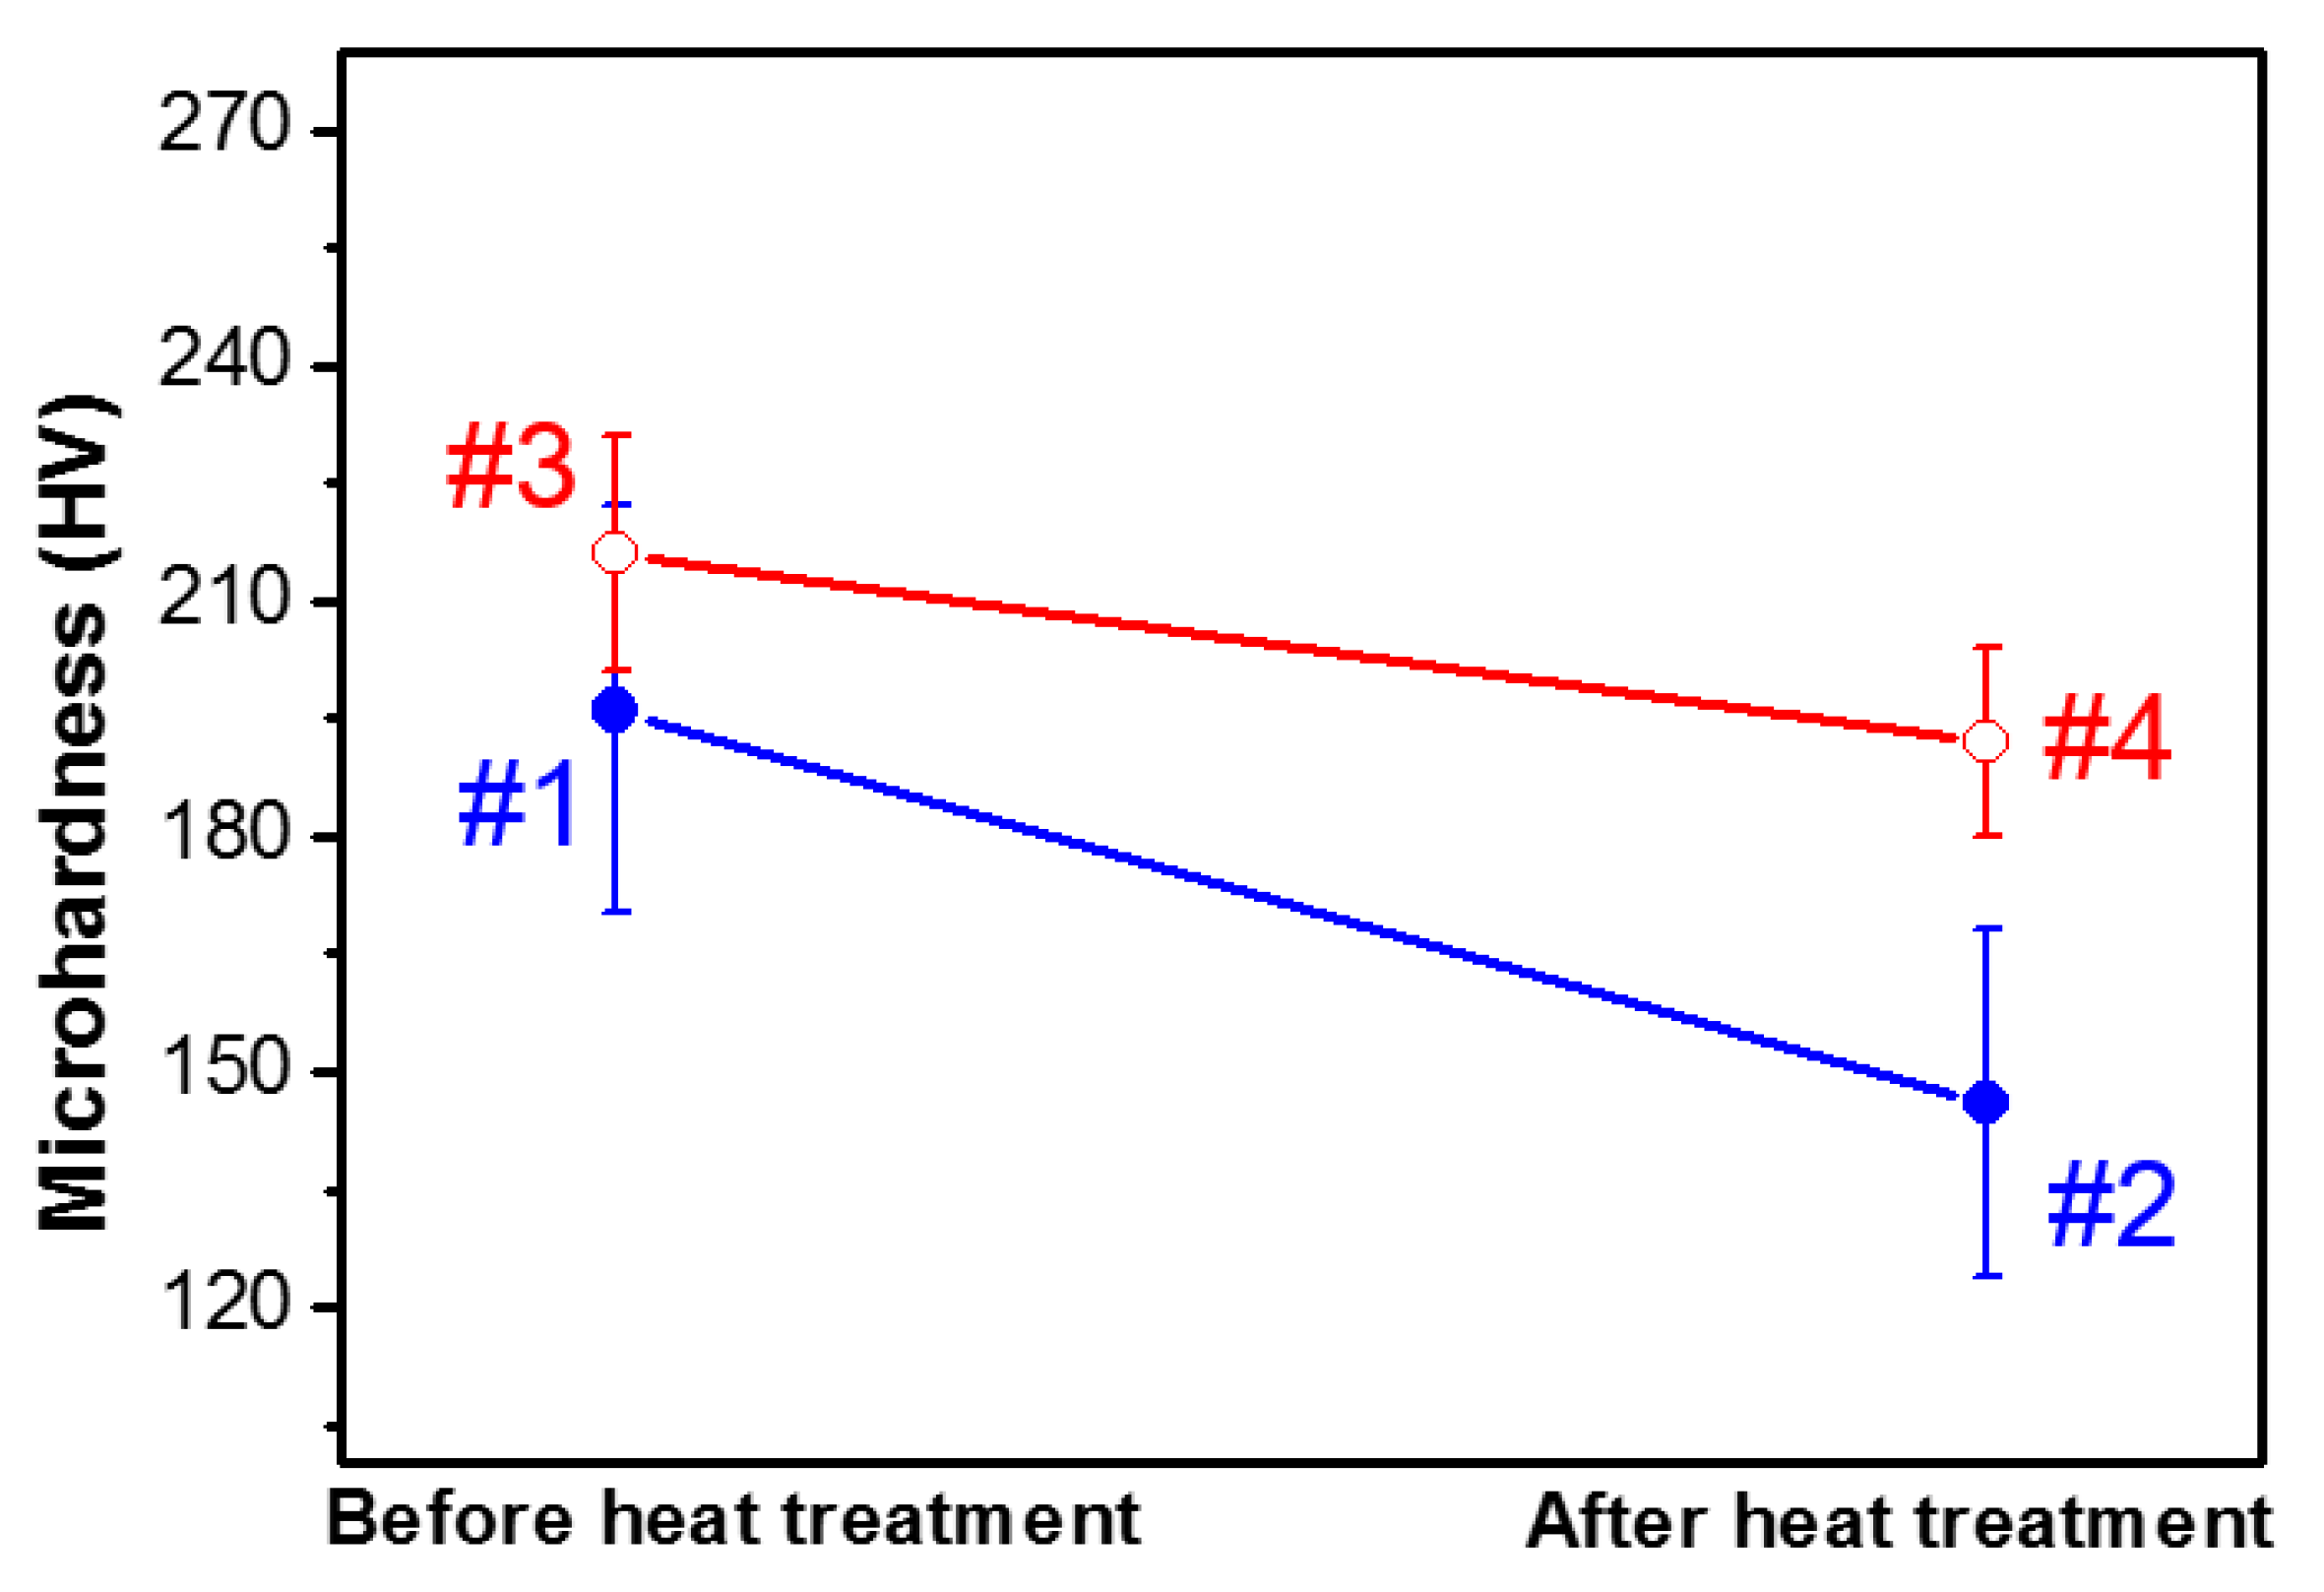
Figure 11 is the result of microhardness measurement. The microhardness test was performed with a load of 200 g and a loading time of 10 s, taken from matrix of each specimen. all tested specimens were metallographically polished and 5–8 points were selected to calculate the average value. It reveals that the hardness changed greatly from specimen #1 to specimen #2, and that the material properties decreased obviously. In contrast, from specimen #3 to specimen #4, the hardness remained relatively stable.
4. Discussion
The practical performances of polycrystalline materials are strongly affected by the formed microstructure inside, which is mostly dominated by grain growth behaviors. High temperatures will cause the growth of crystals, which many research institutes find undesirable [
8]. The general theory reveals that the switch from abnormal to normal grain growth is caused by GB roughening transition. The behaviors of grain growth dominate the formation of the microstructure inside polycrystalline materials and thus strongly influence their practical performances. However, grain growth behaviors still remain ambiguous. Hu et al. [
9] propose a new migration model of GB and further derive a mathematical expression to depict the general evolution of grain growth in the cellular structures. The expression incorporates the variables influencing growth rate (e.g., GB features, grain size and local grain size distribution) and thus reveals how the normal, abnormal and stagnant behaviors of grain growth occur in polycrystalline systems. In polycrystalline materials, grain growth occurs at elevated temperatures to reduce the total area of grain boundaries with high energy. The grain growth rate usually slows down with annealing time, making it hard to obtain grains larger than a millimeter in size [
10]. Lee et al. [
11] discussed an abnormal grain growth and GB faceting in a model Ni-base superalloy, when heat-treated in a solid solution temperature range above the solvus temperature (1150 °C) of the γ′ phase. Kim et al. [
12] simulated the GB kinetics in terms of GB segregation of solute atoms for an isolated grain embedded in a matrix and demonstrated that the phase-field simulation could describe the GB movement under conditions of GB segregation in a quantitatively correct way, then they modeled grain growth in association with GB segregation in two-dimensional polycrystalline systems, and clarified that similarity between the Cottrell effect and the solute drag effect holds even on the macroscopic scale, that is, abnormal grain growth (AGG) can be induced by the solute drag effect. This AGG can take place spontaneously in homogeneous systems without any texture, anisotropy of GB mobility and/or energy, pinning particles and grain size advantage.
Superalloy has the fact that its structural changes depend on melting process, alloying elements, working temperatures and attended times. In this study, the main works is characteristic of grain size and Mo concentration after heat treatment. The structures and properties of various materials were compared, and the crystal in specimen #1 (with a higher Mo content) was very stable, which can maintain good hardness and a long service life. Therefore, theoretical analysis of grain growth is referred to the previous researches, the following conclusions are put forward:
- (1)
Positioning gaps or obstructions around the crystals is a very effective approach to hinder crystal growth;
- (2)
Mo and Nb are beneficial and precipitate readily at grain boundaries;
- (3)
The addition of a high content of Mo (~16 wt.%) is an effective method for restraining the high-temperature grain growth of Ni-based alloys.
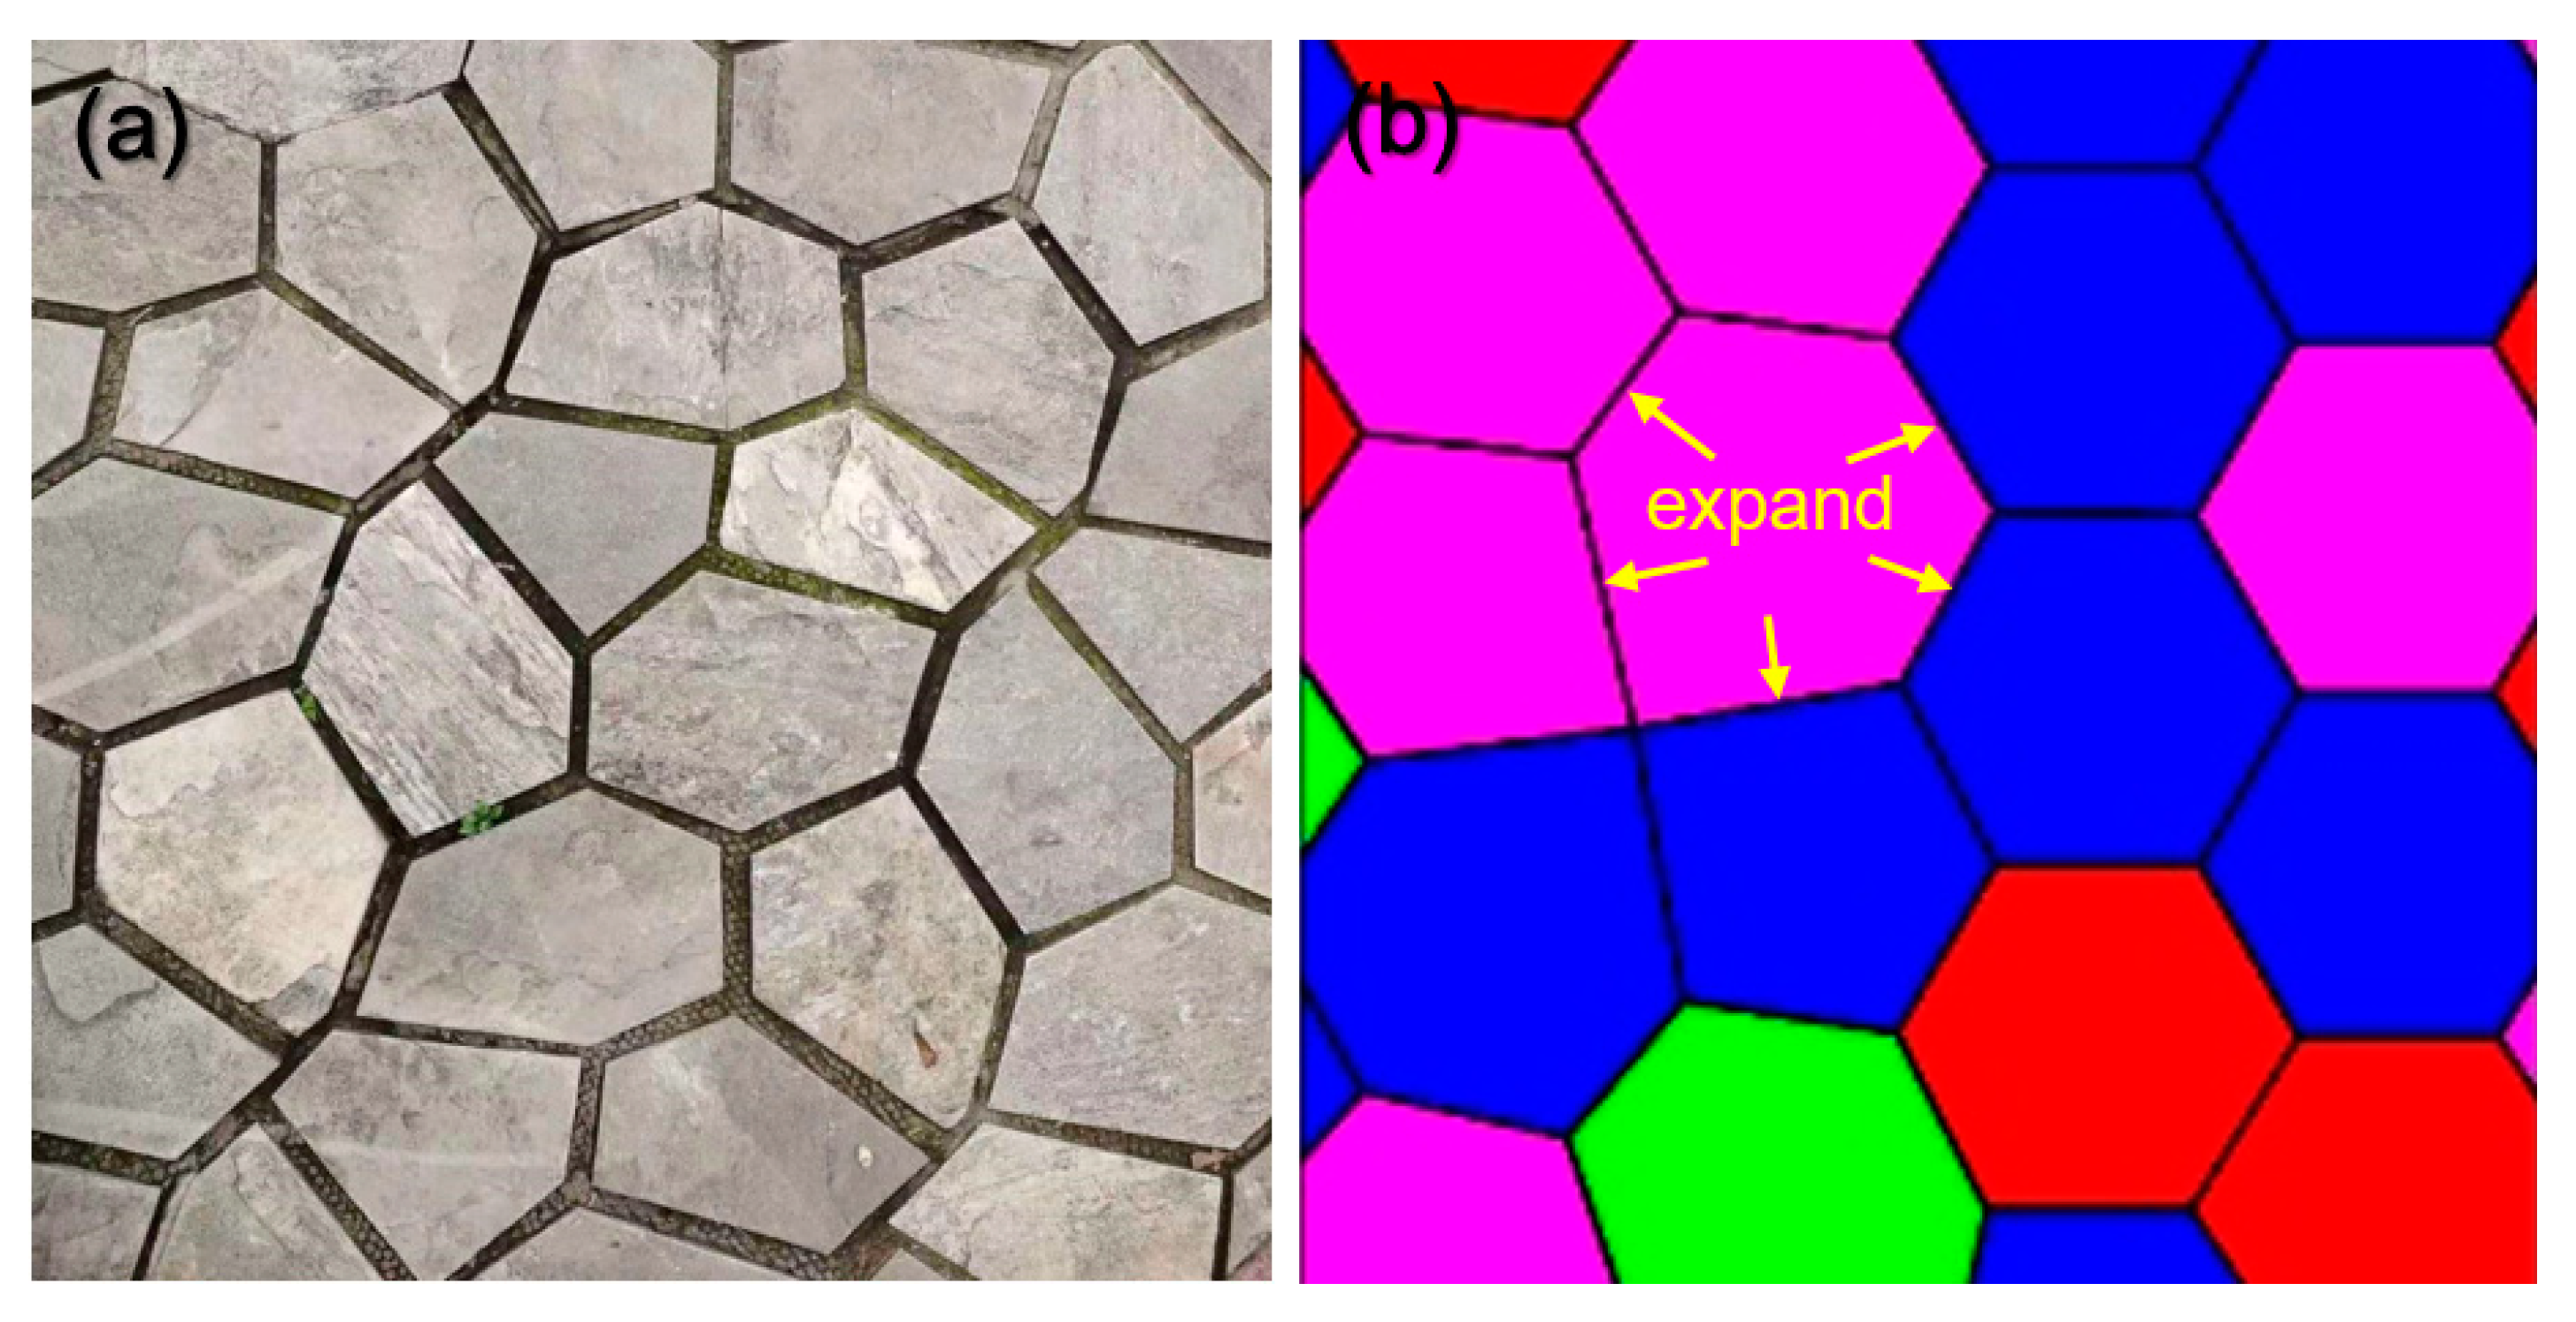
Crystals have shapes similar to those found in daily life, such as the stone floor tiles depicted in
Figure 12a. While crystals have a tendency to grow at high temperatures, crystal growth is hindered by the constraints of the GB, as shown in
Figure 12b. Therefore, the addition of elements such as Mo and Nb plays an important role in controlling the grain size upon long-term heat treatment.


