1. Introduction
In recent years, the use of green roofs has increased, not only for aesthetic reasons but also to improve the environmental quality of the environment [
1]. Plants can reduce heat through the reflection of solar radiation and the generation of shade. They can also decrease heat through the evapotranspiration process, which reduces the temperature inside and outside buildings [
2]. In this way, green roofs are considered a modern and ecological technology to face climate change and the most common environmental problems in the urban environment [
3]. Green roofs represent the opportunity to expand the presence of vegetated surfaces by replacing conventional waterproofed surfaces, generating thermal insulation, improving the internal environment of buildings, and consequently causing a reduction in the energy consumption of such buildings [
4,
5].
Though green roofs have the benefits described above, their use in many countries is limited due to costs and environmental impacts of using non-renewable materials, as well as the lack of formal methods focused on their design, construction, and maintenance [
6]. A growing trend regarding the construction of green roof systems has been the use of recycled and reused materials in their drainage and substrate layers, which can generate environmental, technical, economic, and aesthetic benefits while also providing the possibility of incorporating waste into the construction production chain. Most of the existing works in the current literature regarding the use of recycled materials in green roofs have sought to evaluate their hydraulic performance (drainage capacity and water retention) and the response of vegetation growth compared to conventional green roof systems.
Table 1 summarizes the most relevant works concerning the use of recycled materials in green roofs. Recycled materials such as rubber, glass, and construction waste have been widely studied in the last decade, demonstrating that replacing conventional green roof materials is a feasible solution.
To contribute to these research efforts, the present study aimed to evaluate the performance of green roofs with drainage layers made out of recycled and reused materials for reducing the impact on virgin materials and assuring technical benefits such as temperature reduction, water retention, and the regulation of rainwater. In addition, this study analyzed the reduction of dead load compared to traditional green roofs, which is relevant in terms of building structures. The subsequent sections of this paper are organized as follows:
Section 2 summarizes the materials and methods employed to conduct the experimentation and to analyze the hydraulic and thermal performance of the proposed green roof systems. Results are presented in
Section 3, while
Section 4 and
Section 5 correspond to discussion and conclusions, respectively.
2. Materials and Methods
This section describes the materials used to build the green roof prototypes and the methodology for monitoring and measuring hydraulic and thermal performances. Measurement instruments, constructive characteristics of each green roof prototype, and the rain simulation system are described in detail as well. The dead loads of the green roof systems were determined as the approximate cost per square meter.
Based on the characteristics, amount, and local availability, four materials were selected to develop the drainage layer of green roof systems: (a) basalt gravel (typical material), (b) recycled rubber from tires, (c) recycled polyethylene (PET) bottles, and (d) recycled high density polyethylene (HDPE) trays. In this case, the basalt gravel was considered as a reference material, since it is commonly used as a typical drainage layer of green roofs. The other three materials are conventionally considered waste from other human activities.
2.1. Green Roof Materials
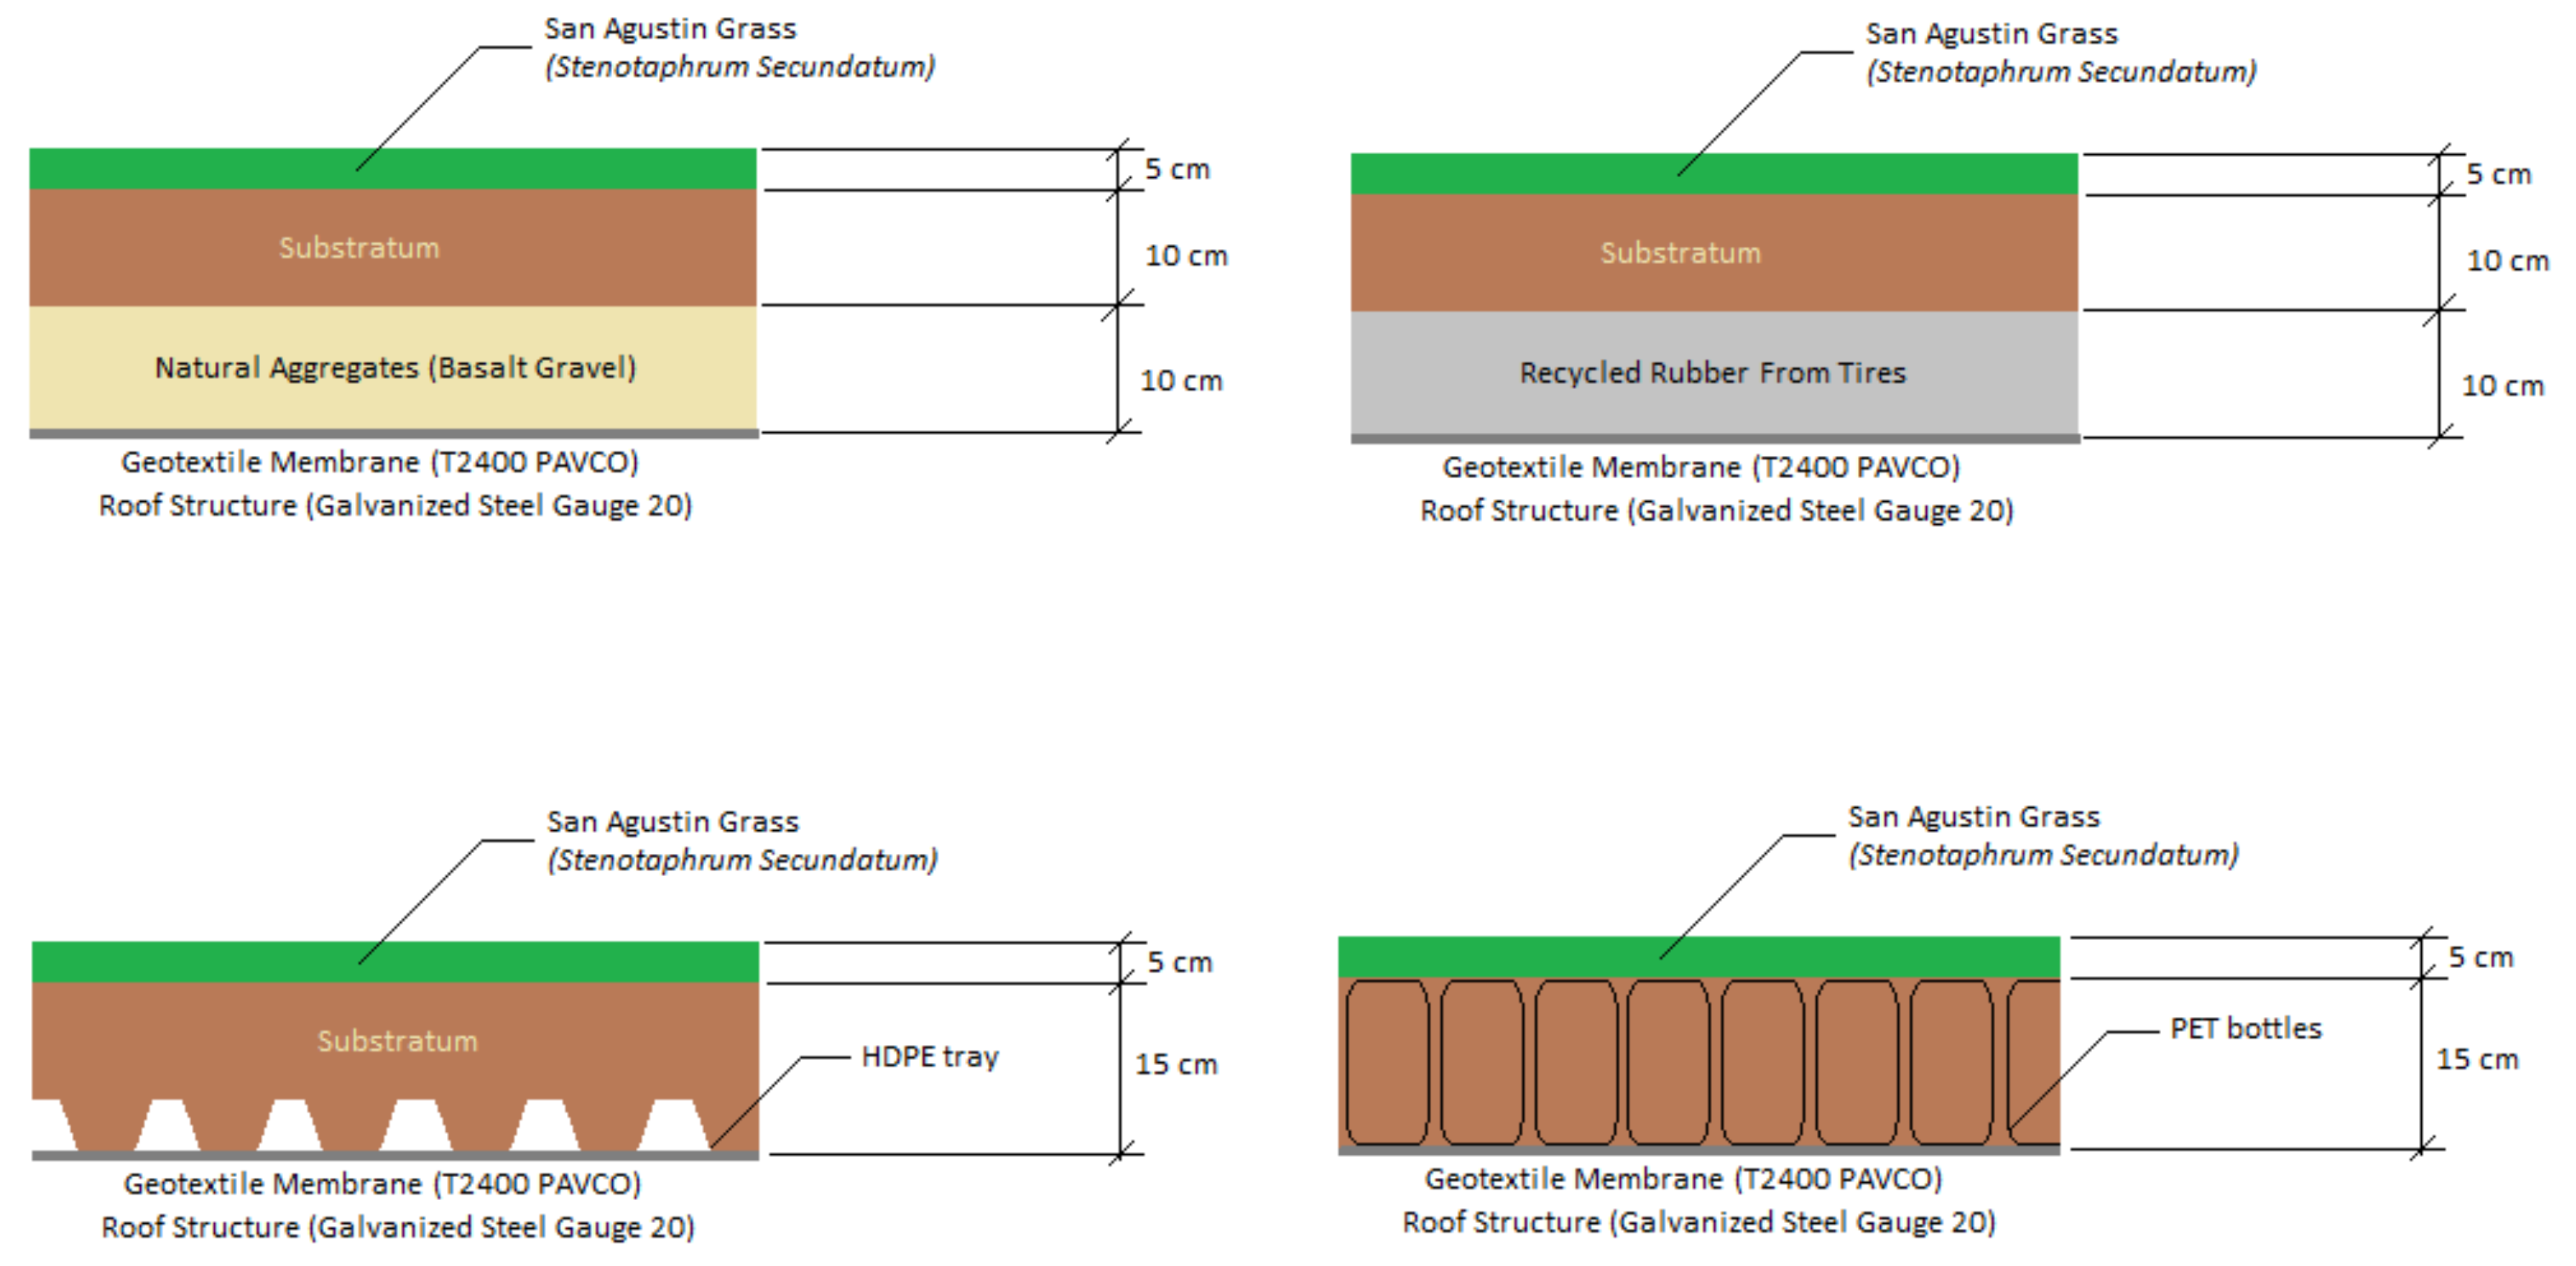
This study considered five layers to construct the roof prototypes: (i) the roof structure, (ii) the geotextile, (iii) the drainage layer (using materials aforementioned), (iv) the substratum layer, and (v) the vegetation layer.
Figure 1 describes the distribution of layers in the proposed green roof prototypes. Each layer is described as follows:
Roof structure: This consists of a box made of galvanized steel (gauge 20) and thermally isolated through polyethylene foam.
Geotextile membrane: This is a high resistance geotextile membrane. Reference T2400 PAVCO, manufactured by Mexichem®.
Drainage layer: This is designed to facilitate water drainage during and after rain conditions. In this study, four different drainage layers were analyzed: (a) basalt gravel, (b) recycled rubber from tires, (c) recycled PET bottles, and (d) recycled HDPE trays.
Substratum: This consists of organic and inorganic materials, with the former consisting of organic soil (70 v/v percent) and rice husks (30 v/v percent). In the case of PET bottles, the substratum was added into each cell (bottle section) as well as the vegetal layer.
Vegetal layer: This consists of a high resistance grass denominated Stenotaphrum Secundatum, also named San Agustín grass. This vegetation provides resistance to high temperatures and human traffic.
A detailed description of each one of the selected materials for the drain layer is summarized in
Table 2, including details of appearance, shape, and typical composition.
2.2. Green Roofing Prototypes
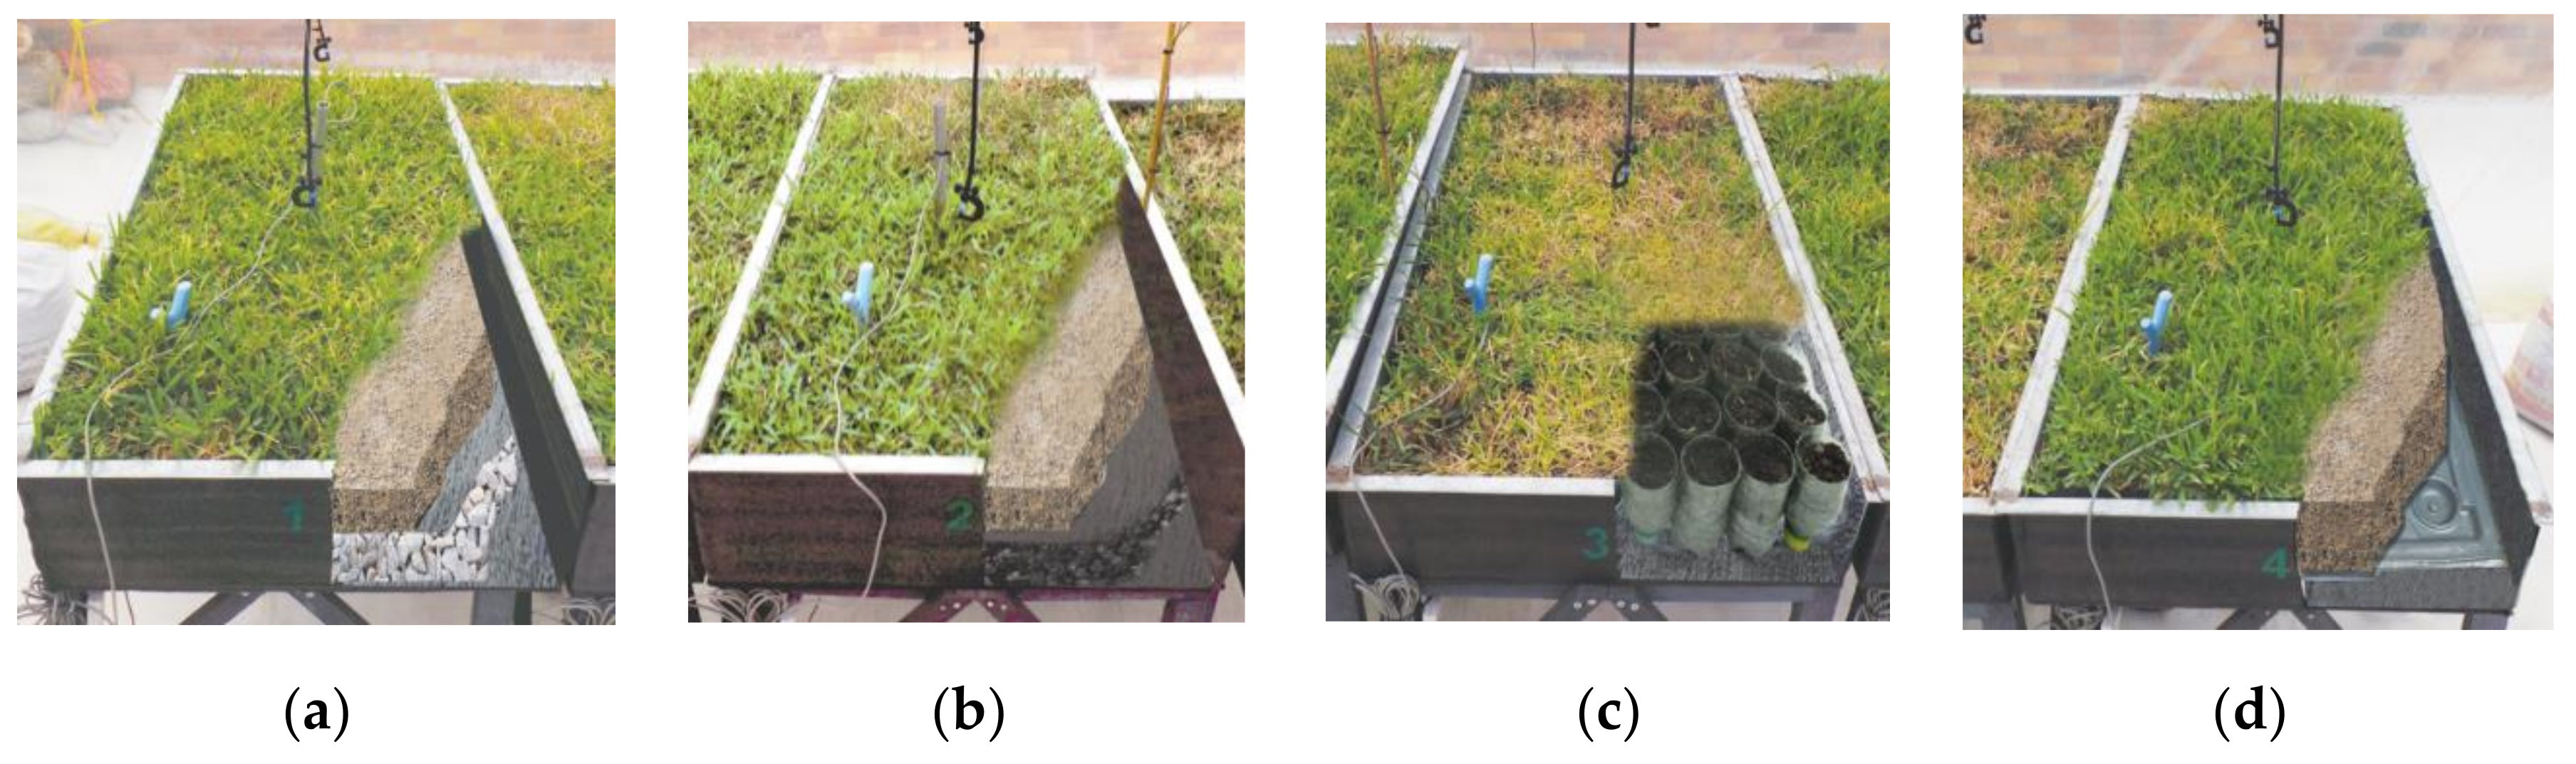
Figure 2 shows the full prototype and the cross-section of the four proposed roof systems. The dimensions of the four roof structures were 1.20 m × 0.60 m (W × D). Height varied according to the type of roof, using 0.15 and 0.20 m for drainage with recycled PET bottles and HDPE trays and for basalt gravel and recycled rubber, respectively. Inside the roof structure, a drainage point was installed using a ½” galvanized pipe towards the center of the structure using a 2% slope.
2.3. Rain Simulator Installation
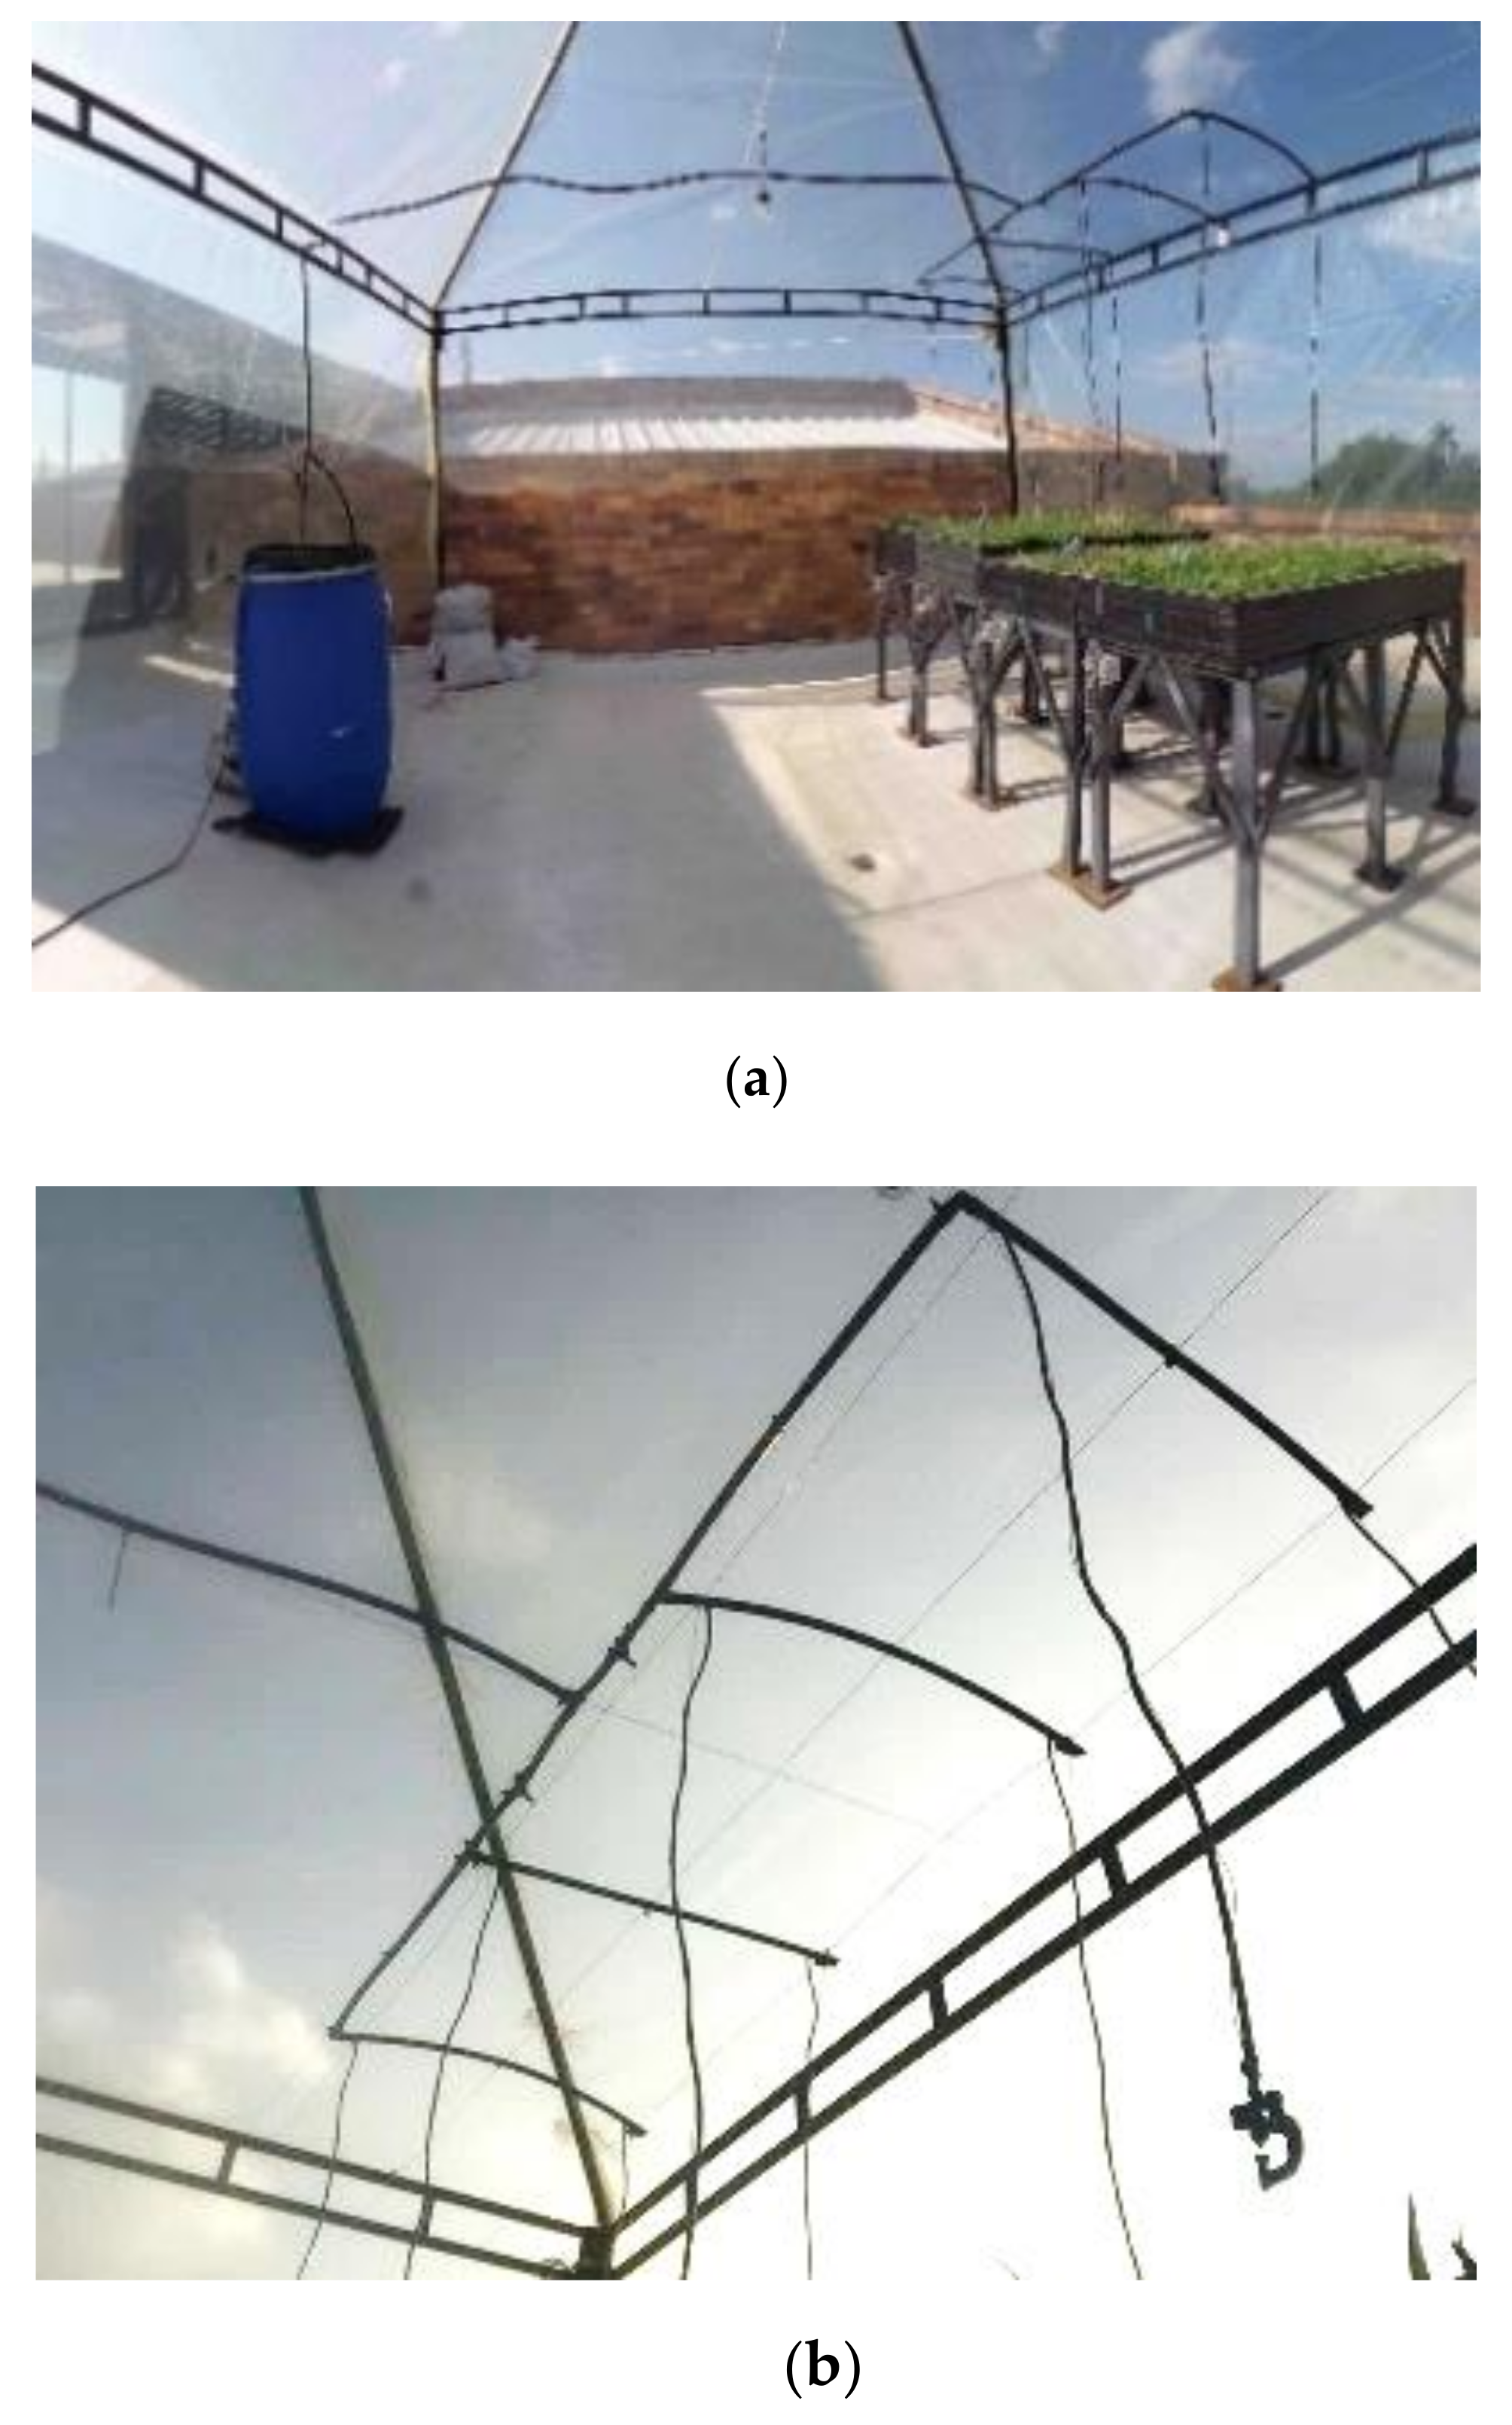
The rain simulator system was designed to provide controlled and homogeneous drip irrigation under the effective area of the roof prototypes, guaranteeing water flow and the optimization of water consumption.
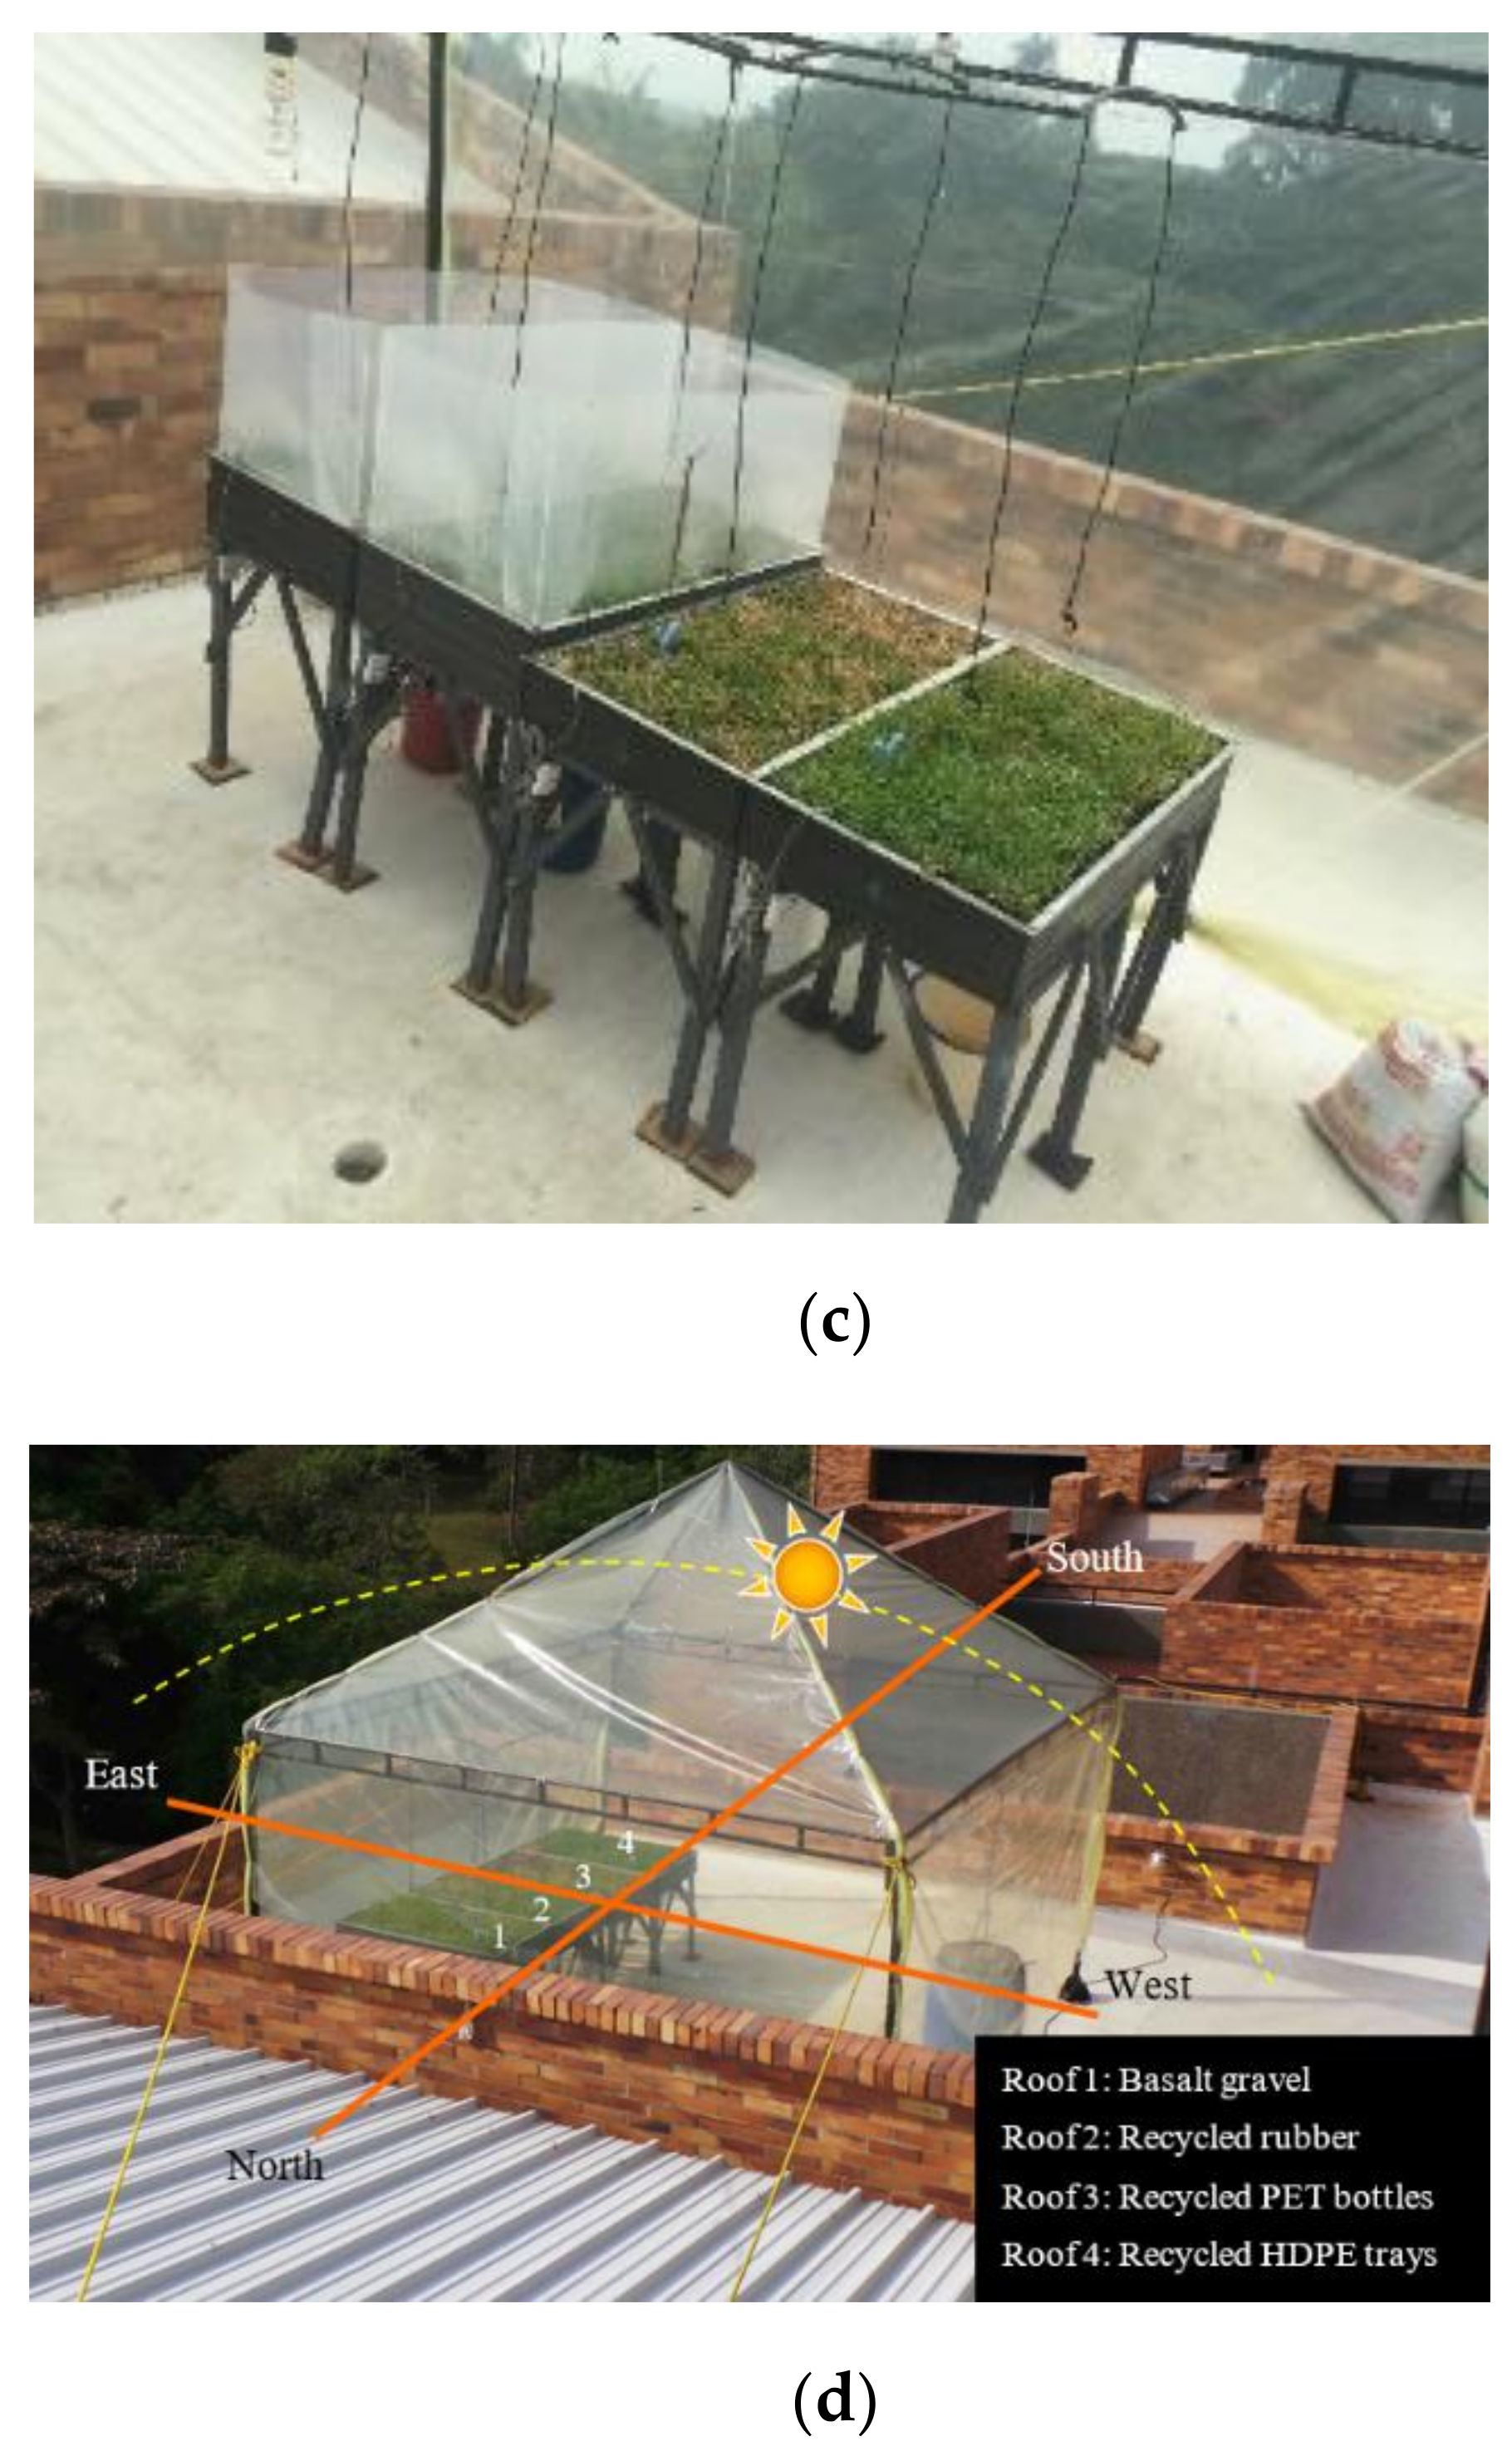
Figure 3 shows the rain simulation full assembly. Water retainers were installed on the roof prototypes to avoid water losses and to provide a better approximation of natural precipitation conditions.
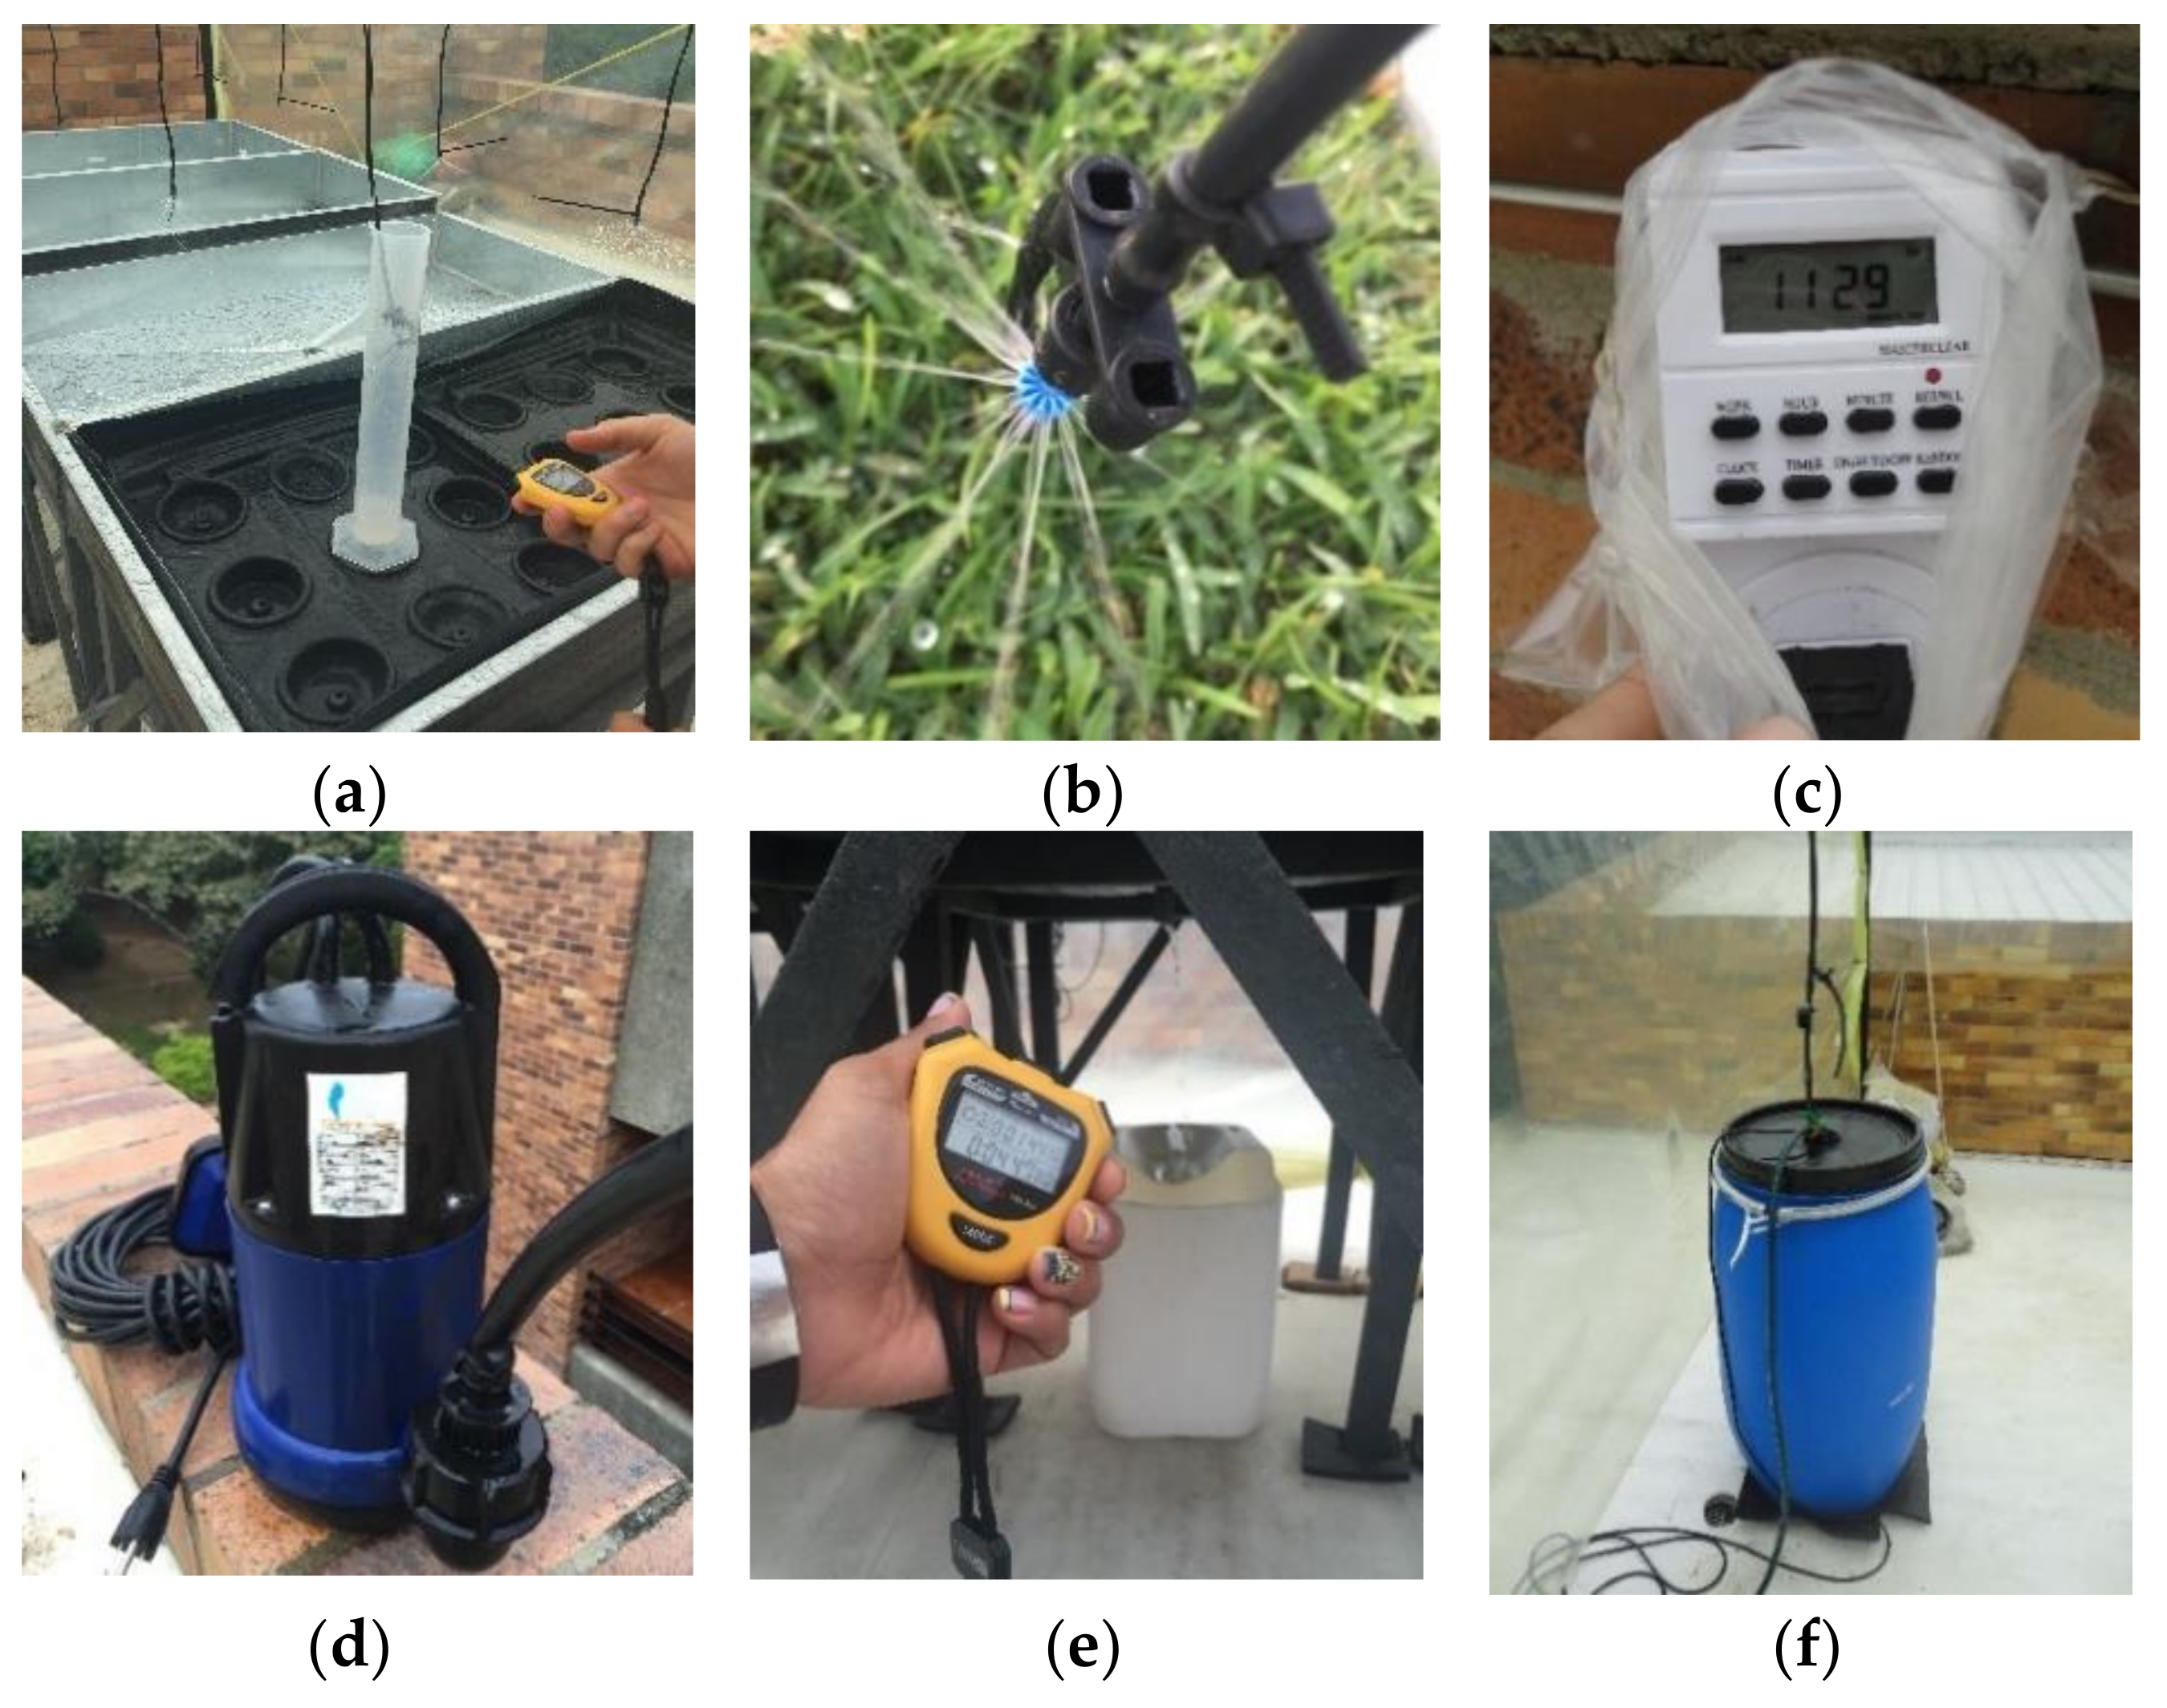
Figure 4 summarizes the instruments and materials used to calibrate the rain simulation system.
The rain simulator was calibrated using a pluviometer and by running several preliminary tests to verify the proper functionality of the system. According to the preliminary tests, it was possible to identify that the outer roof prototypes (1 and 4) received a flow rate of 0.58 L/m, while the inner roof prototypes (2 and 3) received a flow rate of 0.61 L/m. Due to restrictions of the experiment, each simulation was carried out on sets of two roofs, always in the same way, prototypes 1 and 2, and prototypes 3 and 4. Then, given the average flow rate per nozzle of 0.6 L/min, the total flow rate in two nozzles corresponded to 1.2 L/min. Based on these flows, it was found that 0.6 min was required to obtain 1 mm of precipitation on each roof. In this way, the time necessary to simulate each rain was calculated. Then, this value was multiplied by the number of millimeters.
Finally, the approximate cost for each prototype (USD per square meter) is summarized in the
Appendix A at the end of this manuscript. The cost was directly estimated from the materials employed in the green roof construction (labor not included).
2.4. Method
This subsection describes the definition of experimentation parameters, as well as the procedure followed to perform and monitor the rain simulation for each roof prototype.
2.4.1. Definition of Experimental Conditions
The conditions to simulate precipitations were established according to the geo-climatic characteristics (altitude, temperature, radiation, and geographic location) of Valle del Cauca, Colombia, more precisely in the city of Santiago de Cali. We used the official data record from the weather station of the Universidad del Valle—located at the latitude (3°22′39.66″), longitude (76°32′05.26″) coordinates of the WGS 84 system—because it is the closest station to the study area with official data [
15].
A review of rainfall records was necessary to define the quantity and characteristics of precipitations in the study zone. Data from 1966 to 2015 were considered to define the most relevant precipitation cycles or scenarios. Based on these, three main types of precipitation were considered.
Typical rainfall: This consists of a cycle of several consecutive days of rain, the intensity of which corresponds to the wet season of the periodic cycles presented in the geographical study area. The criteria used for the selection were:
- (a)
Minimum five days in a row of rainfall;
- (b)
Not having days without precipitation between the chosen days;
- (c)
The chosen cycle must start and end on a day without precipitation;
- (d)
Incremental trend;
- (e)
Rainy months of the city of Santiago de Cali (April, May, June, October, and November);
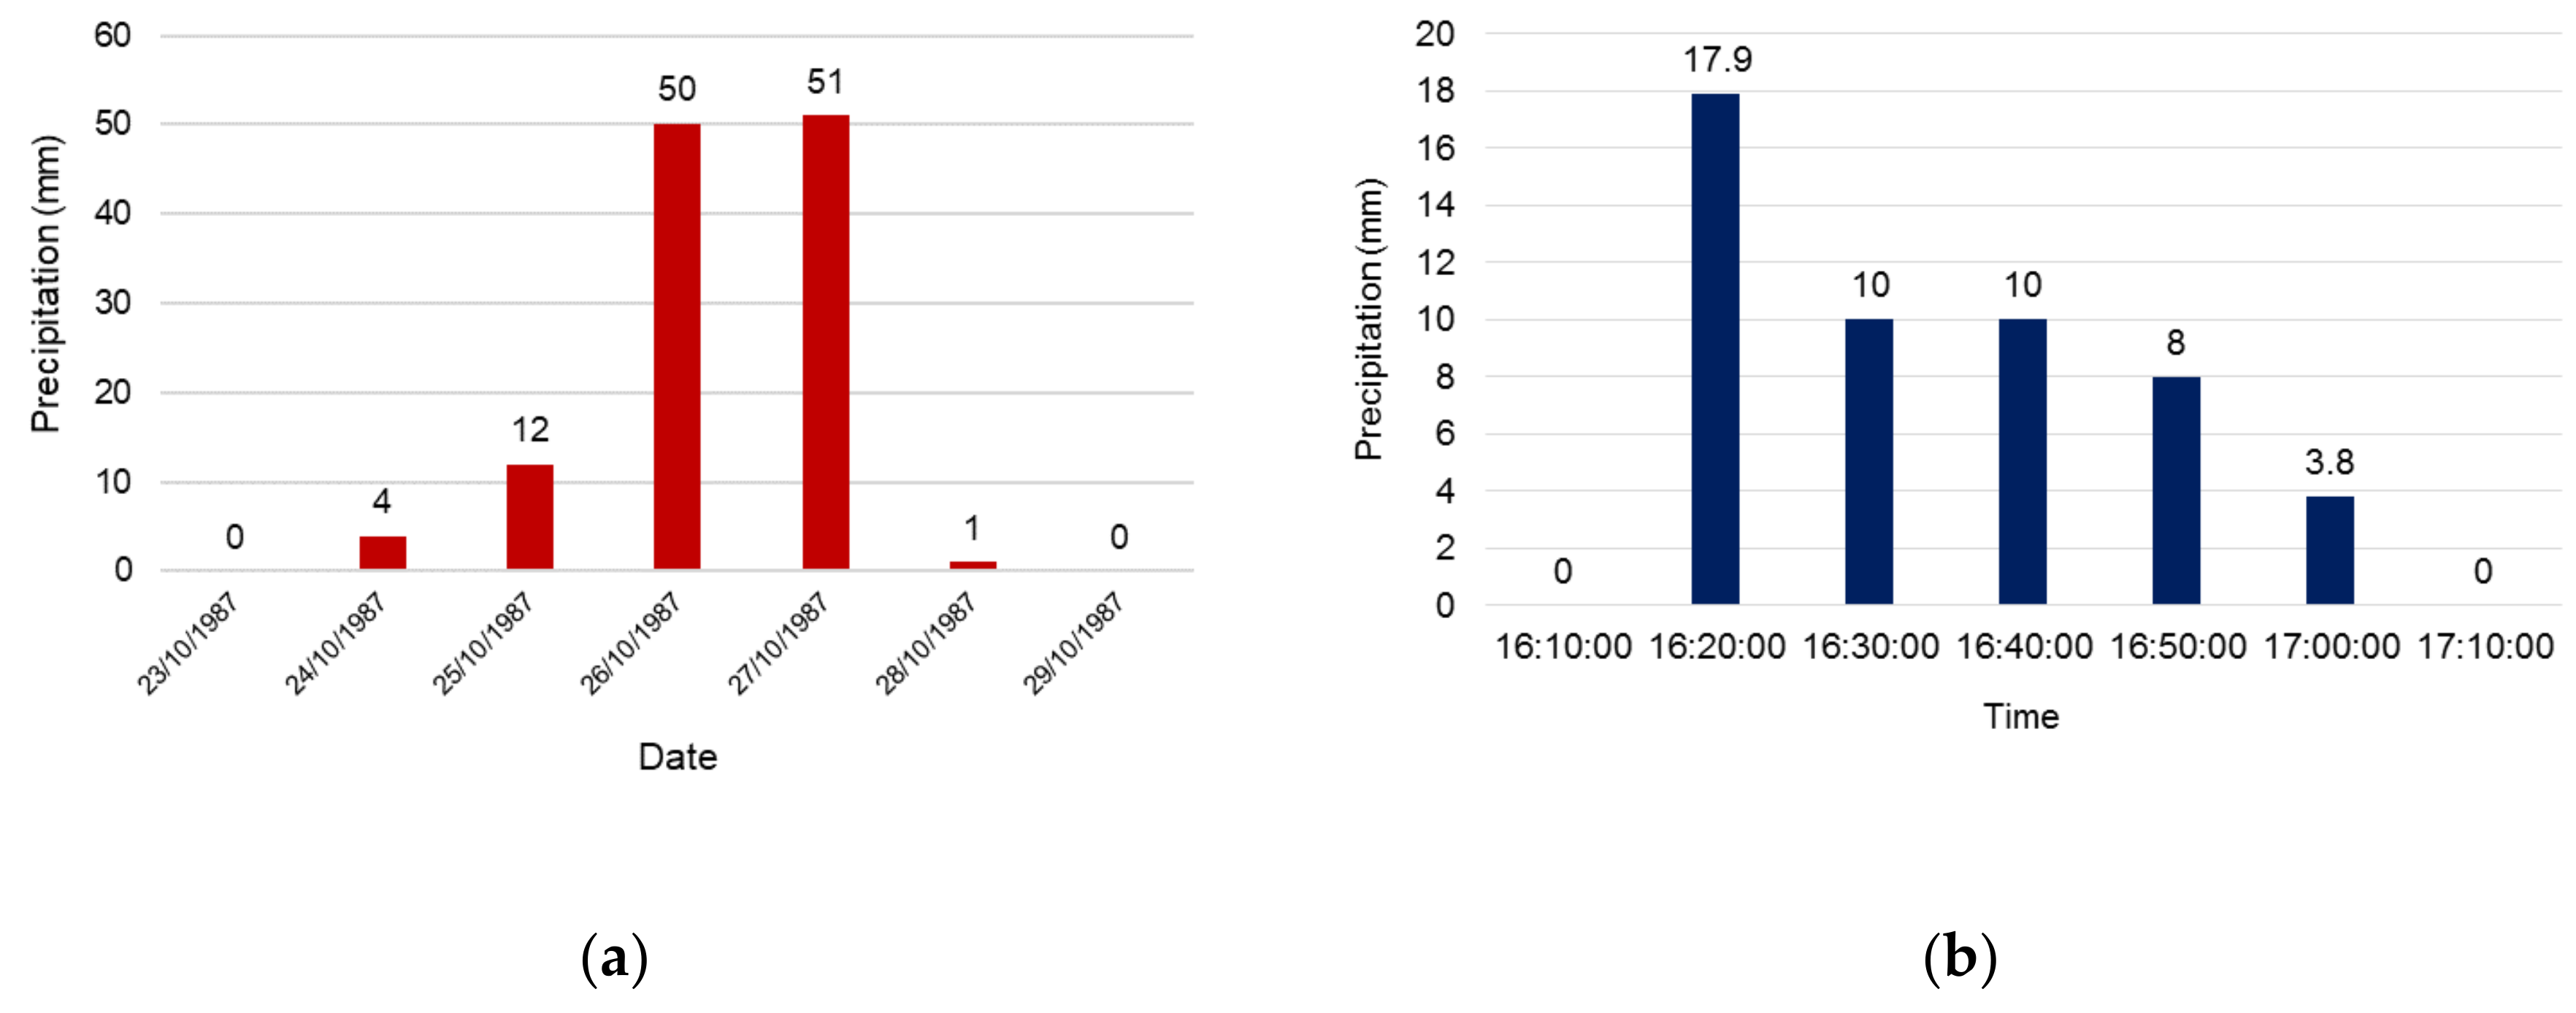
IFD (intensity–frequency–duration) curves were not considered in this rainfall scenario due to the fact that the capacity of the spray system per roof prototype was 1.2 L/min. Rainfall for the five days were simulated as follows: precipitation of 4 mm in a single period of 2.4 min (2 min and 24 s); 12 mm precipitations in two periods of 3.6 min (3 min and 36 s); 50 mm precipitation in three periods, the first two of 9 min (15 mm) and the last of 12 min (20 mm); 51 mm precipitation in three periods, the first two of 9 min (15 mm) and the last of 12.6 min (21 mm); and finally, 1 mm precipitation over 36 s. The time between each period was thirty minutes for each measurement, and the data employed to estimate typical conditions were taken from 23 to 29 October 1987 (See
Appendix A—
Figure A1a).
Intense rainfall: This was considered under the variables of intensity, frequency, and duration. It was selected the one with historical data higher than 30 mm/h that would have occurred in those atypical events and under the effects of La Niña phenomenon. It was also important as a requirement to have an IFD curve. The selected parameters were the total precipitation (49.70 mm) and a duration of 1 h (intensity: 49.7 mm/h).
Considering the need to simulate intense rain in the closest way to the IFD curve and taking into account the capacity and restriction of the irrigation system, this precipitation was simulated in four periods seeking to represent ten-minute intervals of distribution of the IFD curve. For this reason, the 17.9 mm precipitation that took a time of 10.74 min was joined with the second 10 mm precipitation, thus generating continuous precipitation of 16.74 min (16 min and 44 s). The second period corresponded to a 10 mm precipitation in a period of 6 min, the third to an 8 mm precipitation in 4.8 min (4 min and 48 s), and, finally, the fourth to a 3.8 mm precipitation in of 2.28 min (2 min and 16 s). Periods two, three, and four started every 10 min. Recorded data for intense rainfall conditions were taken from 2 June 1995 (see
Appendix A—
Figure A1b).
Saturation rainfall: This consisted of finding the number of precipitation millimeters required for simulating over the area of the roofs (average condition). In such a way, precipitation generated an effect close to the ground saturation. The way to find this was to drop the total capacity of the sprinkler system on the roof, taking a rain gauge as a measurement reference. Then, when the evacuation flow was similar in volume to the water entering to the system, the reference volume of the rain gauge was taken, giving a value of 10 mm over 6 min.
2.4.2. Rain Simulation
The rain simulations on the green roof prototypes were performed in three cycles that included the three types of rainfall chosen (typical, intense, and saturation). These considerations were included to obtain data with technical guidelines for the standardization and validation of the methods used and to guarantee the following aspects:
To get consistency between the independent results obtained with the same method, the same test material, the same conditions were used (same operator, same apparatus, and after short time intervals);
Measurement repeatability to provide very similar indications to each other for repeated applications and under the same measurement conditions;
To assure reproducibility of the experiment and the quality of the obtained data;
The cycles carried out in the experiment are described in
Table 3 below:
2.4.3. Monitoring of Performance Parameters
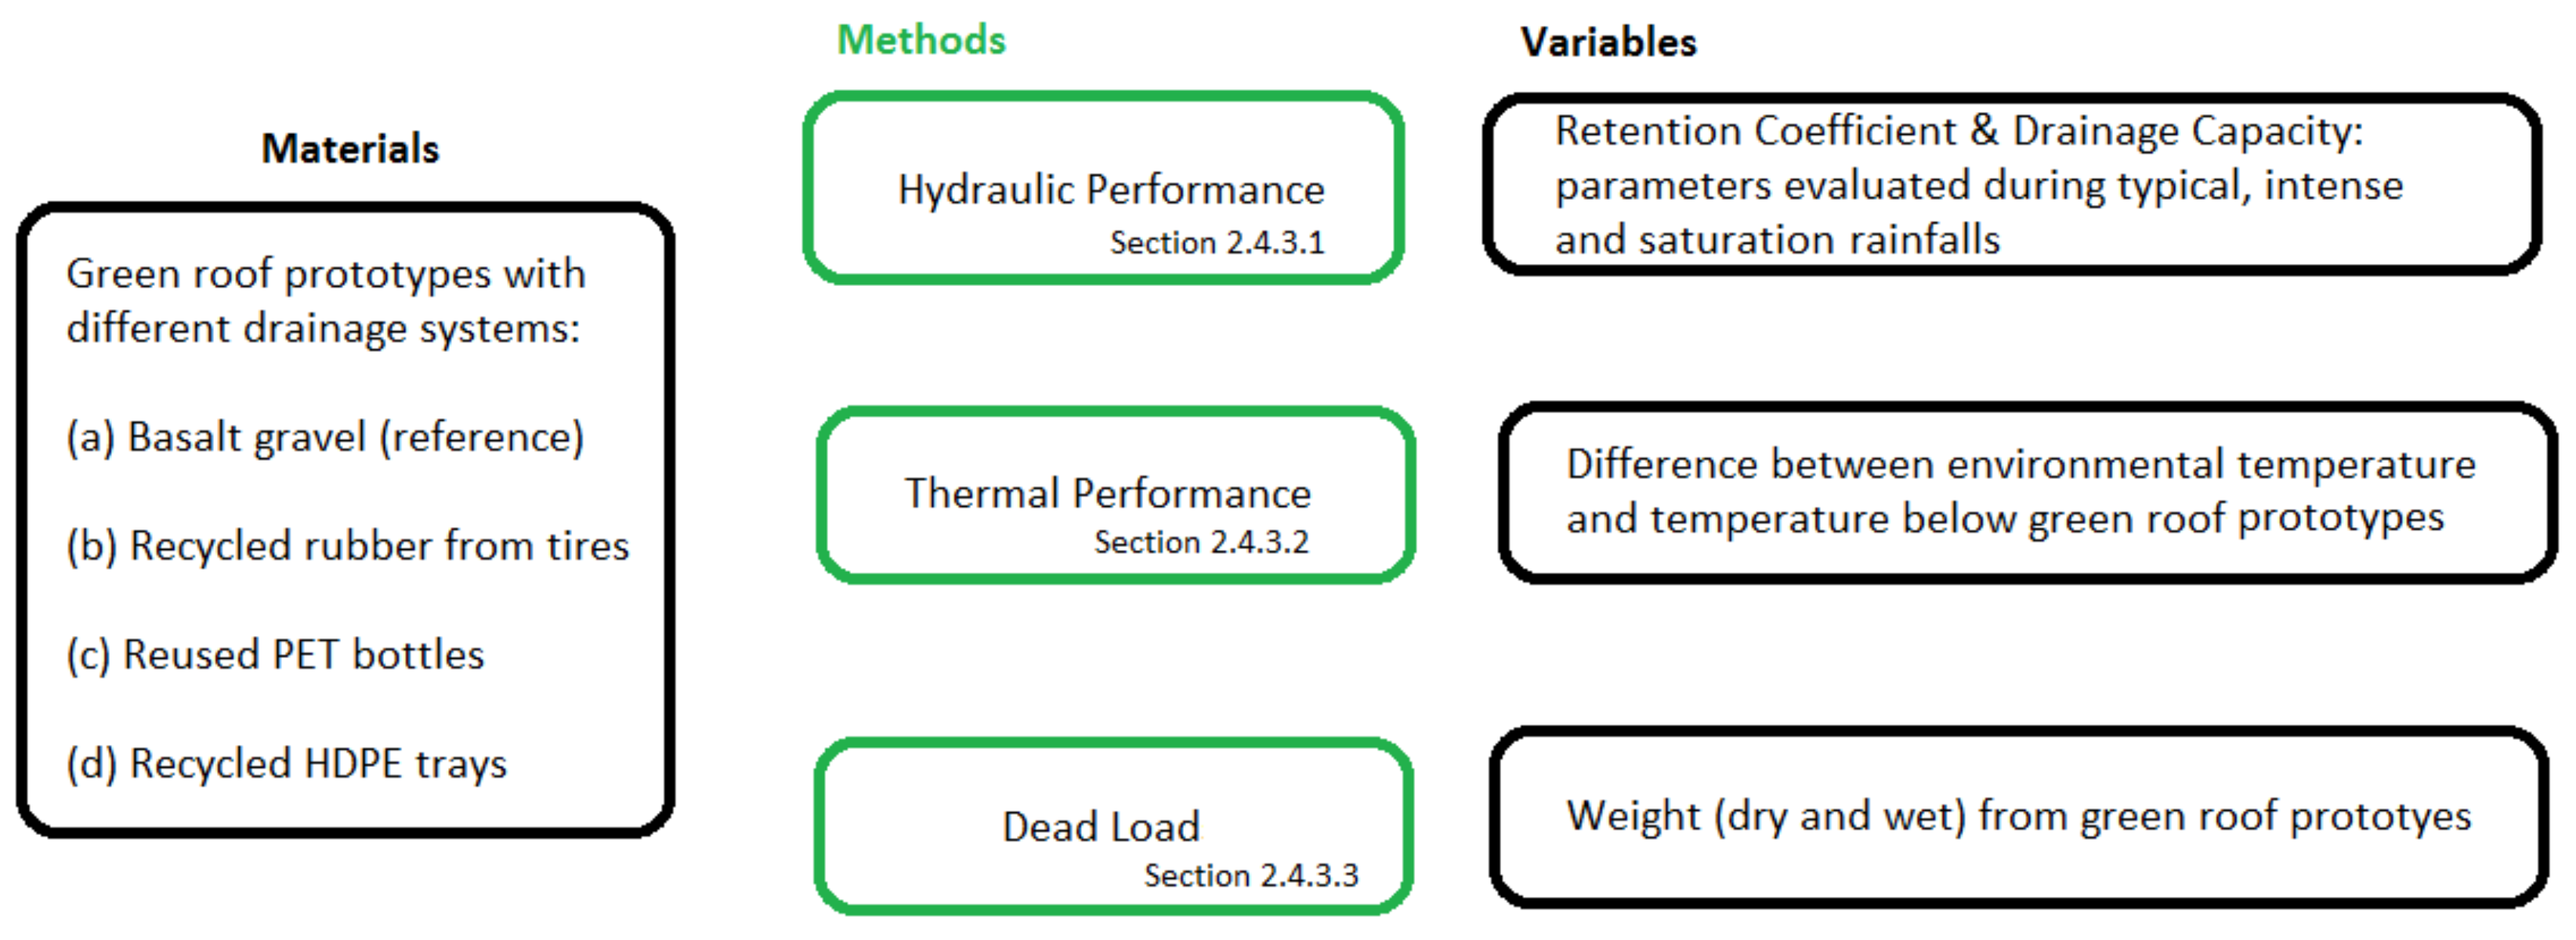
This subsection describes, in detail, the three main variables analyzed in this study: hydraulic performance, thermal performance, and dead load (
Figure 5). Each one of these aspects is described in detail as follows:
Temperature
Temperature data were taken from the environment or project site that corresponded to the space under the tent and at the bottom of the support that contained each green roof prototype, with constant measurement of 24 h every thirty minutes. It is important to clarify that the temperature under the tent was higher than the environment temperature due to the local greenhouse effect caused by the tent. However, all the green roof prototypes were exposed to the same temperature conditions. The temperature was monitored and recorded through an data logger (HOBO ONSET—H08-004-02). One day of temperature monitoring was divided in four periods (morning, noon, sunset, and early morning), and data were collected in the following dates (mm/dd/yy): 07/14/15 for morning and sunset periods and 07/24/15 for early morning period. Therefore, the obtained results were comparatively satisfactory and consistent.
Dead Load
The variable of dead load was determined by the weight per square meter of each roof system, and its interpretation was that the less weight it has for each area unit, the more efficient the system was because of the lower structural requirements. To consider the weight of the substratum in a water-saturated state, as suggested by County Flat Roofing (2005) [
17] and according to what has been established by the NSR-10 (Known as “Norma Sismo Resistente de Colombia from 2010”or Colombian building code 2010), wet soil weighs approximately 1750 kgf/m
3. Both saturated and unsaturated loads were determined in this study.
3. Results
3.1. Hydraulic Performance
The results obtained in the different types of simulated rainfall conditions are shown below.
3.1.1. Retention Coefficient C
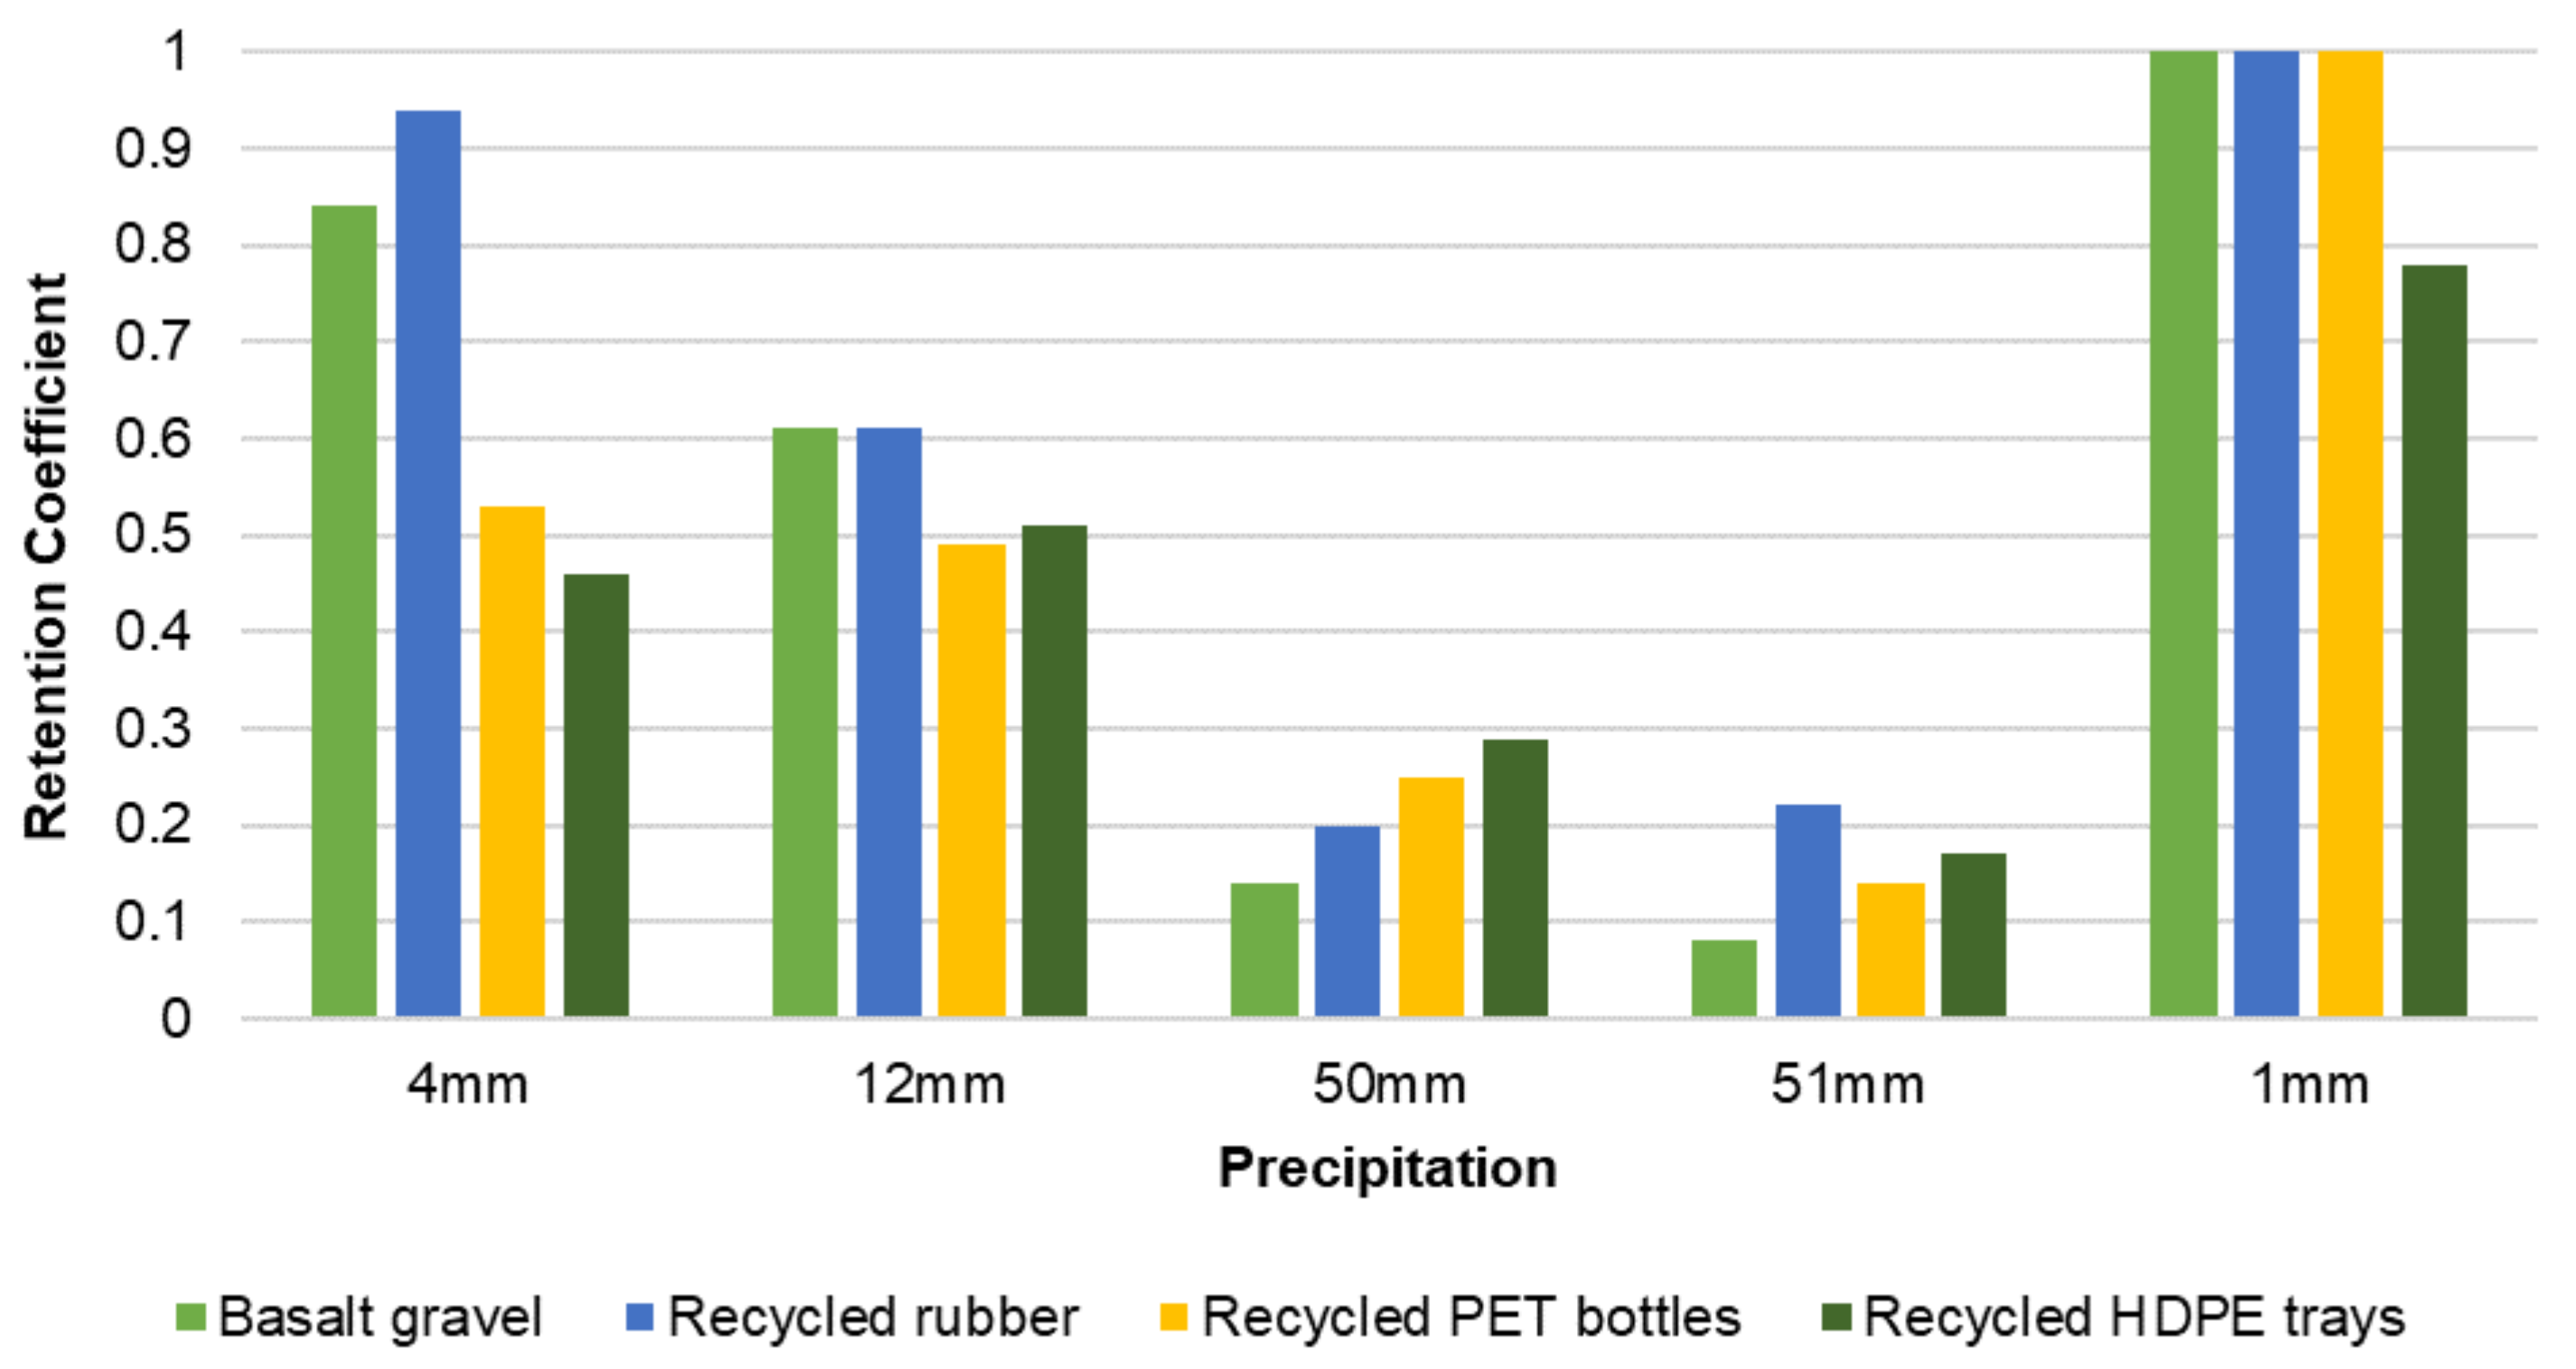
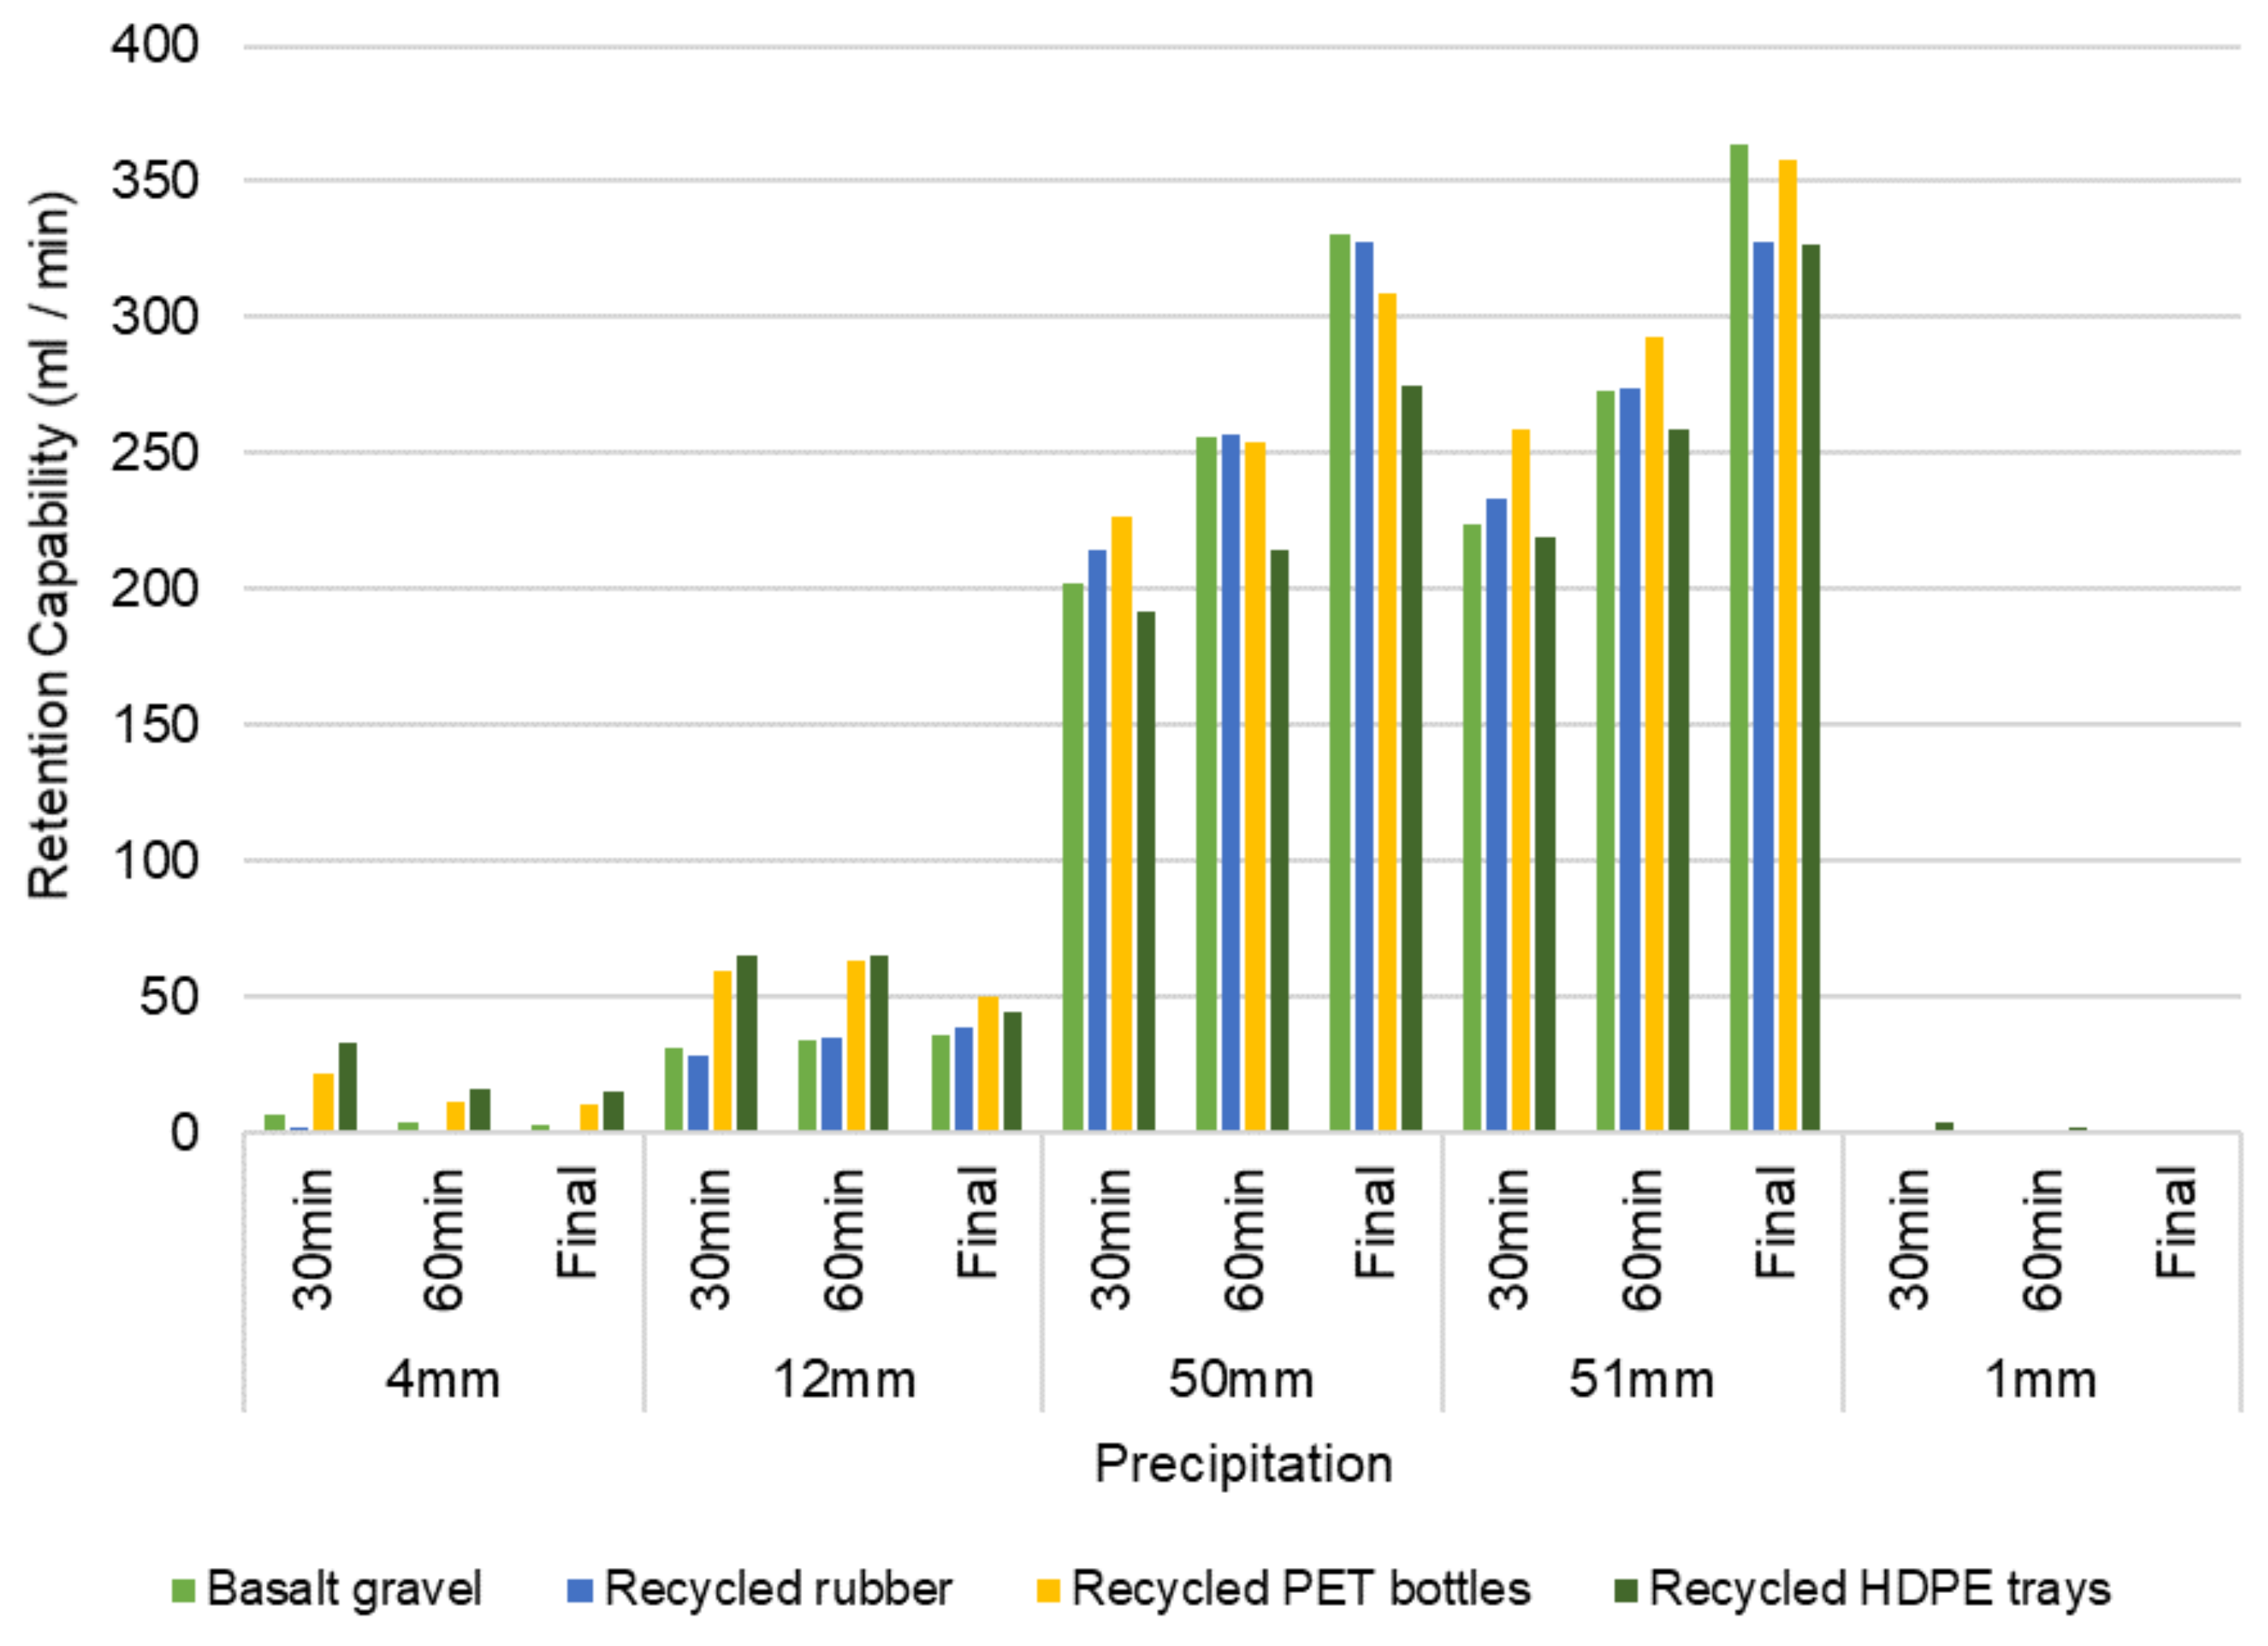
Figure 6 shows the response of the four green roof prototypes under typical rainfall conditions. The rainfall simulation followed the pre-defined five-days sequence of precipitation (4, 12, 50, 51, and 1 mm). On the other hand,
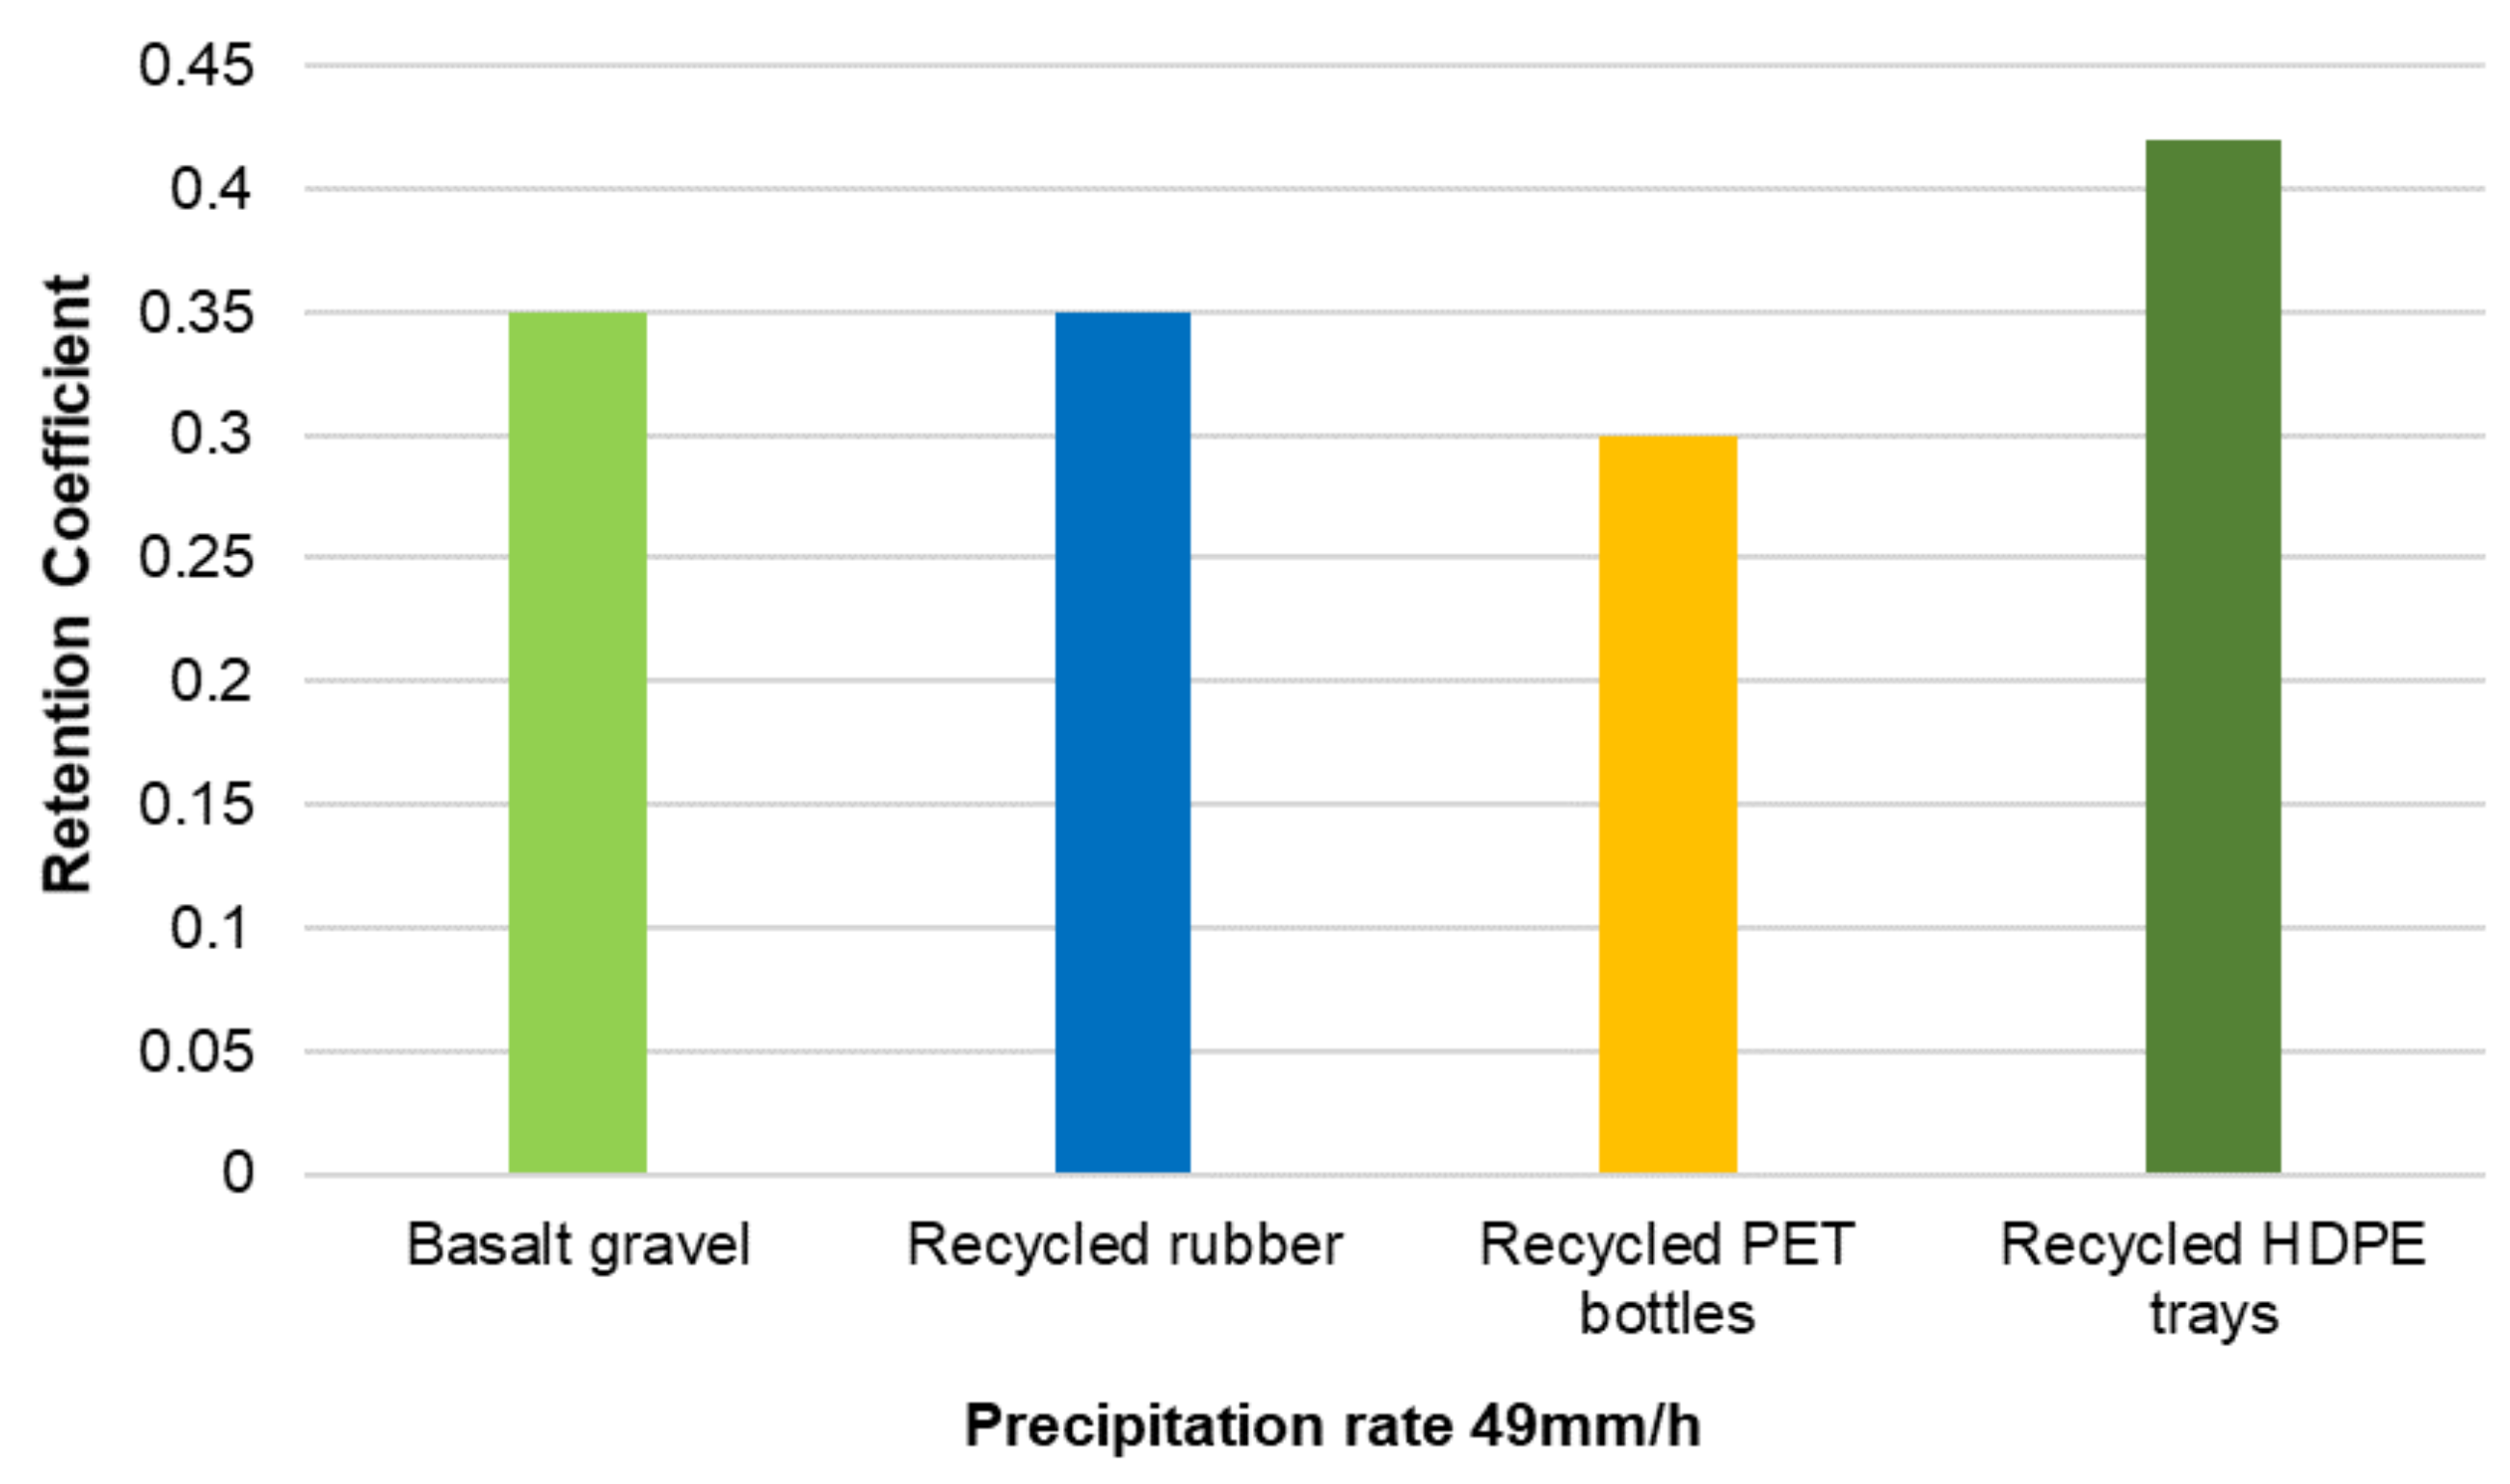
Figure 7 summarizes the behavior of the green roof prototypes for the intense rainfall condition (simulating a precipitation rate of 49 mm/h).
3.1.2. Drainage Capacity
Drainage capacity was measured for both typical and intense rainfall conditions.
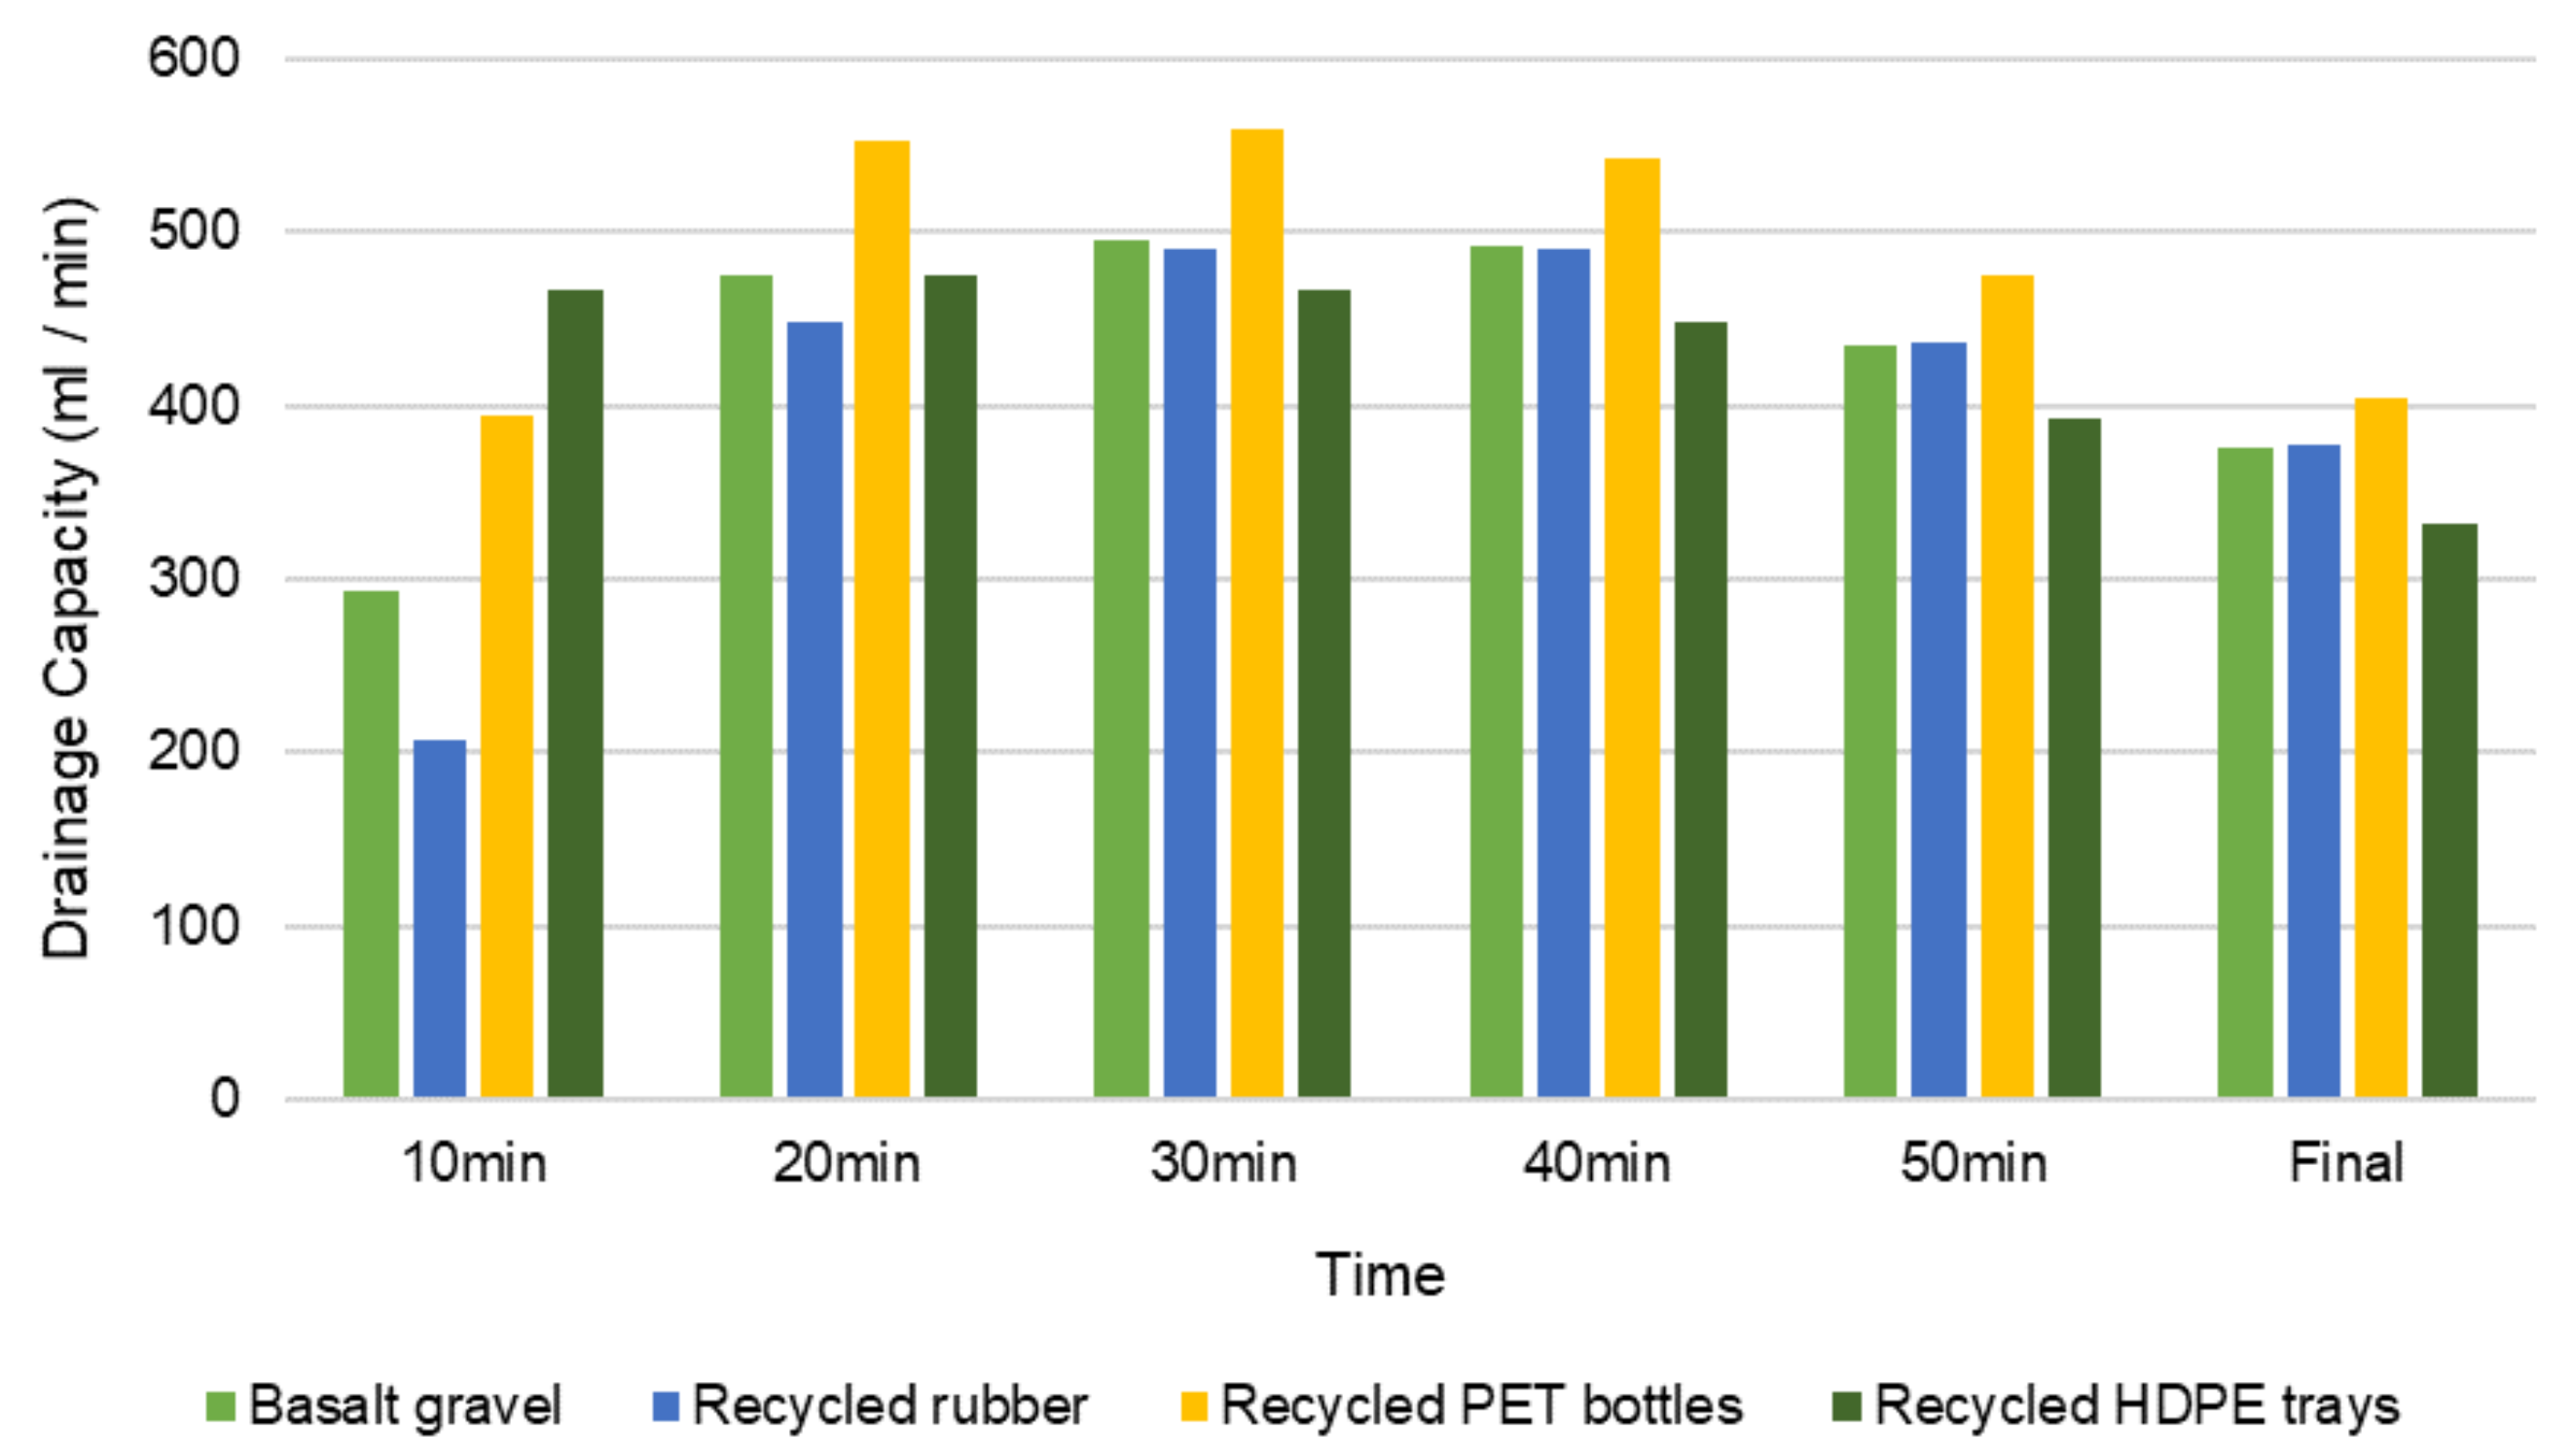
Figure 8 and
Figure 9 show the graphical results according to the predefined simulation parameters.
3.2. Temperature
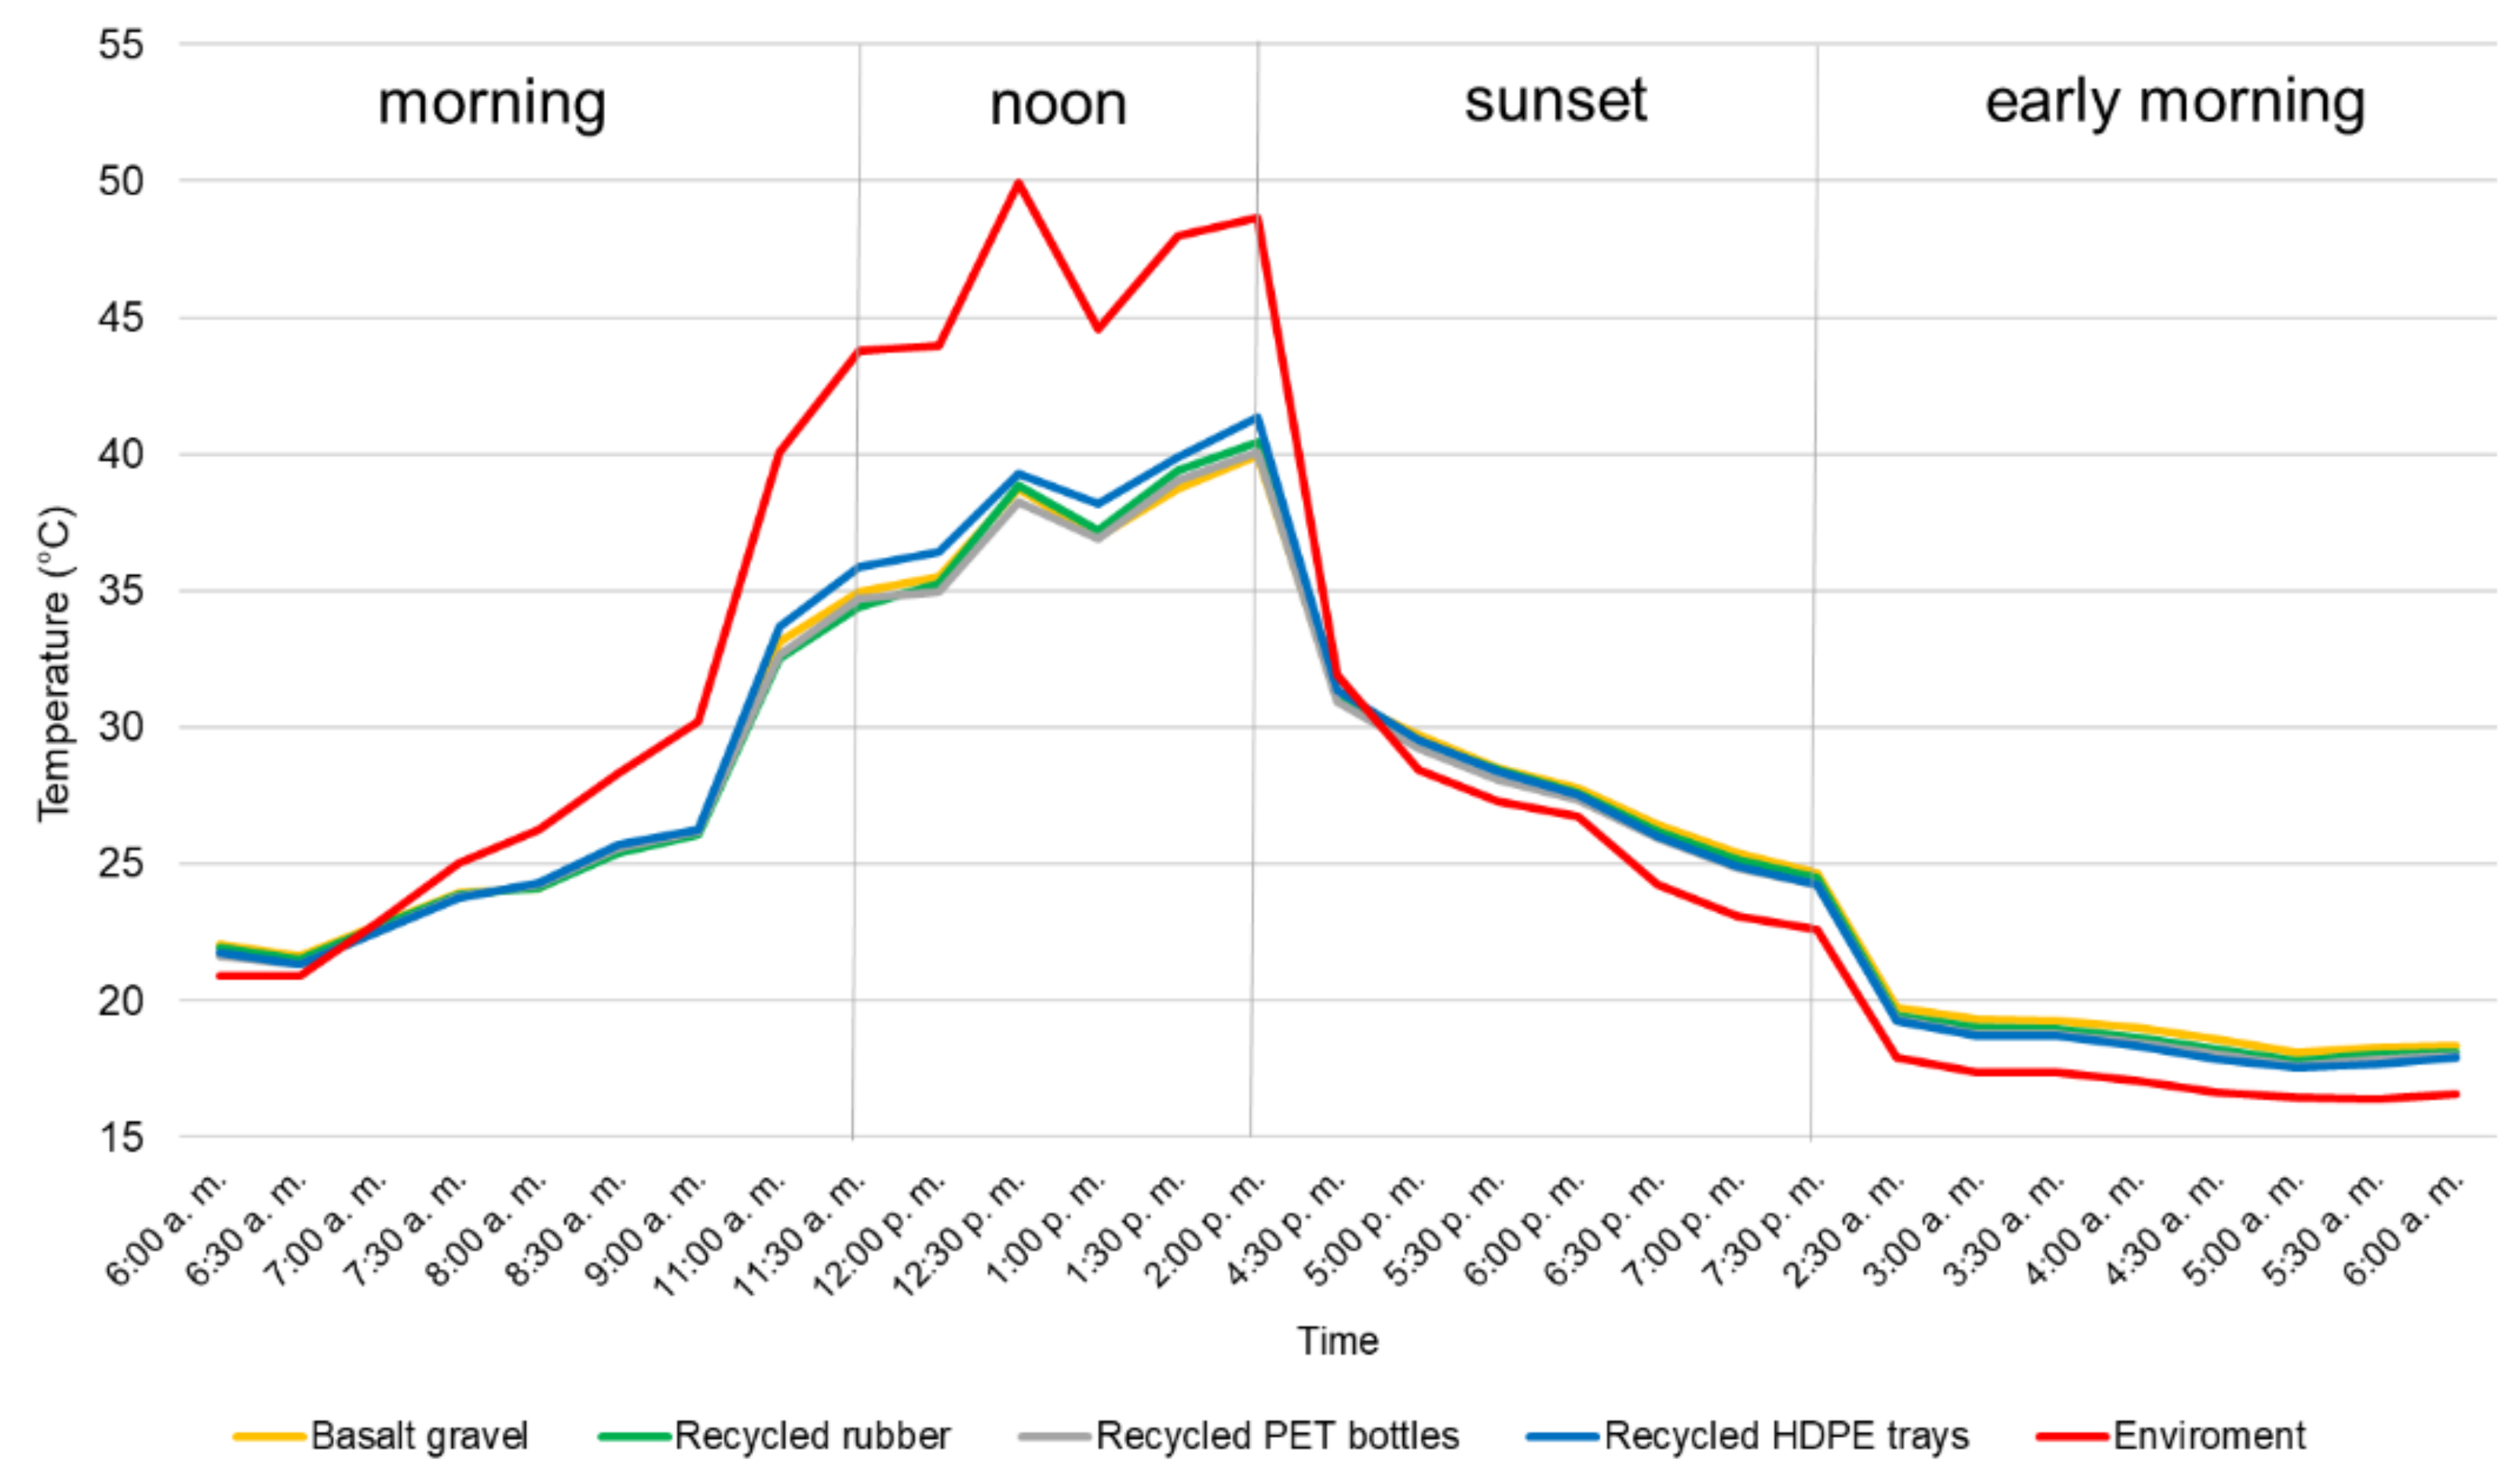
Temperature data from the four moments of the day are summarized in
Figure 10. From left to right: morning, noon, sunset, and early morning. In the first segment, a change between the environment and the sunrise effect was observed. In the second, a notable difference was observed due to the high-temperature condition that occurred in the city of Cali and the decreasing contribution of the roofs. In the third segment, again, a change was observed between the roofs and the environment due to the arrival of night. Finally, the condition of lower environment temperature in the night and early morning hours was observed.
3.3. Dead Loads
Weight was measured during the experimentation process for each green roof prototype (see
Table 4). The results showed that both unsaturated and saturated conditions provided the following order of efficiency in terms of weight: (1) PET bottles, (2) HDPE trays, (3) rubber, and (4) gravel. Likewise, it was observed that in both conditions, the green roof with a traditional drainage layer (gravel) showed higher values than roofs made from recycled or reused materials, which provided weight reductions between 33% and 72%.
Table 5 summarizes the weight of each component per area for the four green roof systems analyzed in this study.
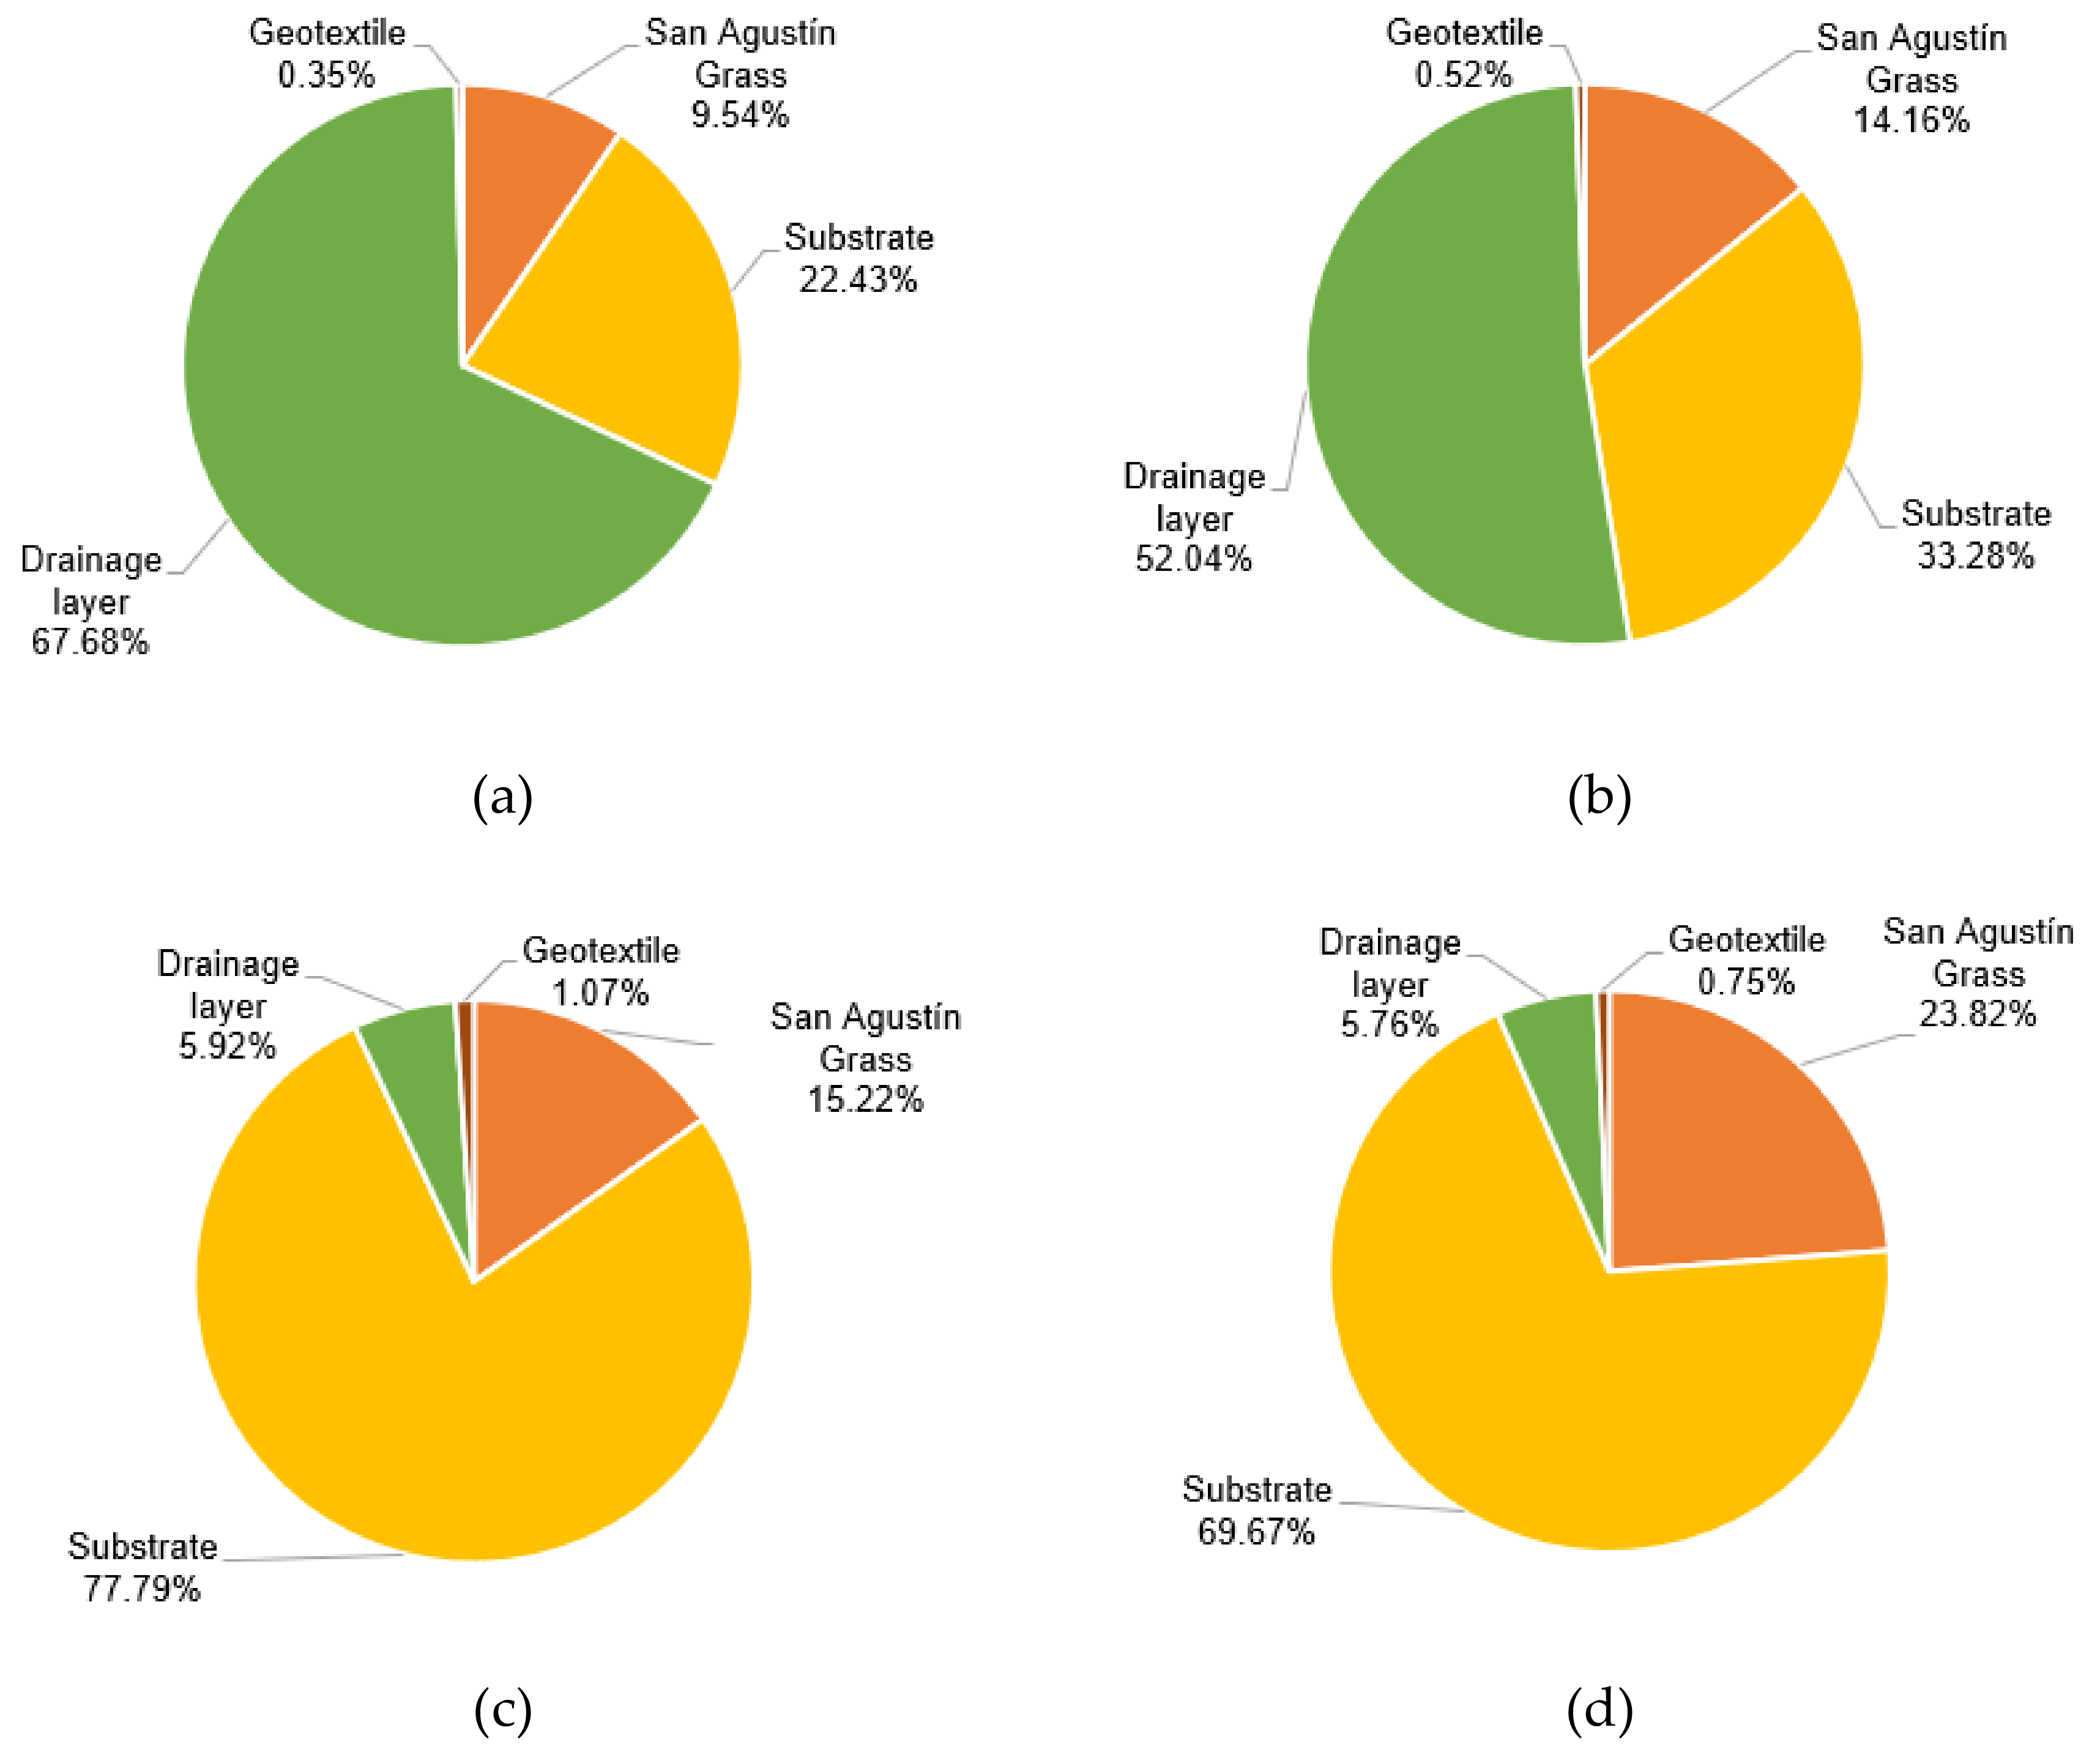
Figure 11 illustrates the graphical distribution of layers through pie charts.
4. Discussion
4.1. Retention Coefficient—C
4.1.1. Typical Rainfall
In
Figure 6, it can be seen that on the days when the precipitation was less, the roof prototypes had a higher retention capacity. In roofs with drainage layers of granular materials (gravel and rubber), the performance in low-intensity rainfall provided a retention coefficient of 1.0. In the case of 1 and 4 mm rainfalls, it ranged from 0.84 to 0.94, respectively. Meanwhile, the roofs whose drainage layers consisted of the container type system i.e., bottles and trays, showed retention coefficients of 1.0 and 0.78, respectively, for 1 mm rainfall. In the case of 4 mm rainfalls, they presented retention coefficient values that oscillated between 0.53 and 0.46.
In the case of intermediate intensity rain (12 mm), it was observed that the granular-type roofs presented a decrease in the coefficient concerning their performance in low-intensity rain and an inverse effect of the container-type roofs, which improved their performance with the same type of rain. Despite this effect in intermediate intensity rain, the best performing granular types continued with an average value of 0.61. When the intensity of the rain increased to 50 and 51 mm, the behavior of all roofs showed significant reductions, oscillating their retention coefficient in average values between 0.08 and 0.29, respectively.
The described above behaviors during the typical simulated rain cycles, with significant differences between the granular roof system (gravel and rubber) and the container-type roof systems (bottles and trays), showed that the first ones started with almost a total retention that later abruptly decreased with the increase in the intensity of the rain. In contrast, the second ones on less intense days did not present good behavior, but they later stabilized and provided acceptable retention performances. This was because container types with drainage systems that used bottles and trays had holes in their design that allowed for water flow, which in low-intensity rain made drainage faster and, therefore, higher compared to granular-type roofs in which, due to the size, distribution, and specific surface of its rubber and gravel particles, water had to travel longer distances and take more time to move than due to gravity. In some cases, it was not even possible to evacuate, showing a retention coefficient of 1.0. As simulated rain intensified (and due to the same design conditions), the effects were reversed due to the storage capacity of the container-type roofs—especially tray roofs, which conserved water up to a certain level, thus allowing for the improvement of the retention coefficient. The opposite was evident in the granular-type roofs, which suffered a saturation effect in the presence of intense rain, and the incoming water came out in similar amounts as a consequence of gravity.
4.1.2. Intense Rainfall
In terms of intense rainfalls, it was observed that in both cycles, the behavior of the green roof prototypes in regards to retention capacity was similar, with average values ranging between 0.30 and 0.42. The roof prototype with the highest efficiency in rain retention was the tray-type, with an average value of 0.42. In contrast, the least effective was the bottle-type, with an average value of 0.30. The lowest retention capacity of the roofs was obtained in the PET bottle arrangements due to the existing spaces inside the cells that comprised the system, allowing for the direct flow of water through the roof system. However, it was found that although the percentage of voids per square meter between the bottles was 6%, the impact on the retention coefficient was very low compared to the other systems studied.
To summarize, the results from the retention coefficient (C) were comparable to conventional intensive green roofs, showing even better performance for typical rainfall conditions. The literature has shown that C values for conventional green roofs can range, for example, from 55% to 75% [
18], from 39% to 43% [
19], and from 43% to 61% [
20]. This study demonstrated that is possible to obtain values close to 1.0 in the case of low intensity rainfalls and close to 60% in the case of intermediate intensity rainfalls (for granular type-roofs). To provide better results using recycled materials, it is necessary to characterize all physical properties and preferable geometries to arrange materials in detail. It is important to clarify that this study was limited to use recycled materials without additional processing or modifications.
4.2. Drainage Capacity
4.2.1. Typical Rainfall
The behavior of the roofs in typical rain, related to the flow of evacuated water, was similar to that presented in the retention coefficient. It was observed that in the first two days of the cycle with rain of 4 and 12 mm (
Figure 8), the roof prototype of recycled trays presented higher levels in milliliters per minute than the others. In the same way, it was observed that roofs of gravel and rubber presented deficient levels, showing better performance during the first days. This allowed us to conclude that for rain events equal to or less than 12 mm, the roof system that delivers lower flow rates was the gravel roof, followed by that made out of recycled rubber.
Figure 8 shows that on the third day, when the simulated rainfall was 50 mm, the condition of the roofs was the opposite, and the tray roof was the one with the highest efficiency because it showed the lowest levels of water evacuation. It was observed that the difference between the tray roof and the others was enlarged over time. This was a consequence of the maturity of the vegetal layer, which improved self-regulation and reduced flow delivery times.
When the simulated precipitation was 51 mm, the trend of less flow evacuated by the tray roof continued, and at the same time, it was observed that the gravel roof ended with the highest values. This was because in the first two intervals (30 and 60 min), its evacuation was lower because in the first moments of rain, it retained better; at the end, however, it increased the evacuation quantities.
Finally, it was observed that for 1 mm precipitation, the only roof system that showed water delivery was the tray roof, which demonstrated a high sensitivity to the initial moments of rain, in which it did not demonstrate acceptable performance. It should be noted that due to the design of the drainage layer, it was possible to store water in such a way that it was able to self-regulate flow evacuation and improve retention capacity in more extended and demanding periods of rain.
4.2.2. Intense Rainfall
It was observed that the flow behavior was similar for the four green roofs, with the best performance being the tray roof and the lowest performance being the one made up of bottles. The key factor of the trays was their operation based on their modular design, while in systems with granular-type drainage, in addition to the size and distribution of particles, specific surface area and absorption of the material also had influence. The low performance of the bottle system roof was because it was made up of isolated units that formed cells and not a consolidated and consistent layer structure that facilitated the retention, self-regulation, and homogeneous life of the vegetation.
It was observed that tray roof delivered one of the highest flows at the beginning due to its design. However, this situation was later found to be the opposite, and it was the roof that, over time and in the presence of higher precipitation, behaved more efficiently in self-regulation because it evacuated the drained water more slowly. The above was reflected in lower volumes for each calculated time.
Between minute ten and minute twenty, the drainage curves showed a noticeable increase in the amount of water drained concerning the following intervals; this was because the IFD curve (see
Appendix A—
Figure A1b) of the selected intense rain (49.7 mm/h), as it was intended to perform in the most precise way. Therefore, and according to the conditions of such curve, in the interval of the first twenty minutes, 27.9 mm were simulated continuously over 16 min and 44 s. From minute twenty, the flows were more regulated according to the conditions of the selected IFD, which generated the stability of the drainage curves. The gravel and recycled rubber roofs behaved similarly, delivering little water at the beginning compared to the others, but they stabilized over time, and despite showing good performance, they were surpassed by the tray roof system.
The results showed that the proposed green roof systems provided good performance in terms of water drainage. In the case of bottle system and tray roofs, an intrinsic ability to self-regulate was evident, which is highly desirable. Responses in respect to the reference green roof made of gravel demonstrated that all considered recycled materials provided similar responses under the same rainfall conditions. Further modifications regarding the arrangement of layers and systems (e.g., bottles and trays) have to be studied to analyze the drainage response and optimize area and material distribution.
4.3. Temperature
In all the analyzed intervals, the behavior of the roofs tended to preserve the ideal conditions of thermal comfort, which ranged between 21 and 25 °C according to the Colombian Sustainable Building Code. However, it was not possible to reach this value in some analyzed segments. However, it was possible to mitigate the effect of external temperature, reducing the intense use of active cooling systems. The following observations were obtained from the temperature behavior obtained from the four different green roof systems:
- (a)
In the first half-hour of the morning for all the analyzed days, it was generally observed, as shown in
Figure 10, that environmental temperature was lower than the temperature of the four roof systems, presenting a change due to the sunrise, where the condition was contrary and the roofs had the lowest temperatures. Before reversing this condition, the roof systems with container type drains (trays and bottles) presented lower temperatures compared to those with a granular type drainage layer (gravel and rubber). The difference between the highest and lowest temperature roof did not exceed, in any case,1°C.
- (b)
Between 11:00 a.m. and at 2:00 p.m. for all the analyzed days, it was generally observed that the temperature of the environment was notably higher than the temperature of the roofs. In this analysis in which the sun radiated more intensely, the benefits of lowering the temperatures of the green roof systems and the effectiveness of using recycled and reused materials in their drainage layer were demonstrated. The most extreme case of the difference between the environment value and the lowest roof was 11.7 °C. Likewise, it was observed that the smallest difference was 2.8 °C between the environment and the tray roof.
- (c)
At the end of the afternoon, it was observed that the environmental temperature was higher than the roof temperature until between 4:30 p.m. and 6:00 p.m., when the condition was the opposite and the green roofs were the ones with a higher temperature, demonstrating the benefits of lowering temperatures at critical moments that were opposite to the night. However, a temperature inversion was observed one hour earlier between the roofs and the environment.
- (d)
According to
Figure 10, in the early morning hours, when the temperature was lower compared to other times of the day, the temperature of the environment was lower than the temperature of the roofs (in some cases the differences reached up to 2 °C). Moreover, the behavior between roofs showed that the gravel and trays roofs provided the highest and lowest temperatures, respectively.
Regarding temperature, the results showed the same behavior with minimum variations with respect to the reference green roof system (basalt gravel). Therefore, the use of recycled materials, as proposed in this study, is suitable from the perspective of environmental temperature reduction. The next step in this research direction is the analysis of different vegetation layers (growing and development) using recycled materials that can provide better responses with respect to temperature and CO2 reduction.
4.4. Dead Load
According to
Figure 11, the drainage layer was the most representative component when analyzing the variable weight. In green roofs with granular materials, values of 52% for rubber and 68% for gravel were found (these were related to the sum of all green roof components), while, on the contrary, the percentage of this layer only represented 6% for both cases of roof systems with a container-type drainage layer. In these, the most representative component was the substratum, with percentages of 78% for bottles and 70% for trays, in terms of the sum of all their components.
When analyzing the behavior of the drainage layers made with recycled and reused materials compared to the traditional gravel, the second one had a higher weight in all cases. For example, the recycled rubber drainage layer weighed 48% less than the gravel layer. In the case of the layers of bottles and trays, these weighed 98% and 97% less than that of gravel, respectively. Likewise, the low weight of the drainage layers of the PET bottle and HDPE tray systems must be highlighted, since, in addition to reducing the weight more than significantly, they facilitated handling at the time of construction, reducing mechanical risk factors associated with the installation work.
When analyzing the total weight of green roof systems, it was found that the system whose drainage layer was composed of gravel presented a higher percentage of weight than the systems consisting of rubber, bottles, and trays (33%, 72%, and 60% respectively), which made it a more demanding system when designing the structures of buildings due to the required increase of loads.
The composition of the weight inside the roofs showed that in the case of systems with a gravel and rubber drainage layer, the highest proportion was determined by the drainage layer, while the bottle and tray roofs showed the highest representative weight or load.
With respect to the overall sustainability of the proposed green roof prototypes from recycled material, it is important to clarify that this study did not cover the lifecycle assessment of materials involved in the construction of the systems. Therefore, the environmental impacts of materials were out of the scope of this article. Hydraulic and thermal performances were included and widely analyzed. Dead loads and initial cost were also calculated as additional parameters for the proposed green roof prototypes.
In terms of initial cost, it is important to mention that recycled materials provided a cost reduction per square meter that was greater than 10% (in the case of HDPE trays) compared to basalt gravel (
Table A1). Maintenance and another lifecycle cost were not included in this article.
5. Conclusions
In this article, scale prototypes of three semi-intensive green roof systems with different types of drainage systems made out of recycled and reused materials (rubber, trays, and bottles) were successfully evaluated and compared to a traditional green roof system that used natural aggregates of (gravel) as its drainage layer.
In terms of hydraulic performance, the behavior of the systems using trays, bottles, rubber, and gravel (reference) was analyzed in different precipitation regimes (typical and intense). The results showed that for “typical precipitations,” the granular drainage systems (gravel and rubber) were very efficient because they retained all the precipitation (retention coefficients close to 1.0), while the systems composed of module containers (bottles and trays) retained approximately half of the water supplied at that level of precipitation (retention coefficients close to 0.5). For the “intense precipitation,” the coefficients reached values close to 0.3 for all roof systems, except for the gravel system, which reduced its water storage capacity to almost zero (0.08). In general, this study demonstrates the enormous potential of all the green roofs analyzed in this study to reduce the maximum flow of runoff water volumes, as they could increase retention time when they are implemented in large areas at the urban level.
With respect to the thermal behavior, it was possible to verify the effect of temperature reduction of all the roofing systems. During days when the ambient temperature was very high (approximately 50 °C), a reduction in temperature that ranged from 10.6 to 11.7 °C was found for the investigated green roof systems. This makes it evident that the use of green roof systems with drainage layers made out of recycled and reused materials have, like gravel roofs, the potential to reduce the consumption of electrical energy in buildings derived from artificial cooling.
Finally, a reduction from 33% to 72% in weight per area (dead load) of the green roof was observed when using recycled and reused materials compared to natural materials in the drainage layers. This is significantly important because the ease and costs of implementation of green roofs depends on the structural condition of the building. Therefore, for the load capacity of an existing building, the dead and live loads must be assessed in order to verify whether, with the increase in the dead load generated by the weight of the green roof, the building can withstand the loads added to it without affecting its resistance, as well as if it complies with the specifications of the building construction code. Otherwise, a structural reinforcement must be designed to guarantee safety.
For new buildings, a structural calculation must be made according to all the loads that act on the structural system and that come from the weight of all the permanent elements in the construction (dead loads), the occupants and their belongings (live loads), environmental effects, differential settlements, and dimensional change restriction following current regulations. The last indicates that due to the relatively lower density and lower absorption capacity of the recycled and reused materials evaluated in this research, the implementation of green roof systems, both in existing and new buildings, would be easier and cheaper.
Future research works will be oriented to evaluate the sustainability and economic performance of green roofs based on recycled or reused materials. Considering environmental impacts in terms of material lifecycle and lifecycle costs derived from installing, maintaining, upgrading, and disposing constructive components. All those parameters need to be included to generate holistic evaluations to facilitate the decision-making during green roof design and construction.
Author Contributions
Conceptualization, methodology, and editing, J.M. and A.M.-R.; components, classification, and technical performance, A.N. and A.C. All authors have read and agreed to the published version of the manuscript.
Funding
This research received no external funding.
Acknowledgments
The authors thank Dos Mundos (Cali, Colombia) and Pontificia Universidad Javeriana Cali (Colombia) for the technical support given during the experiments reported in this article.
Conflicts of Interest
The authors declare no conflict of interest. The funders had no role in the design of the study; in the collection, analyses, or interpretation of data; in the writing of the manuscript, or in the decision to publish the results.
Appendix A
Figure A1.
Data employed to estimate typical and intense rainfall conditions. (a) Typical rainfall conditions (from 23 to 29 October 1987). (b) Intensity–frequency–duration (IFD) curve for intense rainfall (data from 2 June 1995).
Figure A1.
Data employed to estimate typical and intense rainfall conditions. (a) Typical rainfall conditions (from 23 to 29 October 1987). (b) Intensity–frequency–duration (IFD) curve for intense rainfall (data from 2 June 1995).
Table A1.
Approximated costs for each roofing system proposed (Value for 1 m2).
Table A1.
Approximated costs for each roofing system proposed (Value for 1 m2).
| N° | Green Roof System | Approximated Costs USD |
|---|
| 1 | Recycled HDPE trays | $93.71 |
| 2 | Recycled PET bottles | $97.59 |
| 3 | Recycled rubber | $103.16 |
| 4 | Basalt gravel | $104.49 |
References
- Li, J.F.; Wai, O.W.H.; Li, Y.S.; Zhan, J.M.; Ho, Y.A.; Li, J.; Lam, E. Effect of green roof on ambient CO2 concentration. Build. Environ. 2010, 45, 2644–2651. [Google Scholar] [CrossRef]
- Fujii, S.; Cha, H.; Kagi, N.; Miyamura, H.; Kim, Y.S. Effects on air pollutant removal by plant absorption and adsorption. Build. Environ. 2005, 40, 105–112. [Google Scholar] [CrossRef]
- Jim, C.Y.; Tsang, S.W. Biophysical properties and thermal performance of an intensive green roof. Build. Environ. 2011, 46, 1263–1274. [Google Scholar] [CrossRef]
- Ahmad, S.; Hashim, N.M. Effects of Soil Moisture on Urban Heat Island Occurrences: Case of Selangor, Malaysia. Humanit. Soc. Sci. J. 2007, 2, 132–138. [Google Scholar]
- Bliss, D.J. Stormwater Runoff Mitigation and Water Quality Improvements through the Use of a Green Roof in Pittsburgh, Pennsylvania. Master’s Thesis, Faculty of the School of Engineering, University of Pittsburgh, Pittsburgh, PA, USA, 2010. [Google Scholar]
- Naranjo, A.; Colonia, A.; Mesa, J.; Maury, H.; Maury-Ramírez, A. State-of-the-Art Green Roofs: Technical Performance and Certifications for Sustainable Construction. Coatings 2020, 10, 69. [Google Scholar] [CrossRef] [Green Version]
- Chen, C.F.; Kang, S.F.; Lin, J.H. Effects of recycled glass and different substrate materials on the leachate quality and plant growth of green roofs. Ecol. Eng. 2018, 112, 10–20. [Google Scholar] [CrossRef]
- Eksi, M.; Rowe, D.B. Green roof substrates: Effect of recycled crushed porcelain and foamed glass on plant growth and water retention. Urban For. Urban Green. 2016, 20, 81–88. [Google Scholar]
- Bates, A.J.; Sadler, J.P.; Greswell, R.B.; Mackay, R. Effects of recycled aggregate growth substrate on green roof vegetation development: A six year experiment. Landsc. Urban Plan. 2015, 135, 22–31. [Google Scholar] [CrossRef] [Green Version]
- Rincón, L.; Coma, J.; Pérez, G.; Castell, A.; Boer, D.; Cabeza, L.F. Environmental performance of recycled rubber as drainage layer in extensive green roofs. A comparative Life Cycle Assessment. Build. Environ. 2014, 74, 22–30. [Google Scholar] [CrossRef]
- Mickovski, S.B.; Buss, K.; McKenzie, B.M.; Sökmener, B. Laboratory study on the potential use of recycled inert construction waste material in the substrate mix for extensive green roofs. Ecol. Eng. 2013, 61, 706–714. [Google Scholar] [CrossRef]
- Pérez, G.; Vila, A.; Rincón, L.; Solé, C.; Cabeza, L.F. Use of rubber crumbs as drainage layer in green roofs as potential energy improvement material. Appl. Energy 2012, 97, 347–354. [Google Scholar] [CrossRef]
- Gill, R. Igneous Rocks and Processes: A Practical Guide; Wiley: New York, NY, USA, 2010; ISBN 9781444330656. [Google Scholar]
- Evans, A.; Evans, R. The Composition of a Tyre: Typical Components; Banbury: Oxon, UK, 2006. [Google Scholar]
- Instituto de Hidrología, Meteorología y Estudios Ambientales [IDEAM]. Información Climatológica de la Estación Univalle; Variación de Parámetros Climáticos: Cali, Colombia, 2014. [Google Scholar]
- Mihelcic, J.R.; Zimmerman, J.B.; Auer, M.T. Environmental Engineering: Fundamentals, Sustainability, Design, 2nd ed.; Wiley: New York, NY, USA, 2014; ISBN 9781118741498. [Google Scholar]
- C County Flat Roofing. County Flat Roofing Main Webpage. 2020. Available online: https://countyflatroofing.co.uk/ (accessed on 20 December 2019).
- Metselaar, K. Resources, Conservation and Recycling Water retention and evapotranspiration of green roofs and possible natural vegetation types. Resourc. Conserv. Recycl. 2012, 64, 49–55. [Google Scholar] [CrossRef]
- Wong, G.K.L.; Jim, C.Y. Quantitative hydrologic performance of extensive green roof under humid-tropical rainfall regime. Ecol. Eng. 2014, 70, 366–378. [Google Scholar] [CrossRef]
- Young, J.; Jung, M.; Han, M. A pilot study to evaluate runoff quantity from green roofs. J. Environ. Manag. 2015, 152, 171–176. [Google Scholar]
Figure 1.
Cross sections of the green roof prototypes made out of recycled or reused materials.
Figure 1.
Cross sections of the green roof prototypes made out of recycled or reused materials.
Figure 2.
Cross-section detail of roofing prototypes: (a) Prototype 1: basalt gravel. (b) Prototype 2: recycled rubber. (c) Prototype 3: recycled polyethylene (PET) bottles. (d) Prototype 4: recycled high density polyethylene (HDPE) trays.
Figure 2.
Cross-section detail of roofing prototypes: (a) Prototype 1: basalt gravel. (b) Prototype 2: recycled rubber. (c) Prototype 3: recycled polyethylene (PET) bottles. (d) Prototype 4: recycled high density polyethylene (HDPE) trays.
Figure 3.
Rain simulator system: (a) Overall picture of rain simulator and water supply tank. (b) Floating irrigation system. (c) Water retainers. (d) Spatial orientation of the rain simulation experiment with respect to cardinal points.
Figure 3.
Rain simulator system: (a) Overall picture of rain simulator and water supply tank. (b) Floating irrigation system. (c) Water retainers. (d) Spatial orientation of the rain simulation experiment with respect to cardinal points.
Figure 4.
Calibration and rain simulation monitoring elements: (a) calibration test tube, (b) micro-spray nozzle, (c) timer, (d) submersible pump, (e) chronometer to measure drainage performance, and (f) tank for water supply for pumping.
Figure 4.
Calibration and rain simulation monitoring elements: (a) calibration test tube, (b) micro-spray nozzle, (c) timer, (d) submersible pump, (e) chronometer to measure drainage performance, and (f) tank for water supply for pumping.
Figure 5.
Main variables monitored on the green roof prototypes.
Figure 5.
Main variables monitored on the green roof prototypes.
Figure 6.
Average behavior of the retention coefficient (C) for typical rain conditions between post-drought and stable cycles.
Figure 6.
Average behavior of the retention coefficient (C) for typical rain conditions between post-drought and stable cycles.
Figure 7.
Average behavior of the retention coefficient for intense rain condition between post-drought and stable cycles.
Figure 7.
Average behavior of the retention coefficient for intense rain condition between post-drought and stable cycles.
Figure 8.
Average behavior of drained water (mL/min) for typical rain conditions between post-drought and stable cycles.
Figure 8.
Average behavior of drained water (mL/min) for typical rain conditions between post-drought and stable cycles.
Figure 9.
Average behavior of drained water (mL/min) for intense rain conditions between post-drought and stable cycles.
Figure 9.
Average behavior of drained water (mL/min) for intense rain conditions between post-drought and stable cycles.
Figure 10.
Temperature behavior during the day for roof prototypes and the environment.
Figure 10.
Temperature behavior during the day for roof prototypes and the environment.
Figure 11.
Weight distribution for each green roof prototype. (a) basalt gravel, (b) recycled rubber, (c) recycled PET bottles, and (d) recycled HDPE trays.
Figure 11.
Weight distribution for each green roof prototype. (a) basalt gravel, (b) recycled rubber, (c) recycled PET bottles, and (d) recycled HDPE trays.
Table 1.
Summary of works related to the use of recycled materials in green roofs.
Table 1.
Summary of works related to the use of recycled materials in green roofs.
| Author | Materials | Scope | Results |
|---|
| Chi-Feng et al. 2018 [7] | Recycled glass | Vegetation growth | Good results depend on controlling the mixing ration between the recycled glass and organic substances, as well as the location of the glass in the substrate. |
| Eksi and Rowe 2016 [8] | Recycled crushed porcelain | Vegetation growth and water retention | Improved water retention and plant growth when reducing the number of large particles. Additionally, porcelain provides less embodied energy to construct a green roof. |
| Bates et al. 2015 [9] | Recycled construction waste | Vegetation growth | Pure crushed bricks or mixtures primarily based on crushed bricks enabled the most diverse ruderal plant assemblages. Ash from solid waste provided the worst response. |
| Rincón et al. 2014 [10] | Recycled rubber | Environmental performance | The material provided a similar response compared to pozzolana, in addition to a lower environmental impact. |
| Mickovski et al. 2013 [11] | Recycled construction waste | Vegetation growth and drainage properties | Good response and properties compared to conventional materials. |
| Pérez et al. 2012 [12] | Recycled rubber from tires as the drainage layer | Potential Energy Savings | The material provided a similar response to pozzolana in terms of hydraulic behavior. The use of recycled rubber can be useful as a potential energy-saving material for the continental Mediterranean climate during summer. |
Table 2.
Description of materials selected for drainage layers.
Table 2.
Description of materials selected for drainage layers.
| Material | Sample Photo | Appearance and Shape | Composition |
|---|
| Basalt Gravel: natural stone, traditionally used as a drainage layer in green roofs. | ![Coatings 10 00525 i001]() | Large, irregularly shaped particles with a rough, porous, and vesicular surfaces, preserving traces of bubbles produced by expanding water vapor generated during the cooling and solidification of lava. | 45%–54% silica and generally rich in iron and magnesium [13]. |
| Recycled Rubber: recycled elastic polymer used to replace basalt stone in the drainage layer in the green roof systems. | ![Coatings 10 00525 i002]() | Coarse particles in the form of rectangular prisms and granules of fine angular black particles. Obtained from recycled car tires. | Rubber 45%, carbon black 21%, metal 20%, textiles 4%, additives 8%, zinc oxide 1%, and sulfur 1% [14]. |
| Recycled PET Bottles: polymer denominated as polyethylene terephthalate PET or PETE. | ![Coatings 10 00525 i003]() | Cells of 4 × 4 bottles split in half (eight halves with mouths and eight halves with bottoms), each with five perforations of 3 mm diameter, arranged in a reticular way, and joined by galvanized wire staples located at the height of 7.5 cm. Smooth texture, translucent light green. | Polymer molecules comprised of carbon, hydrogen, and oxygen.
(C10 H8 O4)n |
| Recycled Polymer Trays HDPE: high-density polyethylene obtained from recycled product containers. | ![Coatings 10 00525 i004]() | Dark material. 60 cm × 60 cm × 10 cm, consisting of nine containers or concavities of cylindrical, conical and round shapes that allow for the retention and storage of water.
Additionally, trays have diffusion holes that allow for air and water vapor circulation, as well as drainage. | Polymer molecules comprised of carbon, hydrogen, and oxygen.
(C2 H4)n |
Table 3.
Simulated precipitation cycles.
Table 3.
Simulated precipitation cycles.
CYCLE 1
(Post-Sowing) | CYCLE 2
(Post-Drought) | CYCLE 3
(Stable Cycle) |
|---|
4 dry days
Saturation rainfall
1 dry day
Typical rainfall
4 dry days
Intense rainfall
8 dry days (prolonged drought simulation period) | Saturation rainfall
2 dry days
Typical rainfall
4 dry days
Intense rainfall
4 dry days | Typical rainfall
4 dry days
Saturation rainfall
4 dry days
Intense rain
2 dry days |
Table 4.
Weight per area for each roofing system proposed. Value for 1 m2.
Table 4.
Weight per area for each roofing system proposed. Value for 1 m2.
| Description | Roof 1
Basalt Gravel | Roof 2
Recycled Rubber | Roof 3
Recycled PET Bottles | Roof 4
Recycled HDPE Trays |
|---|
| No saturated system kgf/m2 | 174.6 | 117.7 | 49.3 | 70.0 |
| Percentage difference in the unsaturated state, of the weight of the systems, made with recycled and reused materials, concerning the conventional green roof system (gravel). | 0.0% | 32.6% | 71.8% | 60.0% |
| Saturated system kgf/m2 | 183.3 | 126.5 | 53.3 | 75.3 |
| Percentage difference in the saturated state of the weight of the systems made with recycled and reused materials concerning the conventional green roof system (gravel). | 0.0% | 31.0% | 71.0% | 58.9% |
Table 5.
Weights per area (m2) for components of the studied green roof systems.
Table 5.
Weights per area (m2) for components of the studied green roof systems.
| Description | Roof 1
Basalt Gravel
kgf/m2 | Roof 2 Recycled Rubber
kgf/m2 | Roof 3 Recycled PET Bottles
kgf/m2 | Roof 4 Recycled HDPE Trays
kgf/m2 |
|---|
| San Agustín grass | 16.7 | 16.7 | 7.5 | 16.7 |
| Substratum | 39.2 | 39.2 | 38.3 | 48.8 |
| Drainage layer | 118.2 | 61.3 | 2.9 | 4.0 |
| Geotextile | 0.6 | 0.6 | 0.5 | 0.5 |
| Total | 174.6 | 117.6 | 49.3 | 70.0 |
© 2020 by the authors. Licensee MDPI, Basel, Switzerland. This article is an open access article distributed under the terms and conditions of the Creative Commons Attribution (CC BY) license (http://creativecommons.org/licenses/by/4.0/).


