Article

Research on the Chloride Ion Penetration Resistance of Magnesium Phosphate Cement (MPC) Material as Coating for Reinforced Concrete Structures

1
Department of Civil and Airport Engineering, College of Civilaviation (College of Flight), Nanjing University of Aeronautics and Astronautics, Nanjing 210016, China
2
College of Civil Engineering, YanCheng Institute of Technology, Yancheng 224051, China
3
Jiangsu Collaborative Innovation Center for Ecological Building Materials and Environmental Protection, Yancheng 224051, China
*
Author to whom correspondence should be addressed.
Coatings 2020, 10(12), 1145; https://doi.org/10.3390/coatings10121145
Submission received: 13 October 2020 / Revised: 19 November 2020 / Accepted: 21 November 2020 / Published: 24 November 2020
(This article belongs to the Special Issue Interface and Surface Modification for Durable Concretes)

Abstract

:
This study focuses on the chloride ion penetration resistance of a magnesium phosphate cement (MPC)-based composite material coating on the surface of silicate material. By means of electrical flux method and electric acceleration corrosion tests, the anti-chlorine ion permeation and reinforcement properties of MPC-based materials and Portland cement (OPC) mortar were compared and analyzed. The experimental results show that the electrical flux of the hardened body of the MPC-based material is much lower than that of the Portland cement mortar, and the electrical flux of the hardened body of the MPC mortar can be obviously reduced by adding silica-fume (SF) and fly ash (FA), which, when combined in a suitable proportion, will make the MPC’s hardened body more dense and impermeable. The addition of short cut fibers increases the number of pores, the pore size, and the electrical flux of the cement mortar’s hardened body. The adverse effects of the three fibers on the permeability of the MPC mortar against chlorine ions were as follows: polyvinyl alcohol fiber > glass fiber > basalt fiber. The electrical flux of MPC mortar or MPC paste coated on the surface of the OPC mortar was greatly reduced. Compared with silicate mortar, the MPC-based material has excellent protective performance under the condition of accelerated corrosion.

1. Introduction

Steel reinforcement used in infrastructure—even that covered with Portland cement concrete—can be corroded, resulting in cracks in the cement concrete, especially when chloride ions exist in the environment [1]. These cracks can allow the quick invasion of oxygen, moisture, and chloride ions into the steel reinforcement, accelerating the corrosion process and concrete deterioration [2]. Concrete can even be deboned from its steel reinforcement due to the resulting corrosion. Therefore, deteriorated concrete should be repaired quickly to prevent further damage to the infrastructure or further impacts on the concrete’s service life. If a protective coating is applied on the surface of the reinforced concrete structure to effectively prevent the penetration and corrosion of a corrosive medium, and if the coating material has sufficient strength, the concrete structure can be strengthened to a certain extent. This will greatly prolong the durability of the concrete.
Magnesium phosphate cement (MPC) is a new type of inorganic cementitious material that has not been quantified or applied in a large area. MPC is recognized as an inorganic substance produced by an acid–base neutralization reaction. The reaction process is as follows [3]:
M g O ( s ) + N H 4 ( K ) H 2 P O 4 ( s ) + 5 H 2 O ( I ) M g N H 4 ( K ) P O 4 · 6 H 2 O ( s )
where MgNH4·(K)PO4·6H2O (MA(K)P) gives cementitious properties to the MPC system [4]. Ammonium phosphate ((NH4)3PO4) is used as a raw material to react with dead-burnt magnesia and water to make MPC; however, the pungent odor from the ammonia released in this reaction restrains ammonium phosphate’s application. Wagh et al. [5,6] studied the hydration mechanism and improvements in MPC properties using KH2PO4 in place of (NH4)2HPO4. Now, KH2PO4 is increasingly used as an MPC acid component material in civil engineering [7].
The properties of MPC mainly include its strength, bonding properties, workability, and durability, which are closely related to the activity and fineness of the MgO, phosphate/magnesia mass ratio (P/M), the type and content of the retarder and admixture, the water/binder ratio (w/b), and the environmental humidity and temperature. Many scholars [8,9,10] have studied the influence of P/M, w/b, and other material composition parameters on the microstructure and physical and mechanical properties of MPC hydration products. The conclusions of these studies generally indicate [11,12,13,14,15] that MPC has many advantages over other inorganic materials, such as room temperature curing ability, rapid hardening, high early strength, low shrinkage, high bonding strength, frost resistance, salt-spray resistance, and weak alkalinity. Therefore, MPC can be used as a repair material, anti-corrosion coating, fire retardant coating, toxic waste curing agent, nuclear shielding material, etc.
An MPC slurry can be selected as a repair material for deteriorated concrete when limited repair time is needed, e.g., for ridge structures not completely blocking traffic and harbor structures during tidal gaps. An acid–base reaction occurs immediately after the magnesium phosphate cement meets the water, forming binding materials whose strength can reach as high as 40 MPa in 3 h [11]. Under very low temperatures (e.g., −20 °C), this acid–base reaction can still work in MPC cement, making the rapid repair of concrete infrastructure possible in winter. Other advantages of MPC over Portland cement include high bonding strength and low shrinkage [12,13].
Moreover, selecting suitable mineral admixtures is helpful for improving the technical properties of MPC materials and reducing the economic costs of materials. Yang et al. [16,17] found that the morphological, filling, and pozzolanic effects of FA enable MPC paste to have a dense initial structure, and that adding a proper amount of fly ash can improve the strength and the pore structure of the MPC paste. Xu et al. [18] demonstrated that the fluidity of MPC is enhanced with an increased percentage of silica fume (SF) and that the compressive and flexural strength of MPC at all ages initially increases, reaching its maximum when the SF is 15%. In addition, Zheng et al. [19] indicated that adding 15 wt.% FA and 10 wt.% SF to MPC paste yields a paste with a higher density and later-age compressive strength.
Due to the rapid setting and high early strength characteristics of magnesium phosphate cement, this material is often studied and applied to emergency repair and construction projects. However, as a highly brittle material, MPC can exhibit poor ductility, brittleness, and poor water resistance in a humid environment. Fiber inclusion is a simple and effective way to improve MPC’s ductility and toughness. Jean Péra et al. [20,21] used five different types of fibers to reinforce MPC for rapid repair and observed elastic–plastic bending behavior when polypropylene and metallic fibers were used. The experimental results of Qin et al. [22] suggest that the beneficial effects of basalt fibers on compressive strength begin to weaken after 1% fiber volume and that basalt-fiber-reinforced MPC offers better mechanical properties than glass-fiber-reinforced MPC. Some scholars have studied the corrosion resistance of MPC-based materials, such as their resistance to chloride ion erosion [23] and sulfate ion erosion [16,24], but research on the corrosion resistance of MPC matrix composites as a protective layer on the surface of reinforced concrete structures is rare.
In this paper, magnesium phosphate cement is used as a cementitious material, and additional materials including FA, SF, and reinforcing materials, including polyvinyl alcohol (PVA) fiber, glass fiber, and basalt fiber, are combined to form a magnesium phosphate cement matrix composite (MPCC). By referring to the research methods of relevant scholars [25,26], electrical flux experiments were carried out on MPCC specimens containing different admixtures or fibers. After that, an electrical flux experiment using a Portland cement mortar surface coated with different thicknesses of MPCC was conducted. Finally, a potentiostatic accelerated corrosion experiment was carried out to compare and analyze the corrosion resistance of the MPCC and Portland cement to a steel bar. With the above experimental results, we verified the protective properties of MPCC when used as surface coating materials for reinforced concrete structures.

2. Materials and Methods

2.1. Raw Materials

The main raw materials include overburning MgO powder and potassium dihydrogen phosphate. The MgO powder with a specific surface area of 225 m2·kg−1 was obtained by grinding electrical-grade magnesia for 30 min in a small ball mill. The electrical-grade magnesia was obtained from Haicheng City (China) and produced by melting natural magnesite in an electric arc furnace (over 1300 °C). The mean diameter of the electrical grade magnesia particles was 420–640 μm, and the MgO, CaO, and SiO2 contents in the particles were 96.8%, 1.33%, and 0.92%, respectively. Industrial grade potassium dihydrogen phosphate (KH2PO4), a columnar crystal with a grain size of 80/177–100/147 (mesh/μm), was obtained from Georgia legislature Chemical Company (Lianyungang, Jiangsu province, China). The composite retarder (CR) was made in the laboratory consisted of borax, sodium phosphate dibasic dodecahydrate, and inorganic chlorine salt.
In this experiment, the chloride ion permeation resistance of different admixtures to MPC materials was investigated. The selected admixtures included SF and FA, whose chemical compositions are shown in Table 1. Short-cut fibers such as PVA fibers, glass fibers, and basalt fibers, were added to the MPC material to enhance the crack resistance and toughness of the MPC material. The physical characteristics of the fibers used are listed in Table 2. Portland cement (OPC) mortar was used as the substrate for the MPC coating and as the contrast material for the MPC material protection steel bar experiment. The chemical composition of the P·O 42.5 Portland cement is shown in Table 1.
The research in [27] shows that the MPC mortar mixed with natural sand (NS) and manufactured sand (MS) has higher strength and a smaller shrinkage strain. Therefore, the NS and MS were mixed 1:1 and then used to mix the MPC mortar and OPC mortar designed by the experimental scheme. The NS was river sand with round grains, and the MS was a kind of artificial broken fine sand, which has rough particle surfaces and sharp corners. Table 3 lists the particle size composition and packing density of the two kinds of sand, from which coarse sand with a continuous gradation was formed after mixing.

2.2. Specimen Group and Material Mix Ratio
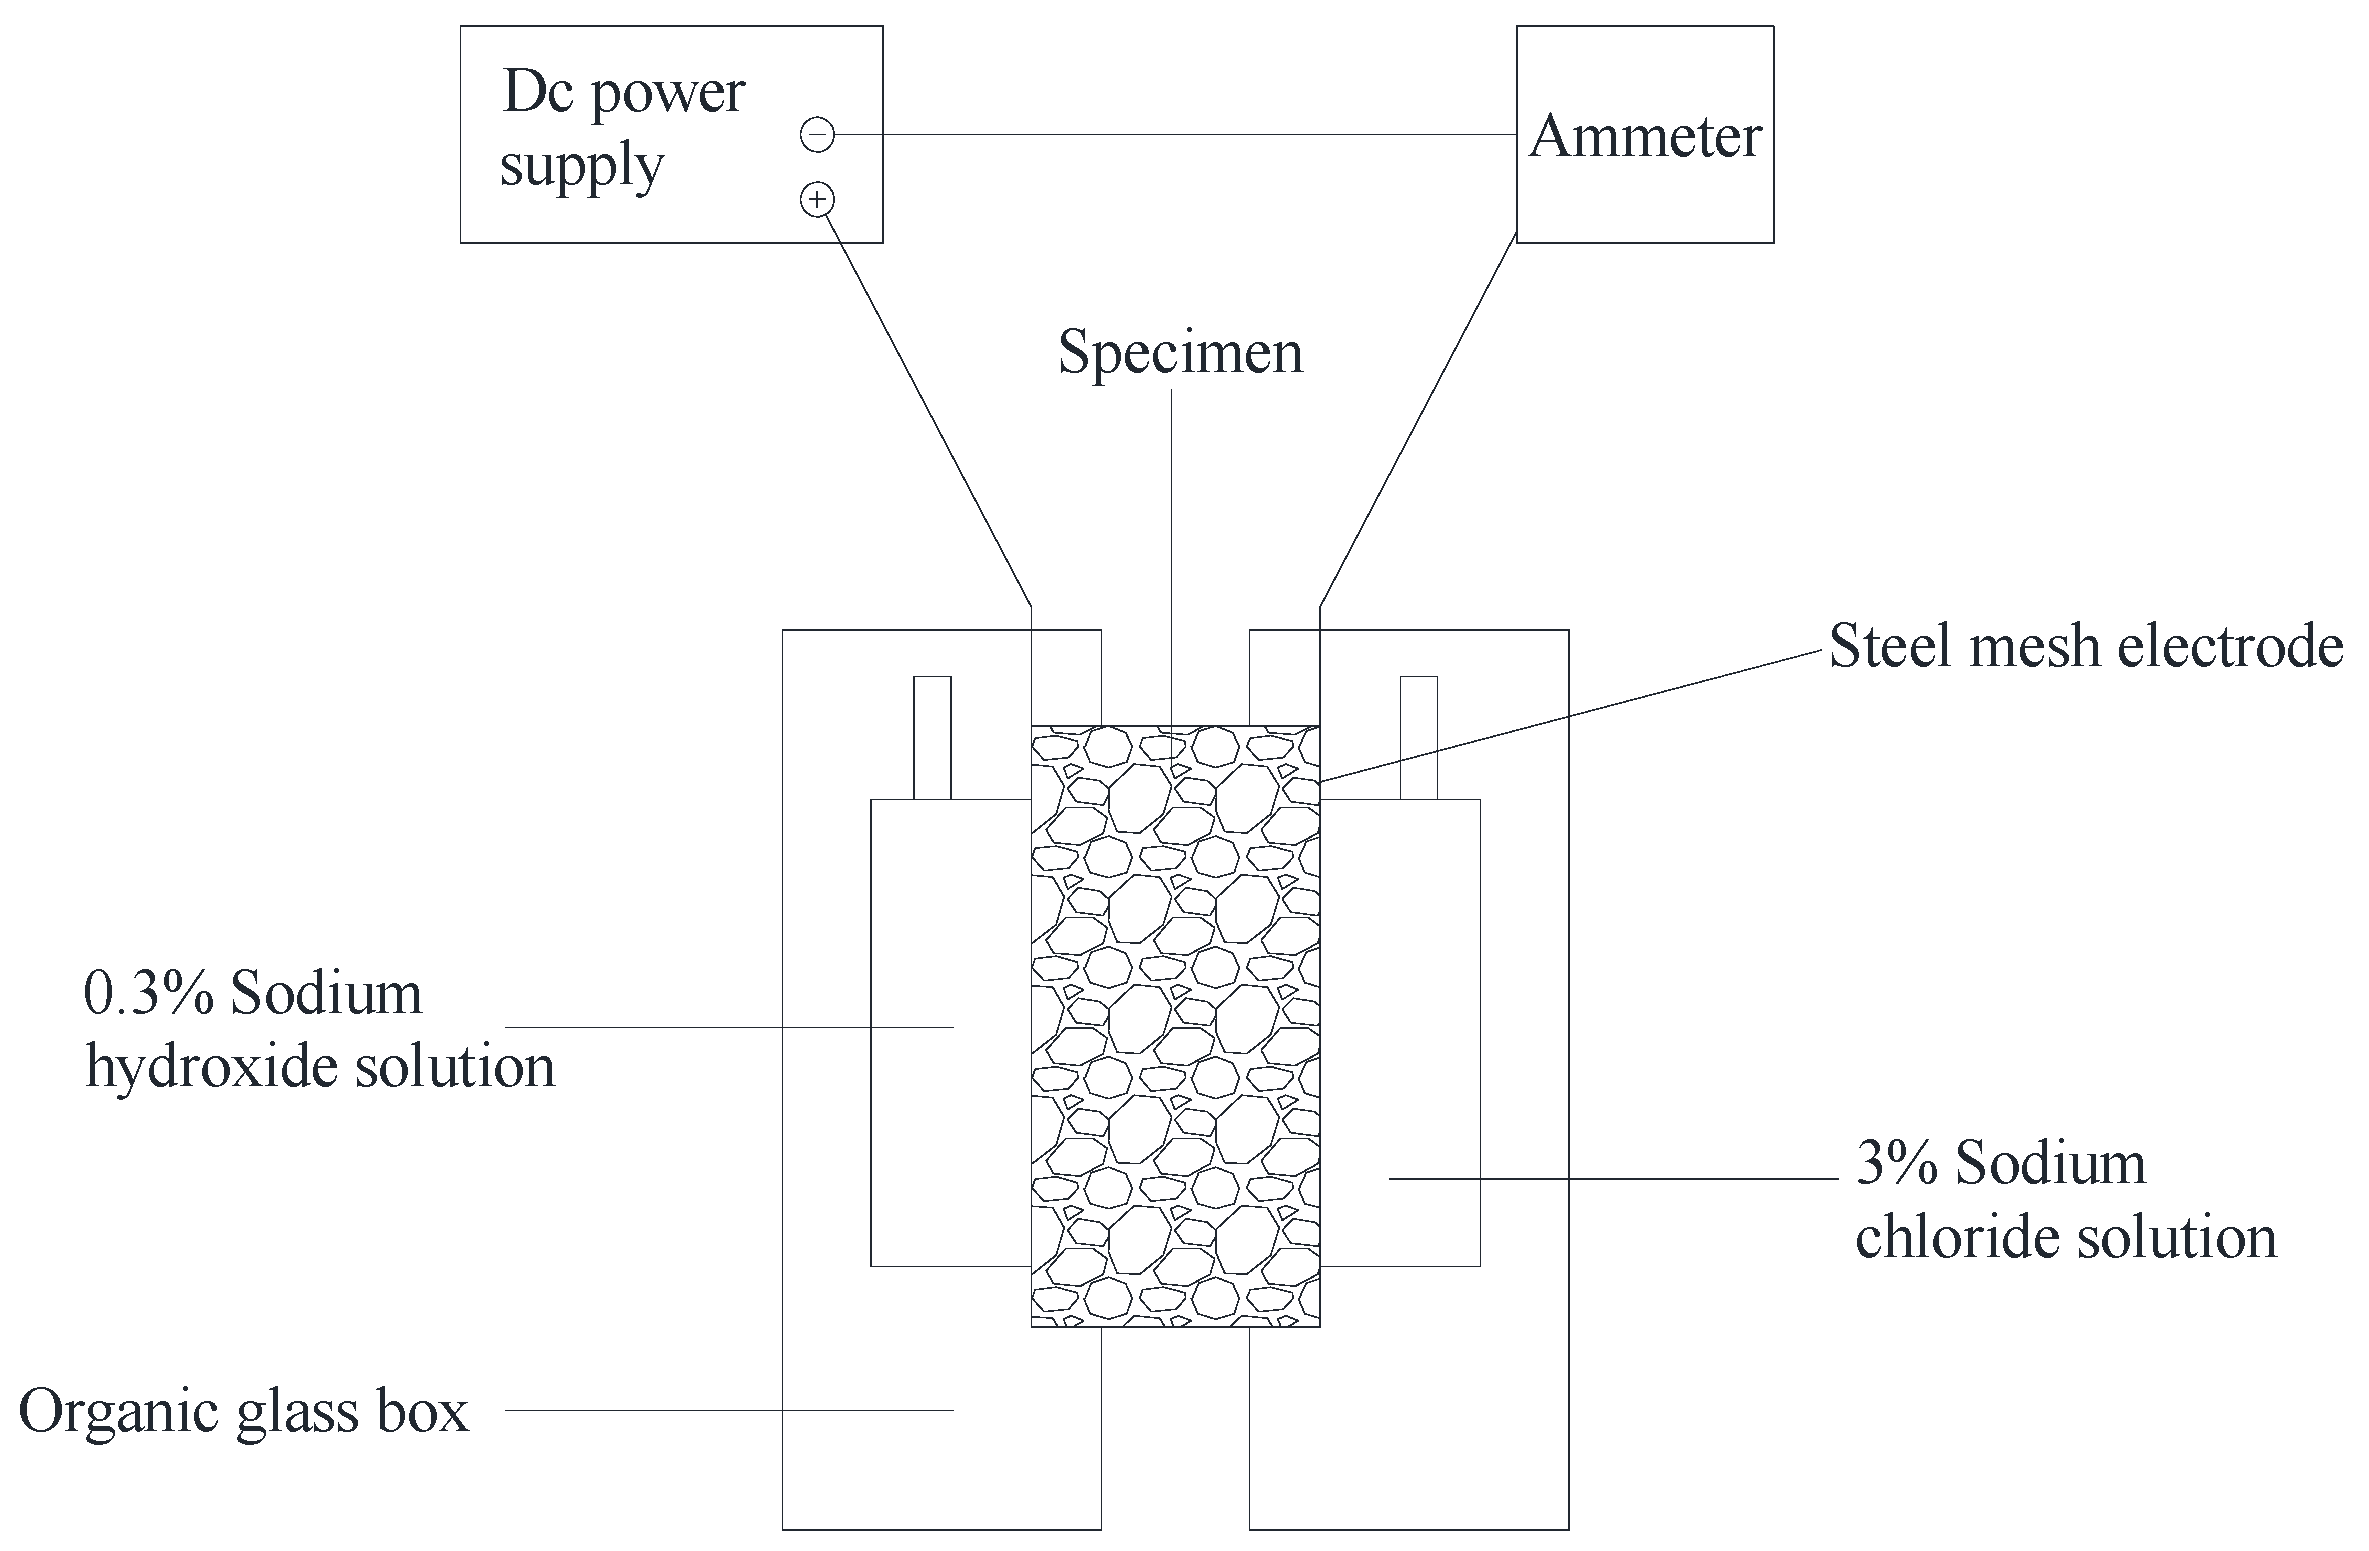
To explore the protective properties of MPC materials as surface coating materials for ordinary concrete structures, two types from among the 21 groups of specimens listed in Table 4 were designed for comparative experiments using the ASTM 1202 electrical flux experimental method. The first type of specimen was made of a single material and used in the flux experiment. The purpose of this experiment was to compare and analyze the chloride ion permeability of different mineral admixtures (Group B) and different fibers (Group C) to the MPC mortar and Portland cement mortar. The second type of specimen was designed to apply MPC materials with different thicknesses to the surface of the OPC mortar. Because the thickness of the standard specimen in the experimental method is 5 cm, all the MPC specimens were arranged in contact with the sodium chloride solution material. The total thickness of the MPC material and OPC mortar was controlled at 5 cm. The economic cost of the MPC mortar per unit volume is lower than that of the MPC slurry, but the MPC slurry can provide a thinner coating on the surface of the structure. Therefore, E groups of specimens were listed in this experiment to investigate the chlorine ion permeability of the Portland cement mortar surface coated with a thin layer of the MPC slurry.
Table 5 and Table 6 list the material mix ratios of the MPC materials and OPC mortar, respectively, for pouring the electrical flux experimental specimens. The mix ratio of MgO powder, KH2PO4, CR, sand, and water in the MPC materials was adjusted according to the previous experimental results [27]. The two kinds of mortar were designed according to the Chinese industry standard JGJ/T 98-2010 [28], and a pre-test was carried out ensure that the MPC mortar and OPC mortar were of the same strength grade range as much as possible. To make the comparison of chlorine ion permeability between the two mortars more reasonable, mineral admixtures and fiber admixtures were selected with reference to [18,19,20].
Figure 1 shows the measured flexural and compressive strength of the MPC mortar and OPC mortar in each group. In general, the compressive strength of the prepared MPC mortar and OPC mortar was distributed in the range of 35–45 MPa, and the flexural strength was distributed in the range of 9.5–11.5 MPa. Based on the test strength value, the change in flexural strength between the mortars with different mineral admixtures and poured fibers was small, but the compressive strength of the two kinds of mortar was obviously improved by mixing silica fume and fly ash, as well as glass fiber and basalt fiber.
The raw materials were weighed according to the ratios listed in Table 5 and Table 6 and then mixed using a mortar mixer. To ensure uniform dispersion of the fibers in the C group, the fibers were pre-mixed into aggregates and stirred for 5 min. PVC tubes with inner diameters of 100 mm and heights of 200 mm were used as the test molds for pouring the specimens. The middle parts of each specimen in the A, B, and C groups were cut into three specimens with heights of 50 ± 2 mm after curing indoors for 28 days for the parallel experiment in the electrical flux test. The OPC mortar specimens of the D and E groups were first cast as cylindrical specimens and were then cut according to the thickness outlined in Table 4 after 7 d of age. Then, the specimens were placed into a PVC pipe with an inner diameter of 100 mm and a height of 50 mm, and the MPC material was poured onto the Portland cement mortar to form a 50 mm thick laminated specimen. Each group of three specimens was cured at room temperature to 28 d age (for the OPC mortar), and then the electrical flux experiment was carried out.

2.3. Test Methods

The test principle of the electrical flux method is to draw the negative charge in the 3%NaCl solution to the positive electrode through the potential difference—that is, the amount of the chloride in the sample is characterized by the transmission of the current in the test process. The electrical flux was tested using an LC-8 electrical flux tester. Three-cylinder specimens were prepared for each group with a diameter of 100 mm and a height of 50 mm; then, they were cured for 28 days. Before the test, the side surfaces of the specimens were sealed, and then the specimens were placed into the water for a total of 18 h. The DC constant voltage used in this study was selected as 60 ± 0.1 V, and values of the current at the initial time and at every 5 min interval were recorded automatically by a computer for up to 6 h. The total electricity of each specimen was calculated using the following simplified equation:
Q = 900 ( I 0 + 2 I 30 + 2 I 60 + + 2 I t + + 2 I 300 + 2 I 330 + 2 I 360 )
where Q denotes the total electrical flux through a specimen (C, coulombs), I0 is the current (A, amperes) immediately after voltage applied, It is the current (A) at t min after voltage applied.
Conversion of the electrical flux between specimens with different diameters was performed in accordance with the following model:
Q g = Q X × ( 95 / x ) 2
where Qg denotes the total electrical flux through a 95 mm diameter specimen, Qx is the total electrical flux through a specimen with a diameter of x mm, and x is the diameter of a specimen.
Chloride ion penetration was evaluated in accordance with ASTM 1202 [29], as presented in Table 7.

2.4. Test Equipment

An LC-8 type concrete electrical flux tester (Time Aerospace Instrument Technology Co. Ltd., Beijing, China) was used in the experiment. As shown in Figure 2, the indoor air conditioning and humidifier-controlled indoor temperature was between 20 and 25 degrees, with humidity of 65%. The sample was wrapped around with wide tape for moisturizing.
The electrical flux method was applied to determine the chloride ion penetration resistance of the concrete by testing the electrical flux in concrete. The working principle is presented in Figure 3.

2.5. Micromorphology Test

After the electrical flux experiment, hydration samples the size of a nail were collected from the middle sections of the typical specimens and immersed in anhydrous alcohol for two days to stop further hydration. Then, the samples were vacuum-dried at 60 °C for 24 h. The micromorphologies of the MPC mortar and OPC mortar were analyzed by a QUANTA-200 environmental scanning electron microscope (FEI Company, Hillsboro, OR, USA). The samples were broken into bulks with particle sizes of 3–5 mm, and then a Mercury Intrusion Porosity analysis was performed using a Quantachrome Pore Master Autoscan-60 (Quantachrome Company, Boynton Beach, FL, USA).

3. Test Results and Analysis

3.1. Single Material

3.1.1. Influence of Admixture on Chloride Ion Penetration

Figure 4 presents the time–history curve of the current (in milliamperes) measured in the experiment. It can be seen that the amplitude of the current varied greatly in the experimental process. Because the experimental process was controlled by computer programs, the potential of 60 V was kept constant. Therefore, the fine holes in the mortar matrix made the negatively charged ions migrate to the cathode rather smoothly. Moreover, in the first 100 min, the movement of negative ions in the pores increased gradually, and the current gradually increased in the initial stage. As seen from the time–history curve of the current, mixing SF and FA can reduce the amplitude of the current in the mortar. The particle size of the SF is smaller than that of the FA. The micro aggregate effect of the SF thus makes the mortar matrix more compact and better for clogging the fine pores. The current value was obviously lower than that of the MPC mortar with powder coal ash, and the measured electrical flux is presented in Figure 5. It is also shown that the use of FA reduced the electrical flux of the MPC mortar and OPC mortar by 15.3% and 21.8%, respectively, while reductions of 64.4% and 36.3%, respectively, we observed when using the SF. Notably, the combined use of SF and FA reduced the electrical flux of the MPC mortar and OPC mortar by 79.6% and 59.1%, respectively, showing a better permeability effect. This is because a better graded mixed micro aggregate was formed when using a combination of SF and FA, which helped reduce the connective pores and clog the fine pores.
The effects of SF and FA on the electron potency of the MPC mortar and OPC mortar were compared, and the comparison results are presented in Figure 4 and Figure 5. According to the criteria listed in Table 3, the Cl permeability of the MPC-based materials was very low, while SF reduced the Cl permeability of the silicate mortar. In addition, the Portland cement mortar was 1.83 times more plentiful than the MPC mortar, but the electrical flux was reduced by about 4.70 times after mixing in the SF and pulverized coal.
After the electrical flux test, the specimens were immediately split and sprayed with an AgNO3 solution at a concentration of 0.1 mol/L. The appearance of the specimens is shown in Figure 6. The cross section of OPC mortar along the thickness of the cement mortar features white AgCl precipitation, and the OPC mortar section with admixture is white-stratified. The stratified powder coal was relatively thick, with hardly color across the section of MPC-based materials because of the presence of phosphate ions. Therefore, the electrical flux method is more suitable than the RCM method (using a silver nitrate indicator to distinguish chloride permeability) to test the chloride permeability resistance of magnesium phosphate cement.

3.1.2. Influence of Fiber on Chloride Ion Penetration

Figure 7 shows the effects of three kinds of fibers, including PVA fiber, glass fiber, and basalt fiber, on the electrical current in the electrical flux experiment of the MPC-based material. The trend of the current development curve shows that the currents of the PVA fiber and MPC mortar were relatively large, while the current of the basalt fiber and MPC mortar was relatively small. The characteristics of the current change show that the MPC hardened body quickly reached a relatively stable current value at the beginning of the electrifying stage but was different from the MPC mortar without fibers, which experienced a development process featuring the gradual opening of fine pores and an increase in current value. It can be seen that the addition of fibers increased the number of pores and capillary pores in the hardened MPC mortar, which made the anion move smoothly due to the potential difference.
The measured data in Figure 7 and Figure 8 show that the electrical flux of the MPC mortar and OPC mortar increased by 2.08 times and 3.24 times, respectively, after adding 1% volume of PVA fiber and increased by 41.9% and 4.22 times, respectively, after adding the glass fiber. After adding the basalt fiber, the electrical flux increased by 10% and 2.18 times, respectively. Here, the ratio of bone glue in MPC decreased by 0.25, which fully ensured the wrapping and filling of the voids in the glass fibers, but the ratio of bone glue to OPC mortar was not adjusted. Therefore, the saturation of the mixture was relatively poor, and an increase in fine pores and a relatively high electrical flux were also introduced.

3.2. Bilayer Material

MPC has a high bonding strength with concrete, but as a concrete structural repair material, the penetration resistance ability of the composite material should be tested to explore its corrosion resistance. For that reason, further analysis of the chloride icon penetration resistance of the MPC–OPC composite material was conducted. The experimental plan is shown in Table 1. The specimen preparation method was as follows: (1) mix and cast the OPC mortar for the 100 mm diameter OPC mortar cylinder specimens; (2) demold the specimens after a day and cure them in a standard curing box for 7 days; (3) cut specimens to the designed thickness; (4) place the specimens into a PVC mold (50 mm height; 100 mm diameter) and cast the MPC mortar in the mold; (5) demold the specimen after a day and cure it for 28 days, testing the electrical flux immediately afterward, as shown in Figure 9.

3.2.1. Influence of MPC Mortar Thickness on Chloride Icon Penetration

Figure 10 was drawn according to the tested current value. This figure demonstrates that casting 1 cm MPC mortar using the OPC slurry can significantly decrease the current, while an increase in MPC mortar thickness can produce a further decrease in the current. Unlike the single material, an increase in the power time will result in a distinct decrease in the current through the bilayer material. The MPC mortar with a thickness of 1 cm decreased the current by 36%. As the thickness of the MPC mortar increased, the descending rate of the current decreased.
The measured data in Figure 10 and Figure 11 show that the 1cm thick MPC mortar coating significantly reduced the electrical flux of the laminated material by 36.0%. With an increase in the MPC mortar thickness, the decrease in the electrical flux was relatively small (the flux was reduced by about 5% with every increment in the thickness of the MPC mortar). Figure 12 shows photos taken after splitting the test piece and spraying the pieces with silver nitrate developed after the experiment. It can be seen from Figure 12 that the amount of Cl¯ that infiltrated into the OPC mortar significantly decreased with the addition of MPC mortar. Of course, a small amount of phosphate ions in MPC mortar may penetrate into the OPC mortar matrix. Therefore, after spraying silver nitrate chromogenic agent on the section of the specimen, the white precipitate on the OPC mortar surface may be silver chloride precipitation or silver phosphate precipitation.

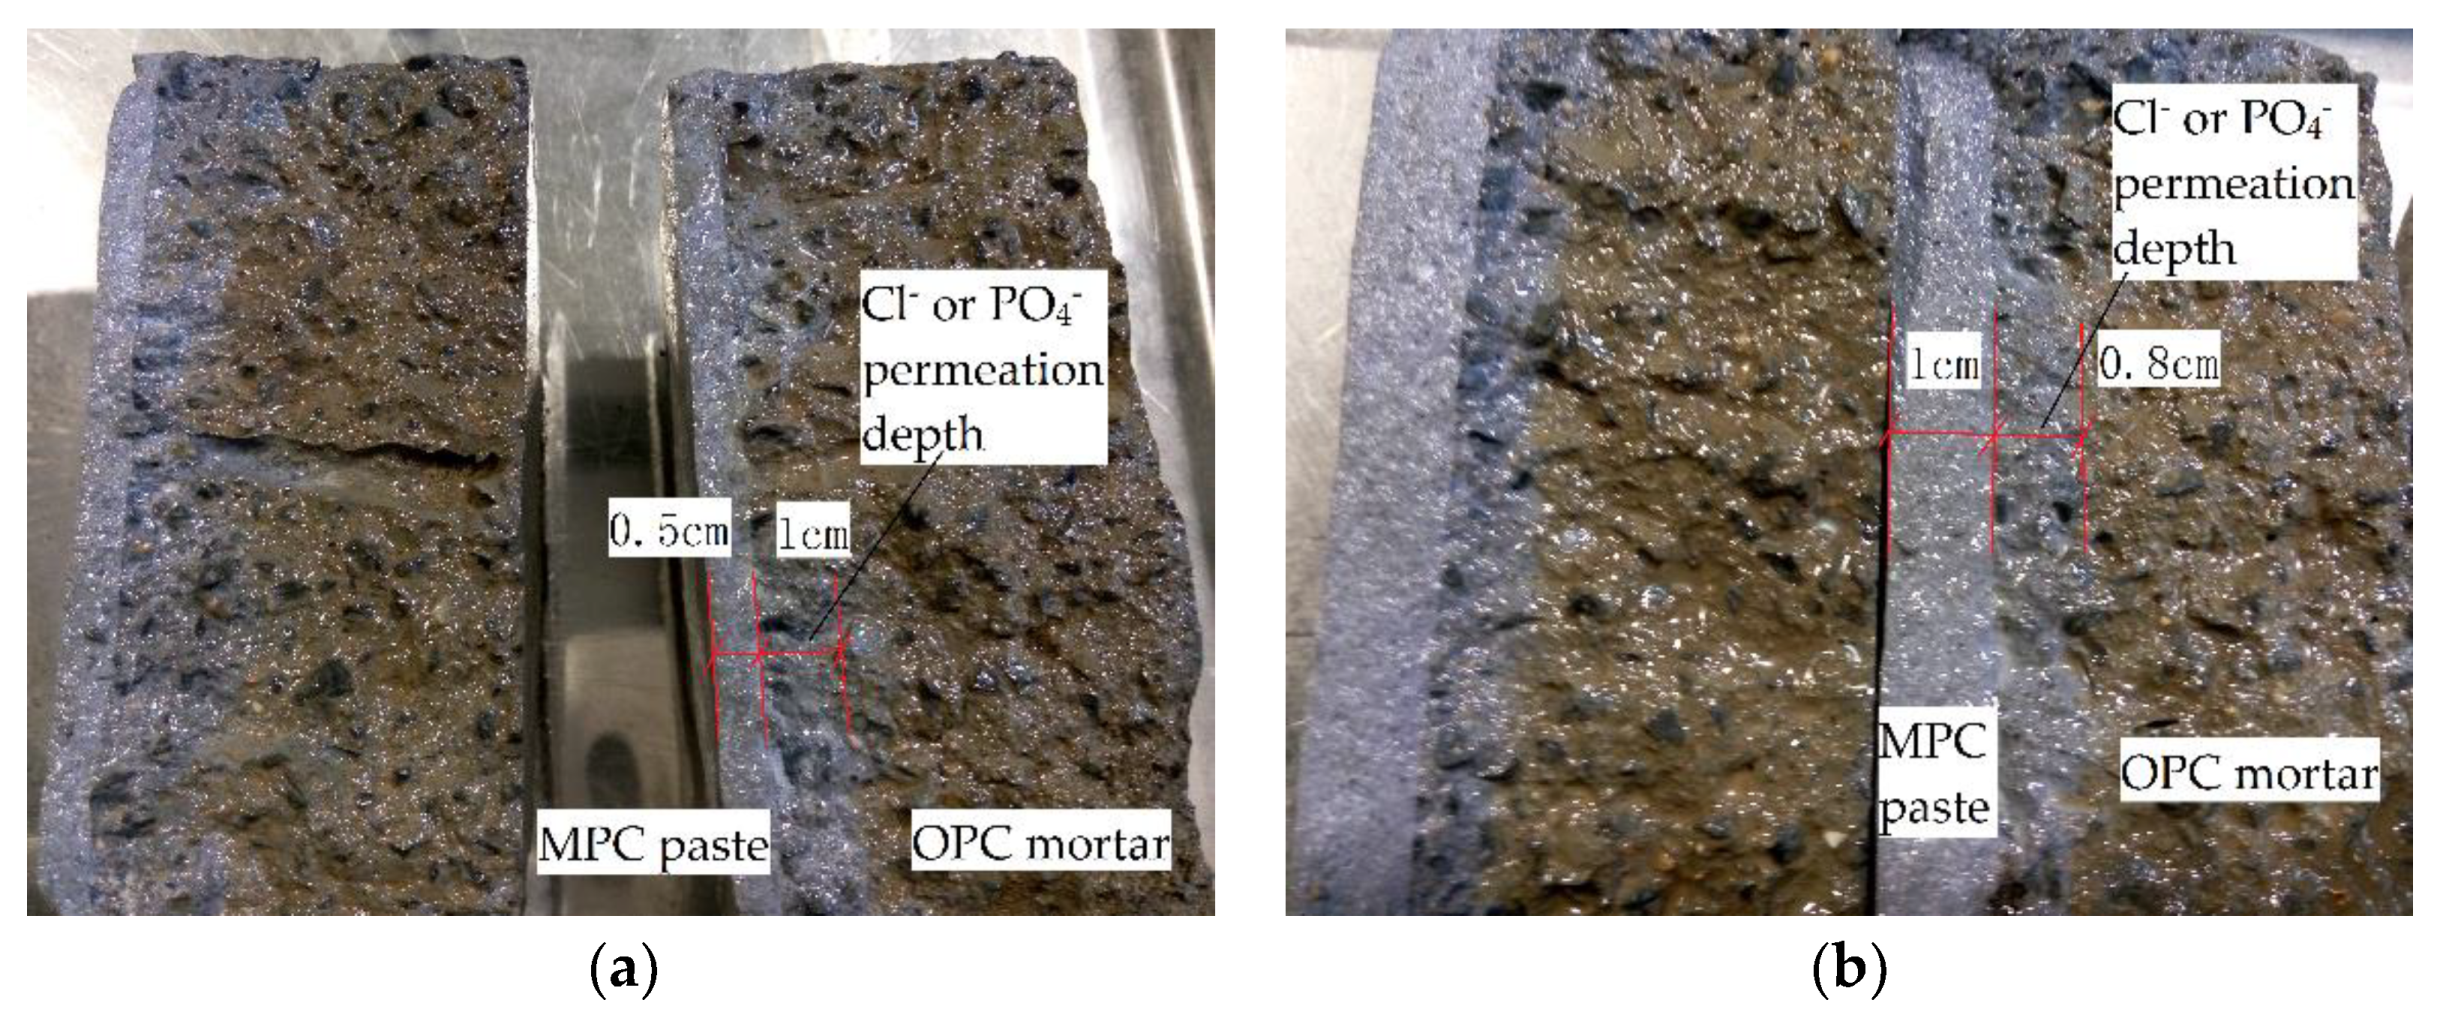
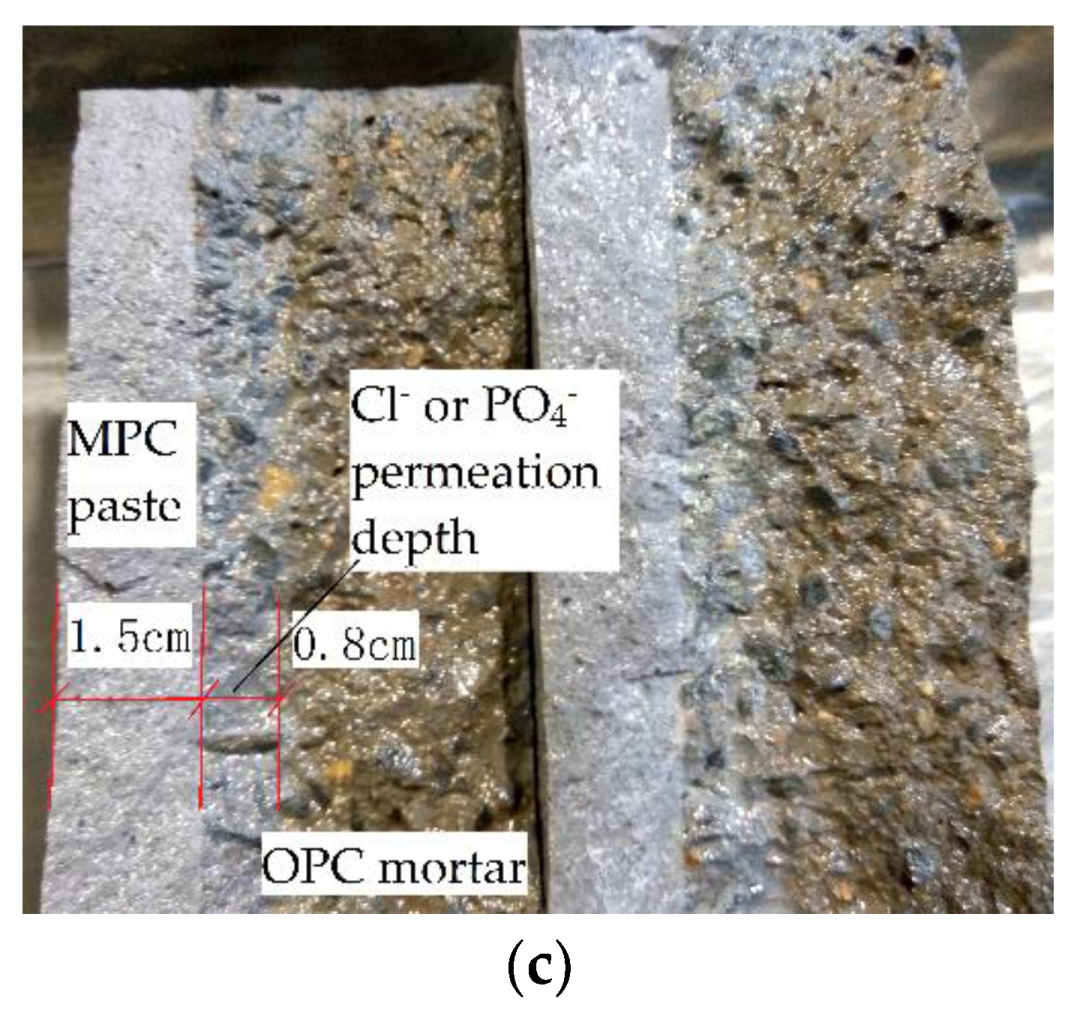
3.2.2. Influence of the MPC Paste Thickness on Chloride Icon Penetration

The current curves for the MPC paste were similar to those for the MPC mortar. Specifically, the current first increased and then decreased with the power time. The 5 mm MPC paste resulted in a 30% decrease in the current, and the 10 mm paste caused an 80% decrease. When the thickness of the MPC paste varied from 10 to 15 mm, the current decreased slightly. Figure 13 and Figure 14 indicate that the 5, 10, and 15 mm MPC paste caused a decrease in electrical flux by 40.2%, 84.2%, and 88.2%, respectively. The electrical flux of the OPC mortar with 10 mm MPC paste was about 24.5% that of the single MPC mortar and 11.8% that of the single OPC mortar, demonstrating the excellent performance of the MPC paste in resisting chloride icon penetration. The preparation method for specimens with MPC paste was the same as that used for the MPC mortar, with the thickness of MPC paste being 5, 10, and 15 mm, as shown in Figure 15. Similar to the case shown in Figure 12, the white precipitate appearing on the surface of the OPC mortar may be silver chloride precipitation or silver phosphate precipitation. However, compared with Figure 12a, the MPC net pulp coating hindered the chloride ion penetration in OPC mortar.

3.3. Microstructure Analysis
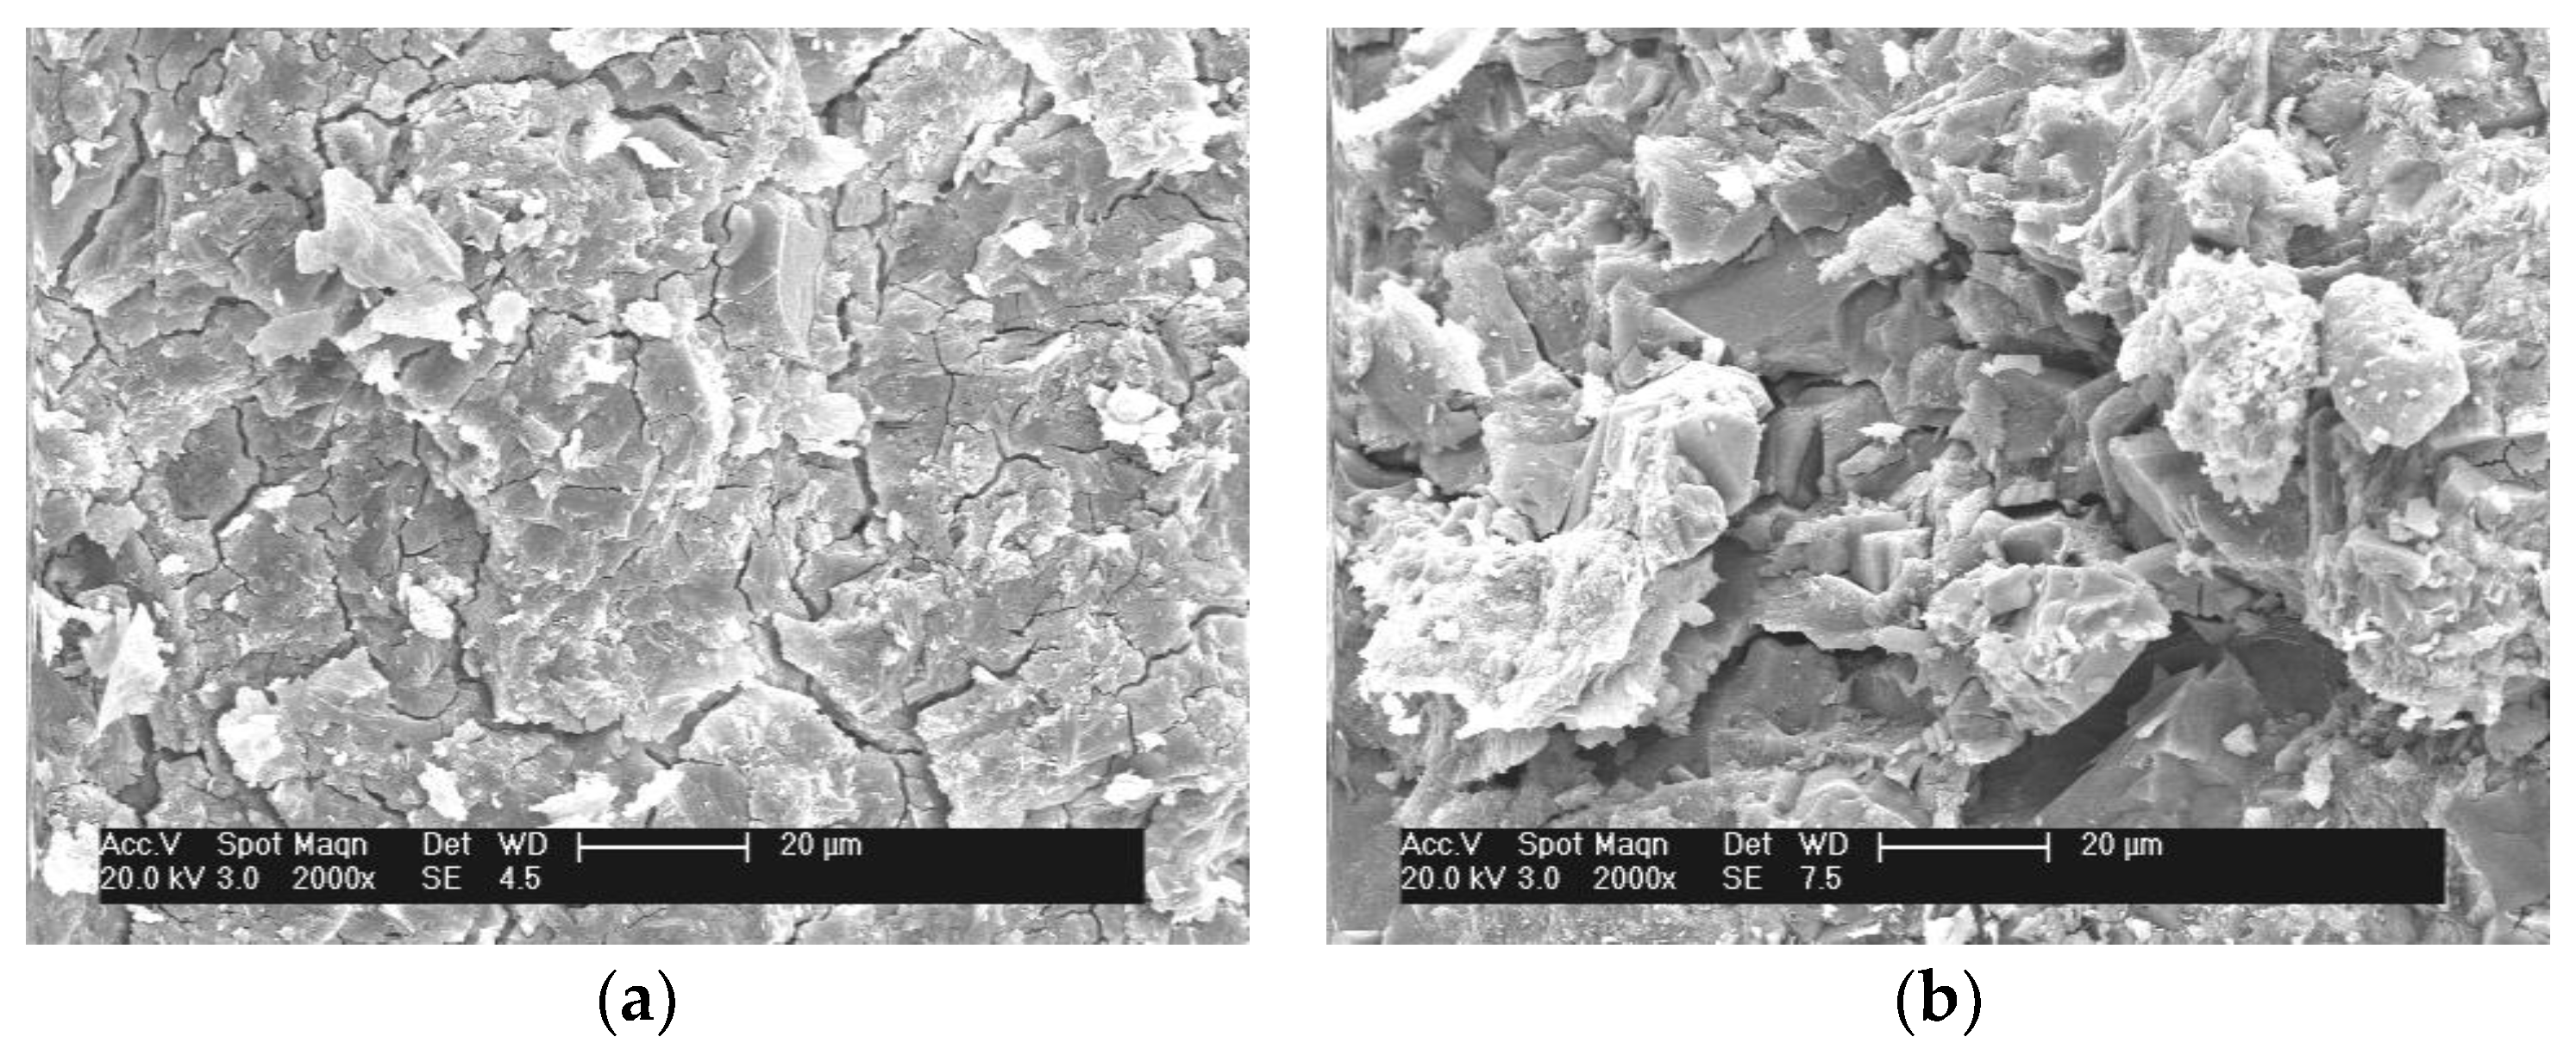
3.3.1. SEM

The residual body of a typical specimen was selected for SEM analysis, and the mechanism of resistance to Cl penetration of the MPC material and OPC material was further compared and analyzed. Figure 16a,b illustrates the micromorphology of the MPC slurry and OPC slurry. The hydration products of the MPC cement have a compact, flakey structure and a small gap, while the microstructures of the hydration products of OPC are relatively loose, with a significantly larger pore size than that of the MPC. Figure 16c,d shows the interface morphologies between the cement paste and the aggregate. Obviously, the MPC paste closely combined with the aggregate, and its interface fissure was much smaller than the interface gap between the OPC paste and the aggregate. Figure 16e shows the interface morphology of the MPC paste and PVA fiber, while Figure 16f illustrates that of the OPC paste. The MPC slurry was tightly wrapped around the fiber, while the OPC slurry was not tightly bound to the fiber interface because the slurry was not dense enough. Moreover, the water-to-cement ratio of the MPC mortar was 0.18, while that of the OPC mortar was 0.45. Excessive free water in the OPC mortar is one of the reasons for the mortar’s microstructural shortness. By comprehensively comparing the two, the compactness of the MPC material was shown much better than that of the OPC material. The MPC’s capillary void was much smaller, and its resistance to Cl permeation was better.

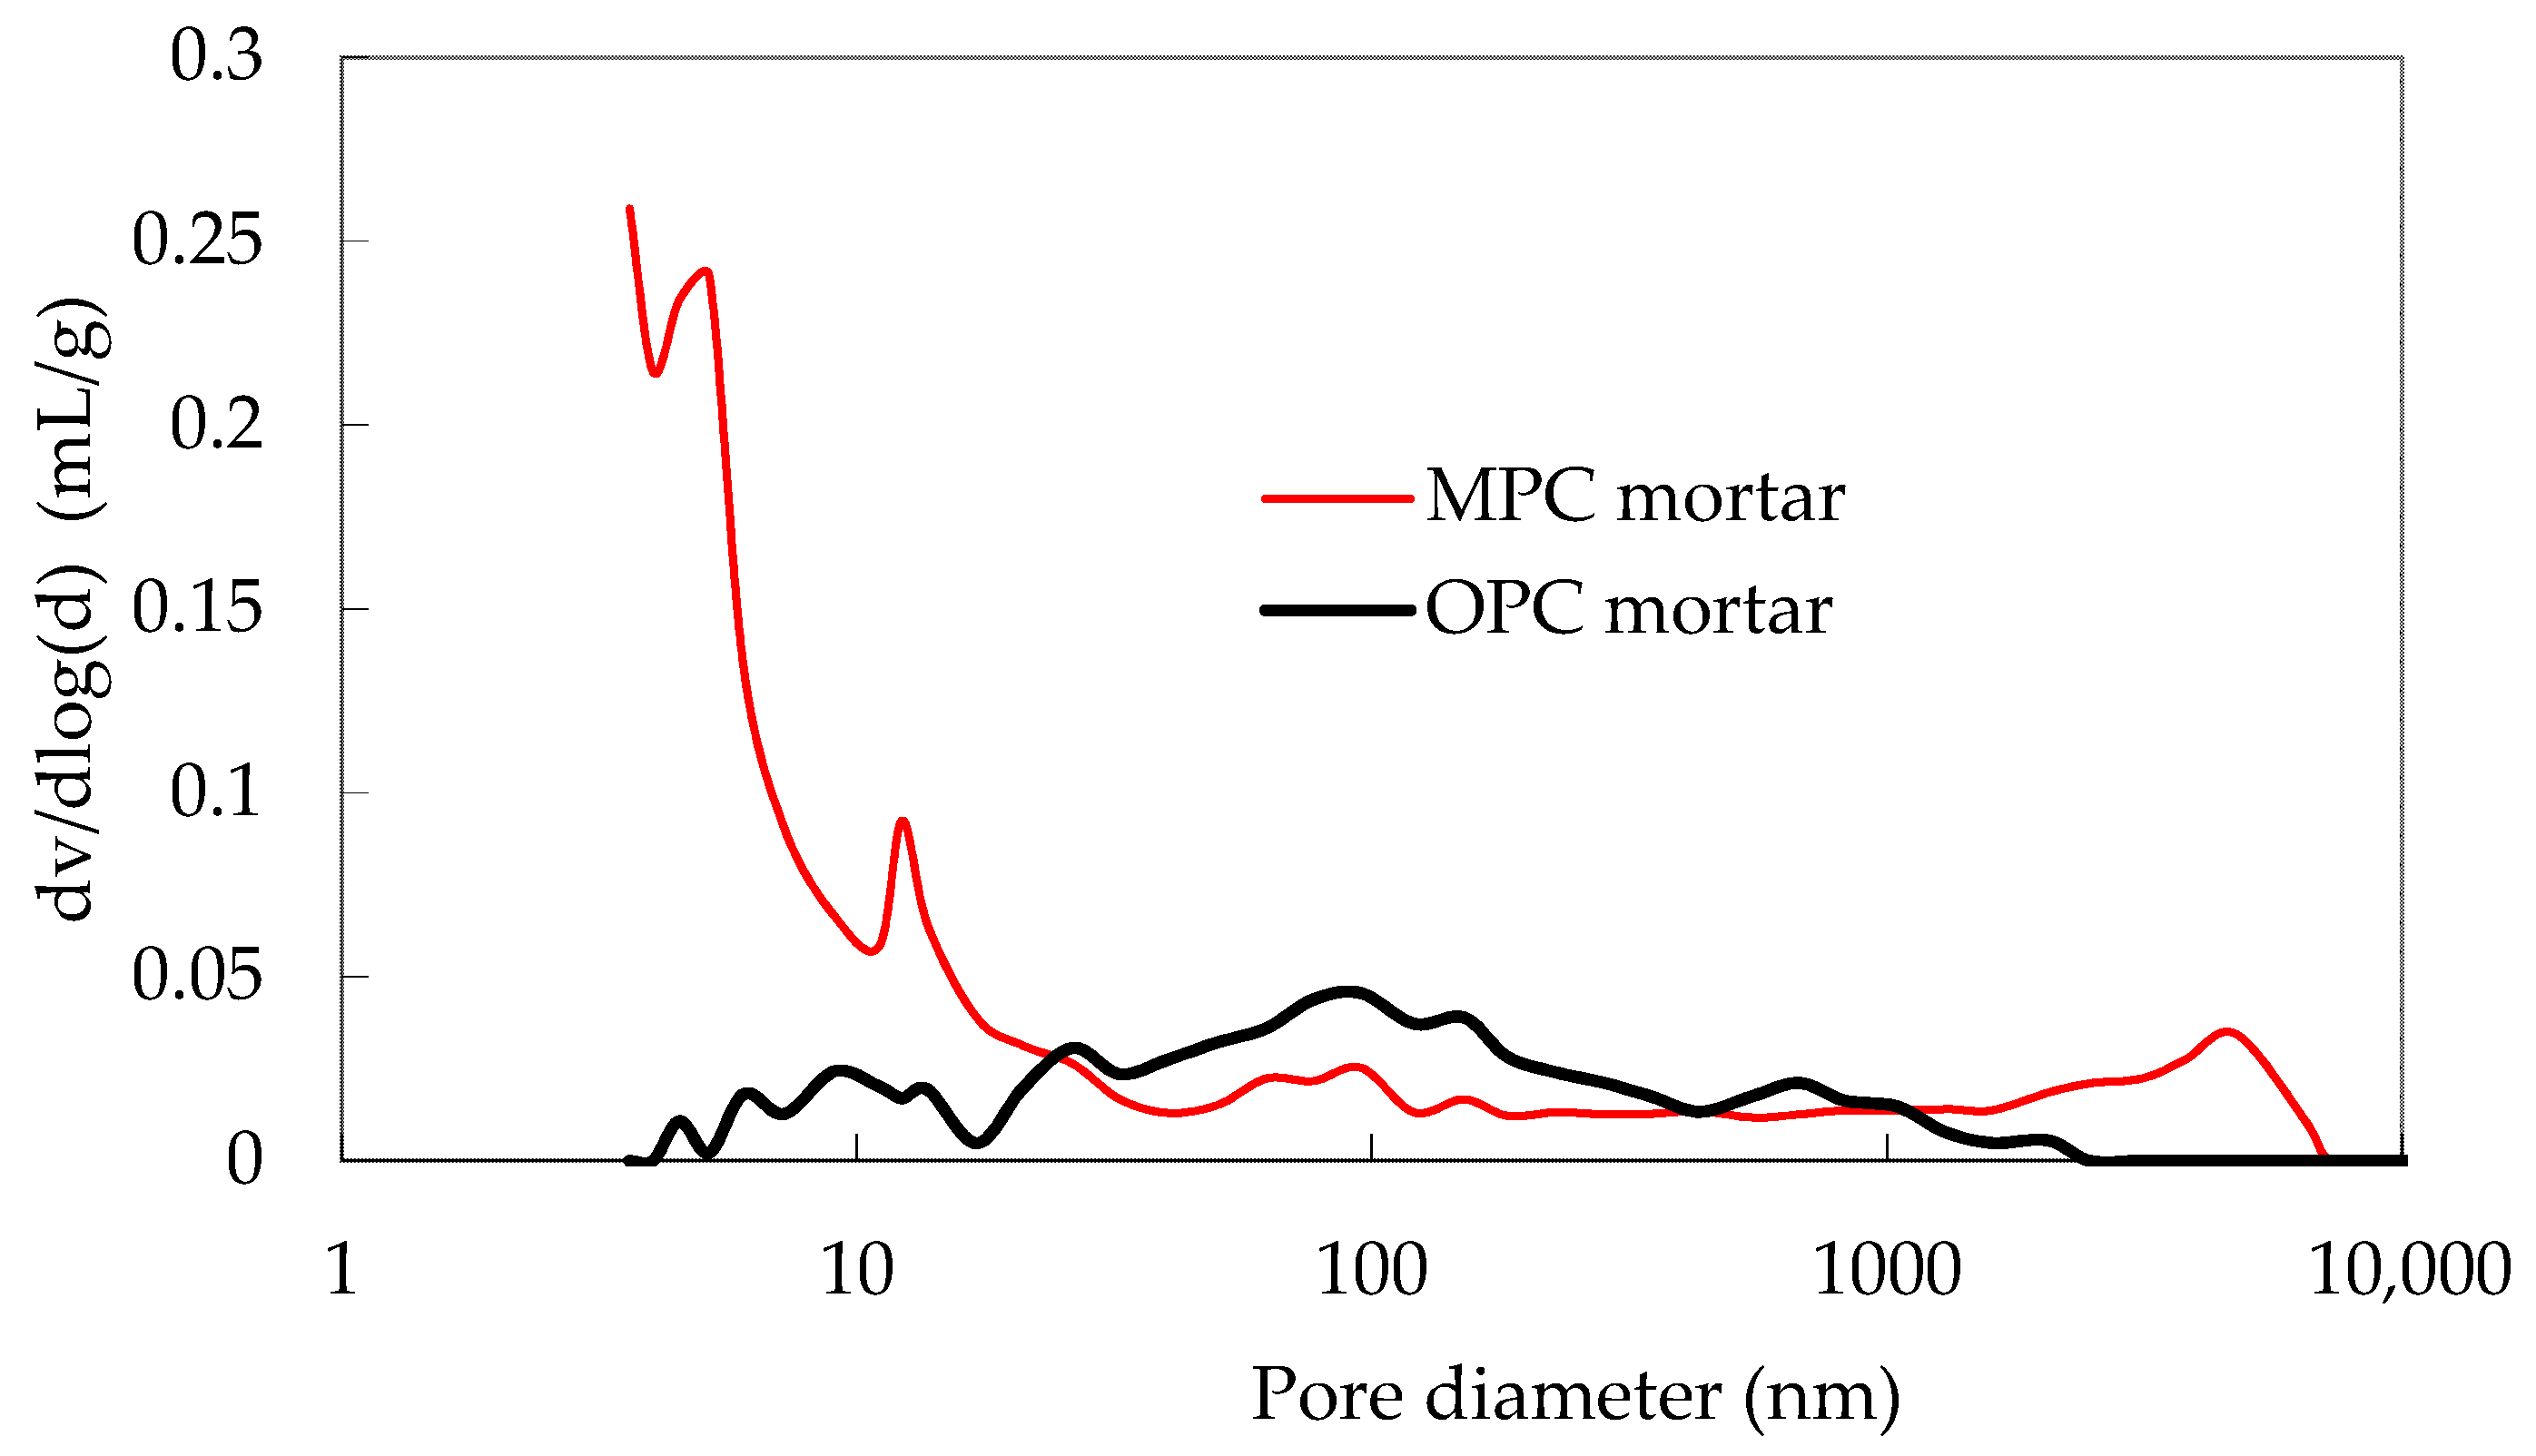
3.3.2. Mercury Intrusion Porosimetry (MIP)

The permeability of chloride ions in cement-based materials is closely related to the pore structures of such materials. Table 8 and Figure 17 show the MIP test results for MPC mortar and OPC mortar. Gaitero et al. [30] divided the holes in the pulp after dissolution into three grades, hazardous holes greater than 1000 nm, harmful holes of 100–1000 nm, and less harmful holes of 100 nm, and used these grades to evaluate the distribution characteristics of the pore structure of cement-based materials after dissolution. The volume ratio of the harmful pore sizes of the MPC mortar and OPC mortar were 34.28% and 86.54%, respectively. Thus, the pore structure of the MPC mortar was obviously better than that of the OPC mortar, making the former more favorable to resist penetration from an erosion medium than the latter.

4. Accelerated Corrosion Test

4.1. Sample Preparation

The porosity of the cement matrix material and its anti-permeability have an important influence on steel corrosion in the concrete. As described in the relevant literature, magnesium phosphate cement Portland cement-based materials have better anti-permeability against Cl. The protective performance of magnesium phosphate cement-based materials for steel reinforcement with MPC mortar and P·O 42.5 embedded in a mortar bar corrosion experiment is studied in this section.
According to the experimental results of Jianming’s mixture ratio design for magnesium phosphate cement-based materials, the potentiostatic accelerated corrosion grouping method, as shown in Table 9, was used to compare the protective properties of magnesium phosphate cement-based materials for steel reinforcement.
The rebar to be measured was fixed by brackets on both sides, as shown in Figure 18a. For the corrosion of round steel bars with Ø10, it was first placed in a 12% hydrochloric acid solution and rinsed with water after neutralization with lime water; then, it was rinsed with water, dried, and stored in a desiccator for at least 4 h. Each component was made according to the ratios shown in Table 4, Table 5 and Table 6. After mixing the mortar, we immediately fabricated the test piece, and each group had a total of three pieces. The mortar samples were released from day 1, and resin seals were applied to the upper and lower bottoms of the specimens. Additionally, silicone rubber seals were used to seal the reinforcement root, thereby ensuring that the erosion medium penetrated from the side of the cylindrical specimen. Then, the specimen was placed under indoor moisture conservation maintenance, as shown in Figure 18b. Next, an accelerated corrosion test was carried out on these specimens after 28 d.

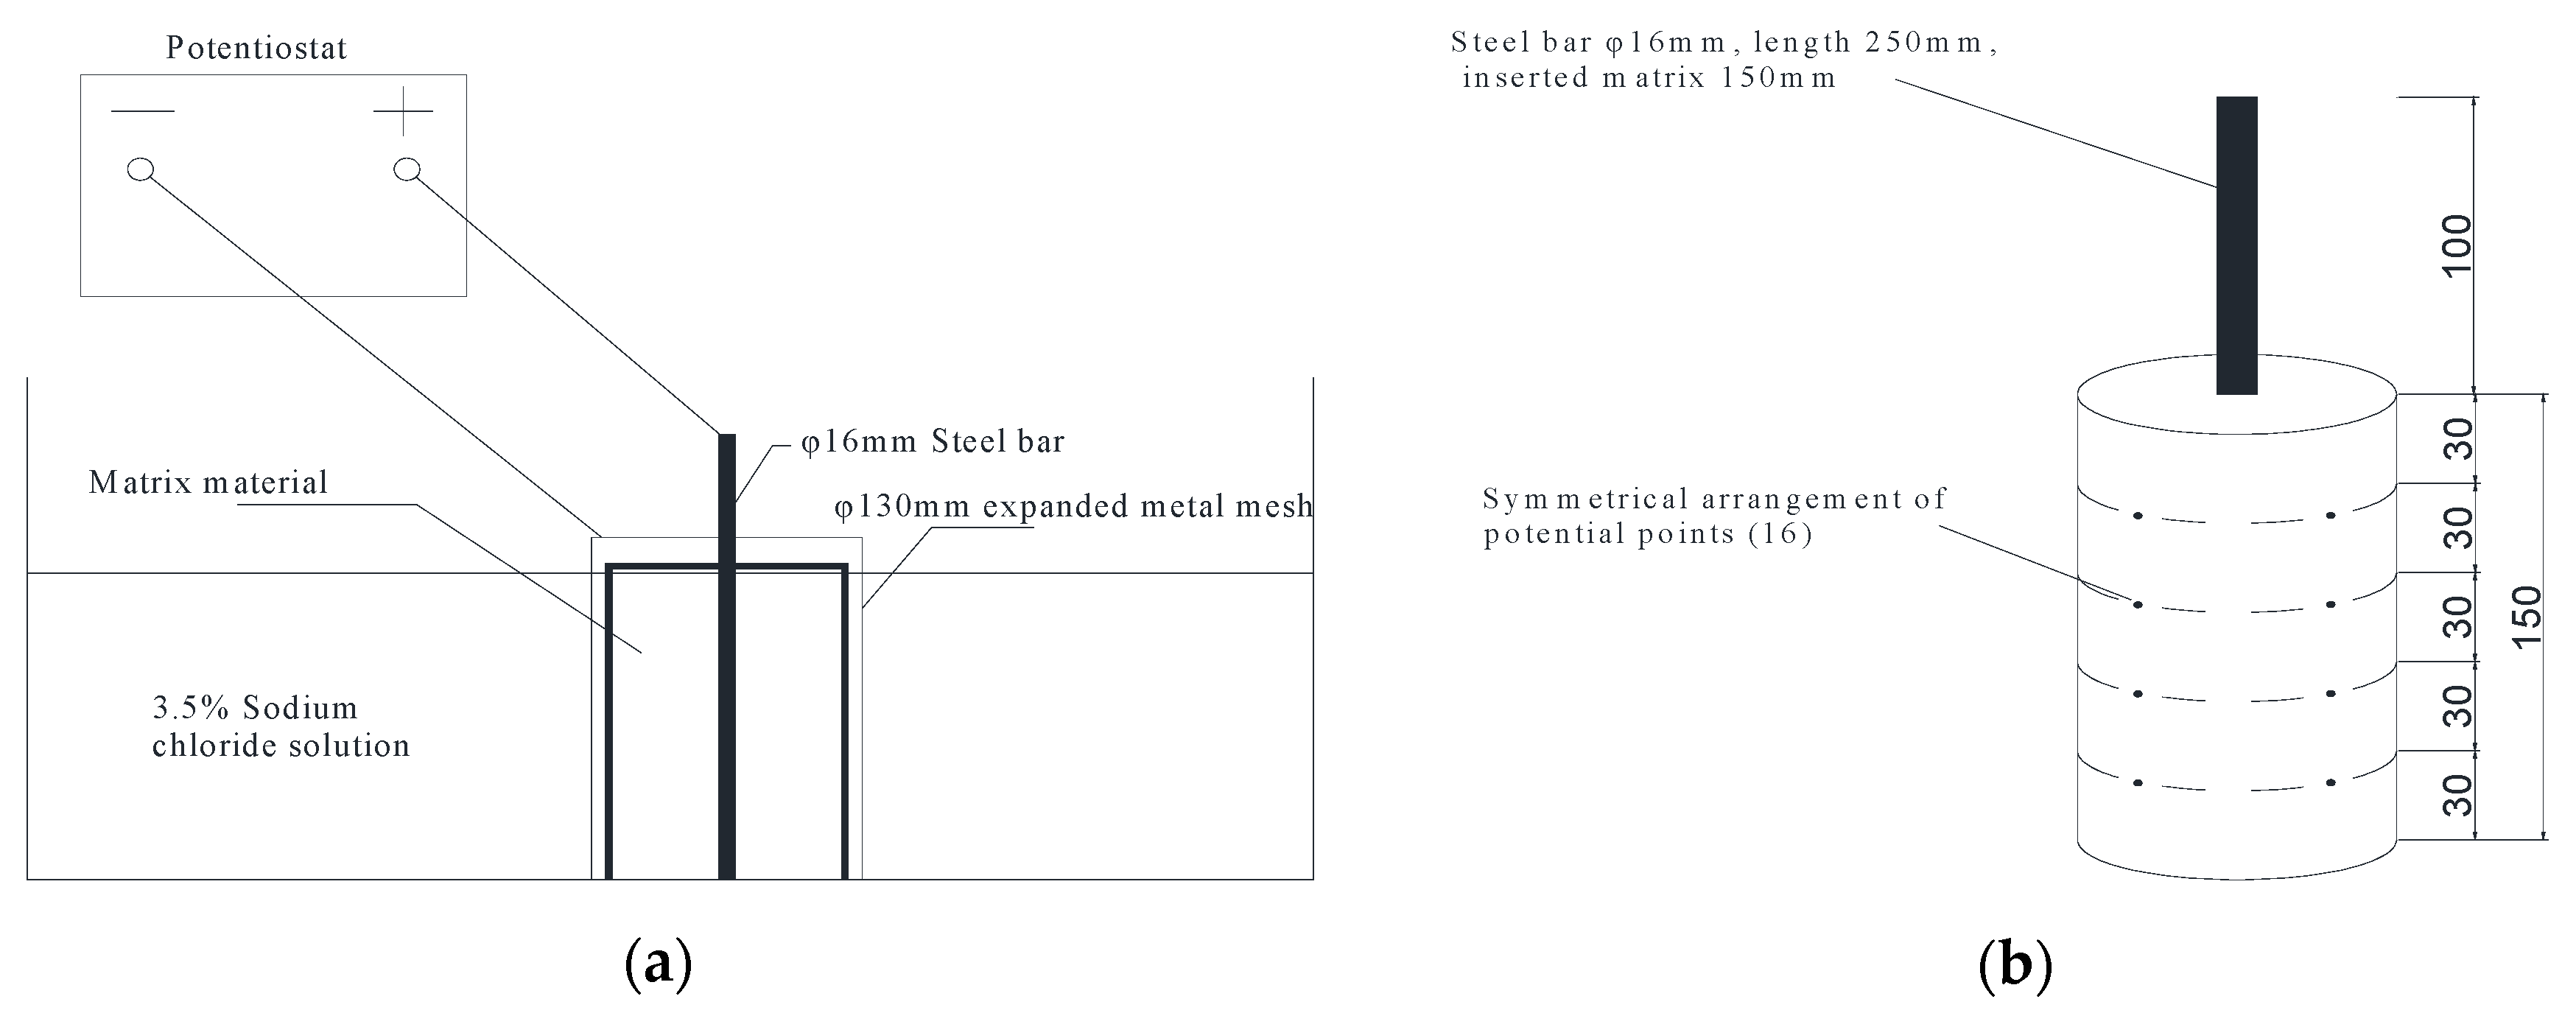
4.2. Experimental Method

Using a microcomputer-controlled potentiometer, we tested the accelerated corrosion of the specimens shown in Figure 19 with a diameter of 100 mm, a height of 150 mm, and the central insertion of a 10 mm bar. The experiment was controlled with a constant voltage of 30 V. We collected the current value every 5 min and calculated the electrical conductivity. Eventually, the matrix cracked due to the corrosion of the steel bar, and the experiment ended when the crack width was 0.2 mm.
Using a crack observation instrument, the influence of different fibers on the reinforcement performance of the MPC mortar and the reinforcement effect between MPC-based materials and Portland cement-based materials was assessed through a comparative analysis of the development process of the cracks.
The current value measured by the potentiometer was regularly collected by a microcomputer. The penetration state of the erosive media in the matrix can be understood through the development trend of the current. The mutation of the current reflects the time point of corrosion and the expansion and cracking of the matrix. Before the matrix cracked, the specimen mainly showed apparent rust and corrosion according to the R61 steel corrosion assessment instrument used to test the half-cell potential value, as shown in Figure 19. The judgement method was applied according to ASTM C876-91, the corrosion potential was greater than −126 mv, and the steel corrosion probability was less than 10%. Corrosion potential between −126 and −276 mv was used to determine the steel corrosion probability, which ranged from 10% to 90%. The corrosion potential between −276 and −426 mv determined a corrosion probability greater than 90%. Corrosion potential less than −426 mv indicated serious corrosion.
The crack width was tested using a ZLB-800 type crack comprehensive tester. During the experiment, we observed and recorded the initial crack time caused by the corrosion of steel bar. With the development of corrosion time and crack width, we also recorded the continuous corrosion time and the number of cracks produced when the maximum crack width reached 0.2 mm.
The experimental device, as shown in Figure 20, was soaked in a NaCl concentration of 3.5%. The steel wire mesh of the stainless-steel wire was connected to the positive pole of the potentiometer, and the negative electrode was connected to the stainless-steel wire mesh ring to form the corrosion electric field.

4.3. Test Results and Analysis

4.3.1. Specific Test

The specimen potentials tested by the half-cell method are shown in Figure 21. The characteristics of the potential curve demonstrate that as the corrosion time increased, the potentials of the OPC slurry decreased, and corrosion probability increased, while the potentials of the MPC slurry increased. The initial potential of the MPC material was −200 to −400 mV. However, the steel did not corrode at first. With an increase in electrical time, the surface of the steel in the MPC material formed a non-conducting iron phosphate film, which increased the corrosion potential. From this perspective, electricity can improve the corrosion resistance ability of steel.

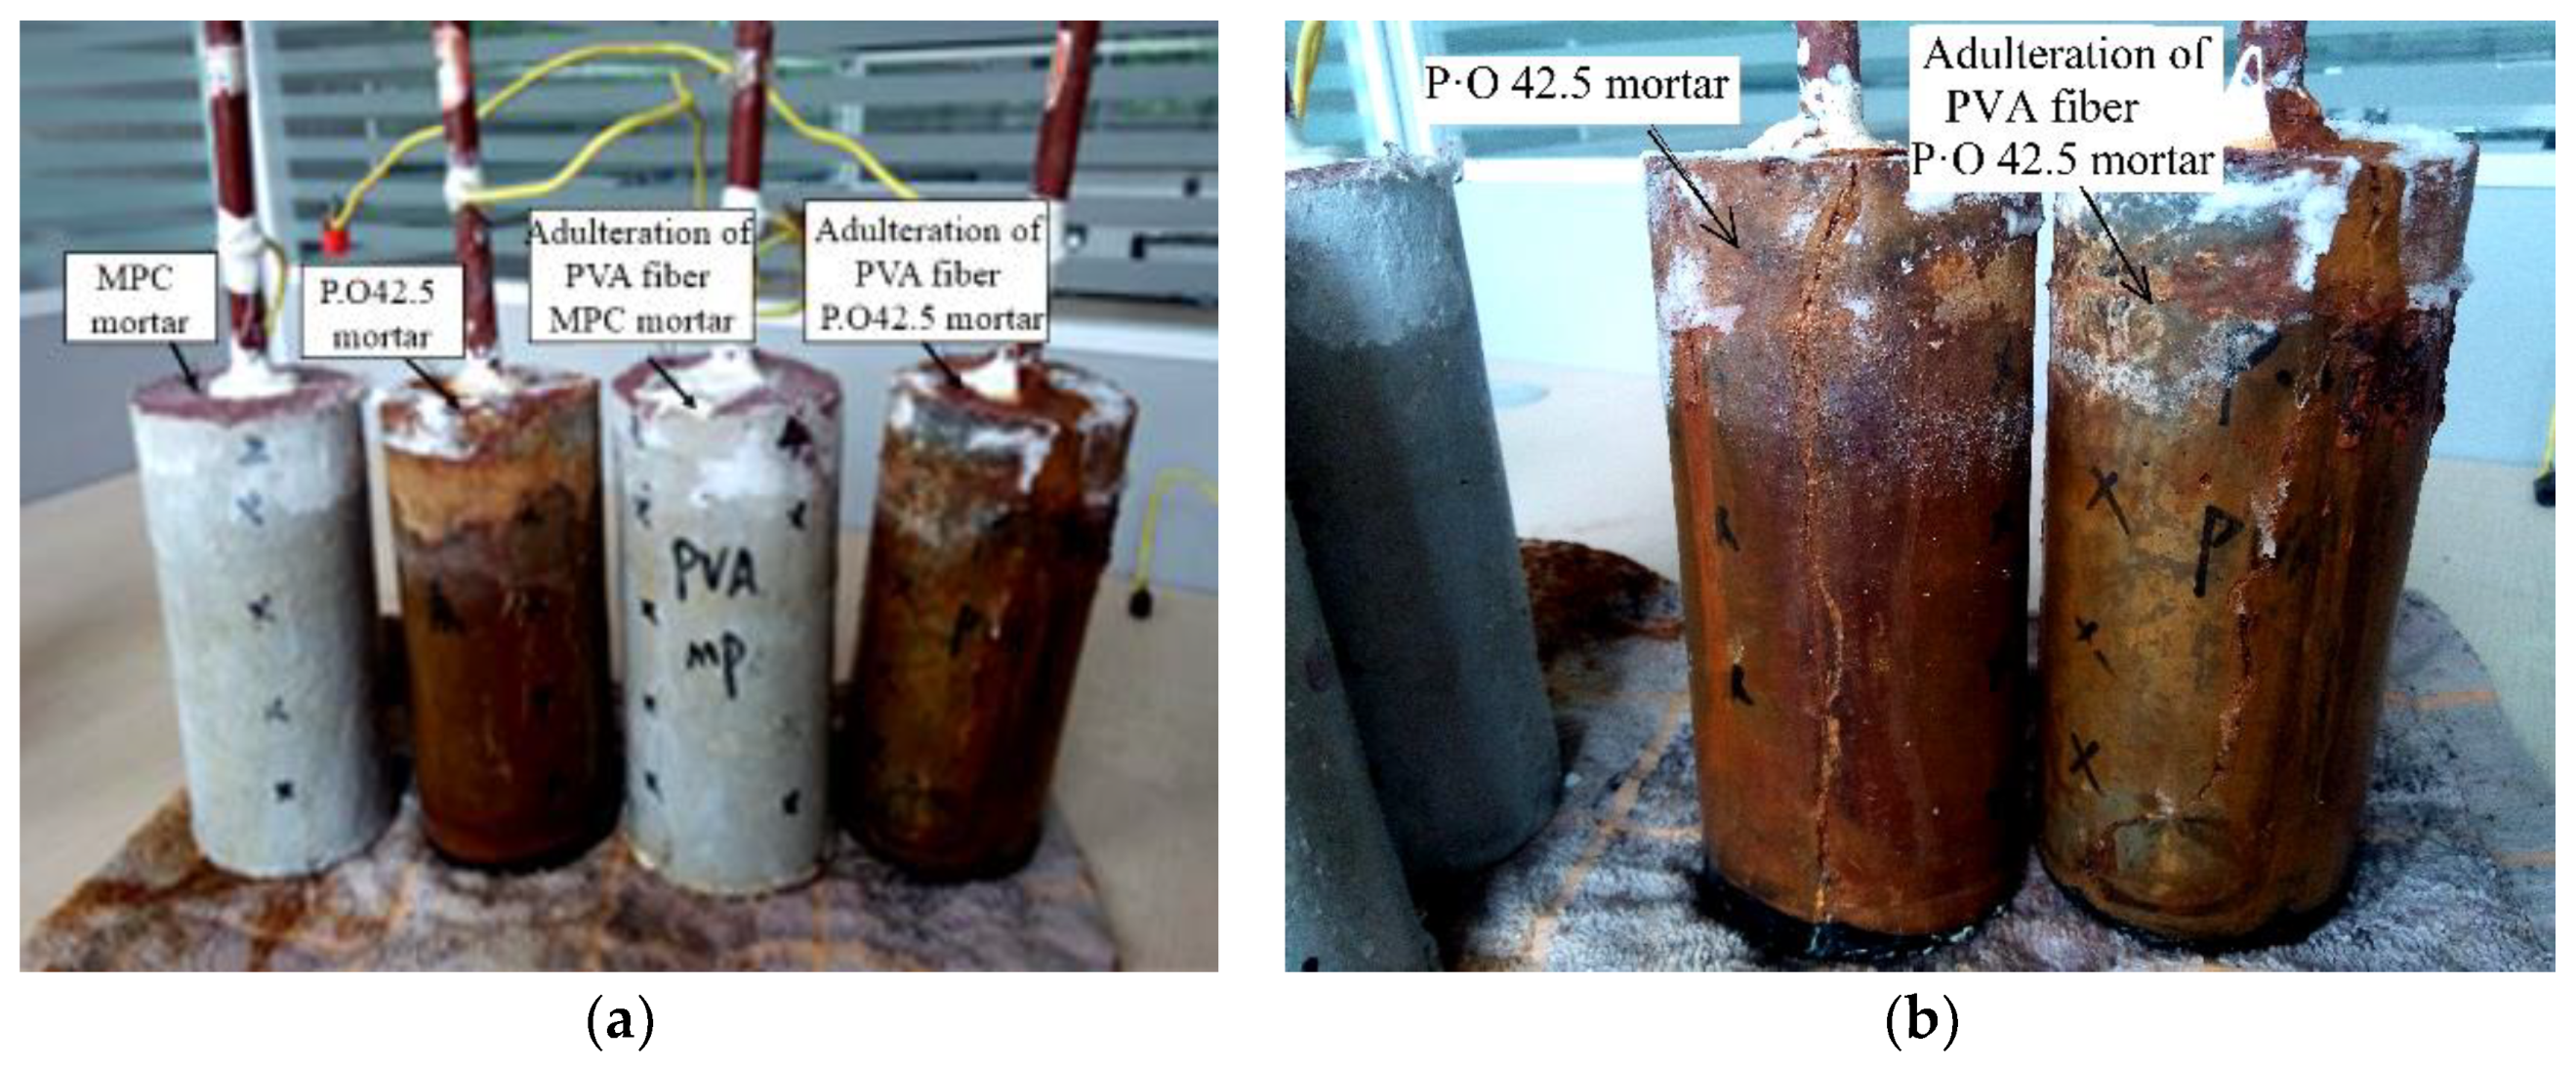
4.3.2. Corrosion Crack

During the process of intermittent electrification and the dry–wet cycle, such as accelerated corrosion, the protective properties of MPC-based material for steel were obviously different from those of the OPC material. After nearly 3 days (that is, after about 30 h of electric corrosion), the Portland cement specimens soaking in the NaCl solution gradually grew turbid, indicating that the steel bar in the specimen began to rust and expand. However, until all Portland cement specimens were rusty and cracked, the MPC specimens soaking in the NaCl solution were always clear. According to the mutation value in the recorded current data, the possible cracking times of the OPC specimens were calculated, as shown in Table 10.
The experimental specimens of M-1, P-1, M-5, and P-5 are shown in Figure 22. The protective performance of the Portland cement mortar to the steel bar was obviously worse than that of the MPC mortar under the same accelerated corrosion conditions. Because of the rust expansion of the steel bar, the cracks in Portland cement mortar specimen occurred from the center to the edge, as well as up and down. Figure 23a shows that the steel bar in the Portland cement specimen accelerated corrosion through a relatively large crack in the matrix and gradually expanded the range of rust expansion from that point downward. Figure 23b shows the reinforcement of the fiber with the cement matrix material. When the first crack appeared in the cement matrix due to the rust expansion of the steel bar, the fiber continued to prevent further expansion of the crack. However, the rust expansion stress of the steel bar continued to increase, thus cracking at the second weak point of the cement matrix. As a result, the fiber-reinforced OPC mortar resisted more corrosion expansion energy and optimized its cracking mode.
According to the experimental observations and the corrosion potential test, the following conclusions can be outlined. The corrosion potential of the MPC material increased as the electrical time was prolonged, further increasing the corrosion resistance of the steel. Adding fibers to the cement slurry decreased the crack energy and improved the cracking mode. Under the same electrical time and corrosion medium, the steel in the Portland cement material corroded much more severely, while the steel in the MPC material did not corrode. Thus, the MPC material has much better steel protection abilities than the Portland cement material.

5. Conclusions

MPC can quickly set, has high overall strength, and offers good bonding strength with old concrete, so it is suitable for use in the repair and protection of reinforced concrete structures. However, ensuring and maintaining the durability of external repairs and the protection of concrete structures is an important issue that needs to be studied. This paper studied this issue based on electricity flux and accelerated corrosion experiments, and the following conclusions can be drawn.
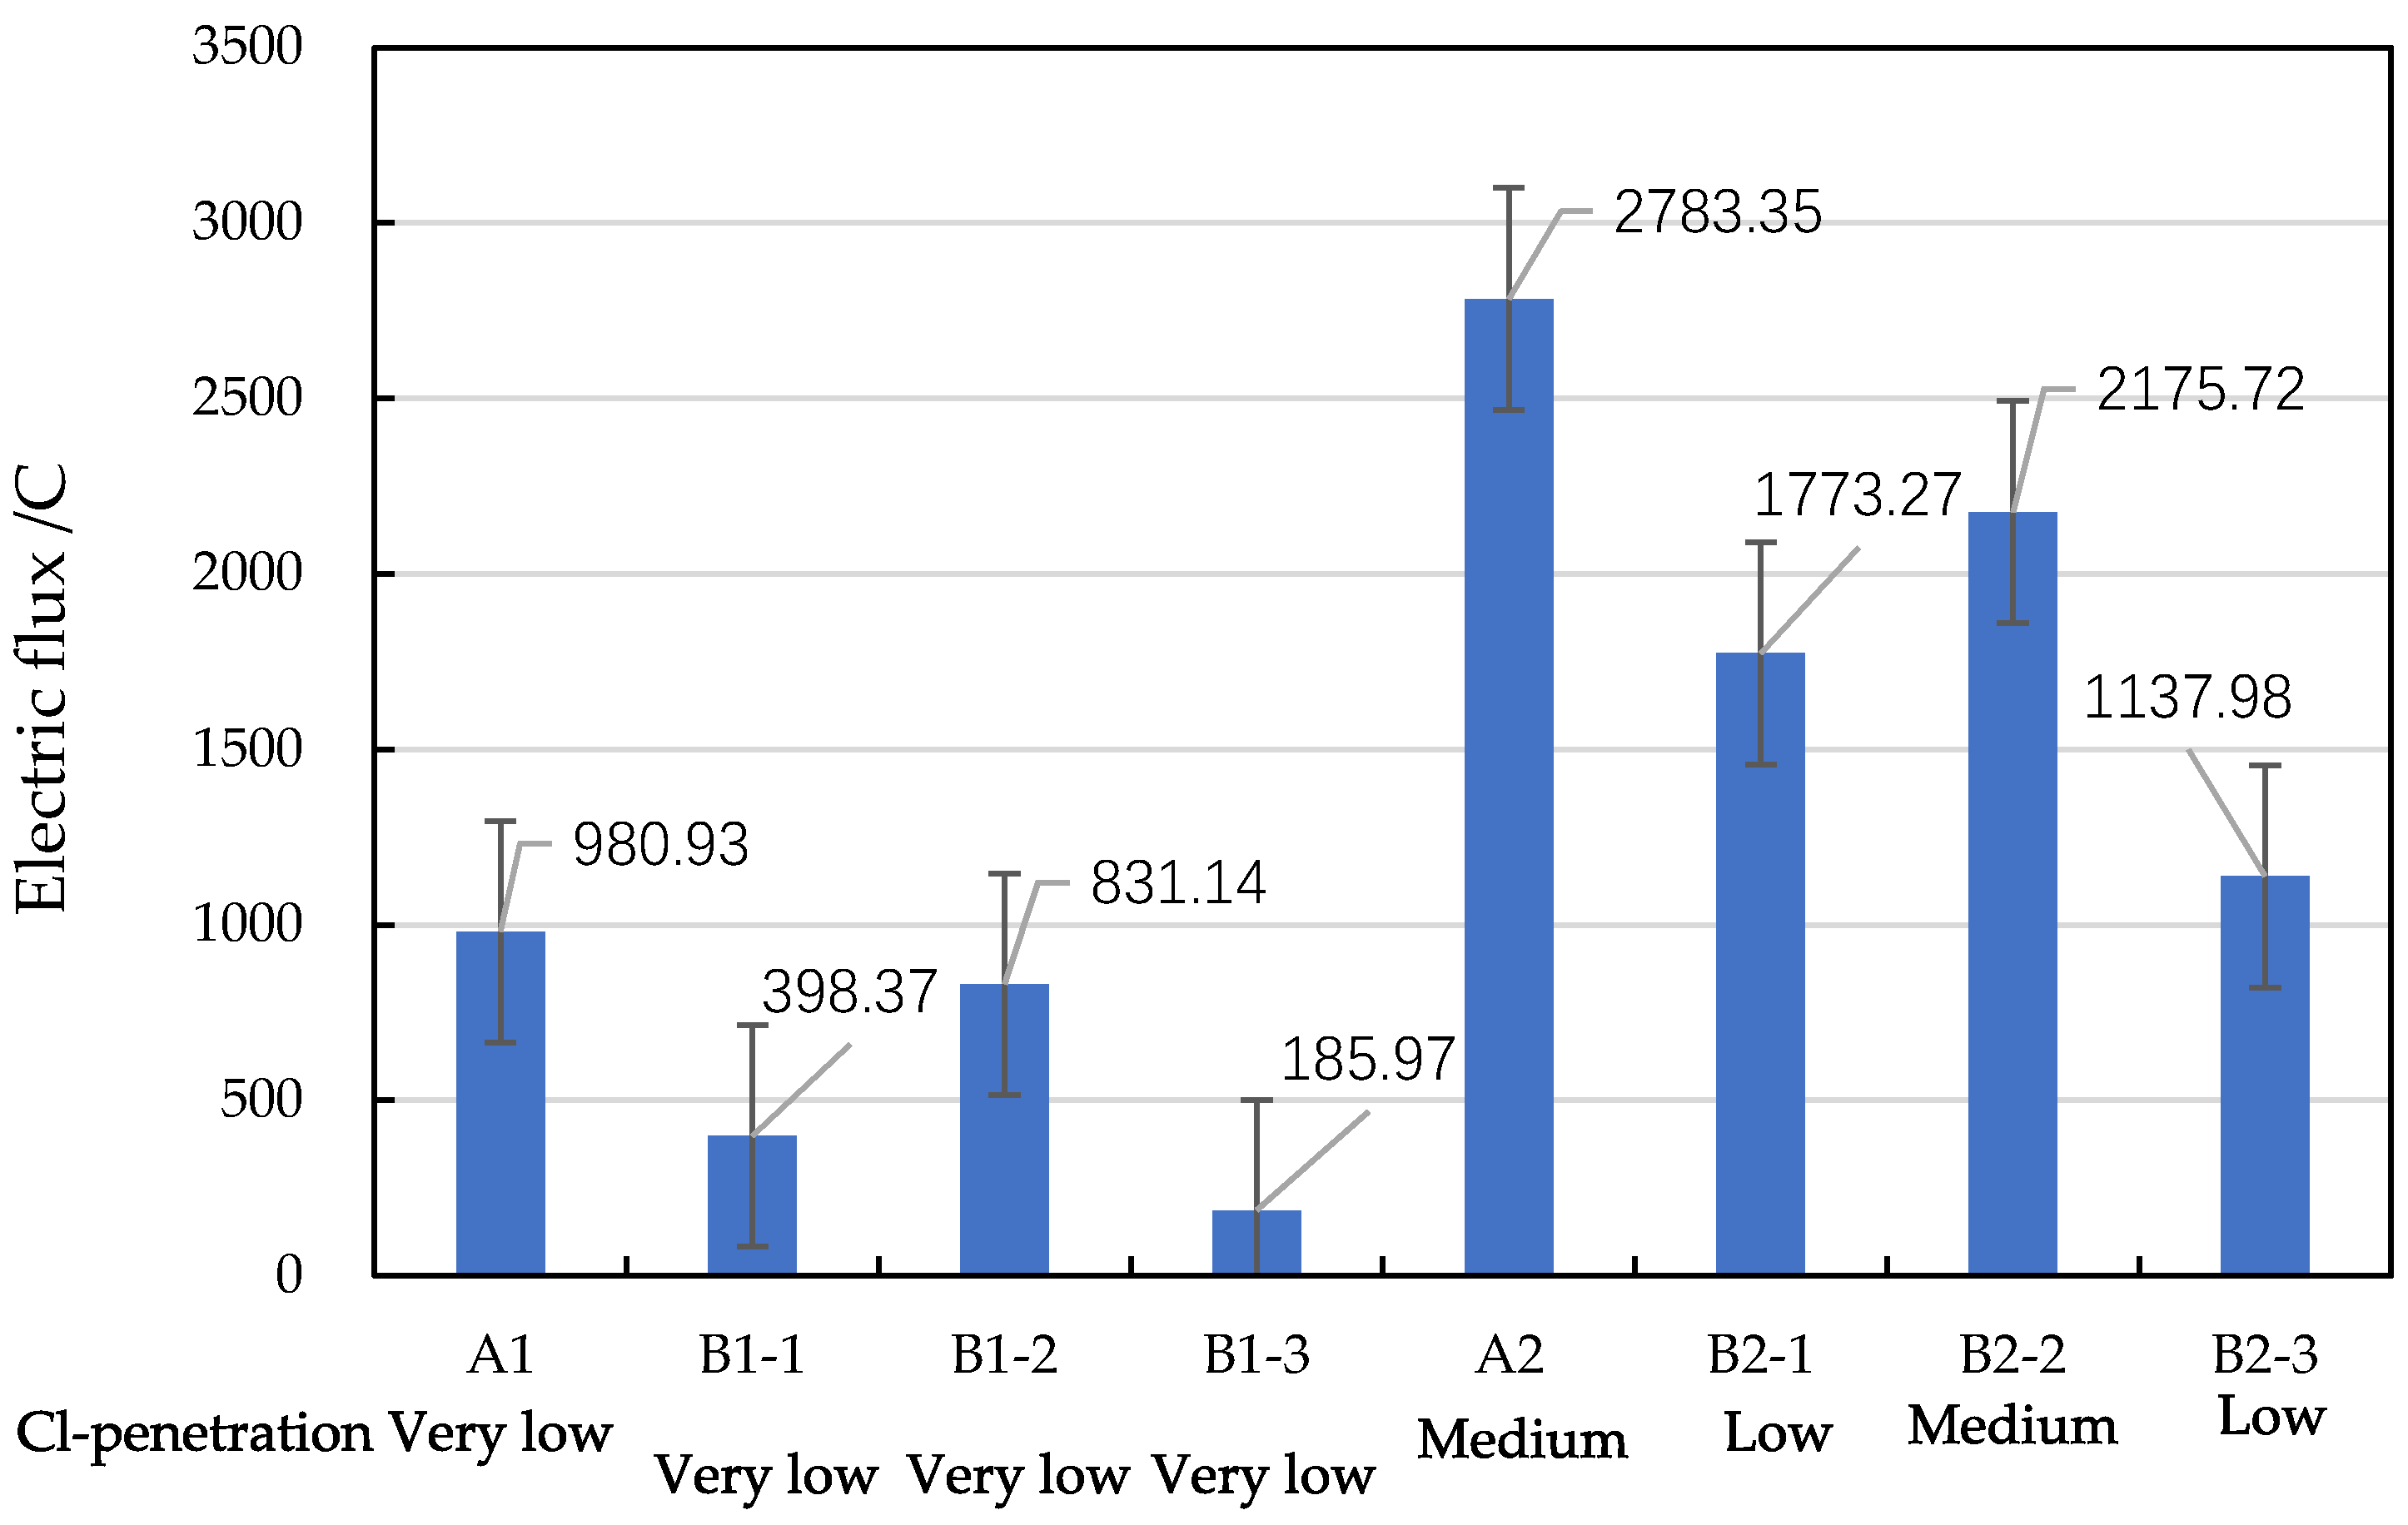
  • The electrical flux of the hardened body of MPC-based material is much lower than that of the Portland cement mortar, and the electrical flux of the hardened body of the MPC mortar can be obviously reduced by adding silica-fume and fly ash, which, when combined in a suitable proportion, will make the MPC hardened body more dense and impermeable.
  • The addition of short cut fibers increases the number of pores, the pore size, and the electrical flux of the cement-mortar-hardened body. The adverse effects of the three fibers on the permeability of the MPC mortar against chlorine ions are as follows PVA fiber > glass fiber > basalt fiber.
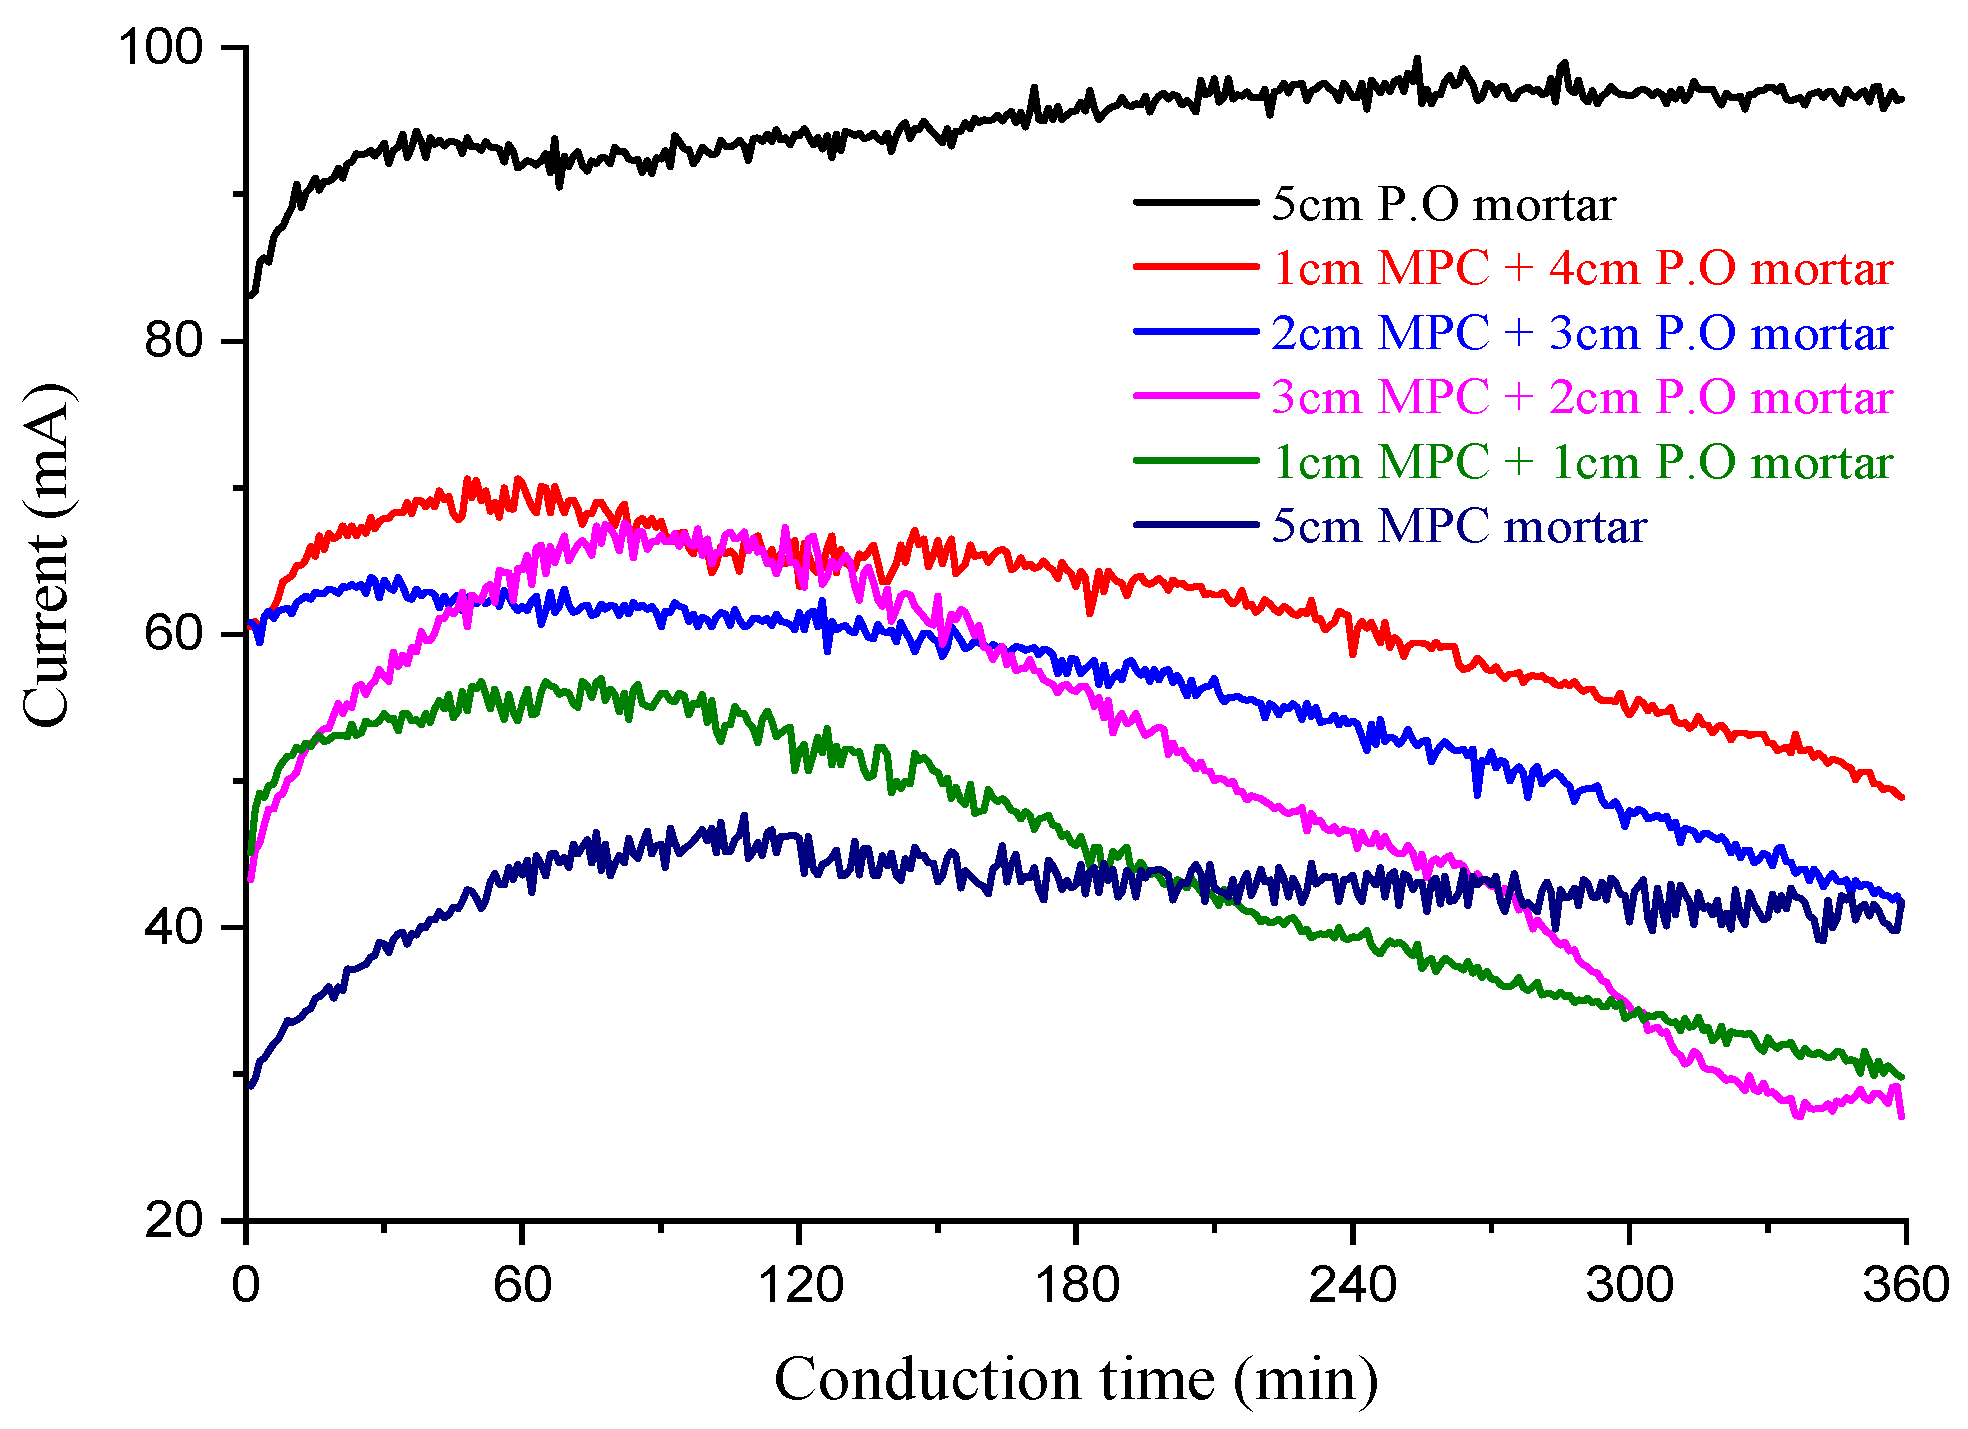
  • The electrical flux of the MPC mortar or MPC paste coated on the surface of the Portland cement mortar can be greatly reduced by using 1 cm MPC mortar or 1 cm mortar coatings of 36.0% and 84.2%, respectively.
  • After nearly 100 h of accelerated corrosion, the steel bar in the Portland cement base material was seriously corroded, but the steel bar in the MPC material showed no signs of corrosion.

Author Contributions

Conceptualization, Y.D. and P.G.; data curation, Y.D.; funding acquisition, Y.D. and J.Y.; investigation, Y.D.; methodology, Y.D. and J.Y.; project administration, Y.D. and P.G.; writing—original draft, Y.D.; writing—review and editing, Y.D. and F.S. All authors have read and agreed to the published version of the manuscript.

Funding

This research was funded by the National Nature Science Foundation of China (NSFC) (Grant No. 51578475), Jiangsu Science and Technology Department (Industry-university-research cooperation project 2020. No. BY2020359), Research Center on Levee Safety Disaster Prevention MWR (2019004), Jiangsu Natural Science Foundation (BK20181112), the traffic construction in Jiangxi Province (2020H0047), Post-doctoral fund of China and Jiangsu (2020M671485,1301057B).

Conflicts of Interest

The authors declare no conflict of interest.

References

  1. Neville, A. Chloride attack of reinforced concrete: An overview. Mater. Struct. 1995, 28, 63. [Google Scholar] [CrossRef]
  2. Chen, D.; Mahadevan, S. Chloride-induced reinforcement corrosion and concrete cracking simulation. Cem. Concr. Compos. 2008, 30, 227–238. [Google Scholar] [CrossRef]
  3. Wagh, A.S. Chemically Bonded Phosphate Ceramics: 21st Century Materials with Diverse Applications; Elsevier Science: London, UK, 2004. [Google Scholar]
  4. Andrade, A.; Schuiling, R.D. The chemistry of struvite crystallization. Min. J. 2001, 37–46, 5–6. [Google Scholar]
  5. Wagh, A.S.; Singh, D. Method for Stabilizing Low-Level Mixed Wastes at Room Temperature. U.S. Patent 5,645,518, 8 June 1997. [Google Scholar]
  6. Wagh, A.S.; Jeong, S.Y.; Sinhg, D. High strength phosphate cement using industrial by-product ashes. In Proceedings of the First International Conference on High Strength Concrete; ASCE: Reston, VA, USA, 2017; pp. 533–542. [Google Scholar]
  7. Ding, Z.; Dong, B.; Xing, F.; Han, N.; Li, Z. Cementing mechanism of potassium phosphate based magnesium phosphate cement. Ceram. Int. 2012, 38, 6281–6288. [Google Scholar] [CrossRef]
  8. Xu, B.; Ma, H.; Li, Z. Influence of magnesia-to-phosphate molar ratio on microstructures, mechanical properties and thermal conductivity of magnesium potassium phosphate cement paste with large water-to-solid ratio. Cem. Concr. Res. 2015, 68, 1–9. [Google Scholar] [CrossRef]
  9. Li, Y.; Sun, J.; Chen, B. Experimental study of magnesia and M/P ratio influencing properties of magnesium phosphate cement. Constr. Build. Mater. 2014, 65, 177–183. [Google Scholar] [CrossRef]
  10. Ma, H.; Xu, B.; Liu, J.; Pei, H.; Li, Z. Effects of water content, magnesia-to-phosphate molar ratio and age on pore structure, strength and permeability of magnesium potassium phosphate cement paste. Mater. Des. 2014, 64, 497–502. [Google Scholar] [CrossRef]
  11. Li, Y.; Chen, B. Factors that affect the properties of magnesium phosphate cement. Constr. Build. Mater. 2013, 47, 977–983. [Google Scholar] [CrossRef]
  12. Qiao, F.; Chau, C.K.; Li, Z. Property evaluation of magnesium phosphate cement mortar as patch repair material. Constr. Build. Mater. 2010, 24, 695–700. [Google Scholar] [CrossRef]
  13. Chau, C.K.; Fei, Q.; Li, Z. Microstructure of magnesium potassium phosphate cement. Constr. Build. Mater. 2011, 25, 2911–2917. [Google Scholar] [CrossRef]
  14. Yang, Q.; Zhu, B.; Wu, X. Characteristics and durability test of magnesium phosphate cement-based material for rapid repair of concrete. Mater. Struct. 2000, 33, 229–234. [Google Scholar] [CrossRef]
  15. Woo, P.J.; Hwan, K.K.; Yong, A.K. Fundamental Properties of Magnesium Phosphate Cement Mortar for Rapid Repair of Concrete. Adv. Mater. Sci. Eng. 2016, 2016, 7179403. [Google Scholar]
  16. Yang, J.; Wang, L.; Jin, C.; Sheng, D. Effect of fly ash on the corrosion resistance of magnesium potassium phosphate cement paste in sulfate solution. Constr. Build. Mater. 2020, 237, 117639. [Google Scholar]
  17. Ahmad, M.R.; Chen, B.; Yu, J. A comprehensive study of basalt fiber reinforced magnesium phosphate cement incorporating ultrafine fly ash. Compos. Part. B Eng. 2019, 168, 204–217. [Google Scholar] [CrossRef]
  18. Xu, X.; Lin, X.; Pan, X.; Ji, T.; Liang, Y.; Zhang, H. Influence of silica fume on the setting time and mechanical properties of a new magnesium phosphate cement. Constr. Build. Mater. 2019, 235, 117544. [Google Scholar] [CrossRef]
  19. Zheng, D.D.; Ji, T.; Wang, C.Q.; Sun, C.J.; Lin, X.J.; Hossain, K.M. Effect of the combination of fly ash and silica fume on water resistance of magnesium-potassium phosphate cement. Constr. Build. Mater. 2016, 106, 415–421. [Google Scholar] [CrossRef]
  20. Pera, J.; Ambroise, J. Fiber-reinforced Magnesia-phosphate Cement Composites for Rapid Repair. Cem. Concr. Compos. 1998, 20, 31–39. [Google Scholar] [CrossRef]
  21. Fang, Y.; Chen, B.; Oderji, S.Y. Experimental research on magnesium phosphate cement mortar reinforced by glass fiber. Constr. Build. Mater. 2018, 188, 729–736. [Google Scholar] [CrossRef]
  22. Qin, J.; Qian, J.; Li, Z.; You, C.; Dai, X.; Yue, Y.; Fan, Y. Mechanical properties of basalt fiber reinforced magnesium phosphate cement composites. Constr. Build. Mater. 2018, 188, 946–955. [Google Scholar] [CrossRef]
  23. Tang, H.; Qian, J.; Ji, Z.; Dai, X.; Li, Z. The protective effect of magnesium phosphate cement on steel corrosion. Constr. Build. Mater. 2020, 255, 119422. [Google Scholar] [CrossRef]
  24. Li, Y.; Shi, T.; Li, Y.; Bai, W.; Lin, H. Damage of magnesium potassium phosphate cement under dry and wet cycles and sulfate attack. Constr. Build. Mater. 2019, 210, 111–117. [Google Scholar] [CrossRef]
  25. Wang, H.; Zhang, A.; Zhang, L.; Liu, J.; Han, Y.; Shu, H.; Wang, J. Study on the influence of compound rust inhibitor on corrosion of steel bars in chloride concrete by electrical parameters. Constr. Build. Mater. 2020, 262, 120763. [Google Scholar] [CrossRef]
  26. Wang, H.; Du, T.; Zhang, A.; Cao, P.; He, Z. Relationship between electrical resistance and rheological parameters of fresh cement slurry. Constr. Build. Mater. 2020, 256, 119479. [Google Scholar] [CrossRef]
  27. Yang, J.; Li, T.; Xu, X. Effect of Fine Aggregates on Properties of Magnesium Potassium Phosphate Cement Mortar. J. Mater. Civ. Eng. 2017, 29, 06017012. [Google Scholar]
  28. JGJ/T 98-2010. Specification for Mix Proportion Design of Masonry Mortar; Ministry of Housing and Urban-Rural Development of the People’s Republic of China: Beijin, China, 2010.
  29. ASTM C1202-19. Standard Test Method for Electrical Indication of Concrete’s Ability to Resist Chloride Ion. Penetration; ASTM International: West Conshohocken, PA, USA, 2019. [Google Scholar]
  30. Gaitero, J.J.; Campillo, I.; Guerrero, A. Reduction of the calcium leaching rate of cement paste by addition of silica nanoparticles. Cem. Concr. Res. 2008, 38, 1112–1118. [Google Scholar] [CrossRef] [Green Version]
Figure 1. Mortar strength of each group.
Coatings 10 01145 g001
Figure 2. Test device for electrical capacity: (a) test device; (b) test specimens and experimental grooves.
Coatings 10 01145 g002
Figure 3. Schematic diagram of the electrical flux experiment.
Coatings 10 01145 g003
Figure 4. Time–history current curve of the MPC mortar with different admixtures.
Coatings 10 01145 g004
Figure 5. Electrical flux of the MPC mortar with different admixtures.
Coatings 10 01145 g005
Figure 6. Silver nitrate reagents on the split section of a test piece.
Coatings 10 01145 g006
Figure 7. Current curve of the MPC mortar with different fibers.
Coatings 10 01145 g007
Figure 8. Electrical flux of the MPC mortar with different fibers.
Coatings 10 01145 g008
Figure 9. MPC material and P·O 42.5 mortar composite flux experimental specimens.
Coatings 10 01145 g009
Figure 10. Influence of the MPC slurry on electrical flux.
Coatings 10 01145 g010
Figure 11. Electrical flux values under different MPC mortar thickness values.
Coatings 10 01145 g011
Figure 12. Influence of the thickness of the MPC mortar coating on the electrical flux of the specimen: (a) OPC mortar; (b) 1 cm MPC + 4 cm OPC mortar; (c)2 cm MPC + 3 cm OPC mortar; (d) 3 cm MPC + 2 cm OPC mortar; (e) 4 cm MPC + 1 cm OPC mortar; (f) MPC mortar.
Coatings 10 01145 g012
Figure 13. Influence of MPC paste thickness on the electrical flux of the composite specimens.
Coatings 10 01145 g013
Figure 14. Electrical flux of composite specimens with different MPC-paste thicknesses.
Coatings 10 01145 g014
Figure 15. Split section of the specimens with different MPC paste coating thicknesses: (a) 5 mm MPC Paste + 45 mm OPC mortar; (b) 10 mm MPC Paste + 40 mm OPC mortar; (c) 15 mm MPC Paste + 35 mm OPC mortar.
Coatings 10 01145 g015aCoatings 10 01145 g015b
Figure 16. SEM images of the MPC mortar and OPC mortar. (a) MPC paste; (b) OPC paste; (c) interface between the MPC paste and aggregate; (d) interface between the OPC paste and aggregate; (e) interface between the MPC paste and PVA fiber; (f) interface between the OPC paste and PVA fiber.
Coatings 10 01145 g016aCoatings 10 01145 g016b
Figure 17. MIP of the MPC mortar and OPC mortar.
Coatings 10 01145 g017
Figure 18. Specimen formation. (a) Test mold and steel bar positioning method; (b) indoor maintenance spare parts.
Coatings 10 01145 g018
Figure 19. Accelerated corrosion test design. (a) Schematic diagram of an experimental device; (b) schematic diagram of an experimental sample.
Coatings 10 01145 g019
Figure 20. Constant potential accelerated corrosion device diagram. (a) A microcomputer-controlled potentiostatic apparatus; (b) electrical corrosion test parts.
Coatings 10 01145 g020
Figure 21. Potential test using the half-cell method.
Coatings 10 01145 g021
Figure 22. Comparison of the rust appearance in the specimens. (a) Comparison between the M group specimen and P group specimen after corrosion; (b) surface fracture morphology of the P group after corrosion. Rust damage down.
Coatings 10 01145 g022
Figure 23. Fiber-reinforced OPC mortar specimens’ rust rupture appearance. (a) Localized concentration of rust; (b) rust expansion joints.
Coatings 10 01145 g023
Table 1. Chemical composition and content of admixtures and P·O 42.5/%.
VarietySiO2Al2O3CaOFe2O3MgOSO3K2ONa2OOthersLoss on Ignition
FA51.1026.147.157.312.590.211.010.651.871.97
SF91.671.160.540.311.100.120.200.471.902.53
P·O 42.521.877.5655.143.214.151.570.750.762.072.92
Table 2. Technical specifications of short cut fibers.
VarietyLength
/mm
Diameter
/μm
Density
/(g/cm3)
Tensile Strength
/MPa
Elastic Modulus
/GPa
Elongation at Break/%
PVA6141.3001200–160031.0–40.07.5
Glass fiber6162.6673100–380072.5–75.54.7
Basalt fiber652.7713000–484079.3–93.13.1
Table 3. Particle–size distribution and other physical indicators of the three kinds of fine aggregates.
Aggregate TypePass Rate for Each Sieve (%)Fineness ModulusApparent Density
/(g/cm3)
Bulk Density
/(g/cm3)
Void Ratio
/%
4.752.361.180.60.30.150.075
NS98.490.274.445.95.60.50.32.82.6111.50841.5
MS99.911.13.20.20004.852.9411.49748.58
One-half NS + one-half MS99.150.738.8232.80.30.23.832.7571.61141.22
Table 4. Experimental samples and numbering.
Specimen Category 1Single Material Specimens
Cement TypeMPCOPC
Material CharacteristicsNo.Material CharacteristicsNo.
Base SpecimenNo AdmixtureA1No AdmixtureA2
Different Admixture10% SFB1-110% SFB2-1
10% FAB1-220% FAB2-2
5% SF + 5%FAB1-310% SF + 10%FAB2-3
Different Fiber1% PVA fiberC1-11% PVA fiberC2-1
1% Glass fiberC1-21% Glass fiberC2-2
1% Basalt fiberC1-31% Basalt fiberC2-3
Specimen Category 2Specimens Superimposed with Two Materials
Combination ModeMode OneMode Two
Layer Material and ThicknessMPC MortarOPC MortarNo.MPC PasteOPC MortarNo.
1.0 cm4.0 cmD-10.5 cm4.5 cmE-1
2.0 cm3.0 cmD-21.0 cm4.0 cmE-2
3.0 cm2.0 cmD-31.5 cm3.5 cmE-3
4.0 cm1.0 cmD-4---
Note: The content of 10% or 5% admixture in the magnesium phosphate cement (MPC) material is MgO powder replaced by mass ratio; the content of 10% or 20% admixture in the Portland cement (OPC) mortar is used to replace the Portland cement by weight ratio; the fiber content is calculated by 1% volume; the Portland cement mortar used in the D and E groups of specimens was the same, and the thickness of the MPC mortar layer was only changed in the D-1–D-4 group. Similarly, the thickness of the MPC mortar layer was only changed in the same group.
Table 5. Composition of the MPC materials in each sample.
No. m K H 2 P O 4 m ( M g O + a d m i x t u r e ) m C R m ( M g O + a d m i x t u r e ) m a g g r e g a t e m M P C m N S m M S m F A m M g O m S F m M g O Fiber/V% m w a t e r m M P C
A11:2.007.33%1:11:10%0%00.18
B1-11:2.007.33%1:11:10%10%00.18
B1-21:2.007.33%1:11:110%0%00.18
B1-31:2.007.33%1:11:15%5%00.18
C1-1–C1-31:2.007.33%1:11:15%5%10.18
D-1–D-41:2.007.33%1:11:10%0%00.18
E-1–E-31:3.007.33%0:1-0%0%00.12
Note: mKH2PO4 means KH2PO4 weight. The MPC in mMPC refers to the mass of the MPC cementitious materials, including MgO powder, KH2PO4, CR, and admixture; 10% of the admixture is MgO replacing 10% with equal mass.
Table 6. Composition of Portland cement-based materials in each group.
No.Proportion (kg/m3)W/C
CementSiFANatural SandManufactured SandWater
A2500--805.2805.22250.45
B2-145050-805.2805.22500.50
B2-2400-100805.2805.22350.47
B2-34005050805.2805.22400.48
Note: The proportion of Portland cement mortar components in the C, D, and E groups was consistent with that in the A group; the fiber volume content of the specimens was 1%, and the specimens were cured indoors.
Table 7. Relationship between electrical flux and chloride ion penetration.
6 h Electrical Flux/CChloride Ion PenetrationConcrete Type
>4000HighW/C ratio > 0.6
2000–4000ModerateW/C ratio 0.5–0.6
1000–2000LowLow W/C ratio
100–1000Very lowLow W/C ratio with 5–10% SF
<100NegligiblePolymer concrete with 5–10% SF
Table 8. Total porosity and pore volume distribution of the MPC and OPC mortar.
SpecimensTotal Porosity/mL/gPore Volume Distribution/%
<50 nm50–100 nm100–1000 nm>1000 nm
MPC Mortar1.973348.0417.6826.038.25
OPC Mortar0.65771.9811.4883.782.76
Table 9. Accelerated corrosion test groups.
Cement MaterialMPC MaterialPortland Cement Material
GroupNo.TypeNo.Type
M-1MPC slurryP-1OPC slurry
M-2MPC + 10% SiP-2OPC + 10% Si
M-3MPC + 10% FAP-3OPC + 20% FA
M-4MPC + 5%FA + 5% SiP-4OPC + 10% Si + 10% FA
Table 10. Cracking times of the P·O 42.5 specimens in the accelerated corrosion test.
MPC MaterialPortland Cement Material
No.TypeCrack Time/hNo.TypeCrack Time/h
M-1MPC mortar-P-1OPC mortar68.5
M-2MPC + 10%Si-P-2OPC + 10% Si95.5
M-3MPC + 10%FA-P-3OPC + 20% FA72.5
M-4MPC + 5% FA + 5% Si-P-4OPC + 10% Si + 10% FA87.5
M-5MPC + 1% PVA-P-5OPC + 1% PVA28.5
Publisher’s Note: MDPI stays neutral with regard to jurisdictional claims in published maps and institutional affiliations.

