Convection–Diffusion Model for the Synthesis of PVD Coatings and the Influence of Nanolayer Parameters on the Formation of Fractal and Hierarchical Structures

 ,
,  , ,
, ,
Abstract
:1. Introduction
2. Materials and Methods
3. Results
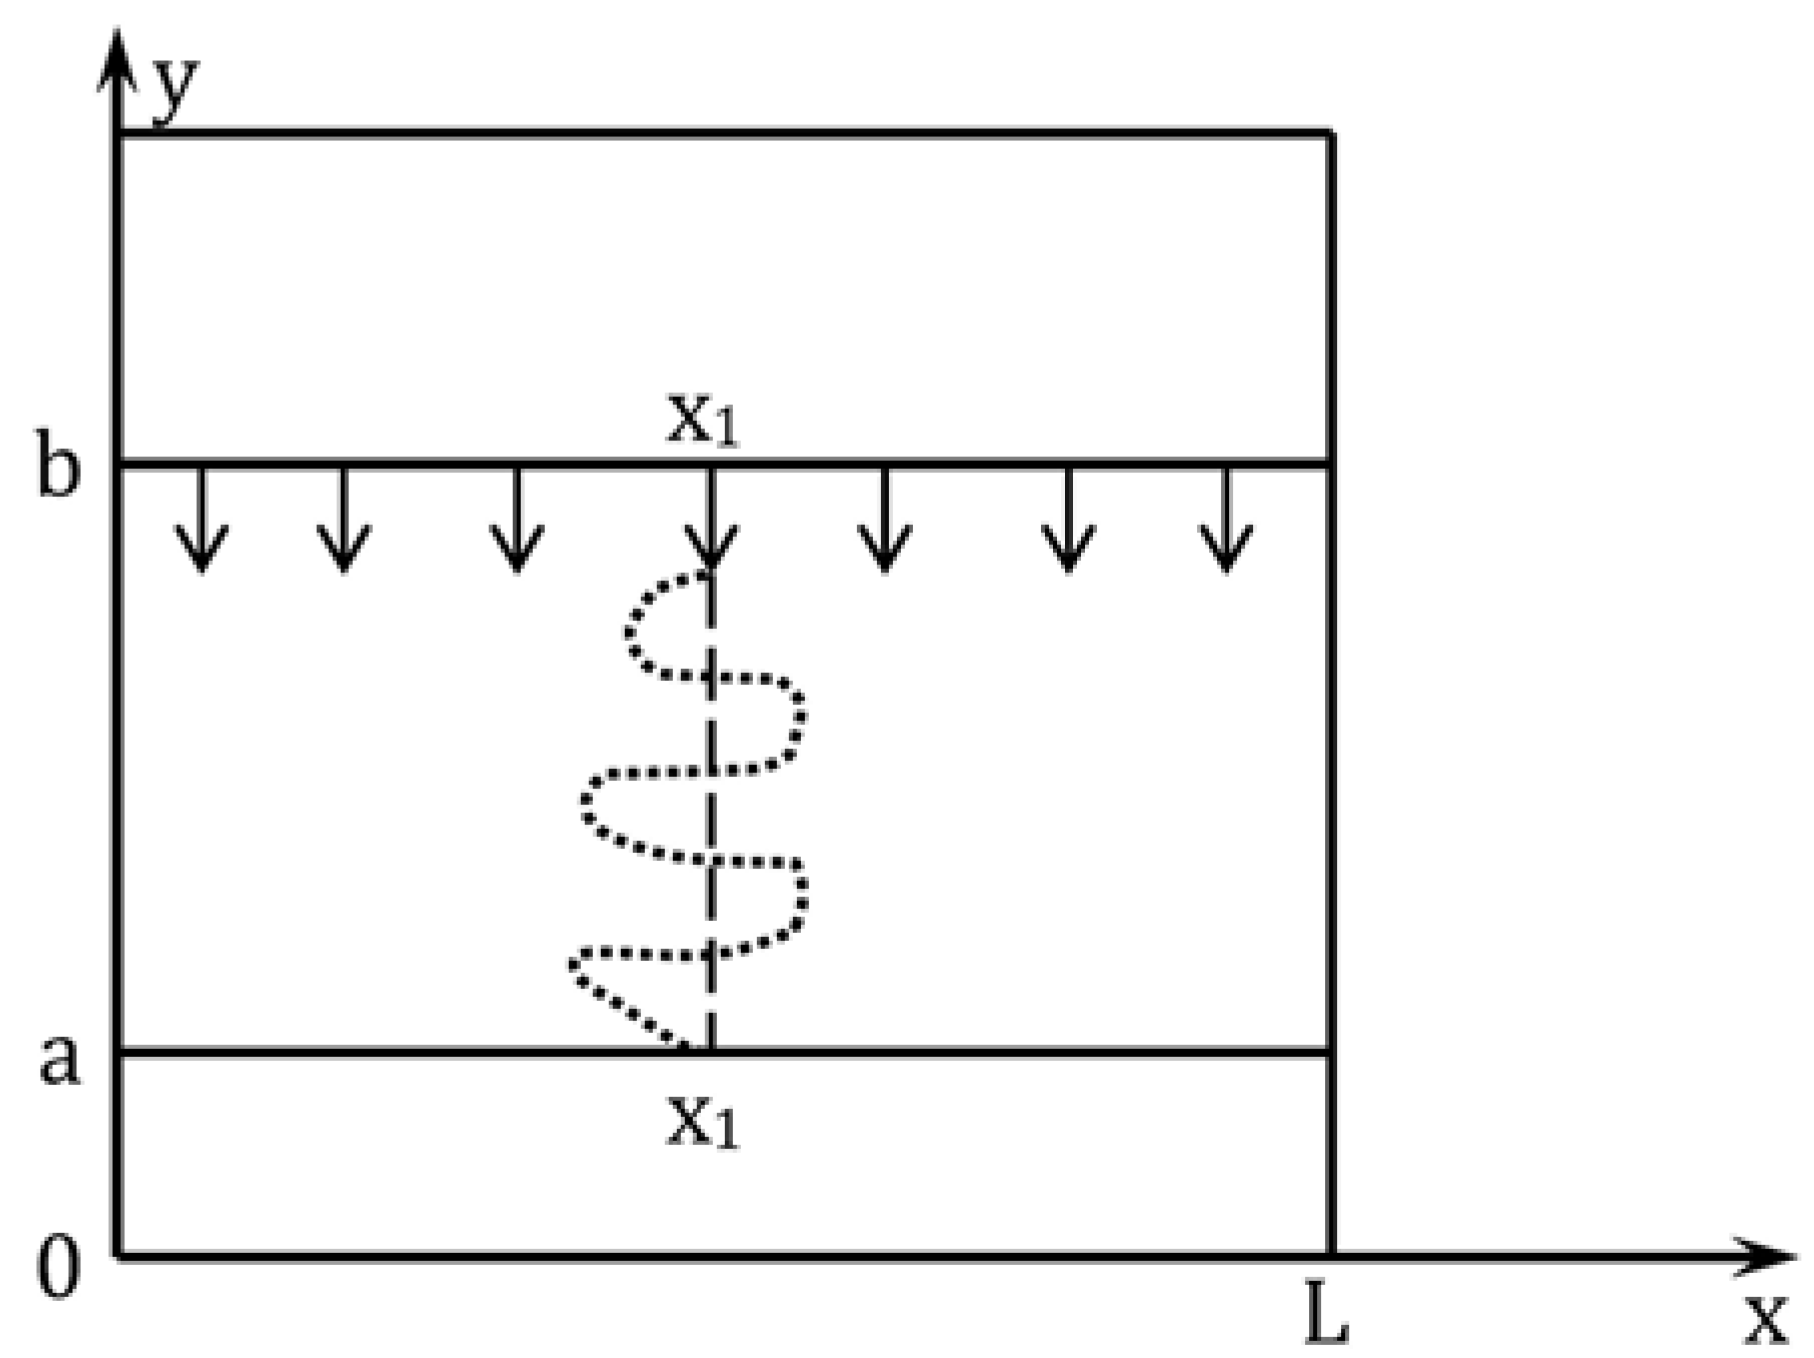
3.1. Convection–Diffusion 2D Model for the Stochastic Coating Deposition Process
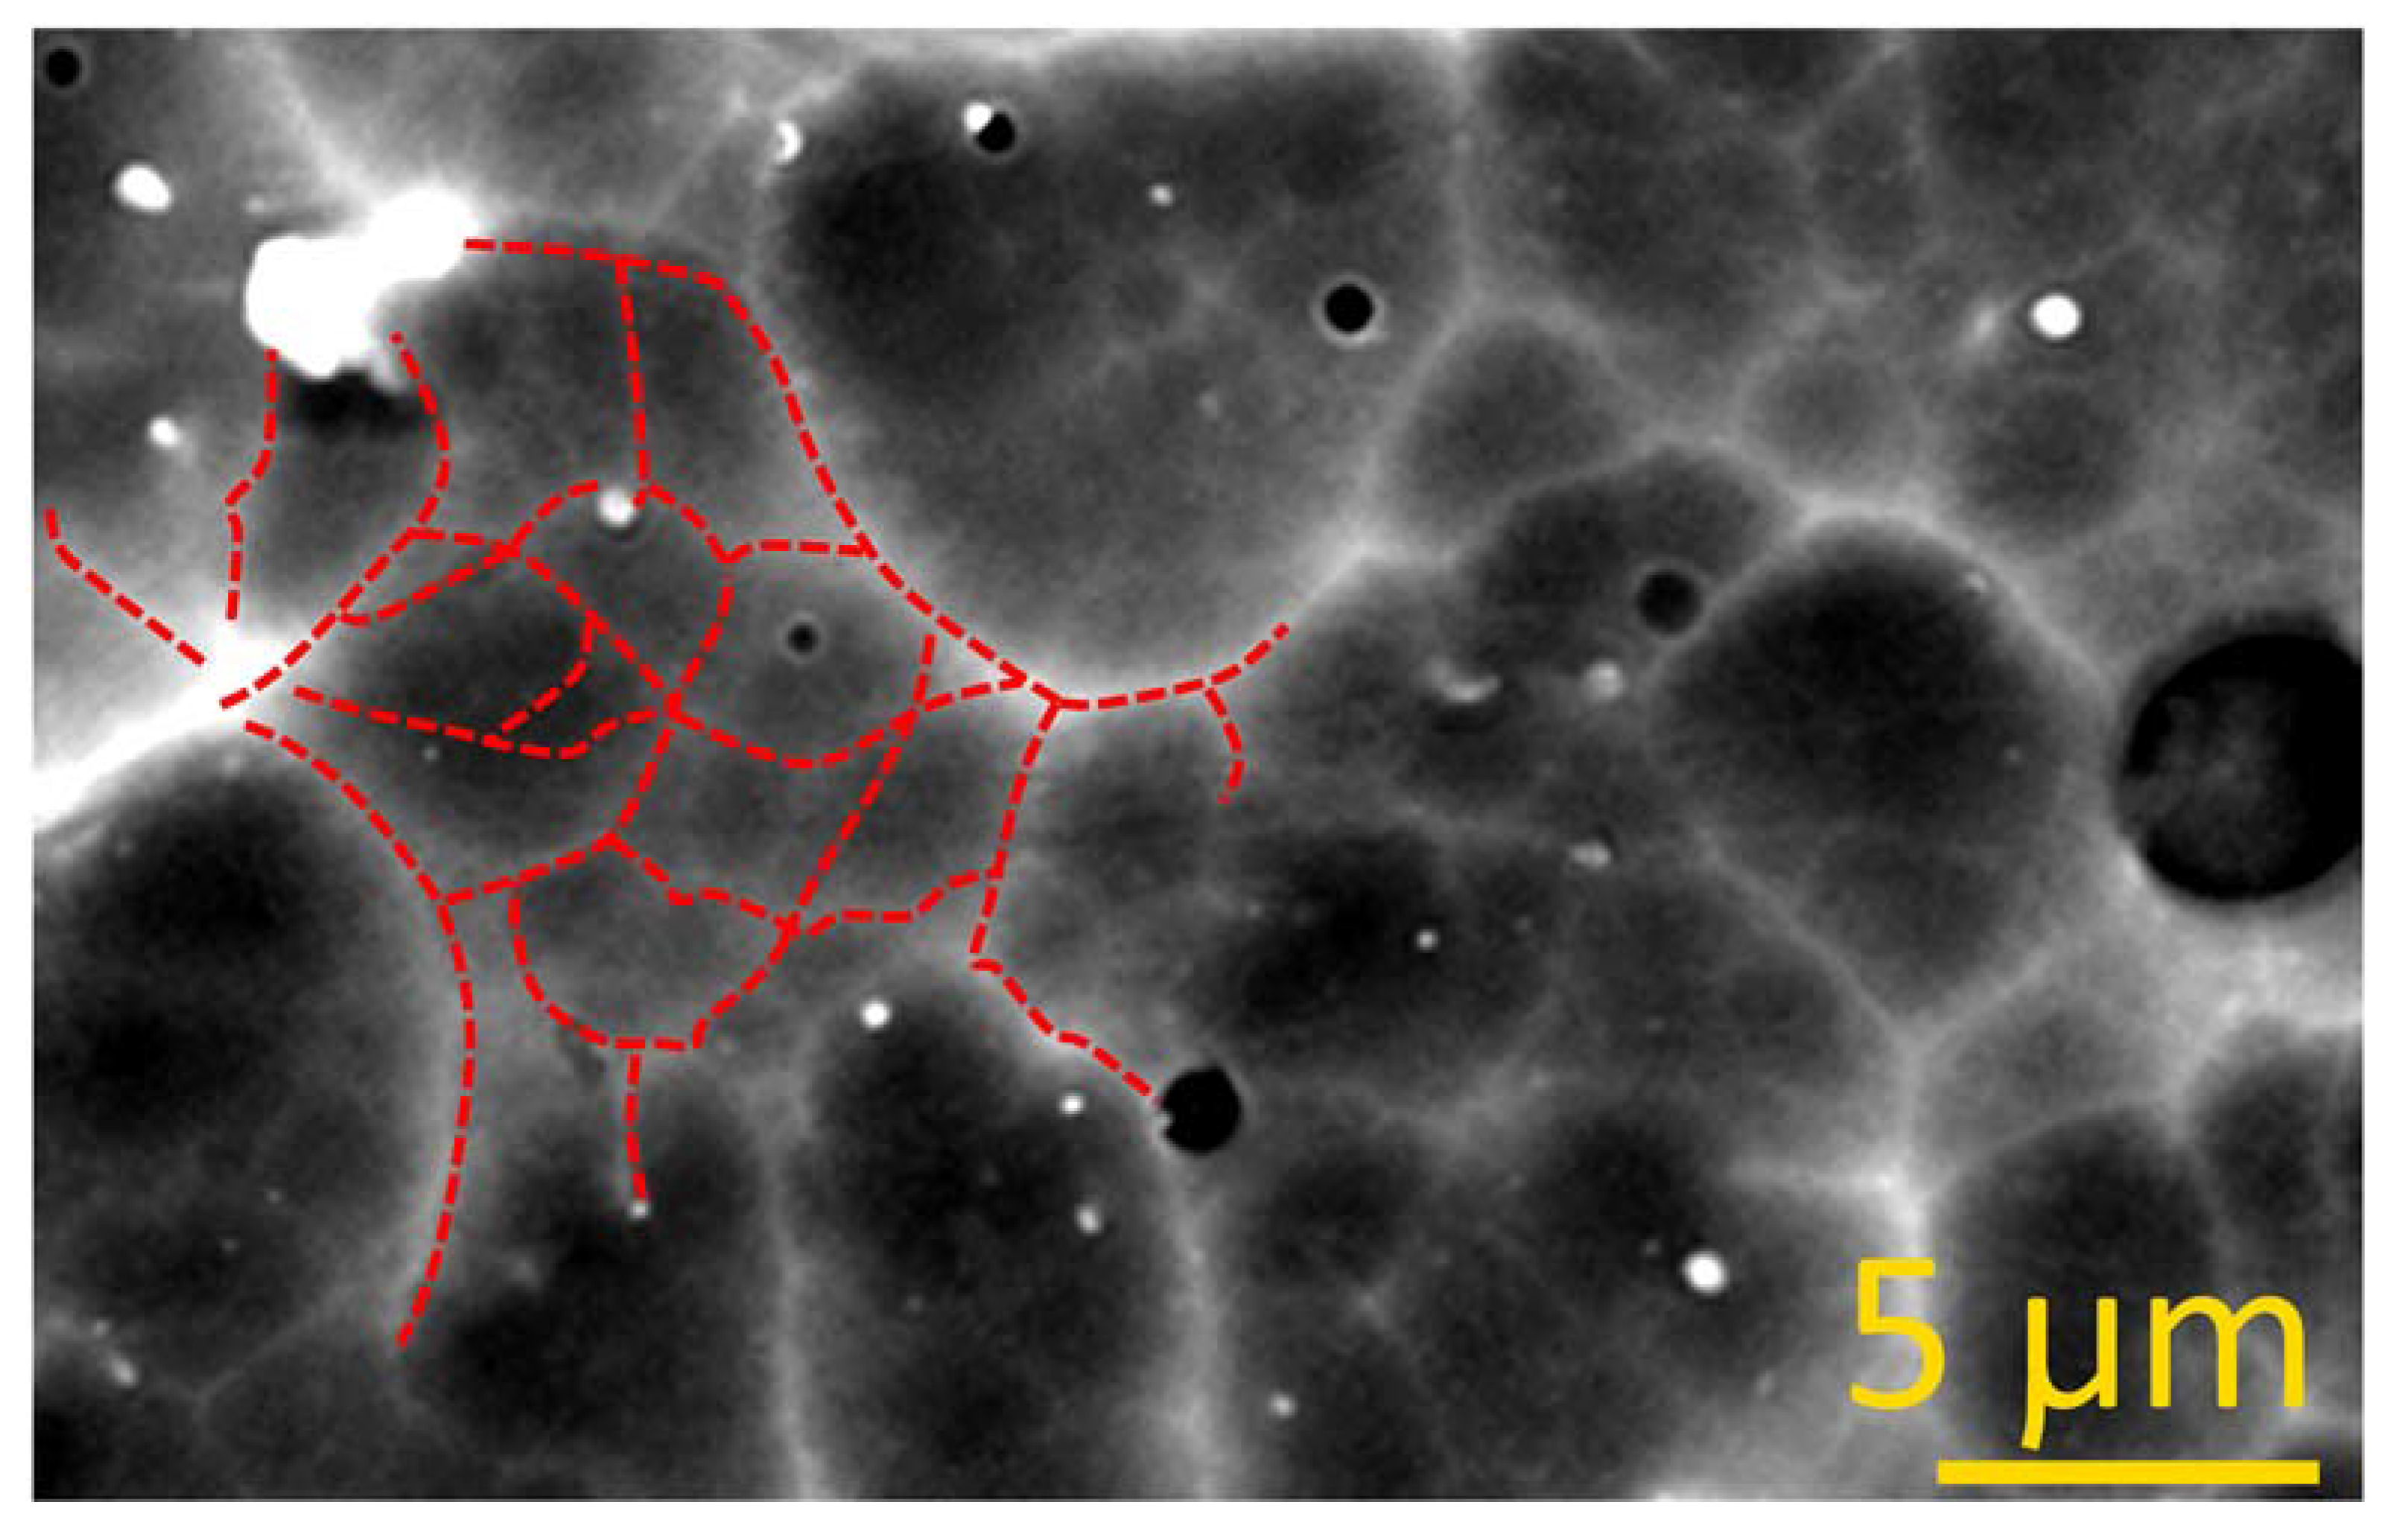
3.2. Influence of the Nanolayer Period λ on the Cluster and Hierarchical Coating Structure
4. Conclusions
- The obtained formulas prove that due to diffusion, particles can participate in collisions with other particles during the motion, and as a result, the velocity decreases and a particle enters a substrate at an angle, which may lead to a coating inhomogeneity over the area and the appearance of the surface microrelief, which also worsens the resistance and reliability of the coating. The Equation (16) is stochastic for various deposition trajectories.
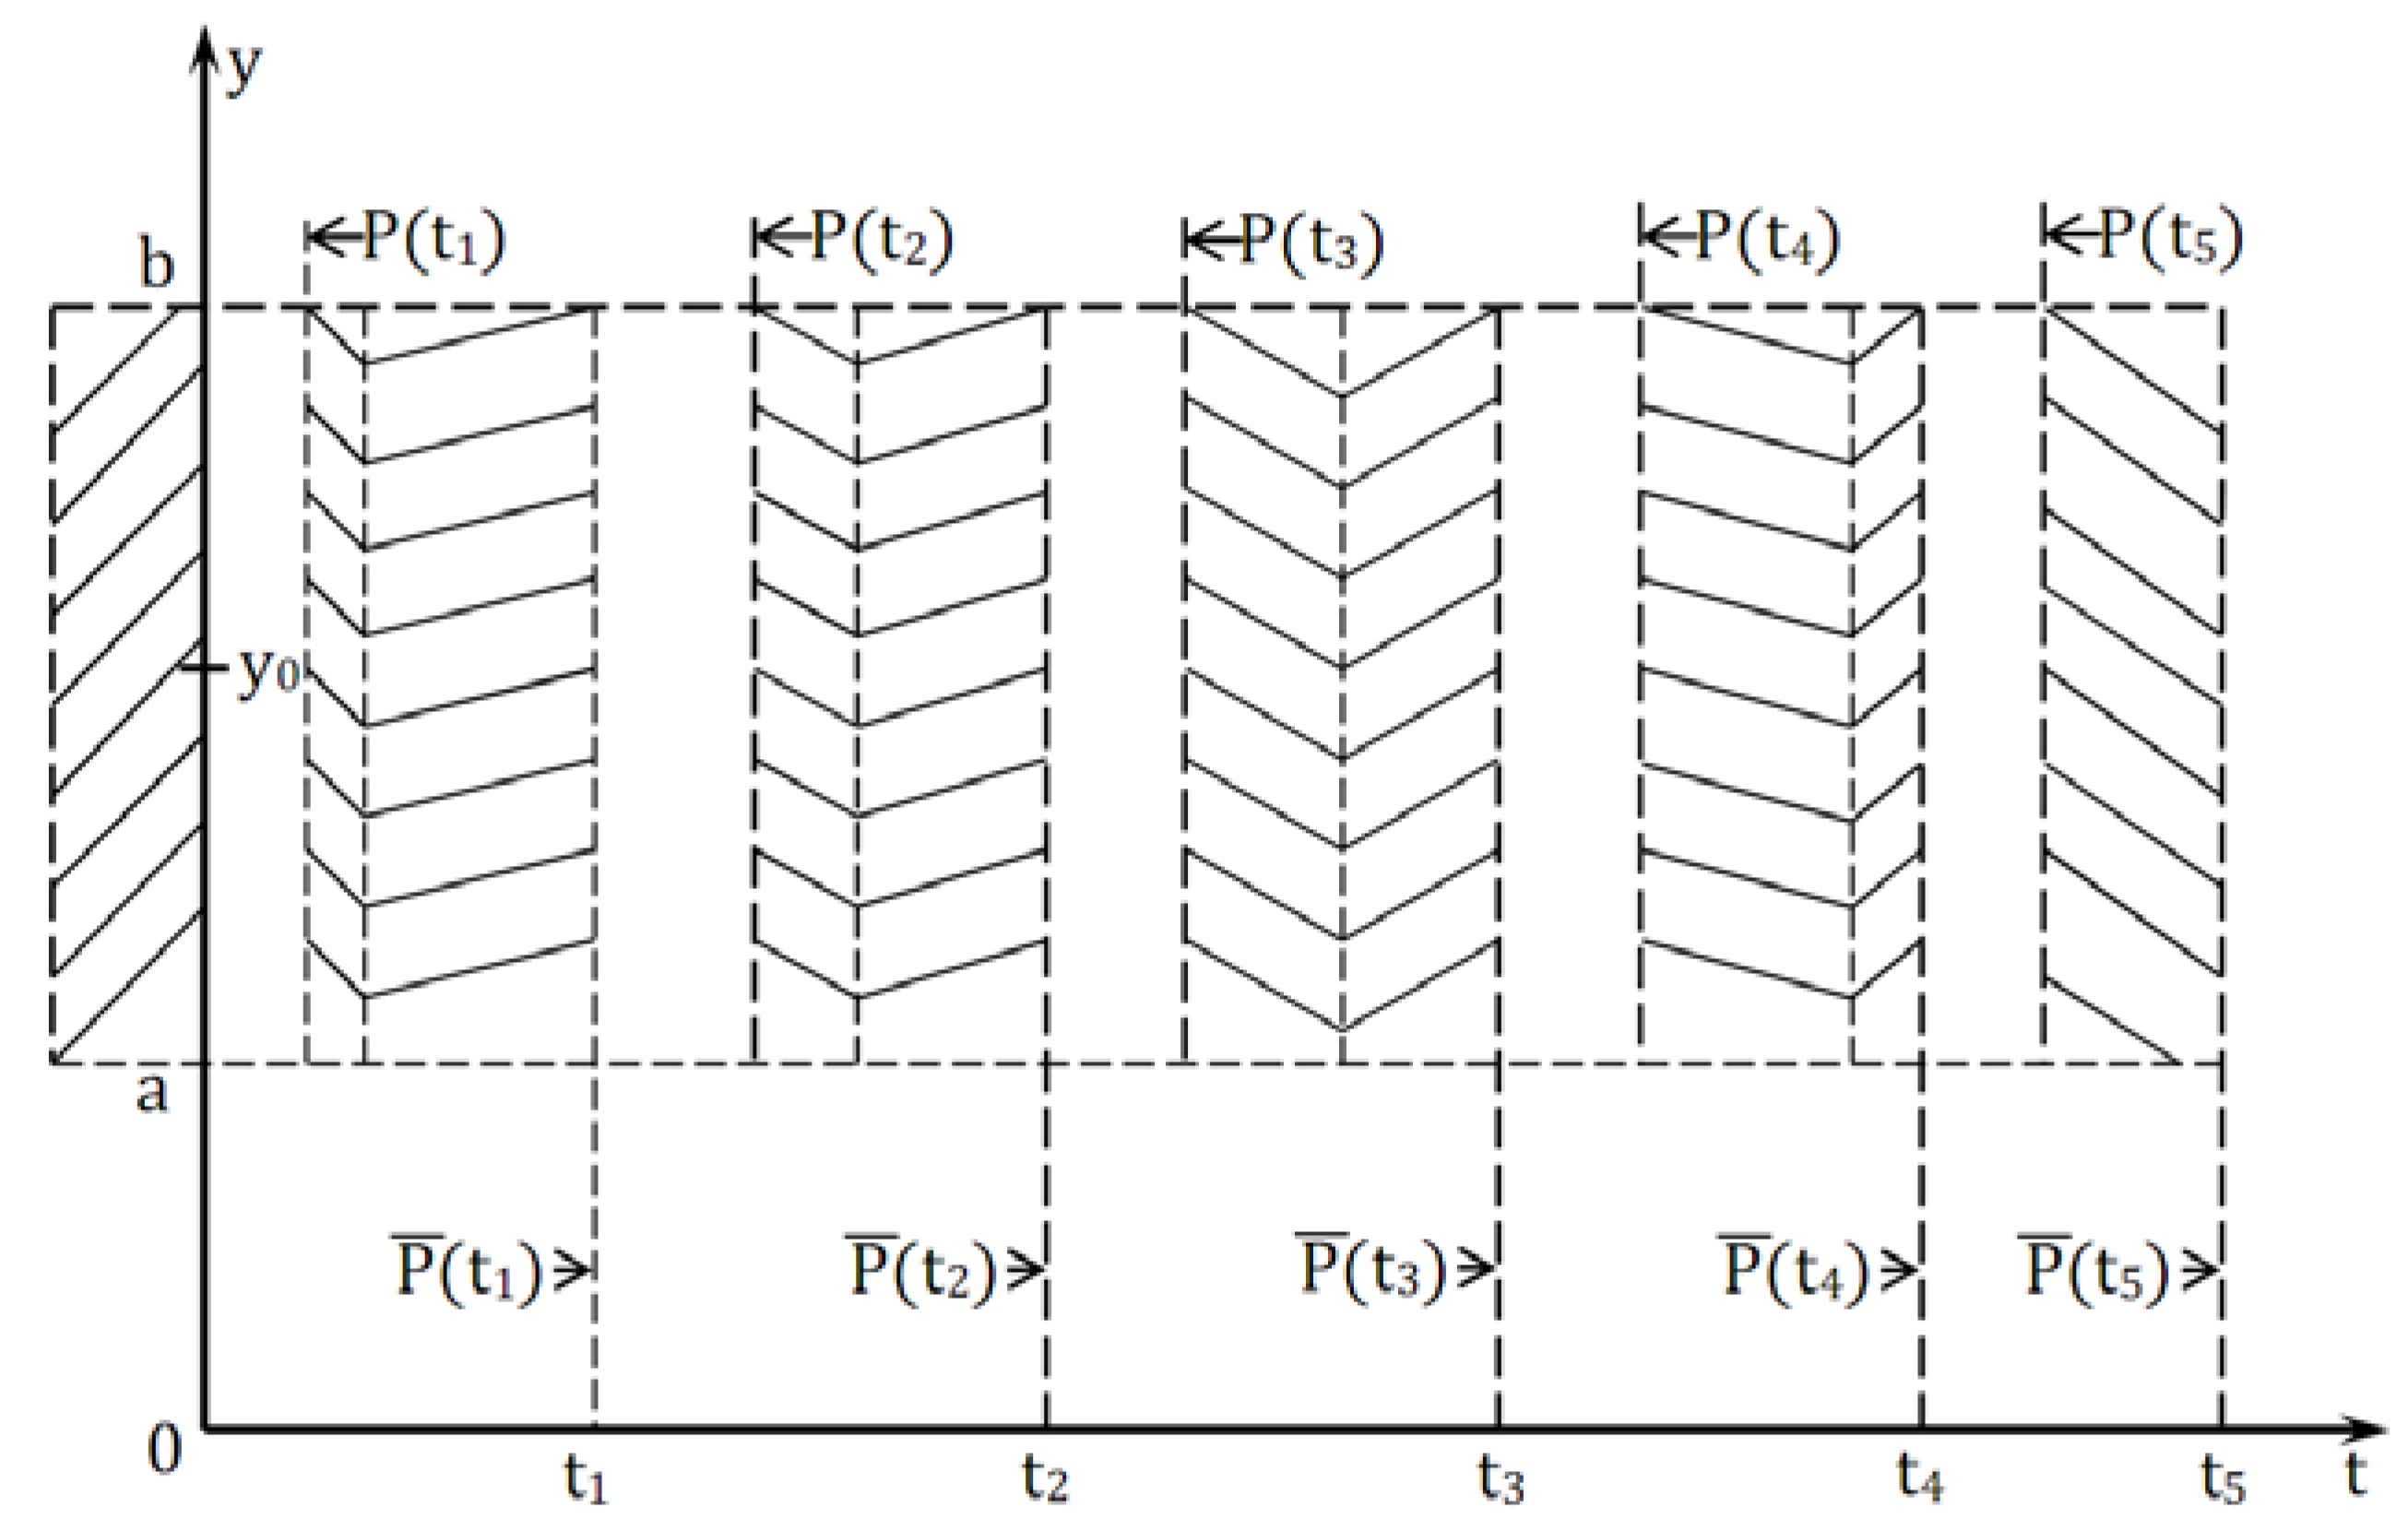
- The Formula (32) indicates that if the distance from a cathode to a substrate is large enough, then there are a lot of particle in front of the substrate, and those particles move perpendicular to the initial direction of the motion (parallel to the substrate). The Formula (34) suggests that the dispersion of the motion direction in front of the substrate increases, which indicates an increase in randomness in the trajectories of the particles being deposited. The Formula (36) proves the fractal nature of the process of particle deposition on a substrate.
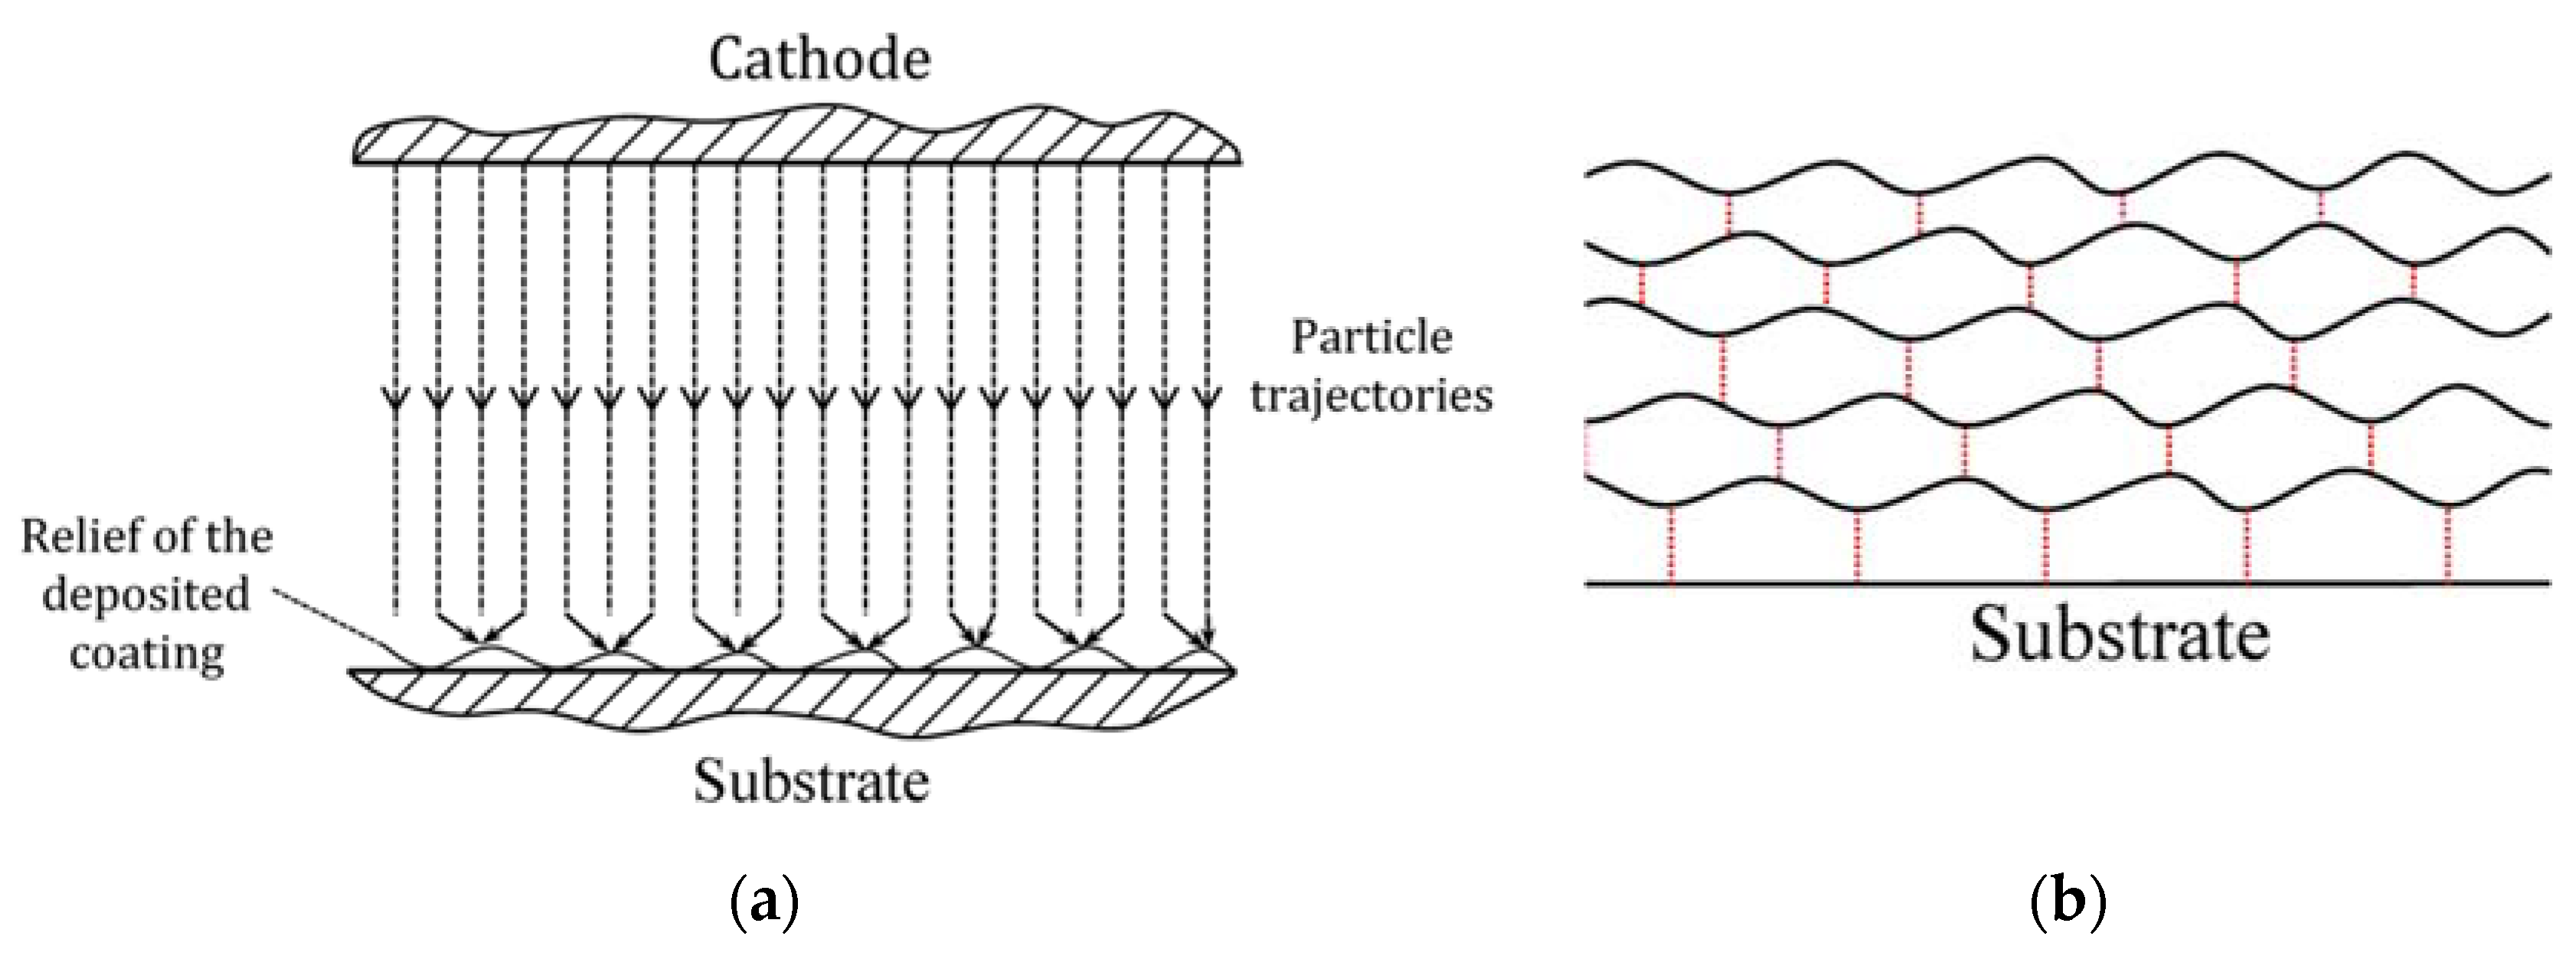
- During the formation of the multilayer coating structure, mismatched fractal structures of the layers overlap each other and thus the clustering effect is largely leveled out (averaged). In turn, the above reduces the likelihood of cracking in the coating structure and makes it possible to predict an increase in the performance properties of the products with such coatings.
- The nanolayer period λ has a significant influence on the fractal structure of the coating. When λ is low (less than 38 nm), with an increase in the coating structure, a pronounced feather-like structure is formed, and grains grow. With an increase in λ up to 160 nm and higher, no feather-like structure is formed, and no grain growth is detected during the coating deposition.
Author Contributions
Funding
Conflicts of Interest
References
- Ghafouri-Azar, R.; Mostaghimi, J.; Chandra, S.; Charmchi, M. A stochastic model to simulate the formation of a thermal spray coating. J. Therm. Spray Technol. 2003, 12, 53–69. [Google Scholar] [CrossRef]
- Grujicic, M.; Lai, S.G. Multi-length scale modeling of chemical vapor deposition of titanium nitride coatings. J. Mater. Sci. 2001, 36, 2937–2953. [Google Scholar] [CrossRef]
- Birdsall, C.K. Particle-in-Cell charged-particle simulations, plus Monte Carlo collisions with neutral atoms, PIC-MCC. IEEE Trans. Plasma Sci. 1991, 19, 65–85. [Google Scholar] [CrossRef]
- Kwok, D.T.K.; Cornet, C. Numerical simulation of metal plasma immersion ion implantation (MePIIID) on a sharp cone and a fine tip by a multiple-grid particle-in-cell (PIC) method. IEEE Trans. Plasma Sci. 2006, 34, 2434–2442. [Google Scholar] [CrossRef]
- Bultinck, E.; Bogaerts, A. Particle-in-cell/monte carlo collisions treatment of an Ar/O2 magnetron discharge used for the reactive sputter deposition of TiOx films. New J. Phys. 2009, 11, 103010. [Google Scholar] [CrossRef]
- Siemers, M.; Pflug, A.; Melzig, T.; Gehrke, K.; Weimar, A.; Szyszka, B. Model based investigation of Ar+ ion damage in DC magnetron sputtering. Surf. Coat. Technol. 2014, 241, 50–53. [Google Scholar] [CrossRef]
- Cansizoglu, H.; Yurukcu, M.; Cansizoglu, M.F.; Karabacak, T. Investigation of physical vapor deposition techniques of conformal shell coating for core/shell structures by Monte Carlo simulations. Thin Solid Film. 2015, 583, 122–128. [Google Scholar] [CrossRef]
- Fancey, K.S. A coating thickness uniformity model for physical vapour deposition systems: Overview. Surf. Coat. Technol. 1995, 71, 16–29. [Google Scholar] [CrossRef]
- Fancey, K.S. A coating thickness uniformity model for physical vapour deposition systems: Further analysis and development. Surf. Coat. Technol. 1998, 105, 76–83. [Google Scholar] [CrossRef]
- Fuke, I.; Prabhu, V.; Baek, S. Computational model for predicting coating thickness in electron beam physical vapor deposition. J. Manuf. Process. 2005, 7, 140–152. [Google Scholar] [CrossRef]
- James, A.S.; Matthews, A. A simple model for the prediction of coating thickness uniformity from limited measured data. Surf. Coat. Technol. 1993, 61, 282–286. [Google Scholar] [CrossRef]
- De Matos Loureiro da Silva Pereira, V.E.; Nicholls, J.R.; Newton, R. Modelling the EB-PVD thermal barrier coating process: Component clusters and shadow masks. Surf. Coat. Technol. 2017, 311, 307–313. [Google Scholar] [CrossRef] [Green Version]
- Baek, S.; Prabhu, V. Technical paper: Simulation model for an EB-PVD coating structure using the level set method. J. Manuf. Process. 2009, 11, 1–7. [Google Scholar] [CrossRef]
- Frenkel, D.; Smit, B. Understanding Molecular Simulation, 2nd ed.; Academic Press: Cambridge, MA, USA, 2002; p. 638. [Google Scholar]
- Moarrefzadeh, A. Simulation and modeling of physical vapor deposition (PVD) process. WSEAS Trans. Appl. Theor. Mech. 2012, 7, 106–111. [Google Scholar]
- Westkämper, E.; Klein, P.; Gottwald, B.; Sommadossi, S.; Baumann, P.; Gemmler, A. A contribution of Molecular Dynamics simulation to sophisticated engineering of coating processes applied to PVD DC sputter deposition. Surf. Coat. Technol. 2005, 200, 872–875. [Google Scholar] [CrossRef]
- Aksenova, E.V.; Kshevetskiy, M.S. Computational Methods for Studying Molecular Dynamics; St. Petersburg State University Publishing House: Petersburg, Russia, 2009; p. 50. [Google Scholar]
- Pflug, A.; Siemers, M.; Melzig, T.; Schäfer, L.; Bräuer, G. Simulation of linear magnetron discharges in 2D and 3D. Surf. Coat. Technol. 2014, 260, 411–416. [Google Scholar] [CrossRef]
- Liu, M.-J.; Zhang, M.; Zhang, X.-F.; Li, G.-R.; Zhang, Q.; Li, C.-X.; Li, C.-J.; Yang, G.-J. Transport and deposition behaviors of vapor coating materials in plasma spray-physical vapor deposition. Appl. Surf. Sci. 2019, 486, 80–92. [Google Scholar] [CrossRef]
- Yoshiya, M.; Wada, K.; Jang, B.K.; Matsubara, H. Computer simulation of nano-pore formation in EB-PVD thermal barrier coatings. Surf. Coat. Technol. 2004, 187, 399–407. [Google Scholar] [CrossRef]
- Gidalevich, E.; Goldsmith, S.; Boxman, R.L. Modeling of nonstationary vacuum arc plasma jet interaction with a neutral background gas. J. Appl. Phys. 2001, 90, 4355–4360. [Google Scholar] [CrossRef]
- Kubečka, M.; Obrusník, A.; Zikán, P.; Jílekjr, M.; Vencels, J.; Bonaventura, Z. Predictive simulation of antenna effect in PVD processes using fluid models. Surf. Coat. Technol. 2019, 379, 125045. [Google Scholar] [CrossRef]
- Pinto, G.; Silva, F.; Porteiro, J.; Míguez, J.; Baptista, A. Numerical simulation applied to PVD reactors: An overview. Coatings 2018, 8, 410. [Google Scholar] [CrossRef] [Green Version]
- Zhang, X.F.; Zhou, K.S.; Deng, C.M.; Liu, M.; Deng, Z.Q.; Deng, C.G.; Song, J.B. Gas-deposition mechanisms of 7YSZ coating based on plasma spray-physical vapor deposition. J. Eur. Ceram. Soc. 2016, 36, 697–703. [Google Scholar] [CrossRef]
- Li, J.; Li, C.-X.; Chen, Q.-Y.; Gao, J.-T.; Wang, J.; Yang, G.-J.; Li, C.-J. Super-Hydrophobic surface prepared by lanthanide oxide ceramic deposition through PS-PVD process. J. Therm. Spray Technol. 2017, 26, 398–408. [Google Scholar] [CrossRef]
- Hass, D.D.; Yang, Y.Y.; Wadley, H.N.G. Pore evolution during high pressure atomic vapor deposition. J. Porous Mater. 2010, 17, 27–38. [Google Scholar] [CrossRef]
- Vereshchaka, A.A.; Vereshchaka, A.S.; Mgaloblishvili, O.; Morgan, M.N.; Batako, A.D. Nano-scale multilayered-composite coatings for the cutting tools. Int. J. Adv. Manuf. Tech. 2014, 72, 303–317. [Google Scholar] [CrossRef]
- Vereschaka, A.; Tabakov, V.; Grigoriev, S.; Sitnikov, N.; Oganyan, G.; Andreev, N.; Milovich, F. Investigation of wear dynamics for cutting tools with multilayer composite nanostructured coatings in turning constructional steel. Wear 2019, 420–421, 17–37. [Google Scholar] [CrossRef]
- Vereschaka, A.; Tabakov, V.; Grigoriev, S.; Sitnikov, N.; Milovich, F.; Andreev, N.; Bublikov, J. Investigation of wear mechanisms for the rake face of a cutting tool with a multilayer composite nanostructured Cr–CrN–(Ti,Cr,Al,Si)N coating in high-speed steel turning. Wear 2019, 438–439, 203069. [Google Scholar] [CrossRef]
- Vereshchaka, A.S.; Vereshchaka, A.A.; Kirillov, A.K. Ecologically friendly dry machining by cutting tool from layered composition ceramic with nano-scale multilayered coatings. Key Eng. Mater. 2012, 496, 67–74. [Google Scholar] [CrossRef]
- Vereschaka, A.; Tabakov, V.; Grigoriev, S.; Aksenenko, A.; Sitnikov, N.; Oganyan, G.; Seleznev, A.; Shevchenko, S. Effect of adhesion and the wear-resistant layer thickness ratio on mechanical and performance properties of ZrN–(Zr,Al,Si)N coatings. Surf. Coat. Technol. 2019, 357, 218–234. [Google Scholar] [CrossRef]
- Volosova, M.A.; Grigor’ev, S.N.; Kuzin, V.V. Effect of titanium nitride coating on stress structural inhomogeneity in oxide-carbide ceramic. Part 4. Action of heat flow. Refract. Ind. Ceram. 2015, 56, 91–96. [Google Scholar] [CrossRef]
- Metel, A.; Bolbukov, V.; Volosova, M.; Grigoriev, S.; Melnik, Y. Equipment for Deposition of thin metallic films bombarded by fast argon atoms. Instrum. Exp. Tech. 2014, 57, 345–351. [Google Scholar] [CrossRef]
- Metel, A.S.; Grigoriev, S.N.; Melnik, Y.A.; Bolbukov, V.P. Characteristics of a fast neutral atom source with electrons injected into the source through its emissive grid from the vacuum chamber. Instrum. Exp. Tech. 2012, 55, 288–293. [Google Scholar] [CrossRef]
- Metel, A.; Bolbukov, V.; Volosova, M.; Grigoriev, S.; Melnik, Y. Source of metal atoms and fast gas molecules for coating deposition on complex shaped dielectric products. Surf. Coat. Technol. 2013, 225, 34–39. [Google Scholar] [CrossRef]
- Grigoriev, S.N.; Sobol, O.V.; Beresnev, V.M.; Serdyuk, I.V.; Pogrebnyak, A.D.; Kolesnikov, D.A.; Nemchenko, U.S. Tribological characteristics of (TiZrHfVNbTa) N coatings applied using the vacuum arc deposition method. J. Frict. Wear 2014, 35, 359–364. [Google Scholar] [CrossRef]
- Vereschaka, A.A.; Grigoriev, S.N.; Vereschaka, A.S.; Popov, A.Y.; Batako, A.D. Nano-scale multilayered composite coatings for cutting tools operating under heavy cutting conditions. Procedia CIRP 2014, 14, 239–244. [Google Scholar] [CrossRef] [Green Version]
- Vereschaka, A.A.; Volosova, M.A.; Grigoriev, S.N.; Vereschaka, A.S. Development of wear-resistant complex for high-speed steel tool when using process of combined cathodic vacuum arc deposition. Procedia CIRP 2013, 9, 8–12. [Google Scholar] [CrossRef] [Green Version]
- Grigoriev, S.; Melnik, Y.; Metel, A. Broad fast neutral molecule beam sources for industrial-scale beam-assisted deposition. Surf. Coat. Technol. 2002, 156, 44–49. [Google Scholar] [CrossRef]
- Grigoriev, S.N.; Melnik, Y.A.; Metel, A.S.; Panin, V.V. Broad beam source of fast atoms produced as a result of charge exchange collisions of ions accelerated between two plasmas. Instrum. Exp. Tech. 2009, 52, 602–608. [Google Scholar] [CrossRef]
- Metel, A.S.; Grigoriev, S.N.; Melnik, Y.; Bolbukov, V.P. Broad beam sources of fast molecules with segmented cold cathodes and emissive grids. Instrum. Exp. Tech. 2012, 55, 122–130. [Google Scholar] [CrossRef]
- Metel, A.S.; Grigoriev, S.N.; Melnik, Y.A.; Prudnikov, V.V. Glow discharge with electrostatic confinement of electrons in a chamber bombarded by fast electrons. Plasma Phys. Rep. 2011, 37, 628–637. [Google Scholar] [CrossRef]
- Miklashevich, I.A.; Chigarev, A.V.; Korsunsky, A.M. Variational determination of the crack trajectory in inhomogeneous media. Int. J. Fract. 2001, 111, L29–L34. [Google Scholar] [CrossRef]
- Brownlee, K.A. Statistical Theory and Methodology in Science and Engineering; Wiley: New York, NY, USA, 1965. [Google Scholar]
- Miklashevich, I.A.; Chigarev, A.V. Equation of the crack front with allowance for the metric properties of the material. Russ. Phys. J. 2002, 45, 1159–1164. [Google Scholar] [CrossRef]
- Lévy, P. Processus Stochastiques et Movement Brownien; Villars, G., Ed.; Academic Press: Cambridge, MA, USA, 1965. [Google Scholar]
- Chigarev, A.; Polenov, V.; Shirvel, P. Simulation of tsunami effect by seismic wave propagation in hypoplastic medium at vicinity of free boundary. Univ. J. Mech. Eng. 2018, 6, 9–20. [Google Scholar] [CrossRef]
- Polenov, V.S.; Chigarev, A.V. Propagation of waves in an inhomogeneous viscoelastic medium with initial stresses. Pmm J. Appl. Math. Mech. 1994, 58, 563–568. [Google Scholar] [CrossRef]
- Chigarev, A.; Chigarev, J. Expansion of wave rays and fronts in media with inhomogeneous structure. Univers. J. Mech. Eng. 2018, 6, 76–95. [Google Scholar] [CrossRef] [Green Version]
- Zhao, C.; Yang, C. Nonlinear Smoluchowski velocity for electroosmosis of power-law fluids over a surface with arbitrary zeta potentials. Electrophoresis 2010, 31, 973–979. [Google Scholar] [CrossRef]
- Norris, J.R. Smoluchowski’s coagulation equation: Uniqueness, nonuniqueness and a hydrodynamic limit for the stochastic coalescent. Ann. Appl. Probab. 1999, 9, 78–109. [Google Scholar] [CrossRef]
- Vereschaka, A.; Tabakov, V.; Grigoriev, S.; Sitnikov, N.; Andreev, N.; Milovich, F. Investigation of wear and diffusion processes on rake faces of carbide inserts with Ti–TiN–(Ti,Al,Si)N composite nanostructured coating. Wear 2018, 416–417, 72–80. [Google Scholar] [CrossRef]
- Vereschaka, A.; Tabakov, V.; Grigoriev, S.; Sitnikov, N.; Milovich, F.; Andreev, N.; Sotova, C.; Kutina, N. Investigation of the influence of the thickness of nanolayers in wear-resistant layers of Ti–TiN–(Ti,Cr,Al)N coating on destruction in the cutting and wear of carbide cutting tools. Surf. Coat. Technol. 2020, 385, 125402. [Google Scholar] [CrossRef]
- Vereschaka, A.; Aksenenko, A.; Sitnikov, N.; Migranov, M.; Shevchenko, S.; Sotova, C.; Batako, A.; Andreev, N. Effect of adhesion and tribological properties of modified composite nano-structured multi-layer nitride coatings on WC-Co tools life. Tribol. Int. 2018, 128, 313–327. [Google Scholar] [CrossRef]
- Vereschaka, A.; Grigoriev, S.; Sitnikov, N.; Milovich, F.; Aksenenko, A.; Andreev, N. Investigation of performance and cutting properties of carbide tool with nanostructured multilayer Zr–ZrN–(Zr0.5,Cr0.3,Al0.2)N coating. Int. J. Adv. Manuf. Technol. 2019, 102, 2953–2965. [Google Scholar] [CrossRef]


| Process | pN (Pa) | U (V) | ITi (A) | IAl (A) | ICr (A) |
|---|---|---|---|---|---|
| Pumping and heating of vacuum chamber | 0.06 | +20 | 75 | 120 | 65 |
| Heating and cleaning of products with gaseous plasma | 2.0 | 100 DC/900 AC f = 10 kHz, 2:1 | 85 | 80 | - |
| Deposition of coating | 0.42 | −800 DC | 75 | 160 | 55 |
| Cooling of products | 0.06 | - | - | - | - |
© 2020 by the authors. Licensee MDPI, Basel, Switzerland. This article is an open access article distributed under the terms and conditions of the Creative Commons Attribution (CC BY) license (http://creativecommons.org/licenses/by/4.0/).
Share and Cite
Vereschaka, A.; Grigoriev, S.; Chigarev, A.; Milovich, F.; Sitnikov, N.; Andreev, N.; Oganian, G.; Bublikov, J. Convection–Diffusion Model for the Synthesis of PVD Coatings and the Influence of Nanolayer Parameters on the Formation of Fractal and Hierarchical Structures. Coatings 2020, 10, 927. https://doi.org/10.3390/coatings10100927
Vereschaka A, Grigoriev S, Chigarev A, Milovich F, Sitnikov N, Andreev N, Oganian G, Bublikov J. Convection–Diffusion Model for the Synthesis of PVD Coatings and the Influence of Nanolayer Parameters on the Formation of Fractal and Hierarchical Structures. Coatings. 2020; 10(10):927. https://doi.org/10.3390/coatings10100927
Chicago/Turabian StyleVereschaka, Alexey, Sergey Grigoriev, Anatoli Chigarev, Filipp Milovich, Nikolay Sitnikov, Nikolay Andreev, Gaik Oganian, and Jury Bublikov. 2020. "Convection–Diffusion Model for the Synthesis of PVD Coatings and the Influence of Nanolayer Parameters on the Formation of Fractal and Hierarchical Structures" Coatings 10, no. 10: 927. https://doi.org/10.3390/coatings10100927