Article

A Promising Nano-Insulating-Oil for Industrial Application: Electrical Properties and Modification Mechanism

State Key Laboratory of Power Transmission Equipment & System Security and New Technology, Chongqing University, Chongqing 400030, China
*
Author to whom correspondence should be addressed.
Nanomaterials 2019, 9(5), 788; https://doi.org/10.3390/nano9050788
Submission received: 28 April 2019 / Revised: 18 May 2019 / Accepted: 21 May 2019 / Published: 23 May 2019
(This article belongs to the Special Issue Advances in Nanofluids)

Abstract

:
Despite being discovered more than 20 years ago, nanofluids still cannot be used in the power industry. The fundamental reason is that nano-insulating oil has poor stability, and its electrical performance decreases under negative impulse voltage. We found that C60 nanoparticles can maintain long-term stability in insulating oil without surface modification. C60 has strong electronegativity and photon absorption ability, which can comprehensively improve the electrical performance of insulating oil. This finding has great significance for the industrial application of nano-insulating oil. In this study, six concentrations of nano-C60 modified insulating oil (CMIO) were prepared, and their breakdown strength and dielectric properties were tested. The thermally stimulated current (TSC) curves of fresh oil (FO) and CMIO were experimentally determined. The test results indicate that C60 nanoparticles can simultaneously improve the positive and negative lightning impulse and power frequency breakdown voltage of insulating oil, while hardly increasing dielectric loss. At 150 mg/L, the positive and negative lightning impulse breakdown voltages of CMIO increased by 7.51% and 8.33%, respectively, compared with those of FO. The AC average breakdown voltage reached its peak (18.0% higher compared with FO) at a CMIO concentration of 200 mg/L. Based on the test results and the special properties of C60, we believe that changes in the trap parameters, the strong electron capture ability of C60, and the absorption capacity of C60 for photons enhanced the breakdown performance of insulating oil by C60 nanoparticles.

Graphical Abstract

1. Introduction

Numerous studies on nano-insulating oil have been conducted since Argonne Laboratory proposed the concept of nanofluids in 1995 [1]. Thus far, no nano-insulating oil that can be used in the power industry has been discovered owing to the constraints caused by the following factors.

1.1. Long-Term Stability

Conventional nanoparticles (such as Fe3O4, TiO2, and Al2O3) are insoluble in oil. Matching surface modifiers must be used to ensure the long-term stability of these nanoparticles [2,3,4]. However, surface modifiers may deteriorate and fall off in long-term complex environments (such as heat, electricity, and magnetism), which weaken the dispersion of nanoparticles. Moreover, an improper amount of surface modifier may adversely affect the viscosity, as well as the physical and chemical stability, of the modified oil and even the heat transfer performance of nanoparticles [4].

1.2. Decrease in Negative Impulse Breakdown Performance

The positive impulse breakdown performance of most nano-insulating oils obviously improves. However, their negative impulse breakdown performance decreases to varying degrees, as shown in Table 1.
More than 90% of the lightning that occurs in nature is of negative polarity [13], therefore the decline in the negative impulse breakdown performance of nano-insulating oil restricts its application in power transformers [14].

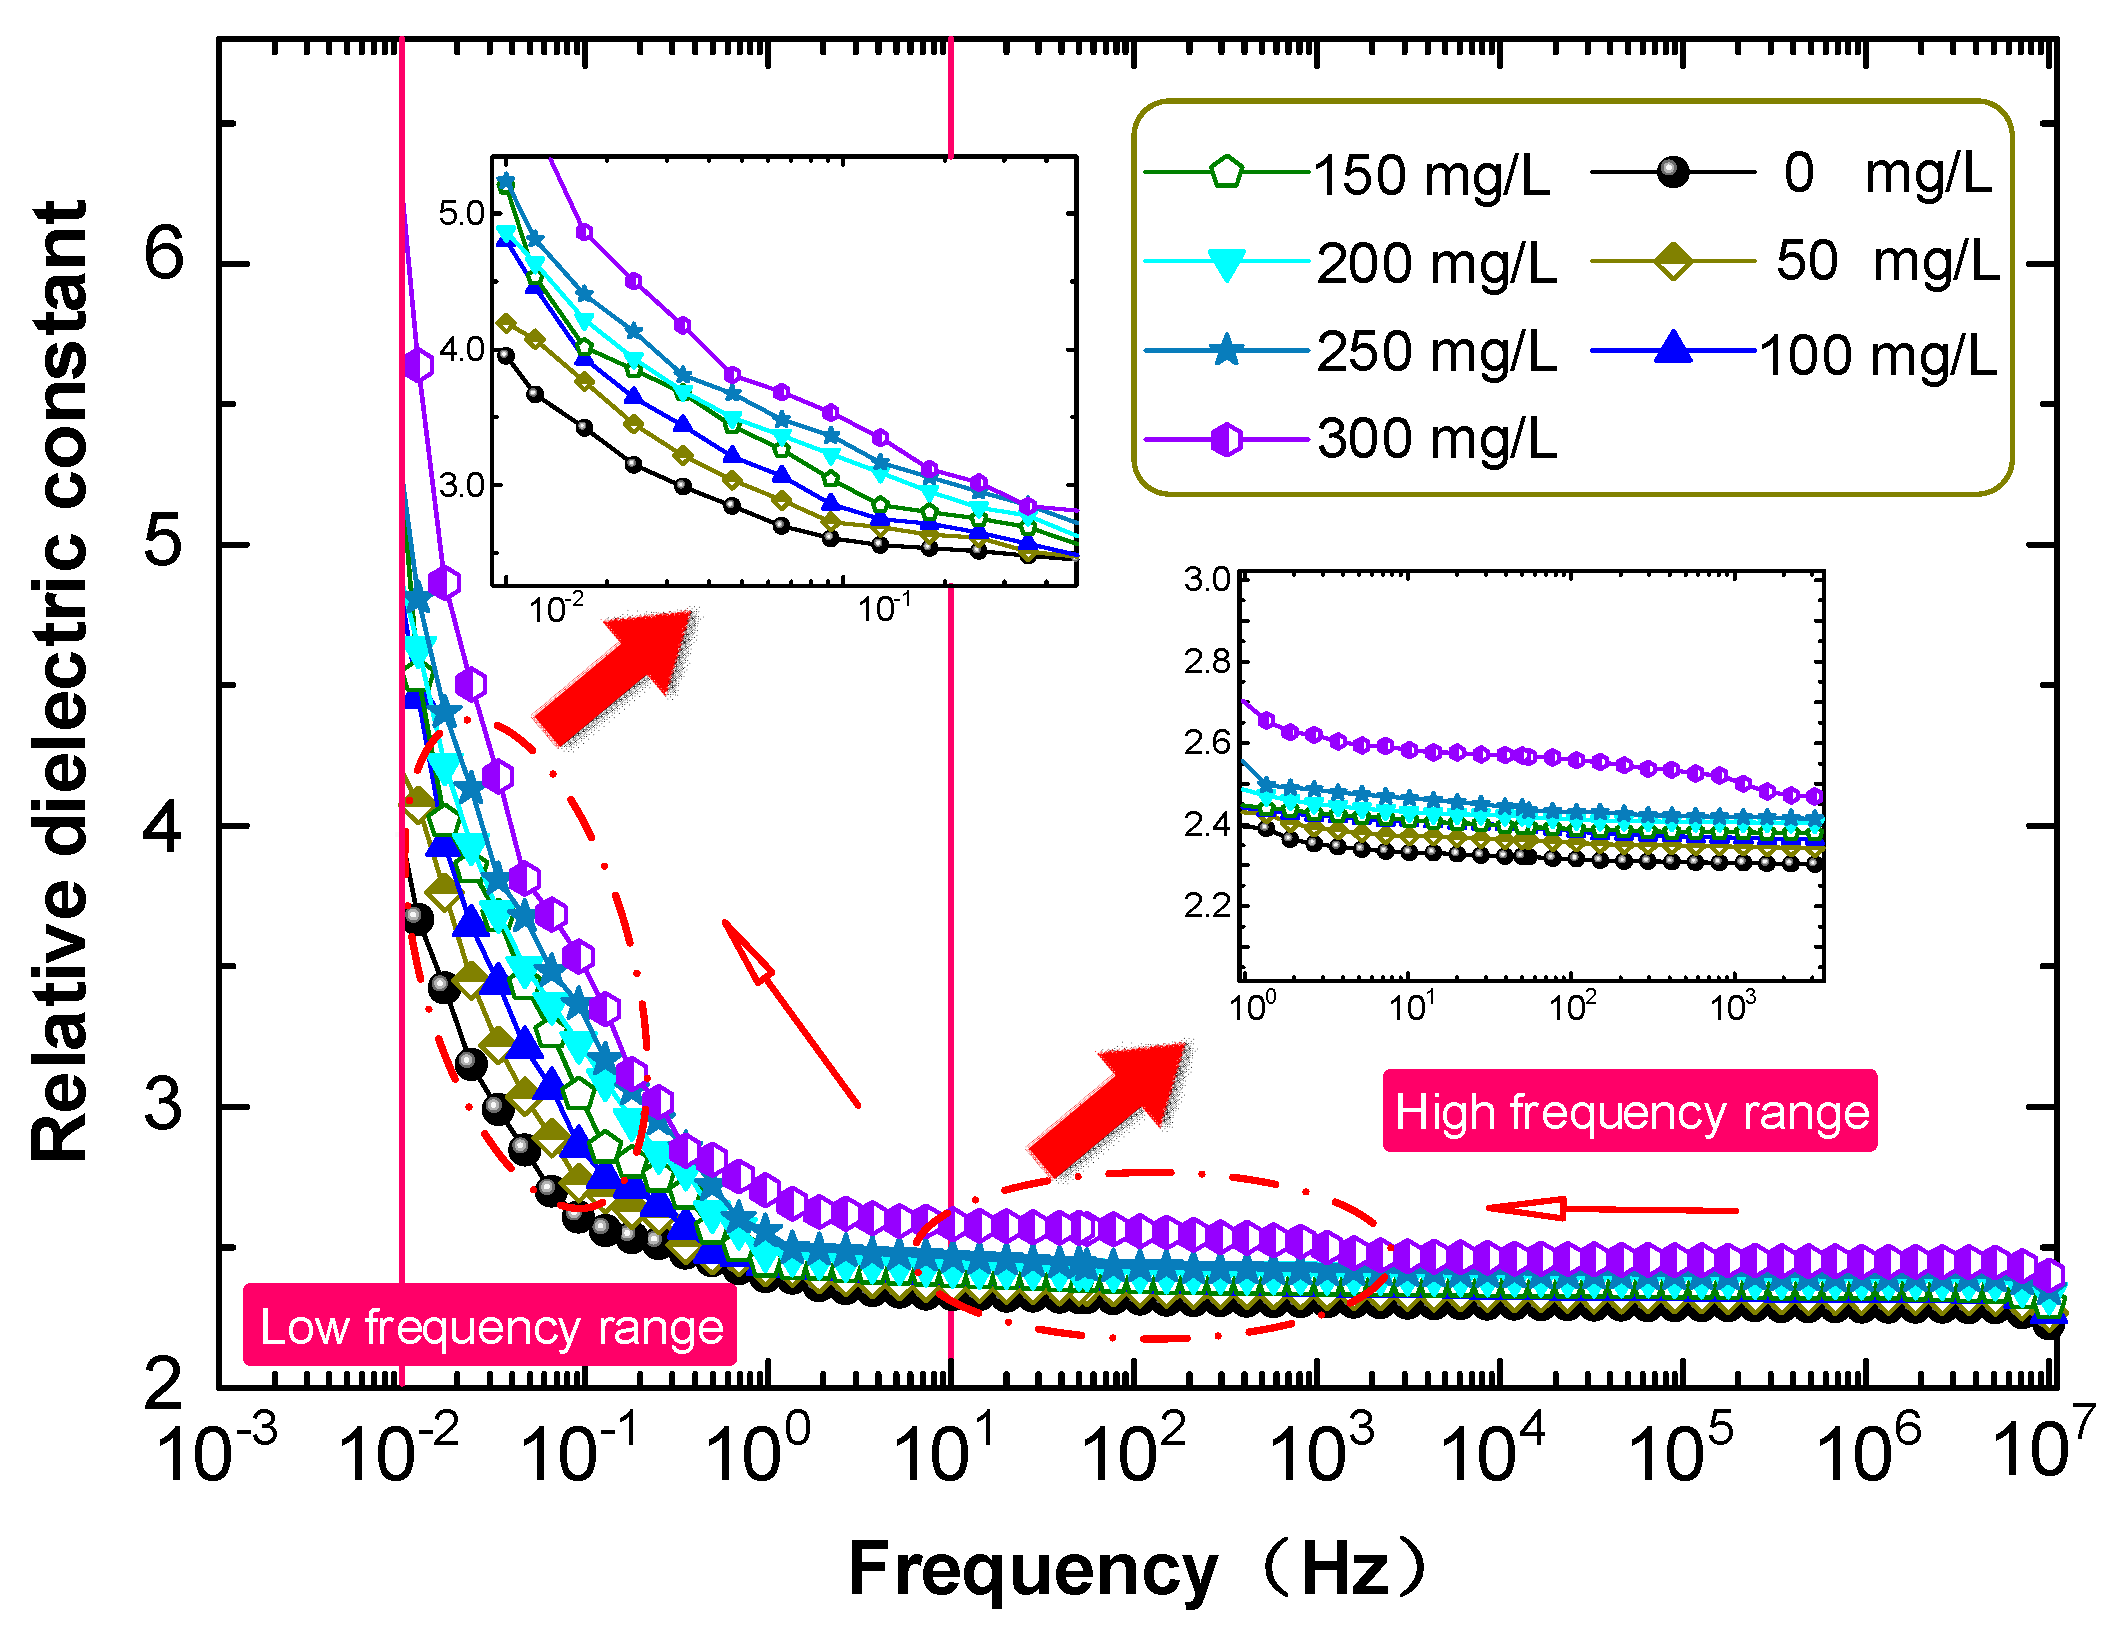
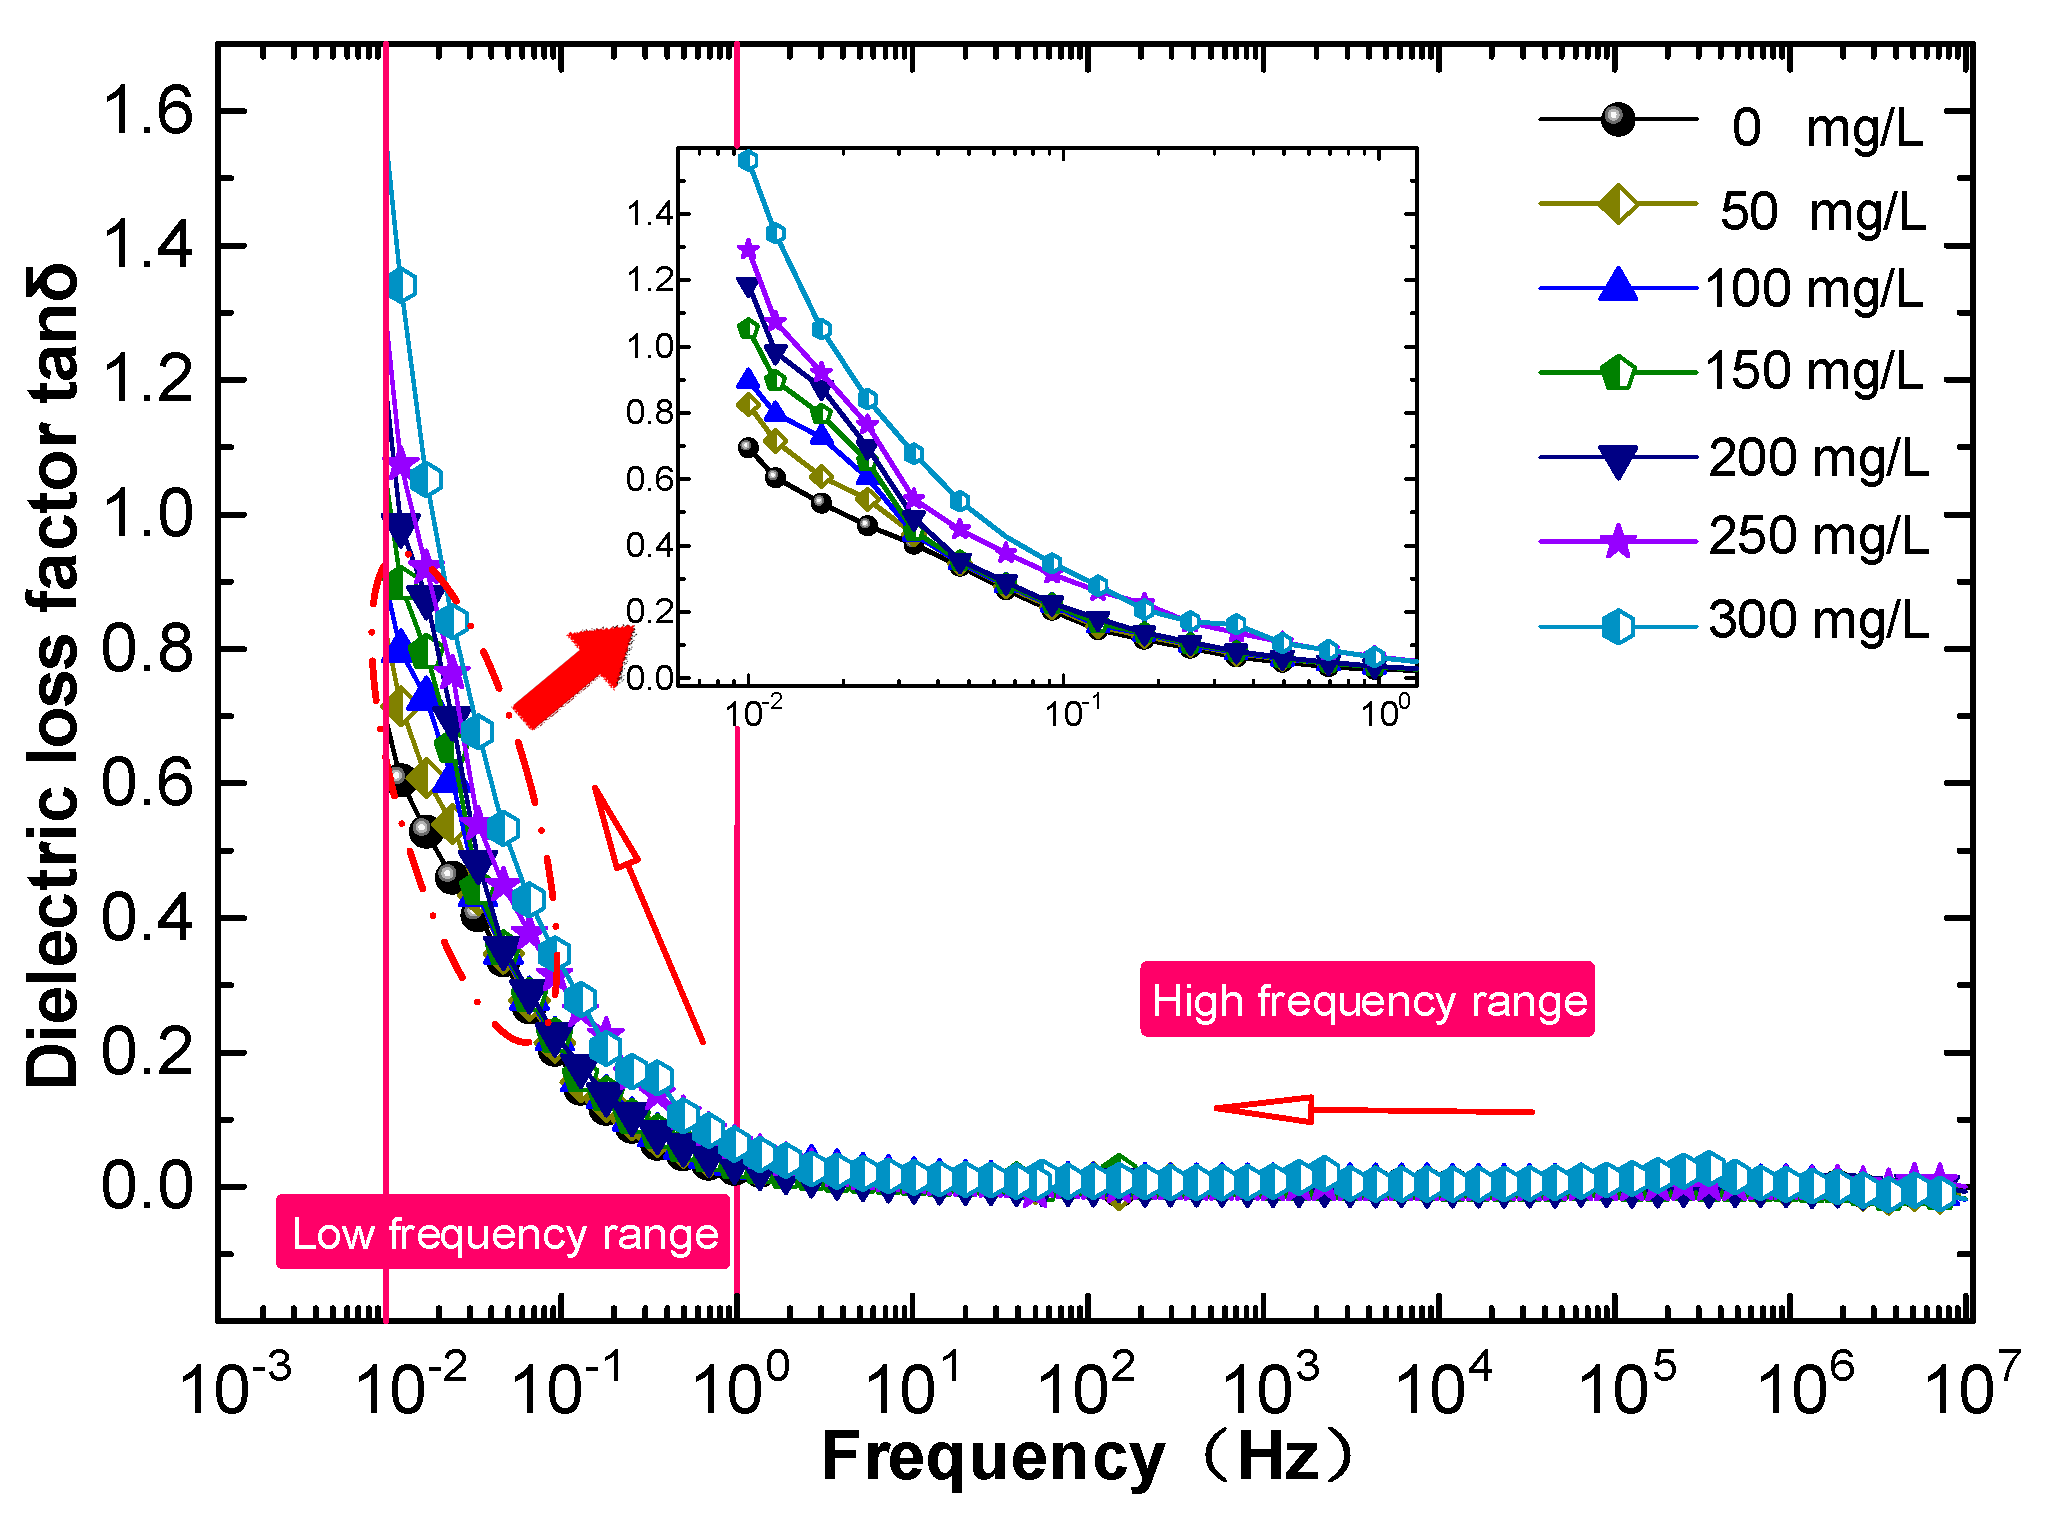
1.3. Significant Increase in Dielectric Loss

The improvement of electrical properties of nano-insulating oil may be accompanied by a substantial increase in dielectric loss. This increase affects the heat dissipation of the transformer and accelerates the thermal aging of the dielectric.
Table 2 shows the results of the electrical performance test performed by Sartoratto [15] on Fe3O4 nanoparticle-modified insulating oil. The table shows that Fe3O4 nanoparticles (average nanoparticle size is 7.4 nm) increase the breakdown voltage of insulating oil and induce a significant increase in dielectric loss. Liu [12] and Mergos [16] have also observed this phenomenon in insulating oils modified by other nanoparticles such as ZnO, TiO2, and CuO.
Recently, we have found that nano-insulating oil made of C60 nanoparticles can greatly overcome these three problems due to its excellent properties. Theoretical calculations show that the electron affinity potential of C60 is approximately 2.683 eV [17], which is higher than that of the excellent gas-insulating medium SF6 (electron affinity is approximately 1.06 eV [18]). Therefore, C60 has a strong adsorption capacity for electrons. A single molecule can accept at least six electrons [19]. Moreover, C60 can absorb a large number of photons through photopolymerization [20]. The C60 molecule is soluble in organic solvents, especially aromatic solvents with large π bonds [21,22]. Therefore, C60 nanoparticles have a certain natural solubility in transformer insulating oils (the main component contains aromatic hydrocarbons) that are nonpolar solvents.
In this study, a new type of nanofluid was prepared by dispersing C60 nanoparticles into insulating oil without the use of a surface modifier. The breakdown strength and dielectric properties of the prepared samples were tested, and the thermally stimulated current (TSC) curves of fresh oil (FO) and nano-C60 modified insulating oil (CMIO) were experimentally determined. We discuss the mechanism involved in the enhancement of the breakdown performance of insulating oil on this basis.

2. Experimental Setup

2.1. Preparation of Nanofluids

Transformer mineral oil (#25) and 99.9% pure C60 powder (Tanfeng Tech, Suzhou, China) were used in the tests. The technical specifications of the mineral oil satisfied the international standard ASTM D3487-2000(II) [23].
The surface modifier may adversely affect oil material stability and heat transfer performance. Given that C60 particles have a certain solubility in insulating oil, surface modifiers were not used in the experiments. The photopolymerization of C60 can be prevented by protecting CMIO from light during preparation [24].
Pretreatments were carried out on all experimental samples as follows: First, mineral oil (#25) was filtered through a membrane filter for the removal of contaminants (the quality of the oil meets the requirement of CIGRE working group 12.17: particle content with a diameter larger than 5 μm is lower than 300 per 100 mL). Then, C60 particles and insulating oil were separately dried at 90 °C for 48 h in a vacuum drying oven. Finally, the mechanical grinding of the C60 nanoparticles and vacuum degassing of the insulating oil were performed.
Ultrasonication can effectively break the agglomeration and reduce particle size in fluid [25]. After the pretreatments, the C60 nanoparticles were placed in the insulating oil and ultrasonically dispersed at 60 °C for at least 60 min (sx-sonic FS-1800N, maximum volume =3 L, ultrasonic peak output = 1800 W, frequency = 20 kHz, ultrasonic horn diameter = 20 mm). The ultrasonic power used in the test was 70% of the maximum output power. After 6 seconds of continuous ultrasonic operation, it stopped for 6 seconds and then started the next operation (instrument setting) to prevent the ultrasonic horn and sample temperature from being too high. The applied energy per volume (weight) of nanoparticle material in suspension was estimated to be ca. 37.8 kJ per 50 mL of particles (0.015 g). The kinematic viscosity of the oil sample was approximately 10.8 mm2/s (40 °C). Mechanical agitation was required for 5 min after each 15 min of ultrasonication. CMIO samples with concentrations of 50, 100, 150, 200, 250, and 300 mg/L were prepared and dried in a vacuum oven for 48 h at 60 °C.

2.2. AC Breakdown Tests

A Portable Oil Tester IJJD-80 (Ruixin Electric, Wuhan, China) (Figure 1) was used to measure AC breakdown voltage according to IEC-60156 [26]. The gap between the brass electrodes was set at 2.5 mm. A 50 Hz AC voltage with a rising rate of 2 kV/s was applied to the oil cup. The initial standing time was set at 5 min before the application of voltage. The time interval with stirring action and standing time after each breakdown were set at 2 min. Each sample was tested six times, and the average value was taken as the power-frequency breakdown voltage value. All the experiments were performed at room temperature.

2.3. Lightning Impulse Breakdown Tests

A consecutive impulse generator (30 kJ/400 kV) was used, and voltage signals measured by a high voltage divider were recorded by a TDS2024C impulse analysis system (Xinyuan Electric, Yangzhou, China), as shown in Figure 2.
The 50% lightning breakdown voltages (hereinafter referred to as U50) of the FO and CMIO under positive and negative lightning impulse voltages were obtained through the up-and-down method [27]. Needle-plate electrodes with an oil gap of 3 mm were used, and the wavefront/tail time of the impulse voltage was 1.2/50 μs. The expected breakdown voltages of the positive and negative impulse breakdown voltages were set at 35 and 46 kV, respectively. Applied voltage varies in 1 kV of the expected breakdown voltage, and at least 50 effective shots in total were tested for each sample. The relaxation time between the consecutive shots was 5 min, and the agitation operation lasted for 1 min.

2.4. Frequency Domain Dielectric Spectrum Tests

A Novocontrol Concept 80 Broadband Dielectric Spectrometer (Novocontrol Tech, Montabaur, Germany) was used to measure the dielectric parameters of the FO and CMIO samples. The test frequency in this study ranged from 10−2 Hz to 107 Hz, and the test temperature was set at 30 °C. The temperature accuracy was ±0.01 °C. A calibrating conversion module was adopted to prevent measurement error caused by leakage current.

2.5. TSC Tests

The trapping parameters of electrons in dielectric were determined through the TSC technique [28]. The curve plotting the dependence of TSC on temperature can be used in the calculation of trap level and trap density [29]. Figure 3 shows the TSC measurement system we used.
During the test, the temperature was adjusted with liquid nitrogen. Data were recorded using LabVIEW software (WinTSC V1.48).
First, the oil sample was added to the sample cell, and a negative DC field of 4 kV/mm was applied to the tested sample for 30 min at 323 K. Then, the temperature was lowered to 243 K at a rate of 10 K/min for 15 min. Finally, the sample was heated to 353 K at a rate of 2 K/min. The current and sample temperature during the process were recorded.

2.6. Transmission Electron Microscopy (TEM)

C60 nanoparticles were examined with a high-resolution transmission electron microscope (HT7700, Hitachi, Japan). The maximum resolution of TEM used in the test was 0.204 nm, and the acceleration voltage was 100 kV.

2.7. Particle Size Distribution and Zeta Potential Tests

A Malvern Zetasizer Nano ZS90 (Malvern, UK) was used to measure the particle size distribution and zeta potential of the samples. The maximum particle size that the instrument can measure ranges from 5 μm to 0.3 nm, and the minimum sample volume for particle size distribution and zeta potential are only 20 and 150 μL, respectively.

3. Results

3.1. Zeta Potential and Particle Size Distribution of CMIO

Electrostatic repulsion among nanoparticles increases at high zeta potential, and this effect signifies good suspension stability [30,31]. Zeta potential test results are related to the pH and concentration of nanofluids [32,33]. Therefore, for the dispersed particles in insulating oil at 100 mg/L concentration, measurements were performed with a 633 nm He/Ne laser at a temperature of 25 °C according to the actual test requirements, so that the requirement of transmittance intensity was satisfied. The refractive index (RI) of C60 particles and insulating oil were set to 1.96 [34] and 1.48, respectively. We selected the test conditions as pH=7, and a total of 12 measurements were taken. The results are shown in Table 3.
An absolute value of zeta potential greater than 30 mV indicates good dispersion stability [31,35]. Therefore, the CMIO has good dispersion stability.
The particle size distribution of the newly prepared CMIO and the CMIO kept for 12 months were tested. The test results are shown in Figure 4.
Figure 4 shows that the particle size distribution of the C60 particles in the newly prepared CMIO is mainly concentrated around 300 nm, and 19.7% of the particles have diameters of 290–295 nm. The particle size distribution of CMIO kept for 12 months is also concentrated around 300 nm, in which particles with a size of 290–295 nm account for 18.4%. The average particle size of the newly prepared CMIO is 305.7 nm, whereas the average particle size of the CMIO kept for 12 months is 320.1 nm.
Notably, surface modifiers were not used for the C60 nanoparticles. However, the particle size of CMIO kept for 12 months showed no significant change. This phenomenon is due to the fact that C60 can dissolve in insulating oil. It should be noted that although the CMIO was stable, the observation period was limited; we will focus on this stability over a longer period. Moreover, aging is a problem faced by transformer oil, and the effect of aging on the solubility and stability of C60 nanoparticles in transformer oil remains to be further studied.

3.2. Micromorphology of Nano-C60

We suspended C60 particles in absolute ethyl alcohol and dripped the mixture onto an ultra-thin carbon mesh. The internal morphology of the sample on ultra-thin carbon mesh was observed by TEM after the alcohol had completely volatilized. The test results are shown in Figure 5. The C60 nanoparticles are round, and the diameters of most particles are less than 30 nm.
The particle sizes of the C60 nanoparticles suspended in CMIO increase compared with the particle sizes of the C60 nanoparticles in Figure 5. This increase indicates that some C60 nanoparticles conglomerated during the preparation process, possibly because no surface modifiers were applied to the C60 nanoparticles. However, CMIO without surface modifiers still shows good stability.

3.3. Breakdown Characteristics of FO and CMIO

In this study, we used the standard lightning impulse wave of positive and negative polarity to determine the breakdown performance of FO and CMIO. The test results are plotted in Figure 6.
The C60 nanoparticles have a positive influence on the impulse breakdown performance of insulating oil, as can be observed in Figure 6. The positive and negative lightning impulse breakdown voltages of CMIO are simultaneously improved. This improvement in negative lightning impulse breakdown voltage was not observed from the traditional nanoparticle modified insulating oil we mentioned before. As shown in Figure 6a, the negative lightning impulse breakdown voltage tends to increase first, then decrease with increasing C60 concentration. However, when the concentration is 300 mg/L, the negative lightning impulse breakdown voltage has a small recovery. The breakdown voltage peaks at 150 mg/L (U50 = 54.23 kV). The positive lightning impulse breakdown voltage also increases first, then decreases with increasing C60 concentration, as shown in Figure 6b. Breakdown voltage reaches its peak value (U50 = 41.36 kV) at 200 mg/L C60 concentration. The breakdown voltage drops sharply after at 250 mg/L C60 concentration, and the positive lightning impulse breakdown voltage is already lower compared with that of FO at 300 mg/L.
The positive and negative lightning impulse breakdown voltage of CMIO increase by 7.51% and 8.33% at 150 mg/L relative to those of FO. The positive lightning impulse breakdown voltage of CMIO increases by 9.30%, but the negative lightning impulse breakdown voltage decreases by 1.24% at 200 mg/L C60 concentration. Therefore, the optimum concentration of CMIO for improving lightning impulse breakdown performance is 150 mg/L.
The average AC (50 Hz) breakdown voltage of CMIO and FO at different concentrations were further measured. The test results are shown in Figure 7.
The test results show that the average AC breakdown voltage of CMIO increases at first, then decreases with increasing C60 concentration. The AC average breakdown voltage reaches its peak (18.0% higher compared with FO) at 200 mg/L concentration. The average AC breakdown voltage decreases sharply at C60 concentrations between 200 and 250 mg/L. At 250 mg/L C60 concentration, the AC breakdown voltage is slightly higher than that of FO. The lowest average AC breakdown voltage is observed at 300 mg/L C60 concentration. Considering the results of the lightning impulse breakdown voltage test, we can conclude that the optimum modification concentration of CMIO is 150 mg/L.

3.4. Dielectric Characteristics of FO and CMIO

The influence of C60 nanoparticles on the dielectric properties of insulating oil was investigated by measuring the dielectric constants of CMIO samples with different concentrations at different frequencies, as shown in Figure 8.
The relative dielectric constants of FO and CMIO have minimal changes at testing frequencies ranging from 10 Hz to 107 Hz. The relative dielectric constant of FO is 2.35, whereas the relative dielectric constants of CMIO (50–300 mg/L) are 2.37, 2.40, 2.41, 2.42, 2.45, and 2.57 at 50 Hz. The relative dielectric constants of CMIO and FO increase sharply with the decrease of test frequency in the range of 0.01–10 Hz. Notably, the dielectric constant of CMIO is slightly higher than that of FO across the entire testing frequency range.
Transformer insulating oil is nonpolar dielectric and its relative dielectric constant is about 2.2. The polarization equation of nonpolar liquid medium can be expressed as [36]:
ε r 1 ε r + 2 = N α 3 ε 0
where εr is the relative dielectric constant of dielectrics, N is the number of molecules per unit volume, ε0 is the vacuum dielectric constant, and α is the total micro-polarizability of molecule. In nonpolar dielectrics, α is the electron displacement polarizability αe.
C60 is a nonpolar molecule, and its static dielectric constant is approximately 3.61 [22]. The high frequency dielectric constant of C60 is 2.6 ± 0.1 [37]. The solid–liquid system composed of C60 and insulating oil can be treated as nonpolar dielectric, and Equation (1) can be rewritten as:
ε r 1 ε r + 2 = C B α e 3 ε 0
where CB is the molecule number per unit volume of dielectric, and αe is the electron displacement polarizability.
Assuming that Coil is the molecule number of oil per unit volume of CMIO and CC60 is the molecule number of C60 per unit volume of CMIO, Equation (2) becomes:
ε r 1 ε r + 2 = C o i l α e 1 + C C 60 α e 2 3 ε 0
where αe1 is the electron displacement polarizability of the oil molecule, and αe2 is the electron displacement polarizability of the C60 molecule.
The relative dielectric constant of C60 is larger than that of insulating oil, so αe2>αe1. The number of molecules of solids is greater than the number of molecules of liquids in the same volume. Therefore, according to Equation (3), the relative dielectric constants of all the CMIO samples are greater than dielectric constant of FO, and the relative dielectric constant of CMIO increases with concentration. This result is consistent with the test results shown in Figure 8.
The dielectric loss factor of FO and CMIO with different concentrations at different frequencies were measured, as shown in Figure 9.
The results show that the tanδ of CMIO is almost the same as that of FO from 1 Hz to 107 Hz. At power frequency (50Hz), the tanδ of FO is 0.00537, and the tanδ of CMIO with increasing concentrations (50–300 mg/L) is 0.00548, 0.00559, 0.00568, 0.00651, 0.00741, and 0.00843.
In the low frequency range (less than 1 Hz), the tanδ of CMIO is slightly higher than that of FO. The tanδ of all the samples increase with decreasing frequency.
The tanδ of dielectrics can be expressed as:
tan δ = I p I q = ( γ + g ) S E ω ε 0 ε r S E = γ + g ω ε 0 ε r
where Ip is active current, Iq is reactive current, S is cross-sectional area, E is the effective value of electric field strength, γ is dielectric conductivity, g is relaxation polarization equivalent conductivity, and ω is angular frequency.
Electron displacement polarization is the main polarization form of nonpolar and weak polar liquid dielectrics. Their dielectric loss is mainly due to conductivity loss. Relaxation polarization loss can be neglected. The dielectric loss factor in Equation (4) can be rewritten as follows:
tan δ = γ ω ε 0 ε r
In nonpolar dielectric, the relative dielectric constant barely changes with frequency. The relative dielectric constant increases slightly at a low frequency (less than 1 Hz). The dielectric conductivity of insulating oil varies little with frequency, and any change is considered negligible.
According to Equation (5), when changes in γ and εr are not considered, the tanδ is approximately an inverse proportional function of the angular frequency ω, which corresponds to the trend of tanδ with frequency in Figure 9.
C60 is a semiconductor and has greater electrical conductivity than insulating oil. Therefore, the conductivity of CMIO improves and increases with concentration. According to Equation (5), the tanδ of CMIO is greater than that of FO. The tanδ value increases with concentration, and this result is consistent with the test results.

4. Analysis and Discussion

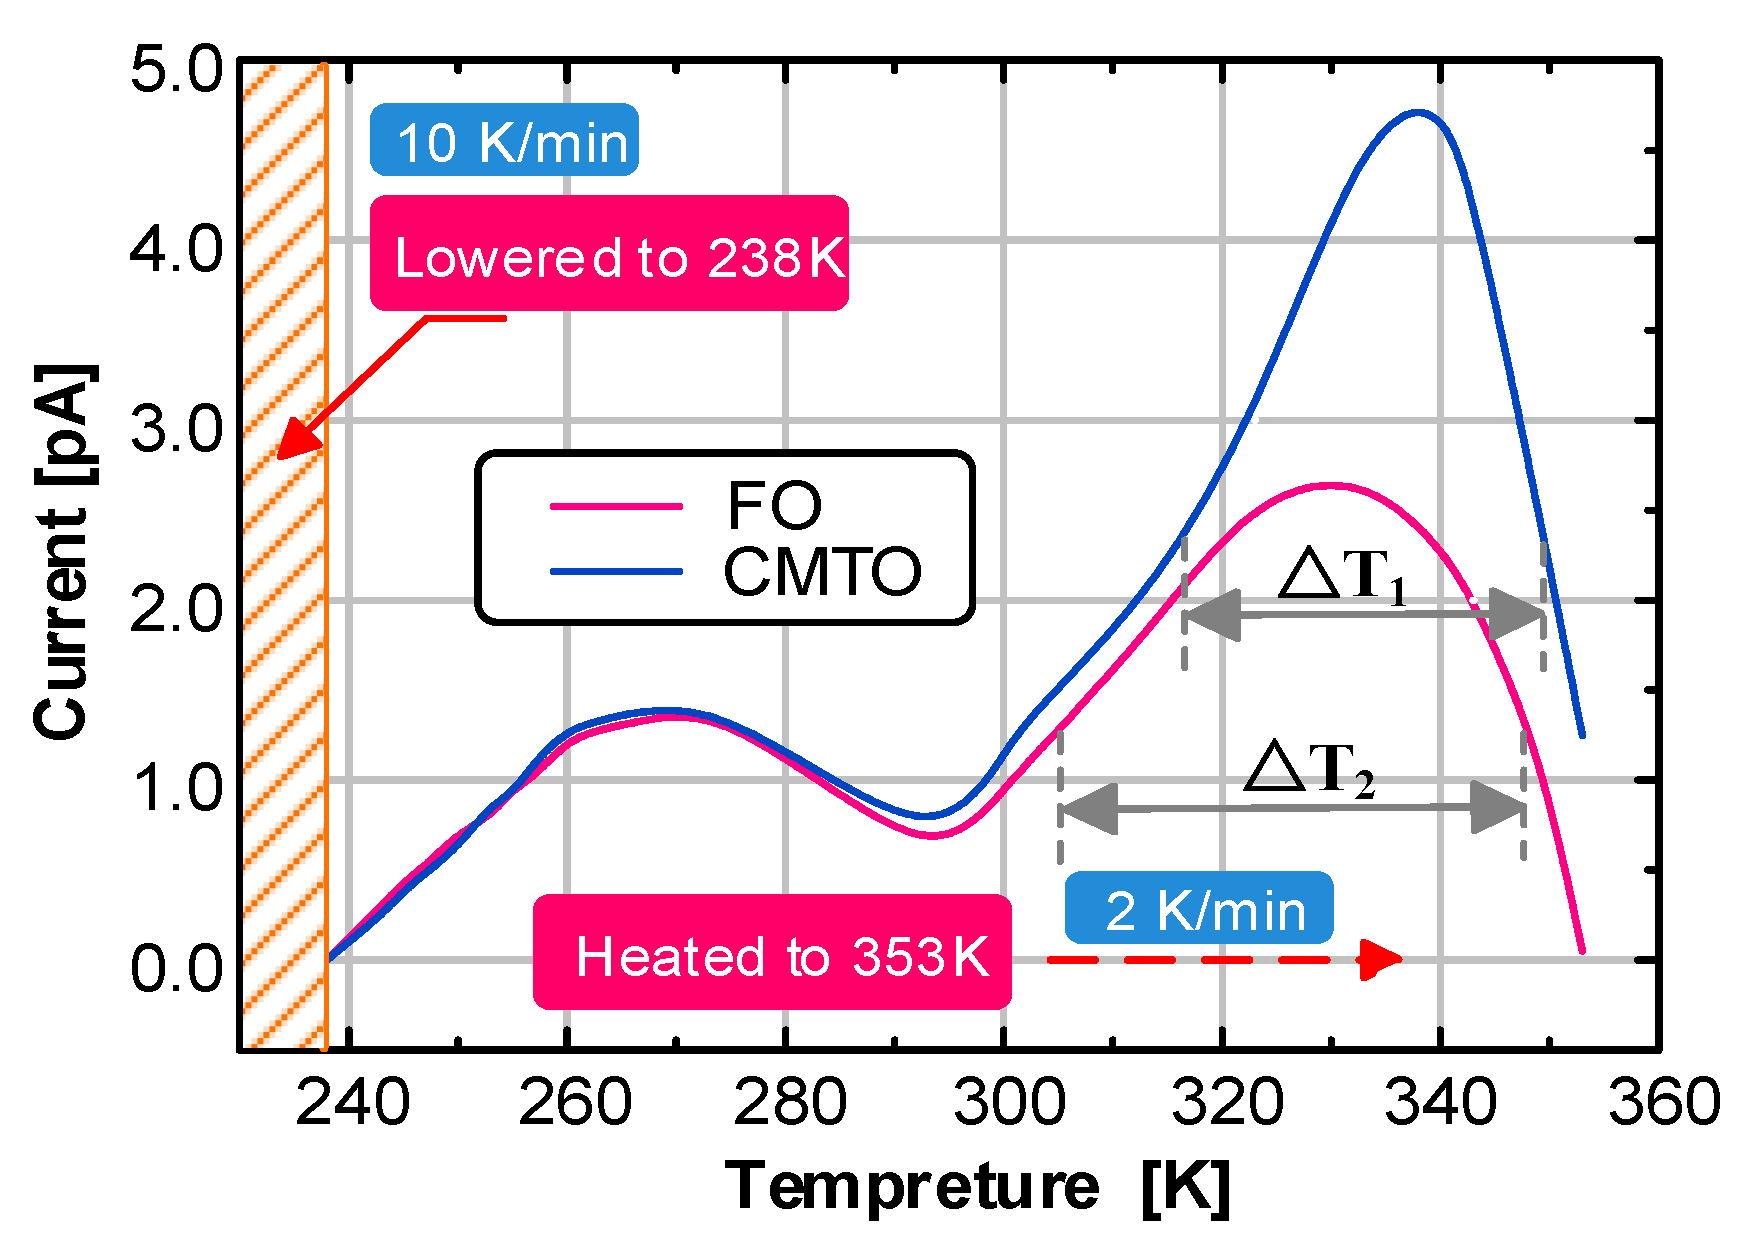
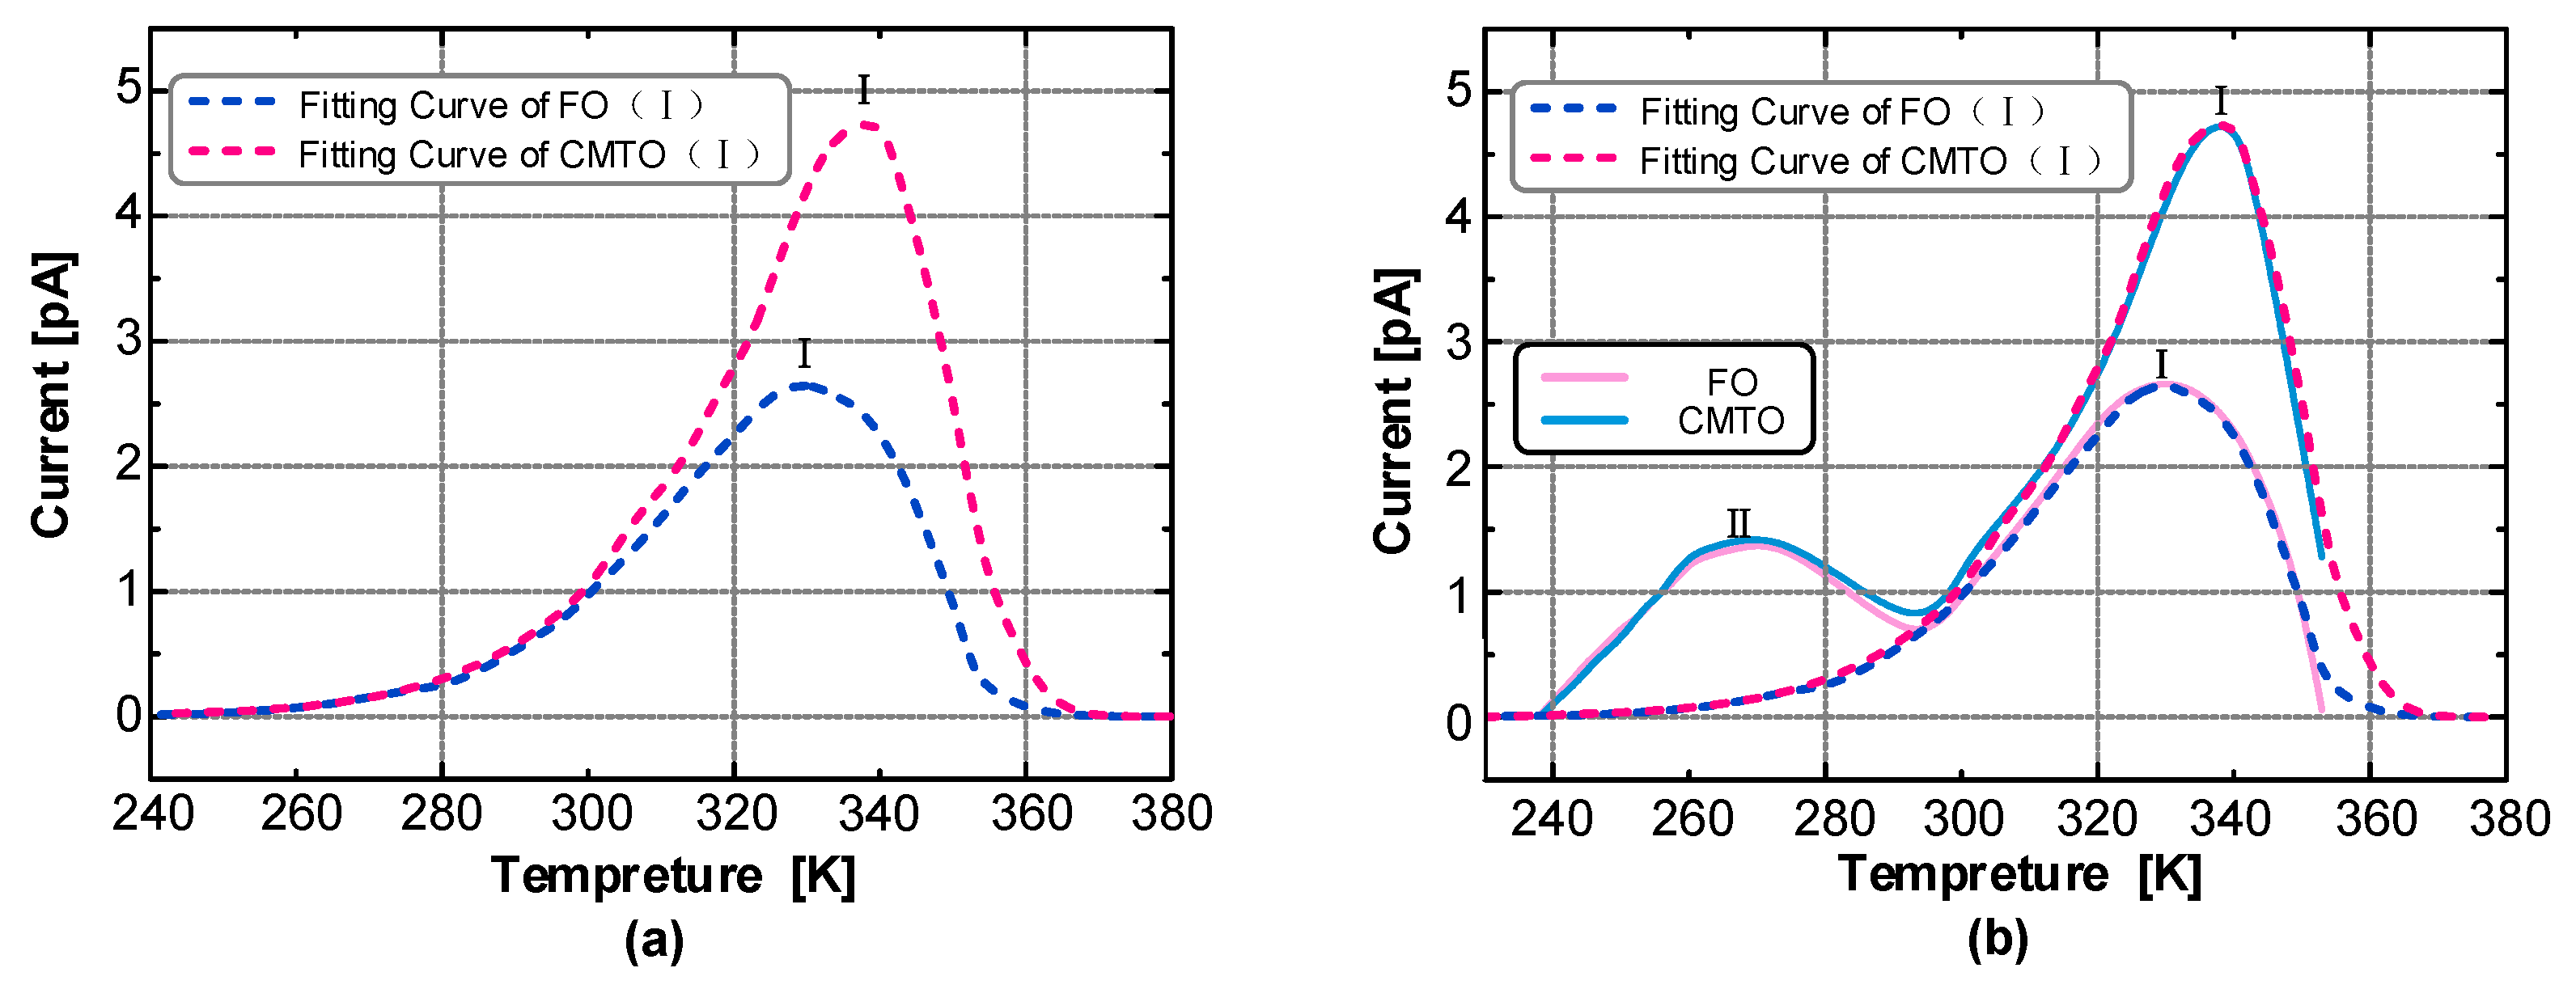
4.1. Trap Characteristics

The thermal stimulation currents of CMIO and FO were tested with the TSC test system. The test results are shown in Figure 10.
To obtain accurate trap parameters and fit the TSC curve and separate peaks, we used a TSC synthesis algorithm and combined relaxation and thermal excitation process methods.
First, the thermal excitation process was described by the general dynamic equation [38] shown in Equation (6):
I ( t ) = d n d t = ( n n 0 ) b s n 0 exp ( E k T )
where I is the heat release intensity in A, which corresponds to the thermal luminescence intensity or the thermal stimulated current intensity. n is the carrier concentration of the trap in m−3, s is the frequency factor, n0 is the initial concentration of carriers of the trap in m−3, E is the activation energy (trap level) in eV, k is the Boltzmann constant in eV/K, T is the absolute temperature in K, and b is the kinetic order. Usually, b only takes 1, 2, and 1.5 [39].
The solution of Equation (6) is:
I ( T ) = n 0 s exp ( E k T ) exp ( s β T 0 T e E k T d T ) ( b = 1 )
I ( T ) = n 0 s exp ( E k T ) [ 1 + ( b 1 ) s β T 0 T e E k T d T ) ] b 1 b ( b 1 )
where T0 is the initial temperature in K.
If a linear temperature rise process exists, that is, T = T0 + βt, then at the peak of curve I(T)
β E k T m 2 = s e E k T m ( b = 1 )
1 + ( b 1 ) s β T 0 T m e E k T d T = b s k T m 2 β e E k T m ( b 1 )
where Tm is the temperature corresponding to the peak current in K.
After calculating the logarithm of the two sides of Equation (6), we obtained the following equation:
ln I ( t ) = b ln ( n n 0 ) + ln ( s n 0 ) E k T
After points (T1, I1) and (T2, I2) on the TSC curve were substituted into Equation (11),
ln ( I 2 I 1 ) = b ln ( n 2 n 1 ) E k ( 1 T 2 1 T 1 )
Then, using the two points (T3, I3) and (T1, I1) on the TSC curve, we obtained:
ln ( I 3 I 1 ) = b ln ( n 3 n 1 ) E k ( 1 T 3 1 T 1 )
After Equations (12) and (13) were combined, the activation energy (trap level) and kinetic progression were calculated by:
E = k [ ln ( I 3 I 1 ) ln n 2 n 1 ln ( I 2 I 1 ) ln n 3 n 1 ] [ ( 1 T 2 1 T 1 ) ln ( n 3 n 1 ) ( 1 T 3 1 T 1 ) ln ( n 2 n 1 ) ]
b = [ ln ( I 2 I 1 ) + E k ( 1 T 2 1 T 1 ) ] / ln ( n 2 n 1 )
In simple TSC curves (isolated peak), provided that three points (I1, T1), (I2, T2), and (I3, T3) are selected on the curves, E and b can be calculated according to Equations (14) and (15), and s can be calculated from Equations (9) and (10). Meanwhile, n can be calculated by:
n = 1 β T T I d T
where T is the temperature at which the TSC curve decays to zero (actually below the sensitivity of the meter).
For the calculation of T 0 T m e E k T d T in Equation (10), the Gaussian quadrature formula can be used. For the T T I d T in Equation (16), the following method can be used. First, a point is taken every 1 K on the TSC curve, and the curve is discretized into N points. Then, by using the N points as interpolation points, cubic spline interpolation is carried out and the TSC curve is expressed by piecewise cubic spline function, so the integral in Equation (16) can be transformed into the integral of cubic spline function [40].
However, in actual experimental conditions and results, completely applying the algorithm is difficult. The current of most samples in the actual measurement were attenuated to zero before the end of the TSC measurement given the limitation of the temperature tolerance of the heater. Therefore, we failed to calculate n by using Equation (16).
Another drawback of the thermal excitation process is that the trap level E calculated from the multipoint values on the actual curve vary greatly in some cases. Therefore, we had to use the relaxation process method to obtain the preliminary theoretical curve of the measured TSC.
The activation energy (trap level) E can be calculated by the half-width formula [41]:
E = 2.47 T m 2 k Δ T
where ΔT is the temperature difference corresponding to the half-peak in K, and k is the Boltzmann constant in eV/K.
Assuming that the measured TSC curve is a single frequency relaxation process, according to Debye theory, the short circuit TSC can be expressed as [28]:
I = A exp [ E k T 1 τ 0 β T 0 T exp ( E k T ) d T ]
where τ0 is the time constant, and β is the heating rate in K/min.
The relationship between I and T can be calculated by using Equation (18) combined with the TSC curve.
Using the Gorbachev approximation,
T 0 T exp ( E k T ) d T = 0 T exp ( E k T ) d T 0 T 0 exp ( E k T ) d T = 0 T exp ( E k T ) d T + C ( k T 2 E + k T ) exp ( E k T ) + C
C in Equation (19) is a constant independent of T, so
I A exp [ E k T 1 τ 0 β ( k T 2 2 k T + E ) exp ( E k T ) C τ 0 β ]
Make d I d T = 0 , get
τ 0 β k T 2 E [ E E + 2 k T exp ( E k T ) + 2 k T E + 2 k T exp ( E k T ) ] = k T 2 E exp ( E k T )
d I d T = 0 corresponds to Im, Tm in the TSC spectrum, substituting Im and Tm into Equation (21).
τ 0 β k T m 2 E exp ( E k T m )
From Equation (20), we can obtain the following equation:
I m A exp ( C τ 0 β ) exp [ E k T m 1 τ 0 β ( k T m 2 2 k T m + E ) exp ( E k T m ) ] = A exp [ E k T m 1 τ 0 β ( k T m 2 2 k T m + E ) exp ( E k T m ) ]
By substituting Im and Tm into Equation (23), the value of A' can be obtained. Then, A' and Equations (20), (22), and (23) can be used in the determination of the fitting curve of I-T (TSC curve).
In the relaxation process method, the TSC curve is assumed to be a single relaxation process, and some approximations are made. Therefore, the theoretical curve obtained by this method does not fit the measured curve well but can be used as the basis of the thermal excitation process method.
We substituted the data points selected from the theoretical curve of the relaxation process algorithm into the thermal excitation process algorithm to calculate the corresponding trap parameters. Then, we compared the theoretical curves obtained from these trap parameters with the measured TSC curves and gradually adjusted the trap depth and other trap parameters until the calculated fitting curves were the same as the measured curves. The algorithm which combines the relaxation process method with the thermal excitation process method was called the synthesis algorithm.
The main peak I was fitted first, which is on the right side of the TSC curve. The fitted and actual curves are shown in Figure 11.
That the TSC curve fitted by the steps has a high degree of coincidence with the actual curve can be seen from Figure 11b. Despite the slight deviation between the fitting and actual curves in the initial and end parts, the remaining parts basically coincide.
The measured TSC curve has two peaks, main peak I and secondary peak II. Peak separation is needed to complete the fitting of the entire TSC curve. The curve measured in the experiment is actually the superposition of main peak I and secondary peak II. After the fitting of main peak I was completed, the measured curve of peak II was obtained by subtracting the fitting curve of main peak I from the measured TSC curve. Then, the synthesis algorithm was used to fit secondary peak II. Finally, we obtained the fitting of the whole measured TSC curve, as shown in Figure 12.
As shown in Figure 11 and Figure 12, the curve fitted by the synthetic algorithm has a high overall coincidence with the measured curve, but the curves differ in the initial rising and final falling parts. Moreover, this method can complete the TSC curve fitting including multiple peaks.
Given that the temperature is approximately proportional to time, the integration of the current with temperature can be used in the calculation of the amount of charge released by the trap [41], as shown in the following equation:
Q = t 0 t 1 I ( t ) d t = 1 δ T 0 T 1 I ( T ) d T
where Q is total charge of the trap in C, δ is the heating rate in K/min, T0 is the experimental starting temperature, and T1 is the temperature at which the current drops to zero.
The characteristic values of the TSC trap parameter of the insulating oil can be obtained by fitting and calculating, as shown in Table 4.
The peak II trap parameters of FO and CMIO are almost the same. All the traps are shallow with levels of about 0.42 eV. Nano-C60 particles do not change the trap characteristics of CMIO at peak II but mainly affect peak I. At peak I, the peak current of CMIO (4.84 pA) is 1.81 times that of FO (2.68 pA), the trap level of CMIO (0.718 eV) is 1.42 times that of FO (0.505 eV), and the trap charge of CMIO (5.12 nC) is 1.41 times that of FO (3.63 nC). Given that the peak value of the TSC curve is related to maximum trap density in a dielectric liquid [28], CMIO is believed to have a higher trap density than FO. Therefore, we infer that the addition of nano-C60 particles increases the trap energy level depth and trap density of insulating oil.

4.2. Adsorption of Charge Carriers and Percolation Threshold Phenomenon

Electrical conductivity in an insulation material depends on the amount or concentration of charge carriers (Ni), the charge of charge carriers (qi), and their mobility (µi), which can be expressed as [42]:
σ = i N i q i μ i
Decreasing the concentration of potential charge carriers by increasing the chemical cleanliness of the insulating material, and reducing their mobility by introducing a filler that contains traps for charge carriers are equally important to the reduction of conductivity [42].
The trap fill effect is not needed at small trap charge [43]. The carrier mobility is shown in Figure 13.
According to the formula for calculating the mean free path of carriers λf [44]:
λ f = μ 0 F τ F
where μ0 is the carrier mobility when no trap exists in the dielectric material, F is the external electric field, and τF is the lifetime of the carrier.
As shown in Figure 13a, when no trap exists in the dielectric material under the action of electric field F, the time τf required for the s distance of carrier migration can be calculated as follows:
τ f = s F μ 0
When traps exist in dielectric materials (Figure 13b), carriers are trapped. If the carrier resides in the trap for a time of τtr, the total time τto spent for carrier migration in the s distance is:
τ t o = τ f + τ t r
The effective mobility of carriers can be calculated by [45]:
μ e f = λ t r F τ t o = μ 0 τ f τ f + τ t r
Generally, the carrier residence time τtr in the shallow trap is very short and is shorter than the carrier lifetime τf. According to Equation (29), the carrier effective mobility μef is approximately equal to the carrier mobility μ0 in the shallow trap. Therefore, after being trapped by shallow traps in the FO, electrons can easily escape again. The frequency of electrons entering the trap is equivalent to the frequency of electrons leaving the trap, and the trapping ability of the shallow trap is weak.
Carrier trapping time in deep traps is generally longer than carrier lifetime [46]. Deep traps form a charge trapping center, which causes space charge accumulation in the dielectric. At this time, carrier effective mobility μef is smaller than carrier mobility μ0.
CMIO has a deeper trap level and a higher trap density than FO, and the frequency of electrons entering the trap is higher than the frequency of electrons leaving the trap. Moreover, the binding ability of electron trap is strong. Carrier mobility in CMIO is lower than that in FO. Therefore, the number of electrons trapped by the deep and dense traps in CMIO increases during discharge development, and this increase weakens the development of streamers and increases breakdown voltage.
The volume fraction of a conducting filler in an insulating matrix has a critical level, above which the electrical or thermal conductivity increases dramatically due to the development of a continuous path of electron transport [47]. This critical volume fraction, which is the minimum concentration required to create an infinitely connected network, is called the percolation threshold [48]. The resistivity or conductivity near the percolation threshold can then be described by Equation (30) [47,49]:
σ ( υ υ c ) t
where υ is the volume fraction of filler, υc is the percolation threshold, and t is a power law constant that depends on the geometry of the system.
For the reduction of the charge mobility or DC conductivity in composites based on non-insulating particles, the particle volume fraction in the composite system should typically be lower than the percolation threshold, where conduction may occur by tunneling between particles because of short interparticle distance [50,51]. At this critical interparticle distance, the trapping of charge carriers by non-insulating particles is not beneficial for conductivity reduction.
The tunneling effect can be described as shown in Figure 14.
When the distance between particles is less than the critical interparticle distance (the red line in Figure 14), a system of geometrically disconnected particles occurs. In this system, an insulating layer separates adjacent particles and electrically these are all connected by tunneling [49].
In CMIO, the volume fraction of C60 nanoparticles must not exceed the percolation threshold. As observed in our experimental data, the breakdown voltage of CMIO drops sharply at a certain C60 concentration. This sharp drop may be related to the percolation threshold.

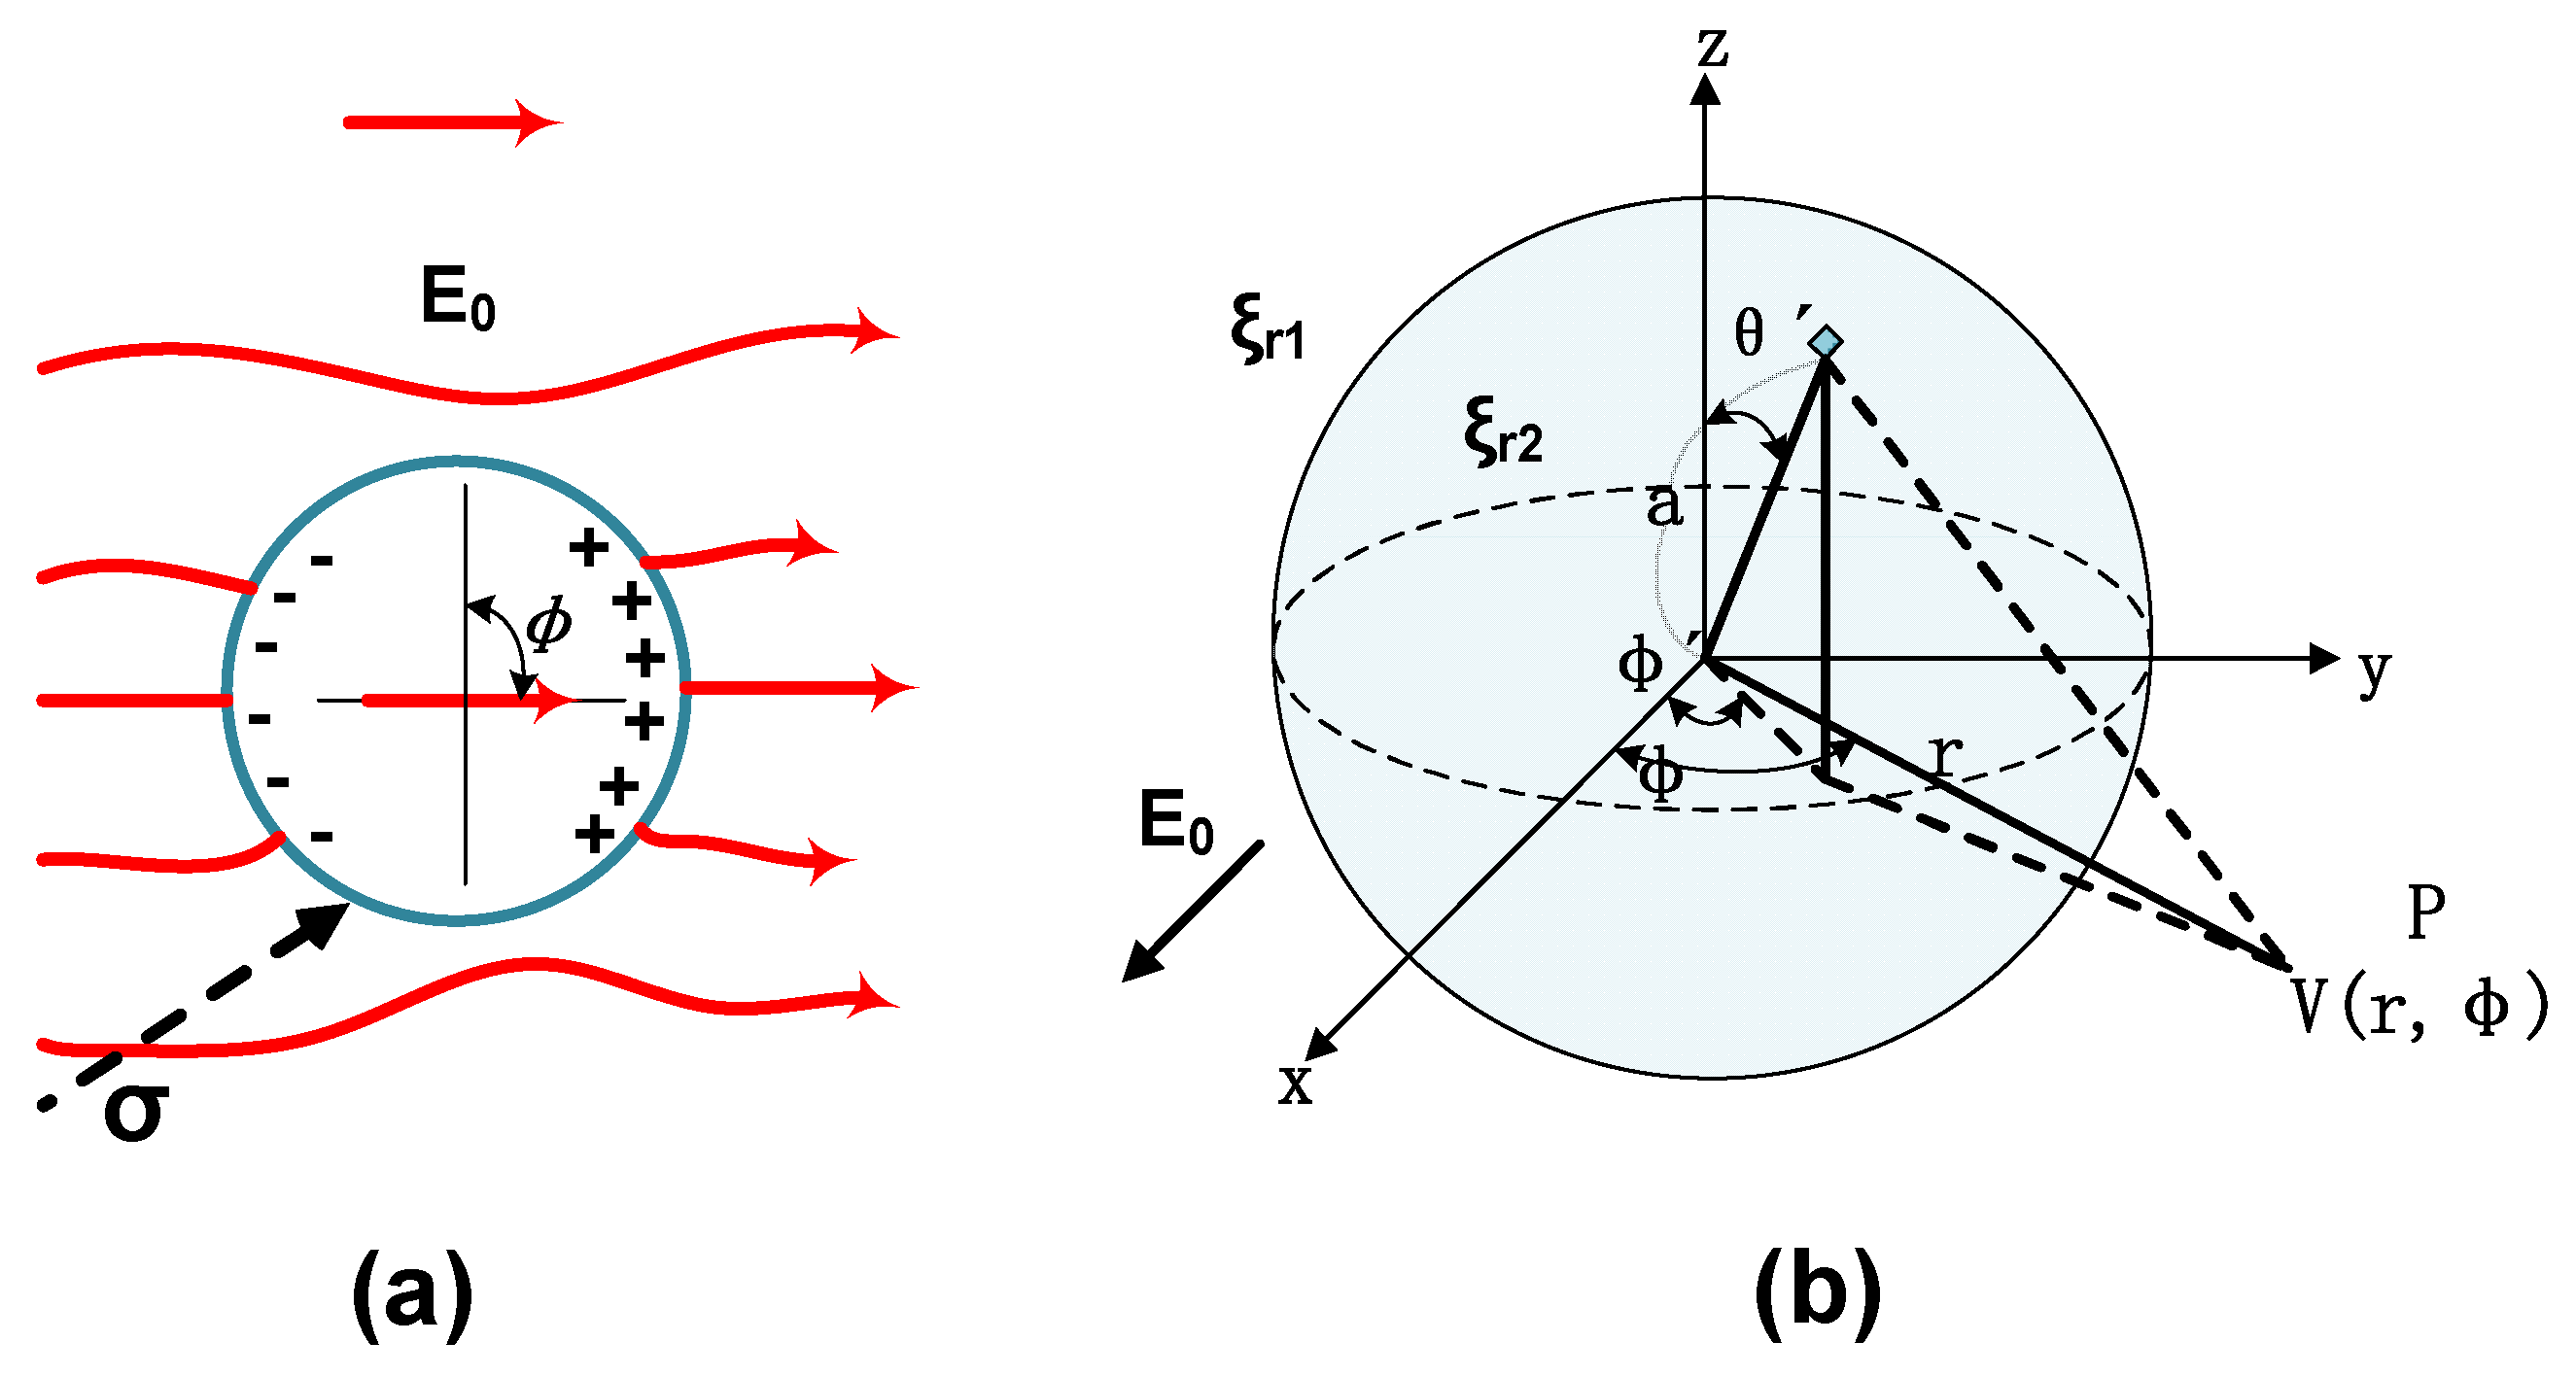
4.3. Relaxation Time Constant and Electrical Potential Distribution of C60 Nanoparticles

The conductivity of C60 single crystal at room temperature is approximately 1.7 × 10⁻⁶ S/m [52]. The relaxation time constant of C60 nanoparticles in CMIO can be calculated by the following equation [53]:
τ r = 2 ε 1 + ε 2 2 σ 1 + σ 2
where ε1 is the relative permittivity of insulating oil (2.2ε0), ε2 is the relative permittivity of C60 nanoparticles (4ε0), σ1 is the conductivity of insulating oil (10−12 S/m), σ2 is the conductivity of C60 nanoparticles (1.7 × 10⁻⁶ S/m), and ε0 is the vacuum permittivity (8.85 × 10⁻¹² F/m).
The relaxation time constant of the C60 nanoparticles in CMIO calculated from Equation (31) is 4.37 × 10⁻⁵ s. According to the fast electron capture theory [53], the relaxation time constant τr of nanoparticles represents the speed of polarization process of nanoparticles. However, the relaxation time constant of C60 nanoparticles in CMIO is much larger than the development time of the streamer (the development time range of streamer is from several hundred nanoseconds to several microseconds). Therefore, C60 nanoparticles have other mechanisms which act on the modification of insulating oil.
Transformer insulating oil is a nonpolar dielectric. Few dipoles are present in the filtered and vacuum dried oil samples. However, due to the difference in relative dielectric constant between C60 and insulating oil, nanoparticles generate induced dipole moments under a high electric field [54]. The surface of the nanoparticles will have a charge distribution. The charge distributed on these surfaces will trap the rapidly migrating electrons and hinder the development of streamers.
Assume that C60 nanoparticles in insulating oil is a standard spherical dielectric. The spherical dielectric (diameter 2a, relative permittivity ε2) is present in the base dielectric material (insulating oil, relative permittivity ε1), as shown in Figure 15b. Figure 15a is dipole electric charge and the electric line of force distributions near the spherical dielectric induced by an electric field E0.
The surface charge density σp and electrical potential V(r, Φ) of the spherical dielectric can be calculated by using Equations (32) and (33):
σ p = ε 0 E 0 ( 1 3 ε r 1 2 ε r 1 + ε r 2 ) cos ϕ sin θ
V ( r , ϕ ) a E 0 = 1 4 π [ 1 3 ε r 1 2 ε r 1 + ε r 2 ] × π + π 0 + π sin 2 θ d θ cos ϕ d ϕ 1 + ( r / a ) 2 2 ( r / a ) sin θ cos ( ϕ ϕ )
According to the TSC test procedure in Section 4.1 Trap Characteristics, the electric field strength E0=4 kV/mm applied in the experiment, the relationship between the particle size of C60 nanoparticles in CMIO and the electrical potential along the electric field and the central axis can be obtained by using Equations (32) and (33), as shown in Figure 16.
As shown in Figure 16, under E0 of 4 kV/mm, the surface charge potential of a C60 nanoparticle is 0.257 eV when the particle size is 300 nm. The TSC test result shows that the maximum trap level generated by C60 nanoparticles in CMIO is 0.718 eV. When the error of the model itself is excluded, the surface electric potential calculated according to this model is smaller than the trap value actually measured in the TSC test. This difference may be attributed to the following reasons:
  • In this model, the applied electric field E0 is uniform. In the TSC test, the small shim in the oil tank (Figure 3) affects the uniformity of the electric field distribution.
  • The nanoparticles (or nanoparticle agglomerates) are assumed to be standard spheres in this model, and thus their morphology may be different from that of C60 nanoparticles present in CMIO.
  • More importantly, we believe that the adsorption of carriers by C60 in CMIO is not only the effect of the electric potential wells produced by the induced dipole consisting of C60 nanoparticles under a high electric field, but also the electronegativity effect of C60. We will further discuss the effect of C60 electronegativity on electron adsorption in Section 4.4.

4.4. Electronegativity of C60

C60 nanoparticles have strong “electronegativity” (the ability to capture electrons) and their electronic affinity EA can be expressed by the following equation [18]:
E A = E ( R e ) E ( R e )
where EA is the electron affinity, E(Re) is the total energy of a stable neutral molecule, and E(Re) is the total energy of a stable molecule after capturing an electron.
The most accurate electron affinity for C60 is [17]:
E A = 2.683 ± 0.008   eV
The EA of C60 is higher than the electronic affinity (about 1.06 eV) of SF6, which is an excellent gas insulation material and has been widely used. Thus, C60 has a strong electron adsorption ability. The capturing effect of C60 added to insulating oil on electrons is shown in Figure 17.
C60 nanoparticles can capture electrons which reduces the number of electrons that can participate in the formation of electron avalanches under the action of electric field, thus weakening the development of streamers and increasing the breakdown voltage of CMIO.
The ability of C60 to absorb electrons is caused by its special structure at the microlevel. We suspect that the electron adsorption capacity resulting from the microstructure leads to the deepening of the trap shown in Section 4.1.

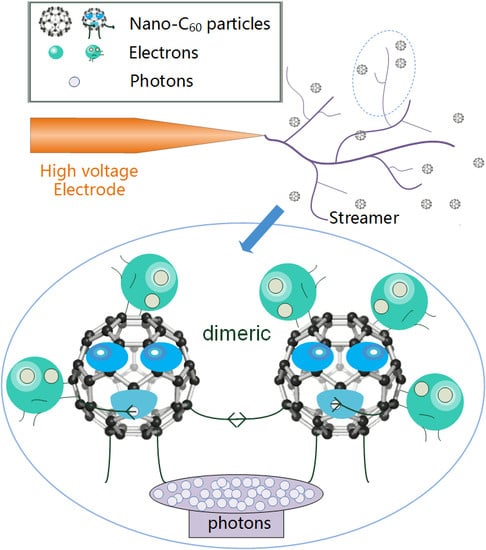
4.5. Absorption of Photons by C60

The photopolymerization of C60 occurs under the irradiation of ultraviolet light or visible light of a specific wavelength. Irradiation results in the polymerization of two adjacent C60 molecules and consumption of photons [20]. The C60 dimer is the most abundant and simple structure in the polymer. The formation process can be explained as shown in Figure 18a.
As shown in Figure 18b, in the process of streamer development, the positive and negative ions in the electron avalanche recombine violently and emit a large number of photons. These high-energy photons cause subsequent photoionization, thus generating new free electrons (photoelectrons). C60 molecules can absorb photons generated during streamer development through photon absorption polymerization (most are dimers), which weakens the process of photoionization. Thus, the molecules weaken the development of streamers and improve the breakdown performance of CMIO.
We speculate that C60 can improve the negative impulse breakdown voltage of insulating oil because C60 can absorb photons. An explanation for the negative impulse breakdown voltage drop of nano-insulating oil is as follows. A large number of negatively charged slow nanoparticles remain near the negative electrode. This phenomenon weakens the electric field strength at the needle electrode and strengthens it at the plate electrode. Therefore, the enhancement of voltage is conducive to the initiation and development of streamers to the anode and decreases negative breakdown voltages with the suspension of nanoparticles [6].
According to this explanation, the negative impulse breakdown voltage of CMIO should be lower compared with that of FO. However, unlike other nanoparticles, the C60 in CMIO can absorb photons, weakens the process of photoionization, and disrupts the development of streamers. Therefore, we believe that the absorption of photons by C60 is the reason that C60 can increase the negative impulse breakdown voltage of CMIO, and this factor is what makes CMIO markedly different from other nano-insulating oils.

4.6. Summary of the Mechanism of C60

In the development of discharge in FO and CMIO, the motion of electrons can be represented by Figure 19a,b. The trap parameters of insulating oil, and the electron adsorption capacity of C60, and its ability to absorb photons, affect the breakdown performance of nano-insulating oil and the development process of discharging.
As shown in Figure 19, the modification mechanism of C60 to improve the breakdown performance of insulating oil can be summarized by three aspects:
  • The addition of C60 nanoparticles deepens the trap energy level and increases the trap density in insulating oil. In CMIO, the frequency of electrons entering the trap is higher than the frequency of electrons leaving the trap, and the capture ability of the electron trap is strong. Carrier mobility in CMIO is lower than that in FO. The number of electrons trapped by the deep and dense traps increases.
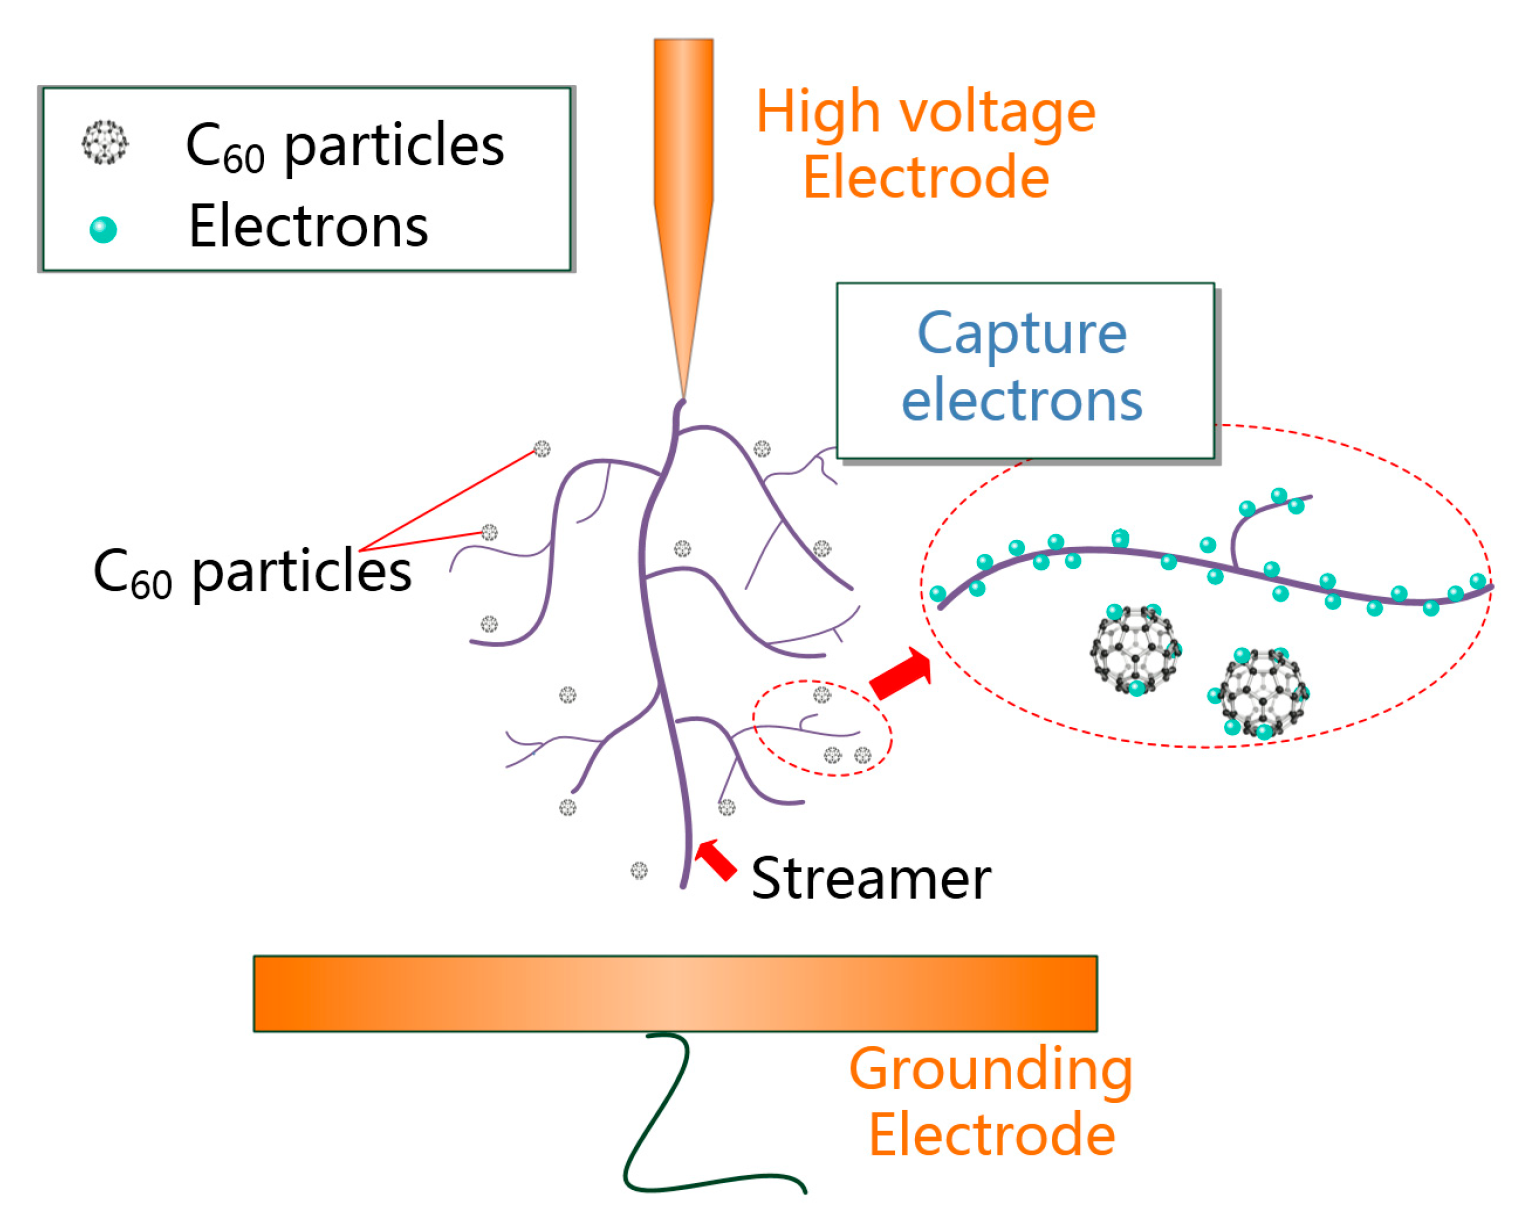
  • C60 nanoparticles have a strong ability to absorb electrons. As C60 captures electrons, it reduces the number of electrons that can participate in the formation of electron avalanches under an electric field, thus weakening the development of streamers and increasing the breakdown voltage of CMIO.
  • C60 molecules can absorb photons generated in the process of streamer development though photon absorption polymerization (most are dimers), which weakens the process of photoionization, and thus disrupts the development of streamers and improves the breakdown performance of CMIO. We believe that the absorption of photons by C60 is the reason for the improvement in the negative impulse breakdown performance of CMIO.
C60 can improve the breakdown performance of insulating oil while hardly increasing dielectric loss. The slight increase in CMIO relative dielectric constant is also beneficial to the insulation coordination of the transformer oil-paper insulation system. However, it should also be noted that due to the cost of C60 materials, the cost of using power transformers may be further increased. Although C60 is not toxic to the human body, whether nano-sized C60 in insulating oil causes environmental damage must be clarified.

5. Conclusions

Based on the test and analysis results, the following conclusions are reached:
The C60 nanoparticles are round, and their diameters are about 30 nm. The average particle size of the newly prepared CMIO is 305.7 nm, and the average particle size of the CMIO kept for 12 months is 320.1 nm. Without the use of any surface modifiers, the particle size of CMIO kept for 12 months did not change significantly. Meanwhile, the average zeta potential (pH=7, 100 mg/L) of CMIO is −41.3 mV. Therefore, the dispersion stability of CMIO is good. CMIO has better stability compared with traditional nano-modified insulating oil, especially without the use of surface modifiers for nanoparticles.
The positive lightning impulse breakdown voltage of CMIO is not as high as that of some traditional nanoparticles (such as Fe3O4 and TiO2), but the negative lightning impulse breakdown voltage of CMIO is increased. This finding is good news for the engineering application of nano-modified insulating oil. According to our test results, the optimum concentration for improving the comprehensive breakdown performance of CMIO is 150 mg/L.
The dielectric constant of CMIO is slightly higher than that of FO across the entire test frequency range. In the low frequency range (less than 1 Hz), the dielectric loss factor of CMIO is slightly higher than that of FO. The dielectric loss factors of all the samples increase with decreasing frequency. According to the TSC measured curve, the peak separation, and fitting calculation results, the peak current of CMIO (4.84 pA) is 1.81 times that of FO (2.68 pA), the trap level of CMIO (0.718 eV) is 1.42 times that of FO (0.505 eV), and the trap charge of CMIO (5.12 nC) is 1.41 times that of FO (3.63 nC) at peak I. We believe that a substantial number of electrons are trapped by the deep and dense traps in CMIO, and thus the development of streamers is disrupted and breakdown voltage increases.
The breakdown performance of CMIO is higher than that of FO because of the changes in the trap parameters, the strong electron capture ability of C60, and its absorption capacity for photons. We believe that the inhibition of C60 nanoparticles on the photoionization process is the reason for the improvement in the negative impulse breakdown performance of CMIO.

Author Contributions

Conceptualization, J.C. and P.S.; Methodology, J.C. and P.S.; Investigation, J.C.; Writing-Original Draft Preparation, J.C.; Writing-Review and Editing, W.S. and P.S.; Visualization, J.C., P.S., Q.S. and L.Y.; Validation J.C. and C.L.

Funding

This research was supported by the National Key Basic Research Program of China (2017YFB0902702), the National Basic Research Program (973 Program) (2015CB251003), and the National Natural Science Foundation of China (51707023 and 51837002).

Conflicts of Interest

The authors declare no conflicts of interest.

References

  1. Choi, S.U.S.; Eastman, J. Enhancing thermal conductivity of fluids with nanoparticles. In Proceedings of the ASME International Mechanical Engineering Congress and Exposition, San Francisco, CA, USA, 12–17 November 1995; pp. 66–74. [Google Scholar]
  2. Fedele, L.; Colla, L.; Bobbo, S.; Barison, S.; Agresti, F. Experimental stability analysis of different water-based nanofluids. Nanoscale. Res. Lett. 2011, 6, 300–308. [Google Scholar] [CrossRef]
  3. Viali, W.R.; Alcantara, G.B.; Sartoratto, P.P.C.; Soler, M.A.G. Investigation of the molecular surface coating on the stability of Insulating magnetic oils. J. Phys. Chem. C 2010, 114, 179–188. [Google Scholar] [CrossRef]
  4. Choi, C.; Yoo, H.S.; Oh, J.M. Preparation and heat transfer properties of nanoparticle-in-transformer oil dispersions as advanced energy-efficient coolants. Curr. Appl. Phys. 2008, 8, 710–712. [Google Scholar]
  5. Segal, V.; Hjortsberg, A.; Rabinovich, A.; Nattrass, D.; Raj, K. AC (60 Hz) and impulse breakdown strength of a colloidal fluid based on transformer oil and magnetite nanoparticles. In Proceedings of the IEEE International Symposium on Electrical Insulation, Arlington, VA, USA, 7–10 June 1998; pp. 619–622. [Google Scholar]
  6. Sima, W.; Cao, X.; Yang, Q. Preparation of three transformer oil-based nanofluids and comparison of their impulse breakdown characteristics. Nanosci. Nanotech. Let. 2014, 6, 250–256. [Google Scholar] [CrossRef]
  7. Segal, V.; Nattrass, D.; Raj, K. Accelerated thermal aging of petroleum-based ferrofluids. J. Magn. Mate. 1999, 201, 70–72. [Google Scholar] [CrossRef]
  8. Wang, Q.; Rafiq, M.; Lv, Y.; Li, C.; Yi, K.J. Preparation of three types of transformer oil-based nanofluids and comparative study on the effect of nanoparticle concentrations on insulating property of transformer oil. J. Nanotechnol. 2016, 2016, 1–6. [Google Scholar] [CrossRef]
  9. Rafiq, M.; Li, C.; Khan, I.; Hu, Z.; Lv, Y.; Yi, K. Preparation and breakdown properties of mineral oil based alumina nanofluids. In Proceedings of the IEEE International Conference on Emerging Technologies, Peshawar, Pakistan, 19–20 December 2015; pp. 1–3. [Google Scholar]
  10. Lv, Y.; Ge, Y.; Li, C. Effect of TiO2 nanoparticles on streamer propagation in transformer oil under lightning impulse voltage. IEEE Trans. Dielectr. Electr. Insul. 2016, 23, 2110–2115. [Google Scholar] [CrossRef]
  11. Rafiq, M.; Li, C.; Lv, Y.; Yi, K.; Ikram, A. Breakdown characteristics of transformer oil based silica nanofluids. In Proceedings of the 19th International Multi-Topic Conference, Islamabad, Pakistan, 5–6 December 2016; pp. 302–305. [Google Scholar]
  12. Liu, R.; Pettersson, L.A.A.; Auletta, T.; Hjortstam, O. Fundamental research on the application of nano dielectrics to transformers. In Proceedings of the Annual Report Conference on Electrical Insulation and Dielectric Phenomena, Cancun, Mexico, 16–19 October 2011; pp. 423–427. [Google Scholar]
  13. Rakov, V.A. Lightning parameters for engineering applications (keynote speech). In Proceedings of the 2010 Asia-Pacific International Symposium on Electromagnetic Compatibility, Beijing, China, 12–16 April 2010; pp. 1120–1123. [Google Scholar]
  14. Sun, P.; Sima, W.; Zhang, D.; Jiang, X.; Chen, Q.; Chen, J. Impact of wavefront time of microsecond impulse on the breakdown voltage of oil impregnated paper: Mechanism analysis. IEEE Trans. on Dielectr. Electr. Insul. 2018, 25, 1706–1715. [Google Scholar] [CrossRef]
  15. Sartoratto, P.P.C.; Neto, A.V.S.; Lima, E.C.D. Preparation and electrical properties of oil-based magnetic fluids. J. Appl. Phys. 2005, 97, 10Q917. [Google Scholar] [CrossRef]
  16. Mergos, J.; Athanassopoulou, M.; Argyropoulos, T. Dielectric properties of nanopowder dispersions in paraffin oil. IEEE Trans. Dielectr. Electr. Insul. 2012, 19, 1502–1507. [Google Scholar] [CrossRef]
  17. Wang, X.; Woo, H.K.; Wang, L. Vibrational cooling in a cold ion trap: Vibrationally resolved photoelectron spectroscopy of cold C60(-) anions. J. Chem. Phys. 2005, 123, 051106. [Google Scholar] [CrossRef]
  18. Sun, P.; Sima, W.; Chen, J. An application area of C60: Overall improvement of insulating oil’s electrical performance. Appl. Phys. Lett. 2018, 112, 142902. [Google Scholar] [CrossRef]
  19. Yanilkin, V.V.; Gubskaya, V.P.; Morozov, V.I. Electrochemistry of fullerenes and their derivatives. Russ. J. Electrochem. 2003, 39, 1147–1165. [Google Scholar] [CrossRef]
  20. Rao, A.; Zhou, P.; Wang, K. Photoinduced polymerization of solid C60 films. Science 1993, 259, 955–957. [Google Scholar] [CrossRef]
  21. Sivaraman, N.; Dhamodaran, R.; Kaliappan, I. Solubility of C60 in organic solvents. J. Org. Chem. 1992, 57, 6077–6079. [Google Scholar] [CrossRef]
  22. Ruoff, R.S.; Tse, D.S.; Malhotra, R. Solubility of fullerene (C60) in a variety of solvents. J. Phys. Chem. 1993, 97, 3379–3383. [Google Scholar] [CrossRef]
  23. ASTM. Standard Test Method for Dielectric Breakdown Voltage of Insulating Oils of Petroleum Origin under Impulse Conditions; ASTM D3487-2000(II); ASTM International: West Conshohocken, PA, USA, 2000. [Google Scholar]
  24. Iio, Y.; Kurihara, K.; Matsuyama, F. Photopolymerization of C60 crystal synthesized from organic solution. J. Phys. 2009, 159, 012019. [Google Scholar]
  25. Akhlaghi, S.; Pourrahimi, A.M. Effects of ageing conditions on degradation of acrylonitrile butadiene rubber filled with heat-treated ZnO star-shaped particles in rapeseed biodiesel. Polym. Degrad. Stabil. 2017, 138, 27–39. [Google Scholar] [CrossRef] [Green Version]
  26. IEC. Insulating Liquids–Determination of the Breakdown Voltage at Power Frequency–Test Method; IEC 60156-1995; IEC: Geneva, Switzerland, 1995. [Google Scholar]
  27. Liu, Q.; Wang, Z. Breakdown and withstand strengths of ester transformer liquids in a quasi-uniform field under impulse voltages. IEEE Trans. Dielectr. Electr. Insul. 2013, 20, 571–579. [Google Scholar] [CrossRef]
  28. Chen, R. Analysis of Thermally Stimulated Processes; Pergamon: Oxford, NY, USA, 1981. [Google Scholar]
  29. Zhong, Y.; Lv, Y.; Li, C. Insulating properties and charge characteristics of natural ester fluid modified by TiO2 semiconductive nanoparticles. IEEE Trans. Dielectr. Electr. Insul. 2013, 20, 135–140. [Google Scholar] [CrossRef]
  30. Vandsburger, L. Synthesis and Covalent Surface Modification of Carbon Nanotubes for Preparation of Stabilized Nanofluid Suspensions. Ph.D. Thesis, McGill University, , Montreal, QC, Canada, 2009. [Google Scholar]
  31. Ghadimi, A.; Saidur, R.; Metselaar, H.S.C. A review of nanofluid stability properties and characterization in stationary conditions. Int. J. Mass. Tran. 2011, 54, 4051–4068. [Google Scholar] [CrossRef]
  32. Chen, K.L.; Elimelech, M. Relating Colloidal Stability of Fullerene (C60) Nanoparticles to Nanoparticle Charge and Electrokinetic Properties. Environ. Sci. Technol. 2009, 43, 7270–7276. [Google Scholar] [CrossRef] [PubMed]
  33. Pourrahimi, A.M.; Liu, D.; Pallon, L.K.H. Water-based synthesis and cleaning methods for high purity ZnO nanoparticles – comparing acetate, chloride, sulphate and nitrate zinc salt precursors. RSC. Adv. 2014, 4, 35568. [Google Scholar] [CrossRef]
  34. Gallagher, S.H.; Armstrong, R.S.; Lay, P.A. Solvent Effects on the Electronic Spectrum of C60. J. Phys. Chem. 1995, 99, 5817–5825. [Google Scholar] [CrossRef]
  35. Lee, J.H.; Hwang, K.S.; Jang, S.P. Effective viscosities and thermal conductivities of aqueous nanofluids containing low volume concentrations of Al2O3 nanoparticles. Int. J. Heat. Mass. Tran. 2008, 51, 2651–2656. [Google Scholar] [CrossRef]
  36. Sima, W.; Sun, P.; Yang, Q. Study on the accumulative effect of repeated lightning impulses on insulation characteristics of transformer oil impregnated paper. IEEE Trans. Dielectr. Electr. Insul. 2014, 21, 1933–1941. [Google Scholar] [CrossRef]
  37. Sami, S.; Haase, P.A.B.; Alessandri, R. Can the dielectric constant of fullerene derivatives be enhanced by side chain manipulation? a predictive first principles computational study. J. Phys. Chem. A. 2018, 122, 3919–3926. [Google Scholar] [CrossRef] [PubMed]
  38. Singh, S.D.; Mazumdar, P.S.; Gartia, R.K. The determination of the trapping parameters of a thermoluminescence peak by using the Kirsh method. J. Phys. D: Appl. Phys. 1998, 31, 231–234. [Google Scholar] [CrossRef]
  39. Hoogenboom, J.E.; Devries, W.; Dielhof, J.B.J. Computerized analysis of glow curves from thermally activated processes. Appl. Phys. 1988, 64, 3193–3200. [Google Scholar] [CrossRef]
  40. Lei, Q.; Wang, X.; Fan, Y. A new method of auto-separating thermally stimulated current. J. App. Phys. 1992, 72, 4254–4257. [Google Scholar] [CrossRef]
  41. Sun, P.; Sima, W.; Zhang, D.; Jiang, X.; Zhang, H.; Yin, Z. Failure characteristics and mechanism of nano-modified oil-Impregnated paper subjected to repeated impulse voltage. Nanomaterials 2018, 8, 504. [Google Scholar] [CrossRef]
  42. Pourrahimi, A.M.; Olsson, R.T.; Hedenqvist, M.S. The Role of Interfaces in Polyethylene/Metal-Oxide Nanocomposites for Ultrahigh-Voltage Insulating. Materials. Advanced. Mate. 2018, 30, 1703624. [Google Scholar] [CrossRef]
  43. Min, D.; Cho, M.G.; Khan, A.R. Charge transport properties of dielectrics revealed by isothermal surface potential decay. IEEE Trans. Dielectr. Electr. Insul. 2012, 19, 1465–1473. [Google Scholar] [CrossRef]
  44. Sessler, G.M.; Figueiredo, M.T.; Ferreira, G.F.L. Models of charge transport in electron-beam irradiated insulators. IEEE Trans. Dielectr. Electr. Insul. 2004, 11, 192–202. [Google Scholar] [CrossRef]
  45. Kao, K.C. Dielectric Phenomena in Solids; Elsevier Academic: San Diego, CA, USA, 2004; pp. 381–509. [Google Scholar]
  46. Min, D.; Li, S. IEEE Trans. Simulation on the influence of bipolar charge injection and trapping on surface potential decay of polyethylene. Dielectr. Electr. Insul. 2014, 21, 1627–1636. [Google Scholar] [CrossRef]
  47. Nelson, J.K. Dielectric Polymer Nanocomposites; Springer: New York, NY, USA, 2010. [Google Scholar]
  48. Stauffer, D.; Aharony, A. Introduction to Percolation Theory; Taylor: London, UK, 1992. [Google Scholar]
  49. Balberg, I.; Azulay, D.; Toker, D. Percolation and tunneling in composite materials. Int. J. Mod. Phys. B 2012, 18, 2091–2121. [Google Scholar] [CrossRef]
  50. Hoang, A.T.; Pallon, L.; Liu, D.; Serdyuk, Y.V.; Gubanski, S.M.; Gedde, U.W. Charge Transport in LDPE Nanocomposites Part I—Experimental Approach. Polymers 2016, 8, 87. [Google Scholar] [CrossRef]
  51. Hong, J.I.; Schadler, L.S.; Siegel, R.W. Rescaled electrical properties of ZnO/low density polyethylene nanocomposites. Appl. Phys. Lett. 2003, 82, 1956. [Google Scholar] [CrossRef]
  52. Peimo, H.; Yabo, X.; Xuejia, Z. Electrical conductivity studies of a pure C60 single crystal. J. Phys. Condens. Mat. 1993, 5, 7013–7016. [Google Scholar] [CrossRef]
  53. Hwang, J.G.; Zahn, M.; Sullivan, O.; Francis, M. Effects of nanoparticle charging on streamer development in transformer oil-based nanofluids. J. Appl. Phys. 2010, 107, 014310. [Google Scholar] [CrossRef] [Green Version]
  54. Takada, T.; Hayase, Y.; Tanaka, Y. Space charge trapping in electrical potential well caused by permanent and induced dipoles for LDPE/MgO nanocomposite. IEEE Trans. Dielectr. Electr. Insul. 2008, 15, 152–160. [Google Scholar] [CrossRef]
Figure 1. Sketch of the standard AC breakdown oil cup.
Nanomaterials 09 00788 g001
Figure 2. Sketch of the impulse voltage test platform.
Nanomaterials 09 00788 g002
Figure 3. Thermally stimulated current (TSC) measurement system.
Nanomaterials 09 00788 g003
Figure 4. Particle size distribution of nano-C60 particles in CMIO. (a) newly prepared CMIO, (b) CMIO kept for 12 months. (Please note that whether a particle larger than 100 nm can be called a nanoparticle is still controversial.).
Nanomaterials 09 00788 g004
Figure 5. TEM image of the nano-C60 particles.
Nanomaterials 09 00788 g005
Figure 6. Lightning breakdown characteristics of CMIO and FO. (a) U50 for negative lightning impulse, (b) U50 for positive lightning impulse.
Nanomaterials 09 00788 g006
Figure 7. AC breakdown characteristics of CMIO and fresh oil (FO).
Nanomaterials 09 00788 g007
Figure 8. Broadband dielectric spectrum of CMIO and FO.
Nanomaterials 09 00788 g008
Figure 9. Broadband dielectric loss spectrum of CMIO and FO.
Nanomaterials 09 00788 g009
Figure 10. TSC test results of FO and CMIO.
Nanomaterials 09 00788 g010
Figure 11. (a) Peak I fitting curve of FO and CMIO, (b) Comparison of Peak I fitting and measured curves.
Nanomaterials 09 00788 g011
Figure 12. Measured curve of peak II of FO and CMIO and fitting curve of peaks I and II.
Nanomaterials 09 00788 g012
Figure 13. (a) Carrier migration in the medium (without traps), (b) carrier migration in the medium (with traps).
Nanomaterials 09 00788 g013
Figure 14. Schematic diagram of tunneling effect.
Nanomaterials 09 00788 g014
Figure 15. (a) Dipole electric charge and electric line of force distributions near spherical dielectric induced by an electric field E0, (b) The spherical dielectric is present in the base dielectric material.
Nanomaterials 09 00788 g015
Figure 16. Electrical potential of C60 spherical nanoparticles along the electric field E0 and central axis.
Nanomaterials 09 00788 g016
Figure 17. C60 particles capture electrons involved in streamer formation.
Nanomaterials 09 00788 g017
Figure 18. (a) Two C60 molecules absorb photons and form dimer, (b) C60 absorbs photons in the streamer through photopolymerization reaction.
Nanomaterials 09 00788 g018
Figure 19. (a) Electron motion in FO under electric field, (b) Electron motion in CMIO under electric field.
Nanomaterials 09 00788 g019
Table 1. Reduction of negative lightning impulse breakdown voltage of nano-insulating oil relative to host oil reported in the literature.
NP 1/Oil SystemNanoparticle TypeConcentrationSize of NPPercentage IncreaseRef
Fe3O4/U-60 2ConductorNM 6<10 nm−9.41%[5]
Fe3O4/Nytro 3ConductorNM <10 nm−2.26%[5]
Fe3O4/#25MO 4Conductor0.03 g/L20 nm−15.82%[6]
TiO2/#25MOSemiconductor0.01 g/L20 nm−3.39%[6]
Al2O3/#25MOInsulator0.02 g/L20 nm−2.53%[6]
(Fe3O4/ MO) Aged 5ConductorNM<10 nm−7.75%[7]
TiO2/#25MOSemiconductor5% w/v<50 nm−4.49%[8]
Al2O3/#25MOInsulator5% w/v<50 nm−7.34%[8]
Fe3O4/#25MOConductor5% w/v<50 nm−6.12%[8]
Al2O3/#25MOInsulator20% w/vNM−9.98%[9]
TiO2/#25MOSemiconductor0.075% v/v<10 nm−6.84%[10]
SiO2/#25MOInsulator20% w/vNM−5.93%[11]
ZnO/#25MOSemiconductor0.0475% v/v5~20 nm−34.4%[12]
Al2O3/#25MOInsulator0.1425% v/v5~20 nm−13.0%[12]
1 Nanoparticle; 2 Univolt 60 Exxon mineral oil; 3 Nytro 10X mineral oil; 4 #25 mineral oil; 5 Compared with aged MO; 6 Not mentioned.
Table 2. Electrical properties of magnetic fluids compared with those of pure insulating oil.
Volume Fraction (%)Loss FactorGrowth Multiple of Loss FactorDielectric Strength (kV)
0.00.00366170
0.8002.389653-
0.0160.39910979
0.00800.18685172
0.00400.12743570
Table 3. Zeta potential of nano-C60 modified insulating oil (CMIO) (100 mg/L, pH=7).
Measurement times123456Average value/ mV
Zeta potential/mV−43.0−40.6−41.5−39.7−38.3−45.0−41.3
Measurement times789101112Standard deviation
Zeta potential/mV−45.5−41.1−41.9−39.7−38.9−41.02.241
Table 4. Characteristics of TSC trap parameters of insulating oil.
Trap ParameterFOCMIO
Peak Current (I)/pA2.684.84
Peak Current (II)/pA1.251.25
Trap level (I)/eV0.5050.718
Trap level (II)/eV0.4260.426
Q (I)/nC3.635.12
Q (II)/nC1.301.30

