1. Introduction
Surface plasmon resonance (SPR) biosensors have received tremendous attention over the past decades due to their label-free sensing ability [
1,
2]. They utilize surface plasmon polariton (SPP) waves to detect the refractive index (RI) change in the sensing surface produced by the alteration of biomolecule concentration. A variation in the propagation constant of SPP caused by the change of RI can be optically measured for inverse calculation of biomolecular RI. Nevertheless, in order to identify the species of biomolecule, roughly probing the change of RI in the biological processes is not sufficient. Characterization of biomolecules through their vibrational properties is also necessary to differentiate constituent biomolecular species. Vibrational fingerprints relating with the valuable molecular information are mainly located at the mid-infrared range, which uniquely identify the biomolecules in a multitude of biological processes. Infrared spectroscopy is widely used as a nondestructive label-free technique to access these vibrational fingerprints and provide exquisite biochemical information in bulk materials. However, vibrational signals in minute amounts of analytes are quite weak due to the mismatch between nanometric size of biomolecules (<10 nm) and the mid-infrared wavelengths (2 to 6 μm). To solve this problem, resonant metallic nanoantennas are commonly used to enhance light-matter interaction due to highly concentrated and enhanced infrared near fields [
3,
4,
5,
6,
7], which is also called surface-enhanced infrared absorption (SEIRA). Although the resonant frequency can be tuned by adjusting the geometrical size of nanoantennas, biomolecules with spectrally separated vibrational bands usually require dual- or multiband plasmonic structures to minimize the number of false positive results [
8,
9]. On the other hand, to distinguish multiple analytes in heterogeneous biological samples, several multi-resonant infrared metallic or dielectric metasurfaces have been developed to simultaneously detecting the composite vibrational signals of different biomolecules [
10,
11,
12].
Although the multi-resonant biosensors based on traditional materials can probe biomolecules in a relatively wide frequency range, their detected bands cannot be dynamically tuned to the designing frequencies after the fabrication process. To realize the postfabrication tuning, graphene has been taken into account as a promising candidate for biosensors. Graphene is a two-dimensional material with carbon atoms arranged in a honeycomb lattice [
13,
14]. Graphene-based photonic devices have attracted great interest due to its exceptional electrical and optical properties [
15,
16,
17,
18]. Optical biosensors based on graphene possess the advantage of tunable spectral selectivity owing to the tunability of graphene conductivity by electrostatic gating. Besides, the strong spatial light confinement in graphene also contributes to an enhanced sensitivity in the detection of RI changes and vibrational signals. In 2004, researchers from IBM Corporation utilized graphene nanoribbons to detect surface-adsorbed thin films of polymer for the first time [
19]. They further investigated the coupling between graphene plasmons and the vibrations of solid- and gas-phase molecules [
20]. Rodrigo et al. proposed a plasmonic graphene-based biosensor to identify the vibrational fingerprints of protein [
21]. They experimentally demonstrated that dynamic resonance tuning could be achieved by varying the gating voltage and vibrational signals were significantly enhanced compared with gold nanoantennas. Hu et al. successively reported thin polymers sensing and gas identification with graphene plasmon, utilizing CaF
2 nanofilm instead of SiO
2 to avoid the plasmon-phonon hybridization [
22,
23]. Zhu et al. designed a hybrid metasurface with suspended graphene and gold nanoantennas, while the nanoantennas were deposited close enough (about 10 nm), ultrasensitive biosensing ability was achieved to probe low-molecular-weight analytes [
24]. The above reported graphene-based biosensors showed higher sensitivity and detection limit than traditional biosensors. However, they all suffered from the problem of single resonant property, which limited their applications in detecting composite vibrational fingerprints simultaneously.
In this paper, a label-free multi-resonant graphene-based biosensor (MRGB) is numerically proposed for detection of composite vibrational fingerprints in the mid-infrared region. Compared with the previous structures [
18,
19,
20,
21,
22,
23,
24], the proposed biosensor requires simpler fabrication techniques. Each of the plasmonic resonances in transmission spectrum can be independently tuned by gating voltages to overlap with the vibrational fingerprints of different biomolecules at designing frequencies, leading to a wide spectral detection range. The influences of geometric parameters and incident angles on the performance of MRGB are discussed. Moreover, MRGB with graphene nanodisks are further designed to guarantee superior sensing ability under incident light with different polarizations.
2. Modeling and Methods
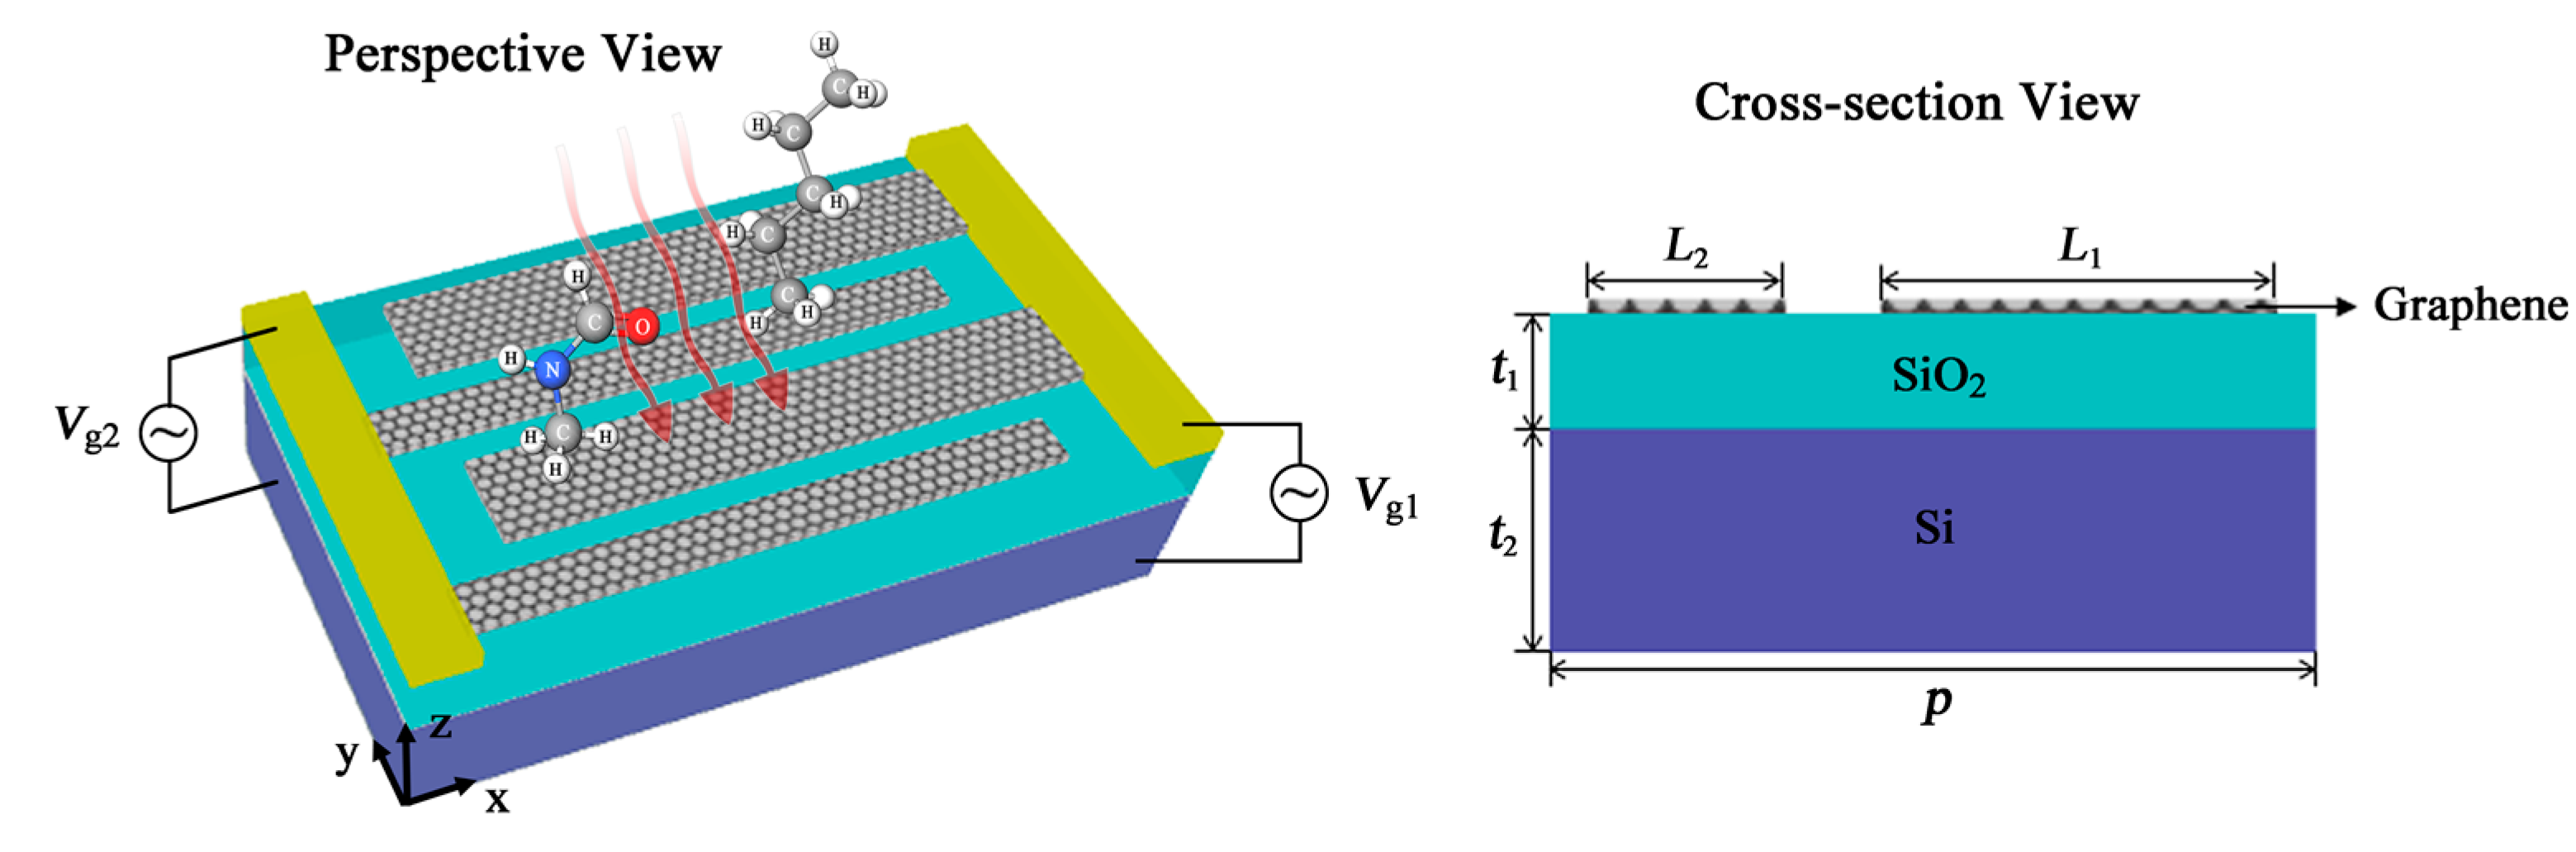
In order to realize a biosensor for detection of composite vibrational fingerprints, we utilize periodic graphene nanoribbons (GNRs) as a multi-resonant metasurface as plotted in
Figure 1. GNRs can be grown by chemical vapor deposition and wet-transferred to the surface of SiO
2 dielectric layer, while Si is chosen as the substrate to support this device. GNRs with different widths can be exposed using electron beam lithography. Wider GNRs are connected to the metallic electrode at the right far ends as the top contact, while narrower GNRs are connected to the metallic electrode at the left far ends as another top contact. The doped Si substrate is used as the bottom contact. Two bias voltages,
Vg1 and
Vg2, are applied on the interdigitated GNRs to control the Fermi energies
EF1 and
EF2 of GNRs separately. We assume that a mid-infrared plane wave illuminates on the top surface of MRGB, interacting with the graphene metasurface and the adsorbed biomolecules. The interaction is investigated using COMSOL Multiphysics, which solves Maxwell Equations with finite element method (FEM) in frequency domain. Floquet periodicity is chosen as boundary condition in both
x- and
y-directions. Tetrahedral meshes are used in the entire domain. The transmittance of MRGB can be expressed as
T = |S
21|
2, where S
21 can be directly obtained from the user-defined ports in the
z-directions.
The permittivity of SiO
2 and Si used in the simulation are chosen from Ref. [
25]. In order to reduce the mesh number and improve the computational efficiency in simulation, we assume graphene as a 2D conductive surface without thickness, instead of a 3D bulk volume. This assumption has already been proved to be effective and efficient in the simulation of graphene-based devices before [
26]. The surface conductivity of graphene can be calculated according to the well-known Kubo formulas [
27]:
Here, σintra and σinter are the intraband and interband contributions, respectively. ω is the angular frequency, EF denotes the Fermi energy, Γ is the scattering rate with Γ = 1/(2τ), τ is the relaxation time of electron-phonon, T is the Kelvin temperature, ħ is the reduced Planck constant, kB is the Boltzmann constant, e and ξ are the electron charge and energy, fd (ξ, EF, T) is the Fermi–Dirac distribution.
In the mid-infrared region, the intraband transition dominates the light-graphene interaction since the interband transition can be ignored. When
T is assumed to be 300 K, Kubo formulas can be simplified as follows:
The realistic value of
τ for graphene grown on the SiO
2 substrate is usually smaller than 100 fs. To guarantee the validity and reliability of our simulation model, we choose
τ as 15 fs according to the experimental work form Ref. [
21], so the surface conductivity of graphene is determined by the Fermi energy
EF and angular frequency
ω. An approximate closed-form expression between
EF and gating voltage
Vbias, is given by [
28] as Equation (6):
where
ε0 is the permittivity of free space,
εr and
D are the equivalent relative permittivity and the thickness of insulating layers, respectively.
To demonstrate the detection ability for composite vibrational fingerprints of multiple biomolecules, we assume the protein and lipid molecules in the simulation as a thin layer with 8 nm thickness according to the previous experimental work [
21], whose relative permittivity can be calculated by the Lorentzian series as:
The symbol
N denotes the number of oscillators, which is assumed as 3 relating to the corresponding parameters. The main vibrational fingerprints of proteins are amide I and II bands (about 1668 cm
−1 and 1532 cm
−1), while the CH
2 band (about 2900 cm
−1) is dominated in lipid molecules. Therefore, parameters are chosen as
ω1 = 1668 cm
−1,
ω2 = 1532 cm
−1,
ω3 = 2900 cm
−1,
γ1 = 78.1 cm
−1,
γ2 = 101 cm
−1,
γ3 = 111 cm
−1,
S1 = 213 cm
−1,
S2 = 200 cm
−1,
S3 = 230 cm
−1,
, according to the experiment works from Refs. [
11,
21,
29].
In our simulations, the exact sensitivity of MRGB is difficult to calculate due to the rough approximation of the biomolecules. However, the changing law of its sensitivity can be derived using the enhancement factor (
EF), which can be expressed as [
4]:
Here, I0 denotes the unenhanced signal strength, A0 and ASEIRA are the areas covered with molecules in reference and SEIRA measurements. ISEIRA is the enhanced signal strength that can be obtained from the baseline-corrected vibrational signal. For our simulation, variation of any parameter has no effect on I0, A0 and ASEIRA. Therefore, the changing law of sensitivity is directly related to the variation rule of ISEIRA, which can be approximately observed from the simulated transmittance spectra.
3. Results and Discussion
Transmittance spectra of MRGB under mid-infrared incidence are plotted in
Figure 2 to investigate the detection capacity for composite vibrational fingerprints of multiple biomolecules. The geometric parameters are
L1 = 40 nm,
L2 = 20 nm,
t1 = 280 nm,
t2 = 500 nm, and
p = 80 nm. Two obvious transmission dips are observed in the spectra under TMincidence, which is able to induce the electrons to vibrate in the finite width of GNRs due to its electric field direction. In contrast, TE incidence could not excite the plasmonic resonance in GNRs because of its electric field parallel to the nanoribbons. Hence, we focus on the sensing performance of MRGB with TM incidence in the following analysis.
In
Figure 2a, by sweeping
EF1 from 0.40 eV to 0.60 eV, the first transmission dip of MRGB without protein and lipid is electrostatically tuned from 1525 cm
−1 to 1875 cm
−1, while the second resonance frequency is located around 3300 cm
−1, with
EF2 fixed at 0.85 eV. After the adsorption of protein and lipid molecules, the spectra are red-shifted due to the RI change at the surface of MRGB. Although the thickness of biomolecule layer is only several nanometers, the detected frequency shifts still exceed 350 cm
−1, which is better than Ref. [
21]. Besides, two vibrational fingerprints at 1668 cm
−1 and 1532 cm
−1 are almost undetectable as the resonance dip is far from them (e.g., for
EF1 = 0.40 eV). As the spectral overlap increases, the vibrational signals become progressively more intense (e.g., for
EF1 = 0.60 eV), whose spectral positions are in accordance with the amide I and II bands, respectively.
In
Figure 2b, the second resonant transmission dip is tuned by gating voltage
Vg2 to sweep over the lipid vibrational band independently. When
EF1 = 0.55 eV and
EF2 = 0.70 eV, the vibrational bands in protein are easily detected attributed to the first transmission dip. However, the lipid vibrational band is almost undetectable since it is far from the second transmission dip. As
EF2 increases to 0.85 eV, the lipid sensing is achieved by narrow peak appearing at 2900 cm
−1 corresponding to the CH
2 band. It unambiguously reveals the presence of the lipid compounds in a chemically specific manner. If
EF2 continues increasing to 0.90 eV, the detected lipid vibrational signal becomes weakened as the second resonant dip moves away to larger frequencies gradually.
Therefore, the proposed MRGB can not only work as a refractive index biosensor by detecting a plasmon resonance spectra shift, but also identify composite vibrational fingerprints in multiple biomolecules simultaneously due to the resonant coupling between plasmons and molecular vibrations [
30]. Moreover, it possesses the independent tuning ability for individual plasmonic resonance, which is significant and flexible in practical sensing applications.
We depict the electric field distributions in
Figure 3 to illustrate the resonant property of MRGB with protein and lipid molecules. As can be seen from
Figure 2, when
EF1 = 0.55 eV and
EF2 = 0.85 eV, the transmission spectra show two obvious dips around 1600 cm
−1 and 2967 cm
−1. At
k = 1600 cm
−1, the enhanced electric field is dramatically concentrated along the edges of the wider GNRs as shown in
Figure 3a. This is attributed to the fact that the incident TM mid-infrared light can excite electrons of graphene to oscillate in the finite width of nanoribbon, inducing the localized surface plasmon resonance (LSPR) in the wider GNRs [
31,
32]. Similarly, at
k = 2967 cm
−1 as shown in
Figure 3c, plasmonic hotspots are generated at the edges of the narrower GNRs. The localized resonance originates from the electric dipole surrounding the edges of narrower GNRs and contributes to the corresponding transmission dip in the spectrum. Compared with gold nanoribbons, a higher field confinement for similar infrared-frequency plasmons is observed due to the atomic thickness of graphene as demonstrated in Ref. [
21]. Consequently, a much larger spatial overlap between the plasmonic near field and biomolecules occurs, leading to a better sensitivity than biosensor based on metallic nanoantennas [
21].
On the other hand, there is no obviously enhanced electric field at
k = 2167 cm
−1 as shown in
Figure 3b. The explanation is that this frequency is far from either of the two resonance dips in the spectral domain.
The widths of GNRs are critical to the plasmonic resonance in MRGB. By gradually adjusting
L1 from 40 nm to 16 nm, the first transmission dip can be tuned from 1600 cm
−1 to 2550 cm
−1 independently as shown in
Figure 4a. These two transmission dips tend to merge together as
L1 becomes smaller and smaller, then MRGB turns out to be a broadband graphene-based biosensor (BGB), which can be used for covering several vibrational lines within a limited frequency range. Similarly, the second transmission dip can also be tuned independently by changing
L2 as demonstrated in
Figure 4b. The resonant frequency has a blue shift as the width of GNRs decreases, which is mainly attributed to the decrease of the effective length for dipole oscillation along the nanoribbon edges. The natural resonant frequencies of graphene nanoribbons determined by the ribbon width are given by Equation (9) [
33,
34]:
One can see from Equation (9) that the resonant frequency ωres scales with the reciprocal of the square root of the width of graphene nanoribbon.
Another geometric parameter playing a vital role in the MRGB performance is the thickness of dielectric layer
t1.
Figure 4c depicts that transmission dip will have a dramatic drop with the decrease of
t1. However, the strength of resonance is also lessened, which impedes the sensitivity of MRGB. Thus, there is an optimal thickness
t1, at which the performance of MRGB reaches the optimum. The optimal
t1 is related with the concerning vibration signals. Considering the relatively strong signal strengths for both protein and lipid,
t1 is chosen as 280 nm as the optimal value in our simulation.
The discussion above is about normal incidence, the sensing performance of MRGB under oblique incidence is further revealed to satisfy different sensing applications. Transmittance spectra of MRGB covered with protein and lipid molecules under different incident angles are plotted in
Figure 4d. As can be seen, two obvious transmission dips remain at around 1600 cm
−1 and 2900 cm
−1 when
θ < 60°. They overlap with the vibrational fingerprints of corresponding biomolecule in the spectrum. As a consequence, three vertical lines, which indicate the amide-I, amide-II and CH
2 absorption bands respectively, line in the regions designated by the dashed lines. Thus, sensing performance of MRGB under oblique incidence shows good robustness, which is significant for optical biosensors.
The detection limit is another critical figure of merit for a biosensor, which represents how little material it can access. In our simulations, we assume the hybridization of protein and lipid as a homogeneous thin layer covering the entire structure including the antennas and substrate. However, the molecules outside the active area contribute little to the enhanced vibrational signals, since SEIRA signals mainly originate from the molecules located in the antenna hot-spots. Therefore, the exact number of molecules required for detection is hardly to be estimated in the simulations. Nevertheless, to investigate the limit of detection roughly, we vary the thickness of biomolecular layer and tune the resonance to match the vibrational frequency as shown in
Figure 5. As can be seen, as the thickness of biomolecular layer decreases from 8 nm to 2 nm, the enhanced signal strength gets weakened. However, even when the biomolecular layer becomes as thin as 2 nm, corresponding to essentially a single protein monolayer, the enhanced vibrational signal can also be faintly observed. Therefore, the smallest material that the sensor can access is considered to be monolayer molecules. To obtain
ISEIRA in Equation (8), one should iteratively estimate baseline transmittance
Tbaseline using a smoothing algorithm [
35], and then calculate the baseline-corrected vibrational signal
Tmeas/
Tbaseline, where
Tmeas is the simulated transmittance. The signal strength
ISEIRA of the enhanced molecular vibrational mode is 0.009, which is obtained as peak-to-peak value from the baseline-corrected vibrational signal spectrum. The unenhanced signal strength
I0 is 0.00006, which can also be obtained by the baseline-corrected algorithm. For the proposed MRGB with GNRs, we assume a finite length of GNRs as
l in a single unit cell along the
x-axis, so
A0 can be expressed as
A0 p l. The enhanced SEIRA signal mainly originates from the molecules located in the GNRs hot-spots as shown in
Figure 3. On the basis of this finding, a commonly used approximation for the active area is the surface of the GNR edges. Therefore,
ASEIRA can be expressed as
ASEIRA 2
l (
p), where
is the thickness of GNRs. Therefore, when
is assumed as 0.5 nm, by substituting these variables into Equation (8),
EF can be obtained as 12,000. Obviously, the approximation is rather rough, but it still provides some guidance for experiments.
4. MRGB with Graphene Nanodisks
GNRs have an infinite length in the
x-direction compared with the width in the
y-direction. Thus, the performance of MRGB with GNRs is highly dependent on the polarization of incidence as shown in
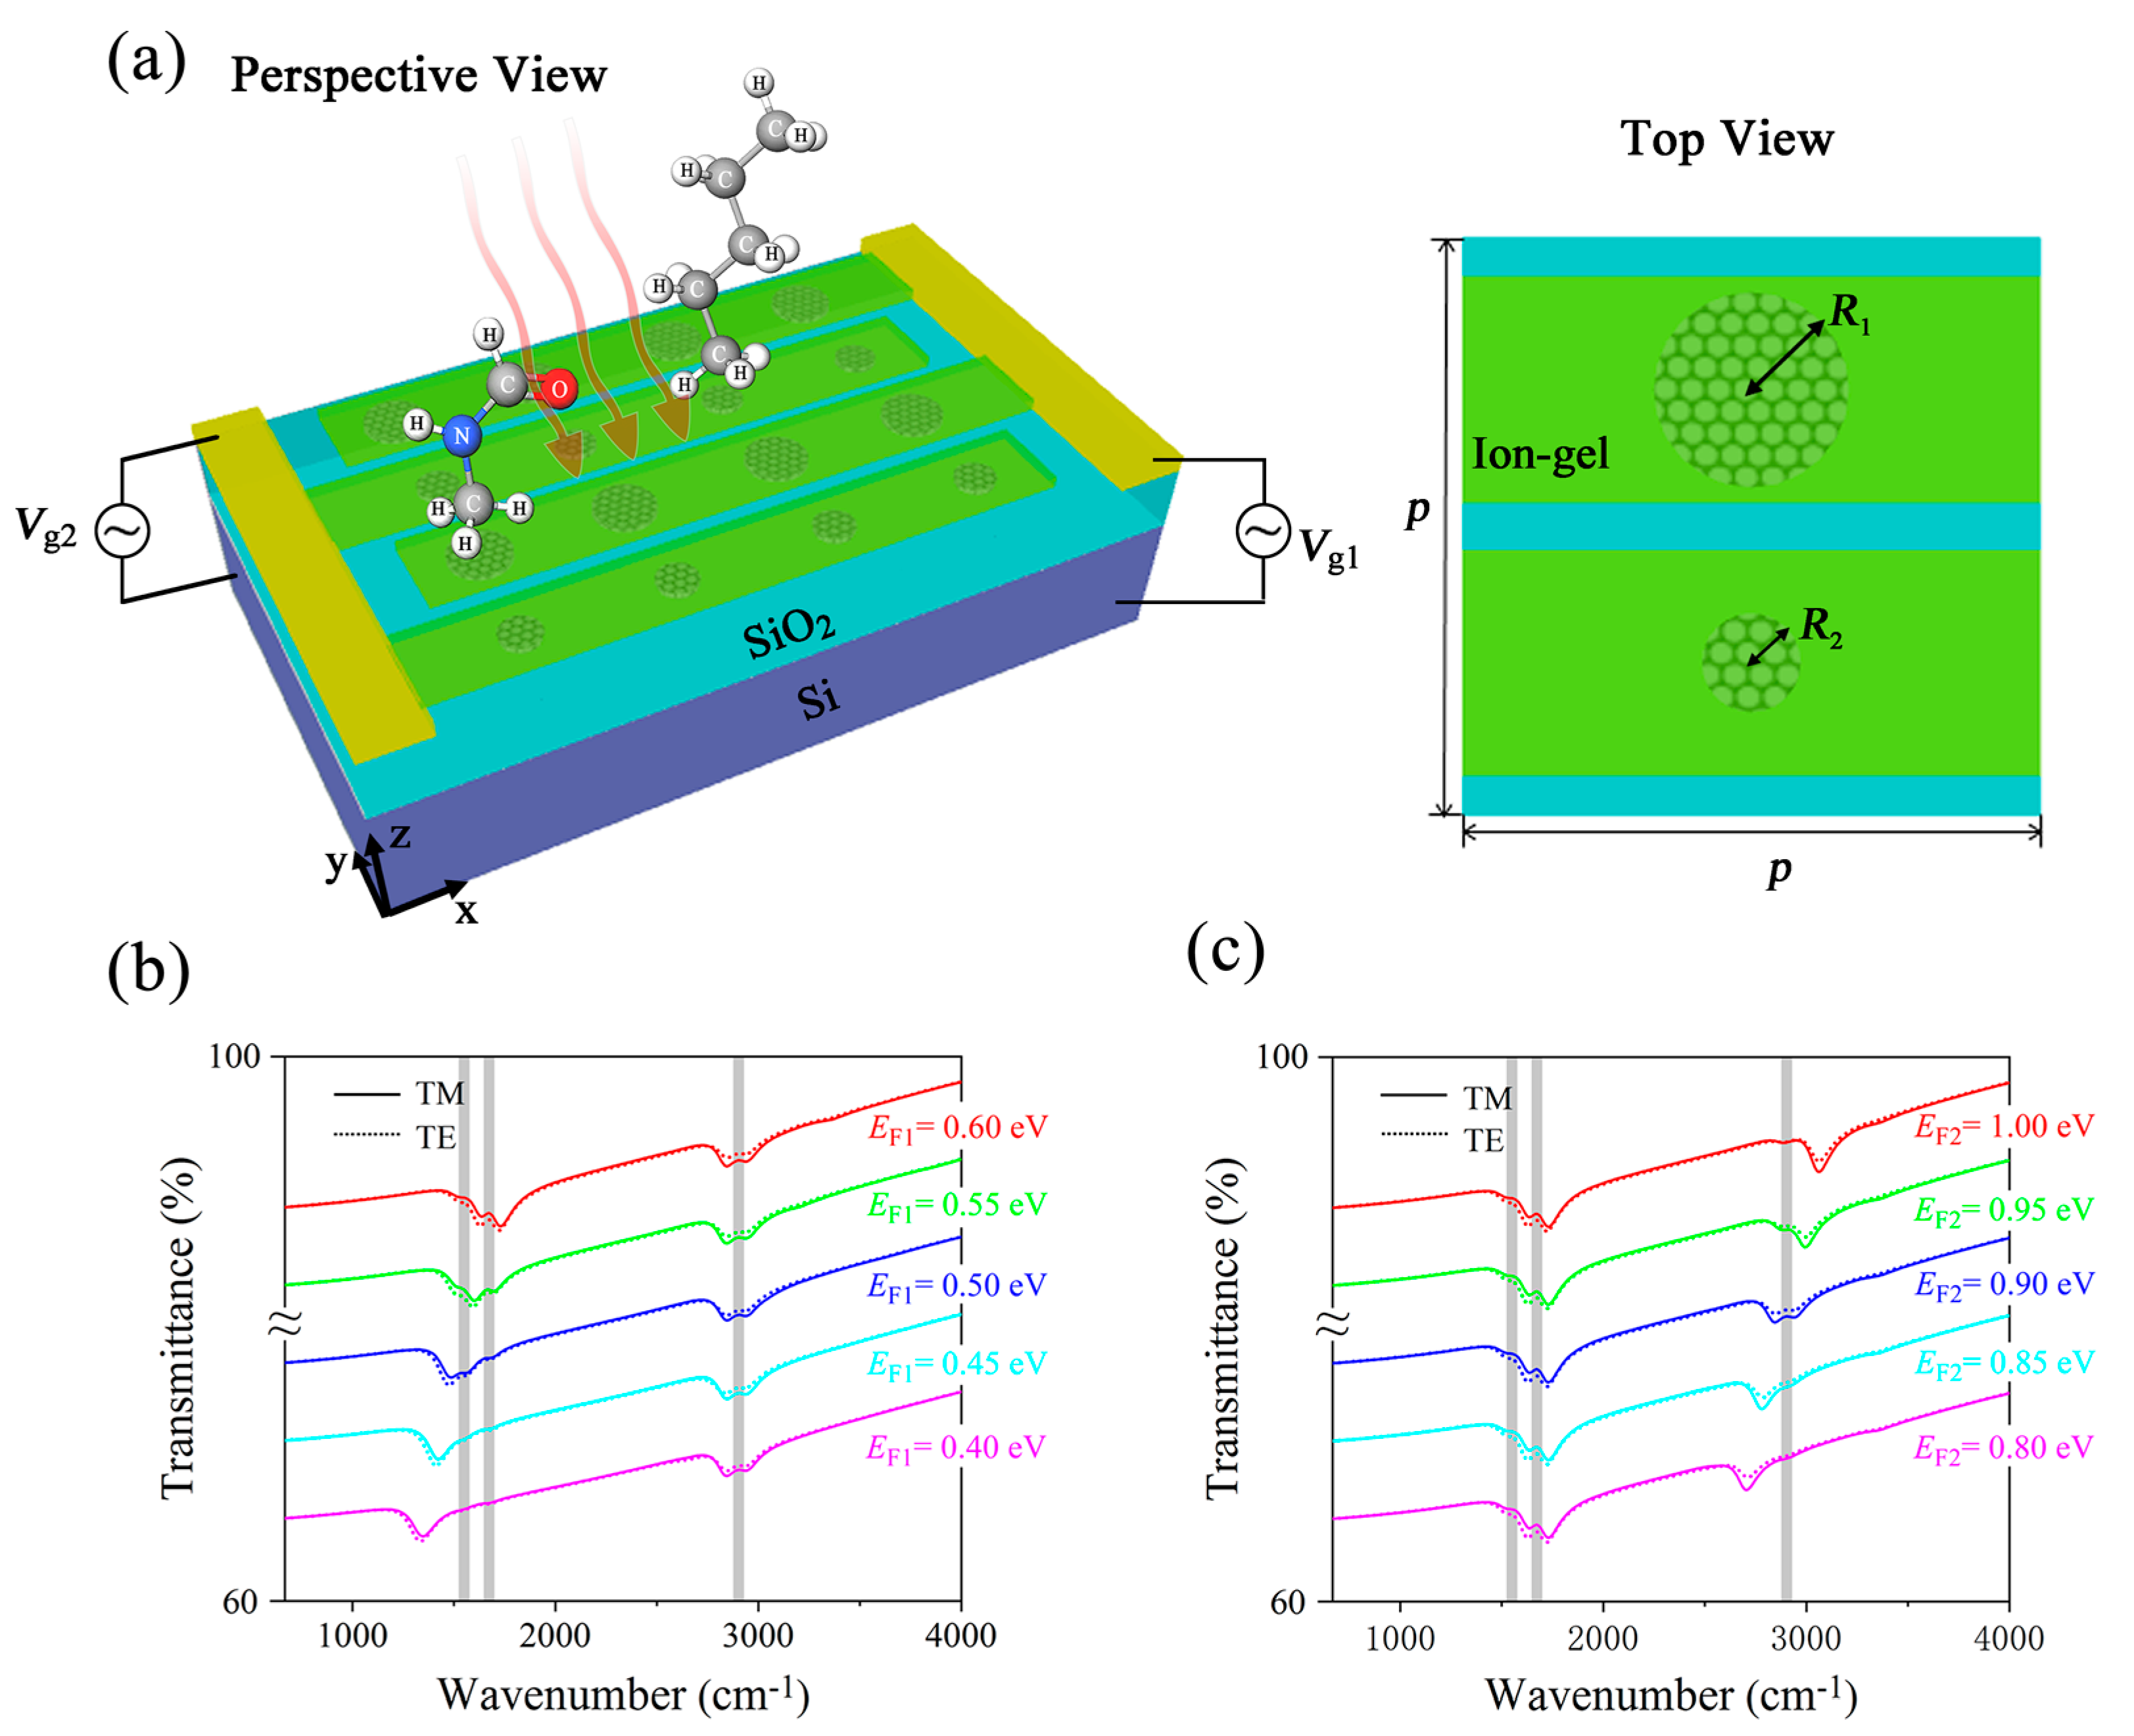
Figure 2. It can only operate properly under TM polarized incidence, which limits its further application for detection of composite vibrational fingerprints. To overcome the drawback of polarization dependence, we develop an improved three-dimensional (3D) MRGB as illustrated in
Figure 6a. A unit of 3D MRGB is made up of two graphene nanodisks (GNDs), SiO
2 layers and Si substrate. Here, the structural variation of the GNDs in the
x-direction gives the third dimension compared with GNRs. Two nanodisks have different radiuses denoted as
R1 and
R2, and we assume
R1 >
R2 in the physical model. In the practical applications, the ion-gel layer is commonly considered as a top gate to achieve the tunability of the graphene Fermi energy [
36,
37]. As plotted in
Figure 6a, two sets of interdigitated ion-gel layers with ultra-high capacitance can be spin-coated on top of the proposed MRGB, and two gold gate contacts are fabricated on the interdigitated ion-gel layers to serve as two separated electrodes for the purpose of electrostatic doping. GNDs with different radiuses are controlled by separated top gate voltages, so one can tune Fermi energy of graphene effectively with different bias voltages. The influence on the sensitivity after introducing the ion-gel layer can be neglected due to its ultrathin thickness. The transparent ion-gel can also act as a protective layer to keep GNDs from environmental-induced degradation.
Transmittance spectra of 3D MRGB with protein and lipid under mid-infrared incidence are plotted in
Figure 6b,c to investigate the sensing performance for detection of composite vibrational fingerprints in multiple biomolecules. After rigorous optimization for the sensing performance, the geometric parameters are chosen as
R1 = 20 nm,
R2 = 10 nm,
t1 = 280 nm,
t2 = 500 nm, and
p = 80 nm. One can see two obvious transmission dips in the spectra under both TM and TE incidence. In
Figure 6b, when
EF1 = 0.40 eV, the resonance dip is far from the amide I and II bands, so the vibrational signals of protein are almost undetectable. By continuously varying
EF1 from 0.40 eV to 0.60 eV, the first transmission dip of MRGB is tuned from 1350 cm
−1 to 1700 cm
−1, sweeping over the two vibrational fingerprints in protein located at 1668 cm
−1 and 1532 cm
−1. The molecular vibrational bands of protein are clearly observed due to the increase of spectral overlap. On the other hand, with
EF2 fixed at 0.90 eV, the second resonant dip remains around 2900 cm
−1, resulting in a detection of CH
2 band in lipid. In
Figure 6c, the first transmission dip is fixed at around 1700 cm
−1 with
EF1 set as 0.60 eV, then the vibrational bands in protein are easily detected attributed to the large spectral overlap. Besides, the second resonance is tuned by bias voltage
Vg2 to sweep across the lipid vibrational band independently. When
EF2 = 0.80 eV, the lipid vibrational signal can hardly be detected since it is far from the second transmission dip. As
EF2 increases to 0.90 eV, the detection of lipid molecules is achieved by enhancing a vibrational signal at 2900 cm
−1 corresponding to the CH
2 band. If
EF2 continues increasing to 1.00 eV, the detected lipid vibrational signal almost vanishes as the second resonant dip moves away gradually. Therefore, the proposed 3D MRGB with GNDs is able to identify composite vibrational fingerprints in multiple biomolecules simultaneously for both TM and TE polarization. It also possesses the independent tunability for individual plasmonic resonance to satisfy different sensing applications.
Next, we further investigate the sensing performance of 3D MRGB under non-normal mid-infrared incidence. In
Figure 7a, transmittance spectra of 3D MRGB with protein and lipid as a function of wavenumber and incident angle
θ are depicted for TM polarization. The parameters are
R1 = 20 nm,
R2 = 10 nm,
t1 = 280 nm,
t2 = 500 nm,
p = 80 nm,
EF1 = 0.6 eV,
EF2 = 0.9 eV. When
θ is below 72°, protein can be detected due to the spectral overlapping between the vibrational fingerprints and the first resonance. The vibrational fingerprint of lipid is also enhanced to some extent by the second resonance. When
θ increases to 68°, the protein molecules can still be identified while the signal of lipid molecules is too weak to detect. In
Figure 7b, for TE polarization, the vibrational fingerprints of protein is clearly detected until the incident angle is up to 70°. The lipid can be detected with a faint signal, and is almost undetectable when
θ increases up to 65°. Therefore, the 3D MRGB can guarantee sensing ability in a wide incident angle range for both TM and TE polarized incidence.
Finally, the polarization dependence of 3D MRGB for detecting protein and lipid molecules is further evaluated. The transmission spectra under normal incidence with polarization angle
φ from 0° to 90° are shown in
Figure 7c. We assume the polarization angle of TM incidence to be 0°, so the transmittance in
Figure 7c at
φ = 0° is the same as the solid curves plotted in
Figure 6b or
Figure 6c. As
φ increases to 90°, the incidence slightly becomes a TE polarized mid-infrared light. Therefore, the transmittance gradually turns out to be the same as the dashed curves in
Figure 6b or
Figure 6c, which is a little different from that of TM polarization. When 0° <
φ < 90°, both
x-axis and
y-axis components coexist in the incident electric field, so the transmittance is shown as a non-polarized status. The vibrational fingerprints of protein are clearly observed at any polarization angle, while that of lipid is slightly weakened as the polarization angle increases. However, even if the polarization is up to 90° (TE polarization), a tiny vibrational signal located at the CH
2 band can also be detected as shown in
Figure 6b,c. When
EF1 is fixed at 0.60 eV and
EF2 is 0.90 eV, for TM polarization, the transmittance rates at 1532 cm
−1 (amide-I), 1668 cm
−1 (amide-II) and 2900 cm
−1 (CH
2) are 71%, 69% and 78%, respectively, while they are 72%, 70% and 77% for TE polarization. The small difference of sensing performance between TM and TE polarization is mainly because the unit cell of 3D MRGB is not four-fold symmetrical, although both the big GNDs and small GNDs can support plasmonic localized resonance in either
x-axis or
y-axis direction.


