Article

Enhanced Electrocatalytic Activity and Stability toward the Oxygen Reduction Reaction with Unprotected Pt Nanoclusters

1
Laboratory of Environmental Sciences and Technology, Xinjiang Technical Institute of Physics & Chemistry, and Key Laboratory of Functional Materials and Devices for Special Environments, Chinese Academy of Sciences, Urumqi 830011, China
2
University of Chinese Academy of Sciences, No. 19 Yuquan Road, Beijing 100049, China
3
Department of Chemistry and Biochemistry, Northern Illinois University, DeKalb, IL 60115, USA
*
Authors to whom correspondence should be addressed.
Nanomaterials 2018, 8(11), 955; https://doi.org/10.3390/nano8110955
Submission received: 3 November 2018 / Revised: 16 November 2018 / Accepted: 16 November 2018 / Published: 20 November 2018

Abstract

:
The Pt particles within diameters of 1–3 nm known as Pt nanoclusters (NCs) are widely considered to be satisfactory oxygen reduction reaction (ORR) catalysts due to higher electrocatalytic performance and cost effectiveness. However, the utilization of such smaller Pt NCs is always limited by the synthesis strategies, stability and methanol tolerance of Pt. Herein, unprotected Pt NCs (~2.2 nm) dispersed on carbon nanotubes (CNTs) were prepared via a modified top-down approach using liquid Li as a solvent to break down the bulk Pt. Compared with the commercial Pt/C, the resultant Pt NCs/CNTs catalyst (Pt loading: 10 wt.%) exhibited more desirable ORR catalytic performance in 0.1 M HClO4. The specific activity (SA) and mass activity (MA) at 0.9 V for ORR over Pt NCs/CNTs were 2.5 and 3.2 times higher than those over the commercial Pt/C (Pt loading: 20 wt.%). Meanwhile, the Pt NCs/CNTs catalyst demonstrated more satisfactory stability and methanol tolerance. Compared with the obvious loss (~69%) of commercial Pt/C, only a slight current decrease (~10%) was observed for Pt NCs/CNTs after the chronoamperometric measurement for 2 × 10⁴ s. Hence, the as-prepared Pt NCs/CNTs material displays great potential as a practical ORR catalyst.

Graphical Abstract

1. Introduction

The oxygen reduction reaction (ORR) is a vital component in fuel cells. Currently, Pt-based nanomaterials are the most effective catalysts to improve the ORR performance [1]. However, they suffer from a series of drawbacks including high costs, unsatisfactory catalytic activity, poor stability and lower methanol tolerance [2,3]. Hence, a large number of research articles have been focusing on figuring out these problems [4,5,6]. Among a wide variety of strategies, reducing the size of Pt into smaller size less than 3 nm referred as nanoclusters (NCs) has been frequently highlighted in that Pt NCs present more satisfactory ORR performance compared with larger Pt nanoparticles (NPs) because of the smaller size, narrower size distribution and more active sites [7,8,9]. More importantly, the smaller size endows Pt NCs with a large proportion of low-coordinated surface atoms, which is helpful for the adsorption and activation of O2 on the catalyst surface [10]. As a consequence, Pt NC catalysts adopted in ORR can both dramatically enhance the electrocatalytic activity and lower the cost of Pt. However, Pt NCs usually require to be protected by the stabilizing agents to prevent the aggregation, which would hinder the mass transfer process and electron transportation and thus give rise to a sharp reduction in the electrochemical performance [11]. Consequently, developing more versatile preparation methods without any stabilizing agents to promote unprotected Pt NCs with improved electrocatalytic performance in ORR is highly desirable.
Among various fabrication strategies for the preparation of unprotected Pt NCs, the top-down approach is regarded as one of the most effective methods to relatively regulate the uniform distribution of particle size and control the particle size within 1–3 nm [12]. In particular, this method not only involves no protecting agents but also avoids chloride contamination which will also likely cause the loss of catalytic activity as protecting agents [13,14]. For example, Vulcan XC-72R carbon black supported Pt (Pt/Vulcan XC-72R) with a mean particle size of 1.9 ± 0.3 nm was synthesized via this method. Though the Pt/Vulcan XC-72R exhibited improved ORR activity compared with commercial Pt/C, it is far from to meet the requirement for practical application of fuel cells. In addition, the stability of the Pt/Vulcan XC-72R is unsatisfactory and the Pt loading on the substrate of Vulcan XC-72R was up to 15 wt.%. Hence, how to continue to lower the mass loading and boost the electrocatalytic performance and stability of unprotected Pt NCs stemmed from the top-down approach are urgently needed to be addressed.
Furthermore, the substrates to uniformly load and anchor the unprotected Pt NCs also make great contributions to promoting catalytic activity and stability for ORR. In particular, the strong interactions between the support and Pt NCs can prevent the dissolution and aggregation of Pt NCs during the ORR process [15]. Among a wide variety of available supporting materials, CNTs have been proposed as one of the most promising matrixes because of the high resistance to electrochemical oxidation and corrosion, high electronic conductivity, and low cost [16,17,18]. More importantly, the graphitic structure endows CNTs with higher electrochemical stability and quicker electron transfer rate, which is beneficial for both improving the ORR performance and stability [19,20]. Hence, CNTs as supporting material would give rise to an enhanced ORR activity and stability.
In the present work, a modified top-down method was proposed to fabricate unprotected Pt NCs anchored on CNTs with the average particle size of ~2.2 nm. The as-prepared Pt NCs/CNTs-10% demonstrated more desirable ORR activity in 0.1 M HClO4. The specific activity (SA) and mass activity (MA) over Pt NCs/CNTs-10% at 0.9 V were calculated to be 0.194 mA cm−2 and 167 mA mg−1, respectively, which were 2.5 times and 3.2 times higher than those of Pt/C-20% (0.079 mA cm−2 and 52 mA mg−1). Notably, such a sample also exhibited remarkably higher stability and methanol tolerance than commercial Pt/C-20%. Compared with the obvious loss (~69%) of commercial Pt/C, only a slight current decrease (~10%) was observed after the chronoamperometric measurement for 2 × 10⁴ s. Thus, the as-prepared Pt NCs/CNTs-10% holds great potential as a practical ORR catalyst.

2. Materials and Methods

2.1. Materials

Commercial Pt/C catalyst (Pt loading: 20 wt.%) and carbon nanotubes were obtained from Adamas-beta (Shanghai, China). Lithium and platinum foil, perchloric acid (70%) were purchased from Alfa-Aesar (Shanghai, China). Absolute ethyl alcohol and methanol were supplied by Tianjin Zhi yuan Chemical Reagent Co., Ltd (Tianjin, China). Nafion (5%) were purchased from Sigma-aldrich (Saint Louis, MO, USA).

2.2. Synthesis of Pt NCs/CNTs-10%

Synthesis of Pt NCs was carried out through a modified top-down approach in an Ar-filled glovebox. 2.1 g of Li was heated to 235 °C in a nickel crucible, to which 20 mg Pt foil was added simultaneously. The mixture was sonicated at 235 °C for 5 h to achieve a homogeneous dispersion. Then the Li-Pt molten was poured onto a stainless plate and removed from the glovebox. By cutting into small pieces, Li was slowly converted to LiOH under vapor water. 180 mg of CNTs was added into the LiOH. The mixture was pestled for 30 min. The LiOH was isolated with distilled water leaving the Pt NCs on the CNTs support (Pt NCs/CNTs). The Pt NCs/CNTs was washed five times with distilled water and then dried at 60 °C in vacuum for 12 h. The sample with 10 wt.% Pt loading and the commercial Pt/C with 20 wt.% Pt loading are denoted as Pt NCs/CNTs-10% and Pt/C-20%, respectively.

2.3. Characterizations

X-ray diffraction (XRD) patterns were performed with samples on a Bruker D8 diffractometer, (Karlsruhe, Germany). Transmission electron microscope (TEM) images were obtained with a FEI f20. The lattice-resolved images were obtained by high-resolution TEM (HRTEM, FEI f20, Hillsboro, OR, USA). The Energy dispersive X-ray spectroscopy (EDS) was obtained by the EDS8000. X-ray photoelectron spectroscopy (XPS) was obtained on a KRATOS Analytical AXISHSi spectrometer (Kanagawa, Japan). N2 adsorption/desorption isotherms were made on Micromeritics ASAP2020 (Norcross, GA, USA). The inductively coupled plasma-optical emission spectrometry (ICP-OES) data were obtained on VISTA-PRO CCD (Chicago, IL, USA).

2.4. Electrocatalytic Measurements

Cyclic voltammograms (CV) and rotating disk electrode (RDE, Pine Instrument, Hong Kong, China) measurements were conducted on CHI660E to evaluate the ORR performance. All data were recorded at room temperature in a three-electrode cell in 0.1 M HClO4. Pt foil and Ag/AgCl electrodes are used as counter electrode and reference electrode, respectively. All potentials in this work are reported versus reversible hydrogen electrode (RHE) via converting the measured potentials using Equation (1):
  E R H E = E A g / A g C l   + 0.059 × p H + 0.197  
Prior to the CV and RDE measurements, the glassy carbon electrode was polished with 0.3 μm alumina slurries (Buehler, IL, USA) to a mirror finish and then washed and ultrasonically cleaned in ultrapure water for 3 min. The 0.1 M HClO4 electrolyte was saturated with O2 (99.999%), N2 (99.999%) or Ar (99.999%). The working electrode was prepared as follows: Suspend 6 mg Pt NCs/CNTs-10% in the mixture of Nafion (25 μL, 5 wt.%) and C2H5OH (475 µL) and then sonicated for 30 min to obtain a homogeneous suspension. 10 μL of the suspension was deposited on the Φ5 mm glassy carbon disk and dried in air. The Pt loading on the glassy carbon was ∼0.06 mg cm−2. CV data were measured between 0 and 1.2 V at 50 mV s−1. RDE data were obtained at 10 mV s–1. The stability and the methanol tolerance of Pt NCs/CNTs-10% were investigated by the chronoamperometric measurement.

3. Results and Discussion

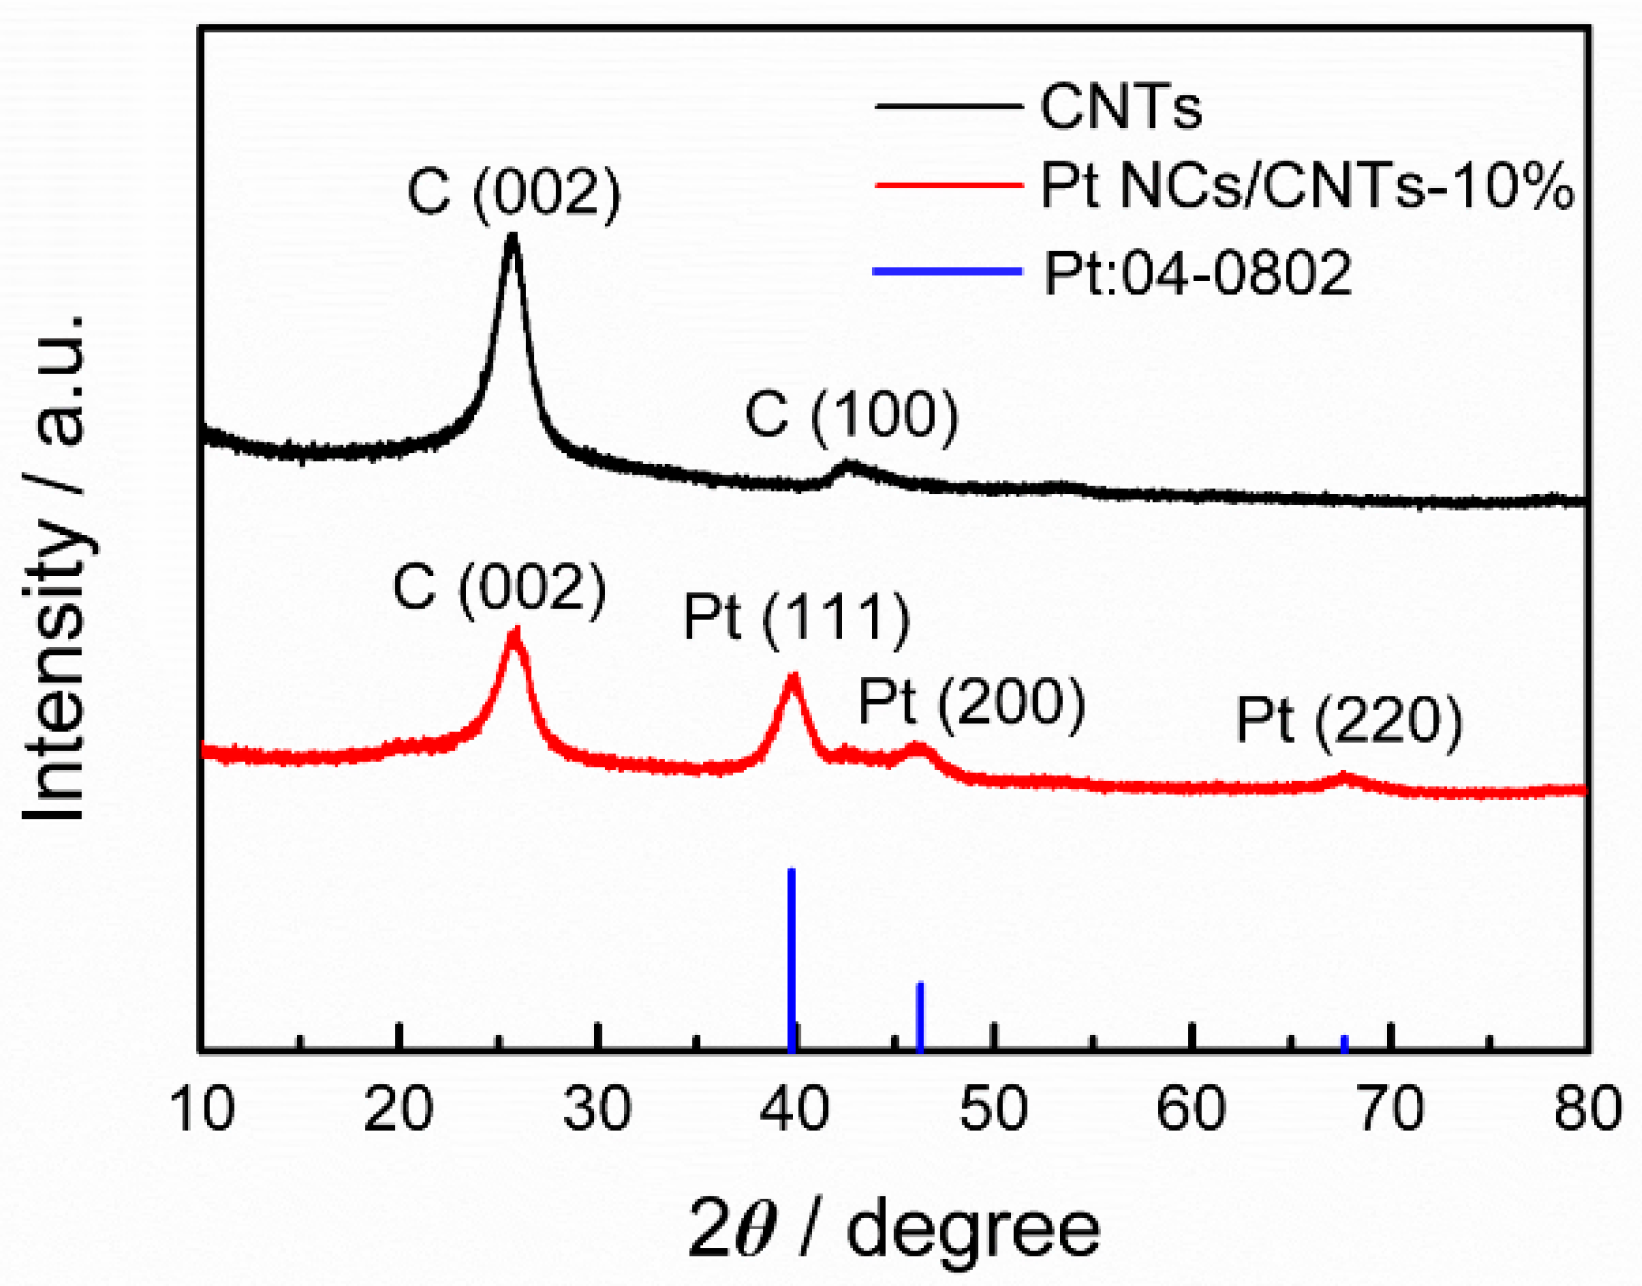
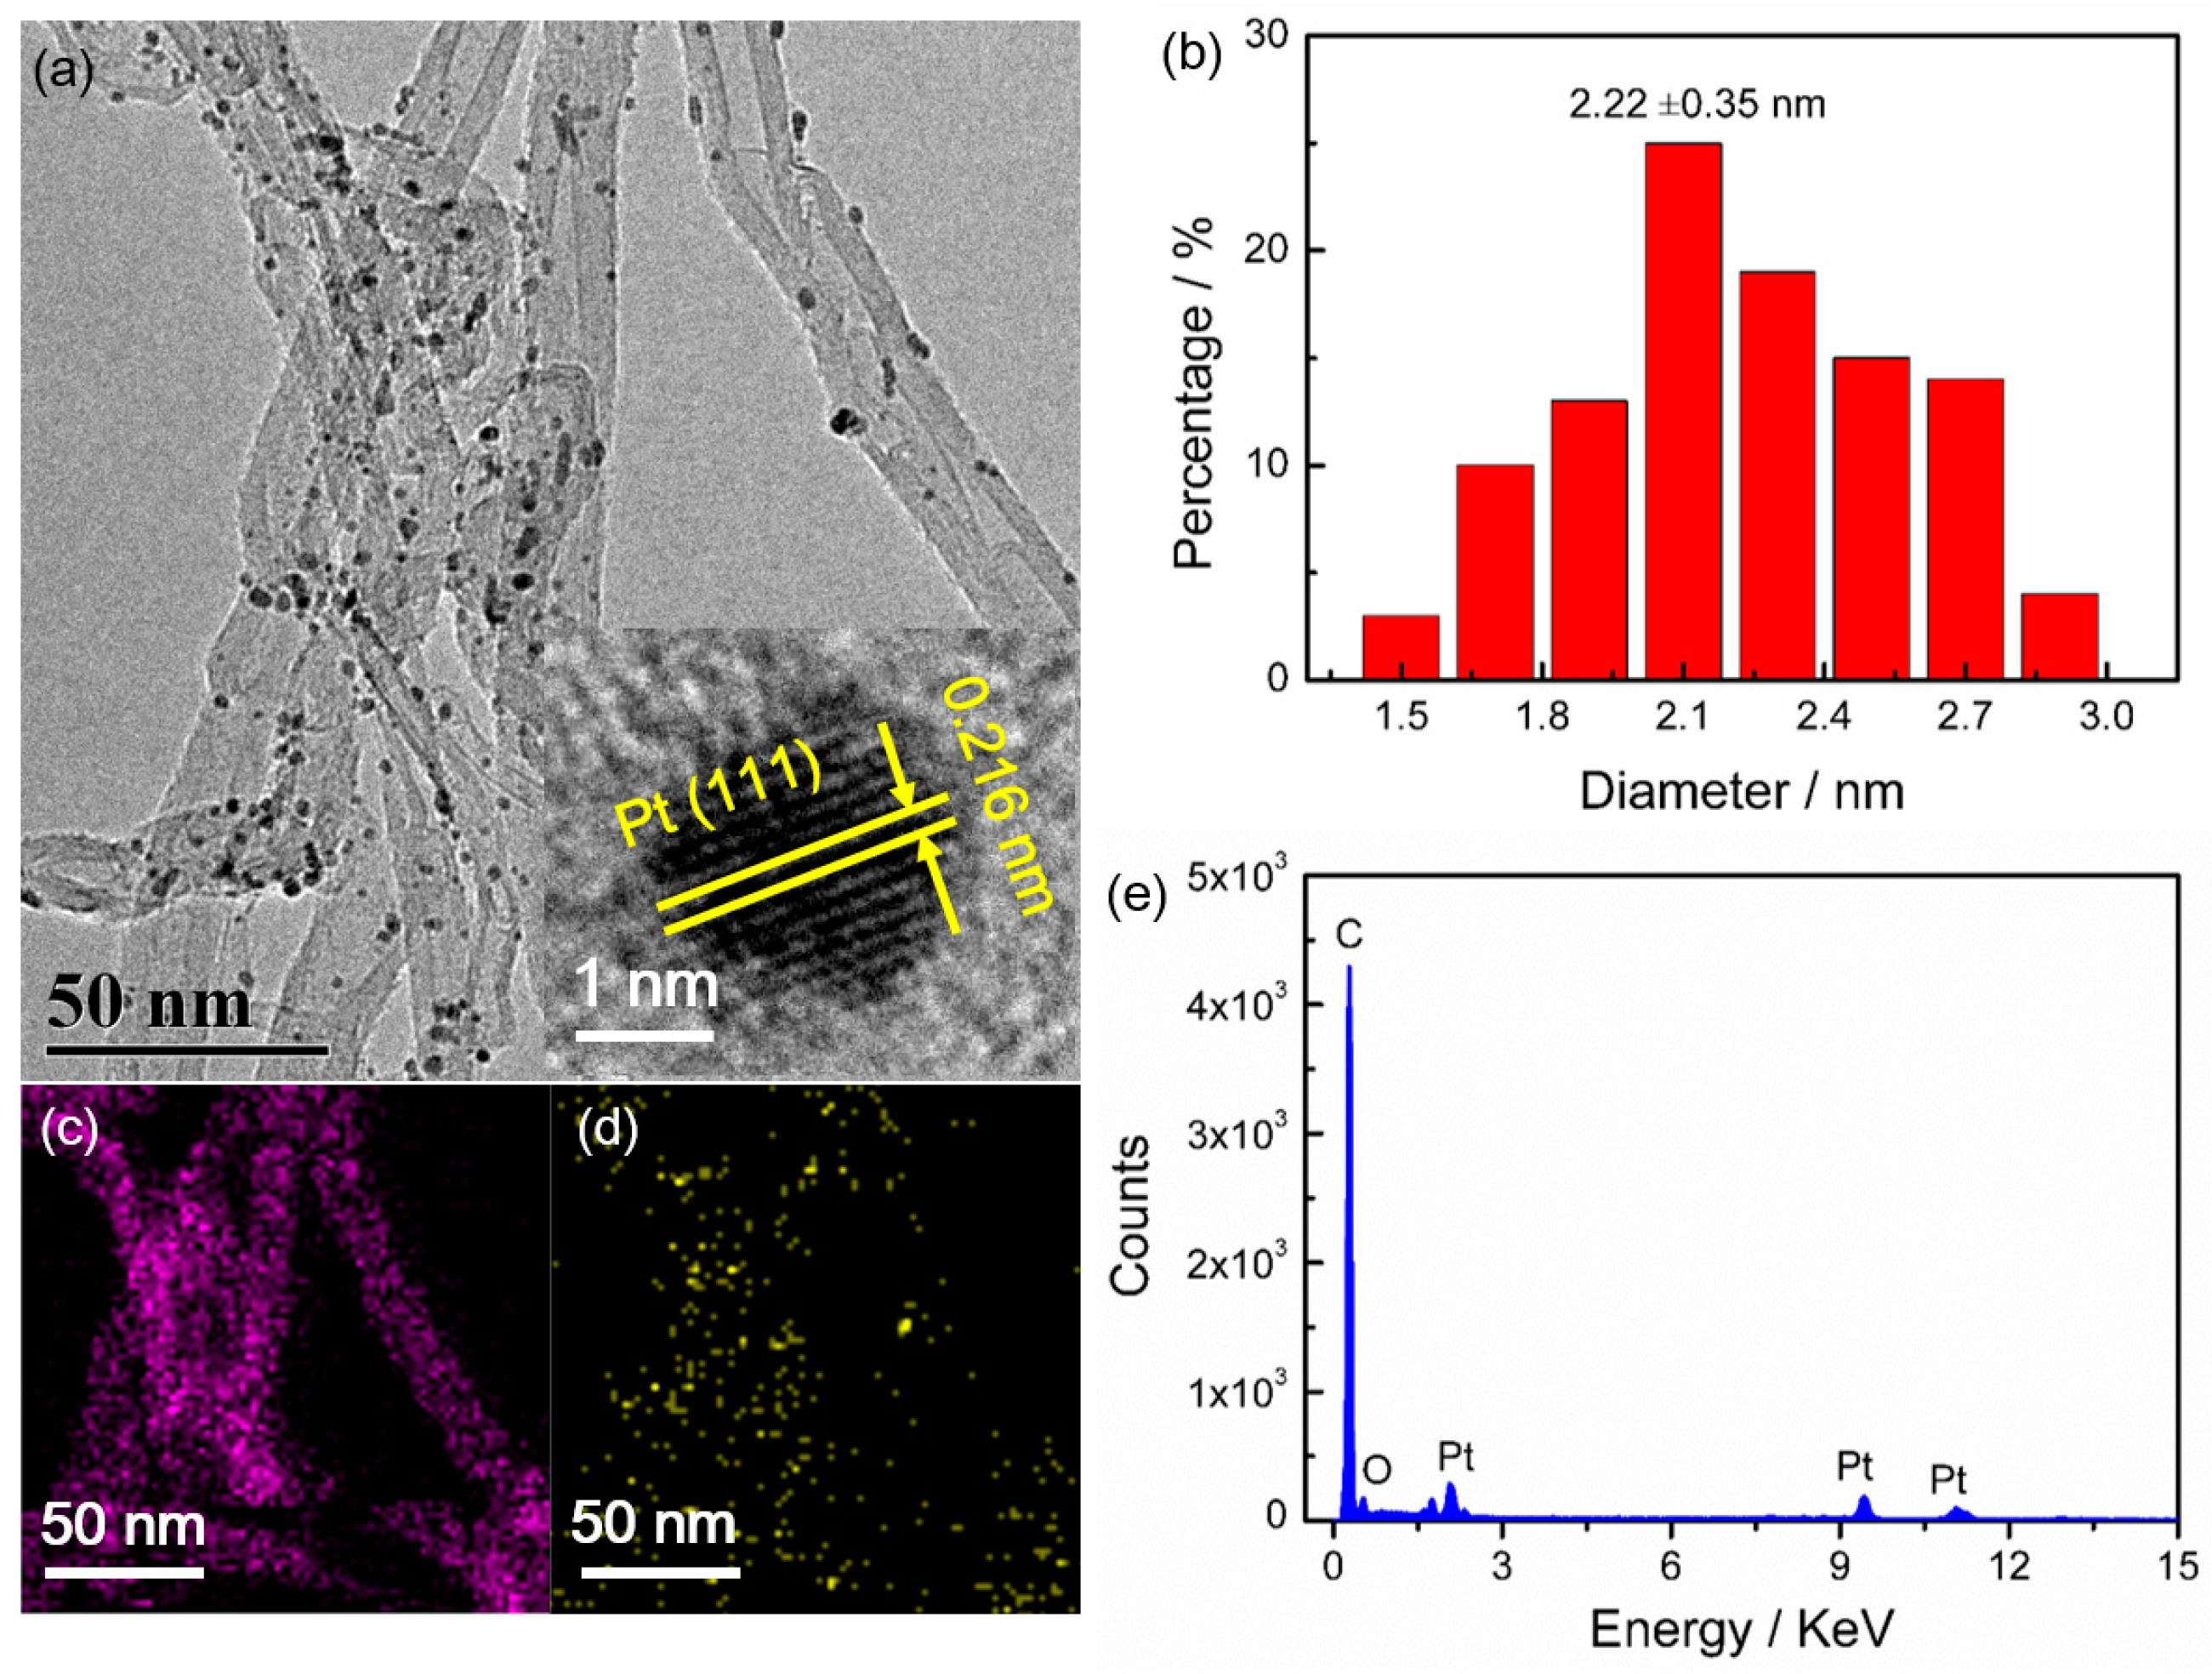
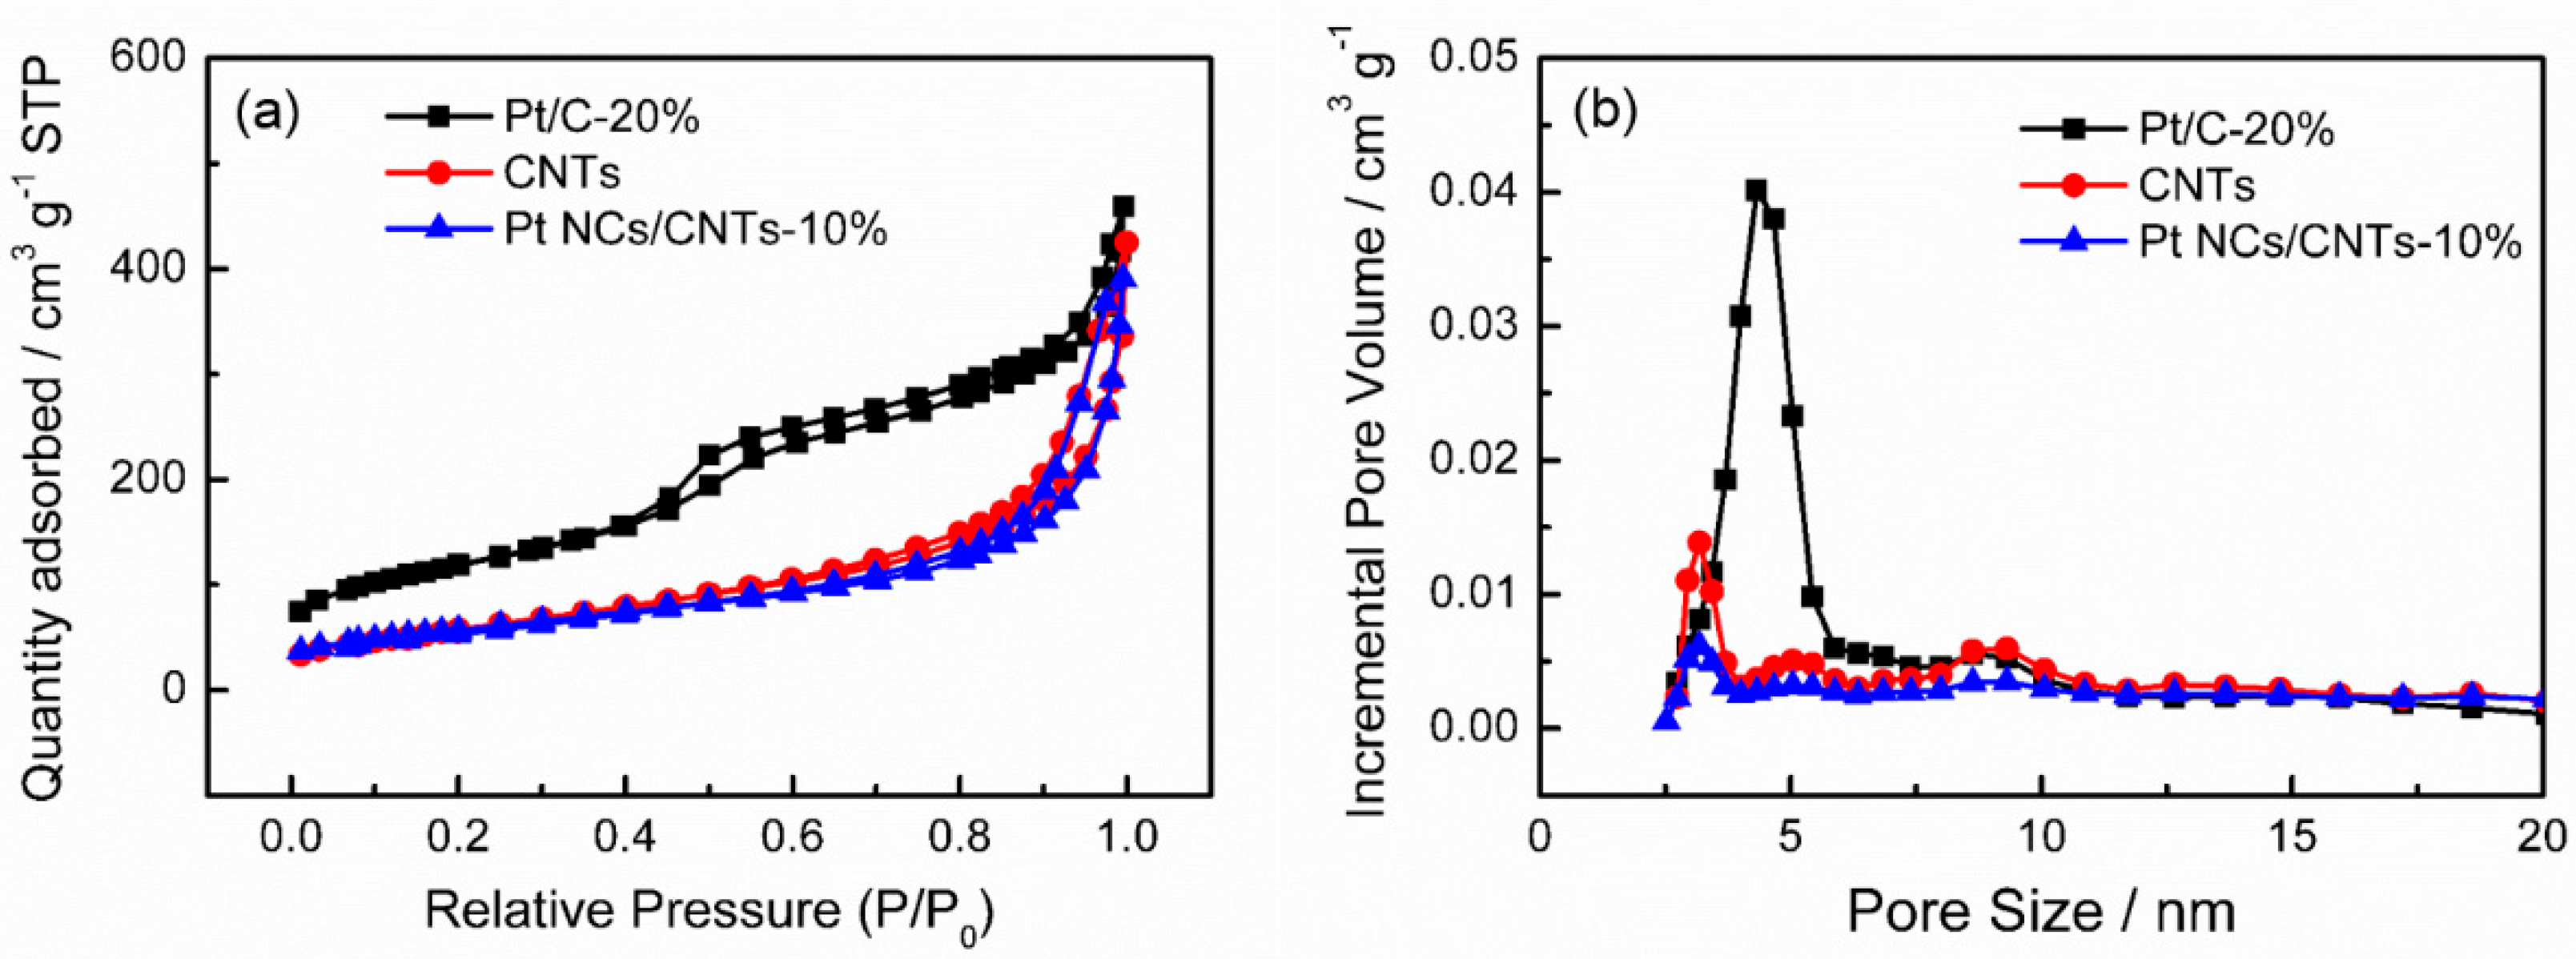
3.1. Physicochemical Characterizations

XRD patterns are conducted to characterize the crystal structure of Pt NCs/CNTs-10%. As depicted in Figure 1, a typical fcc crystal phase is found for Pt NCs/CNTs-10%. The as-prepared Pt NCs/CNTs-10% exhibits the same diffraction patterns as the standard Pt card (JCPDS: 04-0802). The XRD pattern of CNT support displays two peaks at ~25.7° and ~42.5° assigned to the (002) and (100) reflections, respectively [21]. The (002) peak is also clearly observed in the XRD pattern of Pt NCs/CNTs-10%. The (100) peak is weak and overlapped by the diffraction at ~46.2° attributed to the Pt (200) reflection. The mean particle size of Pt NCs is calculated to be 2.4 nm from the Pt (111) diffraction using the Scherrer equation. The geometric surface area of Pt NCs is determined to be 116.8 m2 g−1 from the XRD analysis using the Equation (2):
  s = 6000 ρ d    
where ρ is the density of Pt (21.4 g cm–3) and d/nm is the average particle size determined by the XRD pattern.
Figure 2a shows the representative TEM image of Pt NCs/CNTs-10%. It can be seen that the Pt NCs are uniformly dispersed on CNTs with average diameter size of 2.2 ± 0.35 nm (Figure 2b), which is consistent with the XRD result (2.4 nm). The inset of Figure 1 shows the HRTEM image of the Pt NCs. The Pt (111) surface orientation is determined through investigating the distance between two columns of Pt atoms. The corresponding elemental mapping (Figure 2c,d) and selected-area EDS (Figure 2e) analyses further clearly demonstrate the uniform distribution of Pt NCs on the CNTs. According to the ICP-OES analysis, the Pt mass loading is about 8.7%, which slightly dropped from the theoretical value of 10% probably caused by the limited surface area of CNTs, which is determined to be 253 m2 g–1 according to the N2 absorption/desorption isotherms (Figure 3). The Brunauer-Emmett-Teller (BET) surface area of Pt NCs/CNTs-10% and Pt/C-20% are also carried out, which are determined to be 217 m2 g−1 and 411 m2 g–1, respectively. Obviously, the BET surface area of Pt NCs/CNTs-10% is smaller than that of CNTs, which can be ascribed to the framework shrinkage during the process of preparing the catalyst.
XPS measurement is employed to analyze the chemical states of Pt NCs. The C 1s peak at 284.6 eV is adopted as a reference for the correction of the binding energy positions [22]. As shown in Figure 4a, both C and Pt are detected at their specific binding energy positions. As displayed in Figure 4b, high-resolution XPS spectrum of Pt 4f presents the characteristic peaks of Pt 4f7/2 and Pt 4f5/2 at ~71.4 and ~74.7 eV, respectively, which can be divided into two pairs of doubles. The peaks appeared at ~71.35 and ~74.73 eV are characteristic for metallic Pt0 [23]. The peaks located at 72.12 and 75.68 eV are originated from Pt2+ [24]. Clearly, Pt0 is predominant. Based the deconvoluted XPS, it can be determined that the Pt NCs contain 69% metallic Pt and 31% Pt oxide. In addition, there is a slight shift of the Pt0 peak to higher binding energies, which may be attributed to the strong interactions between Pt NCs and CNTs [25], which are beneficial for improving the stability of Pt NCs/CNTs-10%.

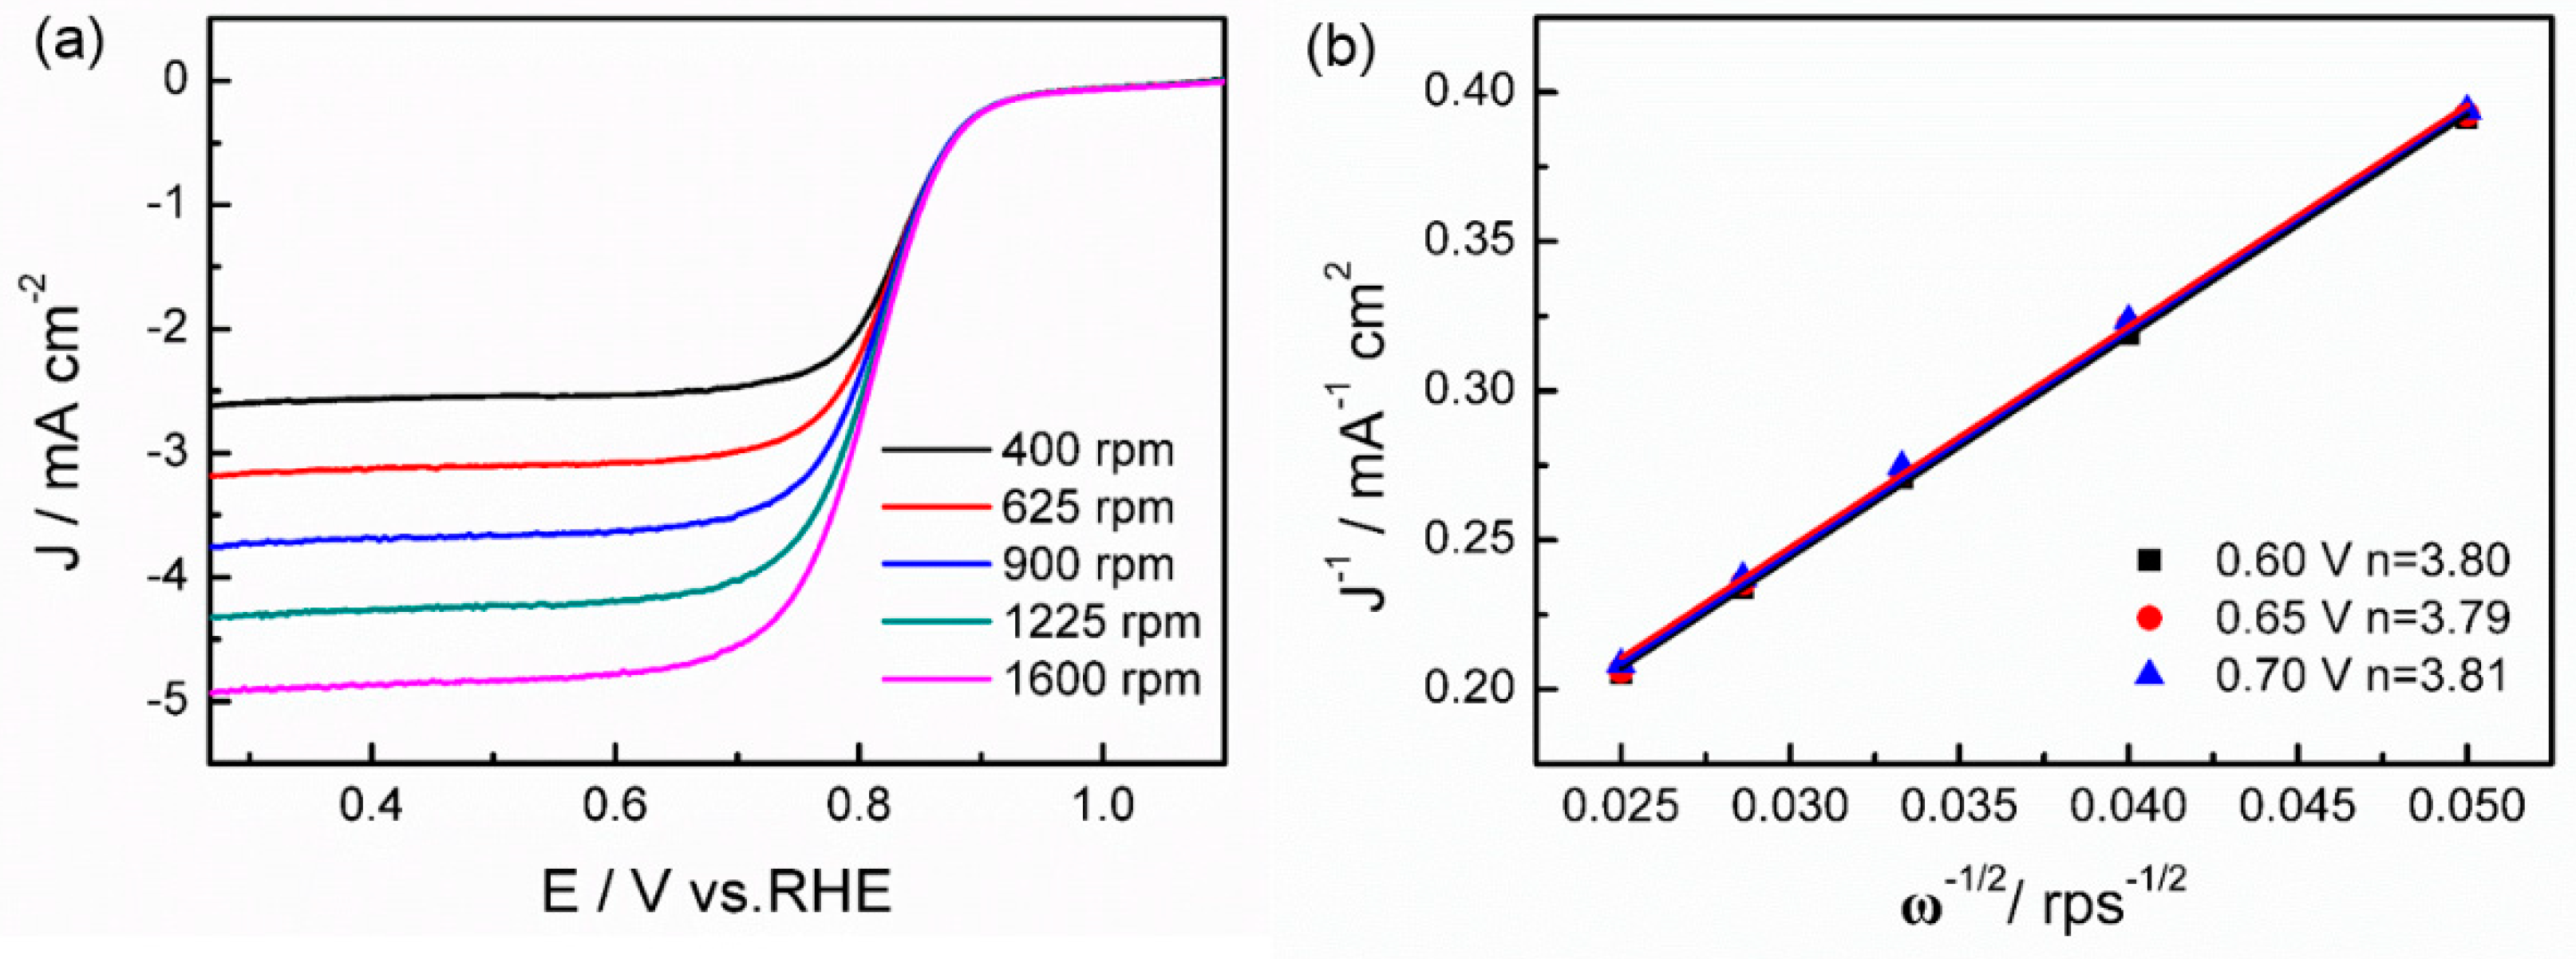
3.2. Electrochemical Evaluation

Figure 5 shows the CVs of Pt NCs/CNTs-10% and Pt/C-20% in Ar-saturated 0.1 M HClO4 solution. A typical hydrogen adsorption/desorption behavior on Pt is clearly observed on both Pt NCs/CNTs-10% and Pt/C-20%. The electrochemical surface area (ECSA, m2 g–1) are calculated using Equation (3):
  ECSA = Q H 0.21 × m P t  
where QH (mC) is the charge due to the hydrogen adsorption in the hydrogen region of the CV. 0.21 (mC cm–2) is the electrical charge associated with monolayer adsorption of hydrogen on Pt. mPt is the Pt loading on working electrode. Results indicate that the ECSA of Pt NCs/CNTs-10% and Pt/C-20% are determined to be 48.23 m2 g–1 and 38.79 m2 g–1, respectively. The higher ECSA of Pt NCs/CNTs-10% can be attributed to the small size and uniform distribution of Pt NCs on the CNTs.
The RDE measurements for ORR are carried out in O2-saturated 0.1 M HClO4 at a potential scan rate of 10 mV s–1. Figure 6a exhibits the liner sweep voltammetry (LSV) curves of CNTs, Pt NCs/CNTs-10% and Pt/C-20% at the rotation rate of 1600 rpm. Obviously, it can be seen that the OMC is inactive for ORR. The diffusion and diffusion-kinetic controlled regions are found for Pt NCs/CNTs-10% and Pt/C-20% in the potentials below 0.65 V and 0.65–0.95 V, respectively. It is worth mentioning that Pt NCs/CNTs-10% possess a higher onset potential (Eonset = 0.87 V) and half-wave potential (E1/2 = 0.83 V) than that of Pt/C-20% (Eonset = 0.86 V and E1/2 = 0.81 V), indicating the higher ORR activity of Pt NCs/CNTs-10%. Furthermore, the ORR diffusion limited current (JL) of Pt NCs/CNTs-10% is higher compared with that measured for Pt/C-20%. Figure 6b presents the tafel plots determined on the basis of the RDE data at 1600 rpm. The slope value for Pt NCs/CNTs-10% is 81 mV decade−1, which is smaller than that of Pt/C-20% (87 mV decade−1), further indicating the more efficient ORR process on Pt NCs/CNTs-10%.
The LSV curves of Pt NCs/CNTs-10% at different rotation speeds are further performed to clarify the ORR pathway. As displayed in Figure 7a, the LSV curves of Pt NCs/CNTs-10% exhibit rotating-speed-dependent current densities. Potential in the diffusion and diffusion-kinetic regions, varying from 0.6 to 0.7 V, was chosen to calculate the values of electron transfer number (n) by Koutecky-Levich (K-L) Equation (4):
  1 J = 1 J K + 1 J L = 1 J K + 1 B ω 1 / 2 = 1 J K + 1 0.62 nFCD 2 / 3 v 1 / 6 ω 1 / 2  
where J, JL, and JK is the measured current, diffusion limited current, and kinetic current, respectively. ω is the electrode rotating rate. B is determined from the slope of the K-L plots. Faraday constant (F) is 96485 C. Diffusion coefficient (D) is 1.9 × 10⁻⁵ cm2 s–1. Kinematic viscosity of the electrolyte (ν) is 0.01 cm2 s–1 and bulk concentration of O2 (C) is 1.2 × 10⁻⁶ mol cm−3. As shown in Figure 7b, the corresponding K-L plots show excellent linearity, indicating the the first-order reaction kinetics. Meanwhile, the slopes of the K-L plots are almost same, suggesting a similar values of n. Based on the K-L slopes, the value of n can be determined to be 3.80 (0.60 V), 3.79 (0.65 V), and 3.81 (0.70 V), respectively. It suggests that Pt NCs/CNTs-10% proceeds dominantly with a preferential 4e pathway, which is beneficial to improve the efficiency of fuel cells.
The SA and MA are important parameters for investigating intrinsic activities of catalysts. Here, the SA and MA of Pt NCs/CNTs-10% and Pt/C-20% are calculated from JK and normalization with the Pt surface area and loading, respectively. The JK is calculated from the mass-transport correction of RDE using Equation (5):
  J K = J L × J J L - J  
As shown in Figure 8, at 0.85 V, the SA over Pt NCs/CNTs-10% (0.482 mA cm–2) is 2.6 times larger than that of Pt/C-20% (0.183 mA cm–2) and the MA (358 mA mg–1) is 4.1 times higher than that of Pt/C-20% (87 mA mg–1 Pt). These values over Pt NCs/CNTs-10% at 0.9 V are calculated to be 0.194 mA cm–2 and 167 mA mg−1 respectively, which are 2.5 and 3.2 times higher than those of Pt/C-20% (0.079 mA cm–2 and 52 mA mg–1). The values of Pt NCs/CNTs-10% are not only superior to that of Pt/C-20%, but also that of most reported Pt-based catalysts as presented in Table 1.
The remarkable ORR activity of Pt NCs/CNTs-10% catalyst can be attributed to the three factors: First, the reduced coordination of Pt NCs as well as the decreased electrophilicity give rise to a corresponding reduction in the activation energy of the dissociative chemisorption of O2, facilitating the 4e transfer process [36]. Second, the unprotected Pt NCs with smaller size and narrower size distribution can provide more active sites and promote the charge transfer during the ORR process. Third, CNTs with graphitic structure exhibit higher electron transfer rate [37]. All these together make the as-prepared Pt NCs/CNTs-10% exhibit more desirable ORR performance.

3.3. Electrochemical Stability and Methanol Tolerance

Besides the ORR activity, the stability of catalysts are also important for the practical application of fuel cells. Here, the stability of Pt NCs/CNTs-10% is performed by chronoamperometric measurement, which is an effective approach to investigate the stability of catalysts [38]. For comparison, Pt/C-20% is also tested as a baseline catalyst. As shown in Figure 9, after chronoamperometric measurement for 2 × 10⁴ s, only ~10% current decrease is observed on Pt NCs/CNTs-10%. However, the value for Pt/C-20% is ~69%, much larger than that of Pt NCs/CNTs-10%, demonstrating a more satisfactory stability of Pt NCs/CNTs-10%. As reported in literatures, the poor stability of Pt/C-20% is mainly derived from the agglomeration of Pt particles [39]. Hence, TEM image of Pt NCs/CNTs-10% after the chronoamperometric measurement is conducted. As shown in Figure 10, no obvious aggregation is observed and the average particle size is determined to be ~2.35 ± 0.41 nm. According to the aforementioned results, we can conclude that the excellent stability of Pt NCs/CNTs-10% may be attributed to the trapping the Pt NCs in the CNTs nano-network as well as the interactions between Pt NCs and CNTs, suppressing the migration, aggregation, and growth in size of the small Pt NCs.
The crossover of methanol from the anode to the cathode can lead to a reduction in cell voltage by ~200–300 mV. There is a competitive reaction between ORR and methanol oxidation on Pt-based cathodes. Therefore, it is highly desirable to develop ORR electrocatalysts with a high methanol tolerance for the application of fuel cells. Figure 11 displays the methanol tolerance of Pt NCs/CNTs-10% and Pt/C-20% evaluated by adding methanol into the electrolyte during the chronoamperometric measurement. It can be seen that the current of Pt/C-20% decreases to 63% after methanol injection. In contrary, only a slight oscillation in the current is observed for Pt NCs/CNTs-10%, suggesting a great methanol tolerance of Pt NCs/CNTs-10%. The methanol oxidation in 0.1 M N2-saturated HClO4 solution containing 0.5 M CH3OH is further performed to analyze the origin of the high methanol tolerance of Pt NCs/CNTs-10%. As depicted in Figure 11b, the methanol oxidation current densities on Pt NCs/CNTs-10% is 11.5 mA cm–2, which is much smaller than that of Pt/C-20% (49.4 mA cm–2) implying that the methanol oxidation on Pt NCs/CNTs-10% is less active than that on Pt/C-20%, which can be attributed to the hindrance of chemisorption of methanol on the catalyst surface. Thus, the high methanol tolerance of the Pt NCs/CNTs-10% can be explained by the preferential adsorption of O2 over methanol on the Pt NCs site.

4. Conclusions

In summary, highly dispersed Pt NCs (~2.2 nm) anchored on CNTs were successfully fabricated through a modified top-down strategy. The Pt NCs/CNTs-10% (Pt loading: 10 wt.%) exhibited superior catalytic activity, stability, and methanol tolerance compared with Pt/C-20%. The enhanced activity of Pt NCs/CNTs-10% is possibly ascribed to the reduced electrophilicity and the decreased coordination of the Pt NCs that lead to a decrease in the activation energy of O2, the smaller size and narrower size distribution of unprotected Pt NCs that provide more active sites, and the graphitic structure of CNTs that can improve the electron transfer rate. The Pt NCs/CNTs-10% would be a promising catalyst for fuel cells.

Author Contributions

F.W. and T.X. conceived and designed the experiments; J.L. performed the major experiments; J.Y. and B.F. performed a part of the measurements; F.W. and J.L. analyzed the data and wrote the manuscript.

Funding

This work is financially supported by the National Natural Science Foundation of China (Grant No. 21503271), the National Key Research and Development Program of China, (Grant No. 2017YFC0110202) and the Foundation of Director of Xinjiang Technical Institute of Physics & Chemistry, Chinese Academy of Sciences, (Grant No. 2016PY005).

Acknowledgments

We sincerely appreciate Yuanhao Wang (Xinjiang Technical Institute of Physics & Chemistry, Chinese Academy of Sciences) for his effective suggestions.

Conflicts of Interest

The authors declare no conflict of interest.

References

  1. Shao, M.; Chang, Q.; Dodelet, J.P.; Chenitz, R. Recent advances in electrocatalysts for oxygen reduction reaction. Chem. Rev. 2016, 116, 3594–3657. [Google Scholar] [CrossRef] [PubMed]
  2. Seh, Z.W.; Kibsgaard, J.; Dickens, C.F.; Chorkendorff, I.; Norskov, J.K.; Jaramillo, T.F. Combining theory and experiment in electrocatalysis: Insights into materials design. Science 2017, 355, 4998–5011. [Google Scholar] [CrossRef] [PubMed]
  3. Debe, M.K. Electrocatalyst approaches and challenges for automotive fuel cells. Nature 2012, 486, 43–51. [Google Scholar] [CrossRef] [PubMed]
  4. Liu, Y.; Mustain, W.E. Structural and electrochemical studies of Pt clusters supported on high-surface-area tungsten carbide for oxygen reduction. ACS Catal. 2011, 1, 212–220. [Google Scholar] [CrossRef]
  5. Zhang, L.; Fischer, J.; Jia, Y.; Yan, X.; Xu, W.; Wang, X.; Chen, J.; Yang, D.; Liu, H.; Zhuang, L.; et al. Coordination of atomic Co-Pt coupling species at carbon defects as active sites for oxygen reduction Reaction. J. Am. Chem. Soc. 2018, 140, 10757–10763. [Google Scholar] [CrossRef] [PubMed]
  6. Gu, W.; Shang, C.; Li, J.; Wang, E. Nitrogen-doped porous carbon matrix derived from metal-organic framework-supported Pt nanoparticles with enhanced oxygen reduction activity. ChemElectroChem 2017, 4, 2814–2818. [Google Scholar] [CrossRef]
  7. Imaoka, T.; Kitazawa, H.; Chun, W.J.; Yamamoto, K. Finding the most catalytically active platinum clusters with low atomicity. Angew. Chem. Int. Ed. 2015, 54, 9810–9815. [Google Scholar] [CrossRef] [PubMed]
  8. Imaoka, T.; Kitazawa, H.; Chun, W.J.; Omura, S.; Albrecht, K.; Yamamoto, K. Magic number Pt13 and misshapen Pt12 clusters: Which one is the better catalyst? J. Am. Chem. Soc. 2013, 135, 13089–13095. [Google Scholar] [CrossRef] [PubMed]
  9. Yamamoto, K.; Imaoka, T.; Chun, W.J.; Enoki, O.; Katoh, H.; Takenaga, M.; Sonoi, A. Size-specific catalytic activity of platinum clusters enhances oxygen reduction reactions. Nat. Chem. 2009, 1, 397–402. [Google Scholar] [CrossRef] [PubMed]
  10. Tiwari, J.N.; Nath, K.; Kumar, S.; Tiwari, R.N.; Kemp, K.C.; Le, N.H.; Youn, D.H.; Lee, J.S.; Kim, K.S. Stable platinum nanoclusters on genomic DNA-graphene oxide with a high oxygen reduction reaction activity. Nat. Commun. 2013, 4, 2221–2227. [Google Scholar] [CrossRef] [PubMed]
  11. Li, D.; Wang, C.; Tripkovic, D.; Sun, S.; Markovic, N.M.; Stamenkovic, V.R. Surfactant removal for colloidal nanoparticles from solution synthesis: The effect on catalytic performance. ACS Catal. 2012, 2, 1358–1362. [Google Scholar] [CrossRef]
  12. Tao, X.; Chikai, L.; Chao, W.; Dale, L.B.; Yasuo, I.; Jun, L. Synthesis of supported platinum nanoparticles from Li-Pt solid solution. J. Am. Chem. Soc. 2010, 132, 2151–2153. [Google Scholar]
  13. Bönnemann, H.; Brinkmann, R.; Kinge, S.; Ely, T.O.; Armand, M. Chloride free Pt- and PtRu-nanoparticles stabilised by “Armand’s Ligand” as precursors for fuel cell catalysts. Fuel Cells 2004, 4, 289–296. [Google Scholar] [CrossRef]
  14. Horacio, J.S.; Carlos, S.; Emilia, M. Friendly Conditions Synthesis of Platinum Nanoparticles Supported on a Conducting Polymer: Methanol Electrooxidation. J. Phys. Chem. C 2007, 111, 12454–12460. [Google Scholar]
  15. Slanac, D.A.; Li, L.; Mayoral, A.; Yacaman, M.J.; Manthiram, A.; Stevenson, K.J.; Johnston, K.P. Atomic resolution structural insights into PdPt nanoparticle-carbon interactions for the design of highly active and stable electrocatalysts. Electrochim. Acta 2012, 64, 35–45. [Google Scholar] [CrossRef]
  16. Gabe, A.; García-Aguilar, J.; Berenguer-Murcia, Á.; Morallón, E.; Cazorla-Amorós, D. Key factors improving oxygen reduction reaction activity in cobalt nanoparticles modified carbon nanotubes. Appl. Catal. B Environ. 2017, 217, 303–312. [Google Scholar] [CrossRef]
  17. Zhu, C.; Fu, S.; Song, J.; Shi, Q.; Su, D.; Engelhard, M.H.; Li, X.; Xiao, D.; Li, D.; Estevez, L.; et al. Self-Assembled Fe-N-Doped Carbon Nanotube Aerogels with Single-Atom Catalyst Feature as High-Efficiency Oxygen Reduction Electrocatalysts. Small 2017, 13, 1603407–1603413. [Google Scholar] [CrossRef] [PubMed]
  18. Yongyong, J.; Panpan, H.; Jun, R.; Zhong, L. Single Atom Catalysis: Concept, Method and Application. Prog. Chem. 2015, 27, 1689–1704. [Google Scholar]
  19. Li, W.; Liang, C.; Qiu, J.; Zhou, W.; Han, H.; Wei, Z.; Sun, G.; Xin, Q. Carbon nanotubes as support for cathode catalyst of a direct methanol fuel cell. Carbon 2002, 40, 787–803. [Google Scholar] [CrossRef]
  20. Shao, Y.; Yin, G.; Gao, Y.; Shi, P. Durability Study of Pt/C and Pt/CNTs Catalysts under Simulated PEM Fuel Cell Conditions. J. Electrochem. Soc. 2006, 153, A1093–A1097. [Google Scholar] [CrossRef]
  21. Rao, C.V.; Cabrera, C.R.; Ishikawa, Y. In Search of the Active Site in Nitrogen-Doped Carbon Nanotube Electrodes for the Oxygen Reduction Reaction. J. Phys. Chem. Lett. 2010, 1, 2622–2627. [Google Scholar] [CrossRef]
  22. Cao, T.; Wang, D.; Zhang, J.; Cao, C.; Li, Y. Bamboo-Like Nitrogen-Doped Carbon Nanotubes with Co Nanoparticles Encapsulated at the Tips: Uniform and Large-Scale Synthesis and High-Performance Electrocatalysts for Oxygen Reduction. Chemistry 2015, 21, 14022–14029. [Google Scholar] [CrossRef] [PubMed]
  23. Liu, Z.; Gan, L.M.; Hong, L.; Chen, W.; Lee, J.Y. Carbon-supported Pt nanoparticles as catalysts for proton exchange membrane fuel cells. J. Power Sources 2005, 139, 73–78. [Google Scholar] [CrossRef]
  24. Kim, K.S.; Winogard, N. X-ray photoelectron spectroscopic studies of nickel-oxygen surfaces using oxygen and argon ion-bombardment. J. Am. Chem. Soc. 1974, 43, 625–643. [Google Scholar] [CrossRef]
  25. Gunji, T.; Saravanan, G.; Tanabe, T.; Tsuda, T.; Miyauchi, M.; Kobayashi, G.; Abe, H.; Matsumoto, F. Long-term, stable, and improved oxygen-reduction performance of titania-supported PtPb nanoparticles. Catal. Sci. Technol. 2014, 4, 1436–1445. [Google Scholar] [CrossRef]
  26. He, W.; Chen, M.; Zou, Z.; Li, Z.; Zhang, X.; Jin, S.-A.; You, D.J.; Pak, C.; Yang, H. Oxygen reduction on Pd3Pt1 bimetallic nanoparticles highly loaded on different carbon supports. Appl. Catal. B Environ. 2010, 97, 347–353. [Google Scholar] [CrossRef]
  27. Xiong, Y.; Xiao, L.; Yang, Y.; DiSalvo, F.J.; Abruña, H.D. High-Loading Intermetallic Pt3Co/C Core-Shell Nanoparticles as Enhanced Activity Electrocatalysts toward the Oxygen Reduction Reaction (ORR). Chem. Mater. 2018, 30, 1532–1539. [Google Scholar] [CrossRef]
  28. Taylor, S.; Fabbri, E.; Levecque, P.; Schmidt, T.J.; Conrad, O. The Effect of Platinum Loading and Surface Morphology on Oxygen Reduction Activity. Electrocatalysis 2016, 7, 287–296. [Google Scholar] [CrossRef] [Green Version]
  29. Fu, S.; Zhu, C.; Song, J.; Zhang, P.; Engelhard, M.H.; Xia, H.; Du, D.; Lin, Y. Low Pt-content ternary PdCuPt nanodendrites: An efficient electrocatalyst for oxygen reduction reaction. Nanoscale 2017, 9, 1279–1284. [Google Scholar] [CrossRef] [PubMed]
  30. Liu, L.; Samjeske, G.; Nagamatsu, S.-I.; Sekizawa, O.; Nagasawa, K.; Takao, S.; Imaizumi, Y.; Yamamoto, T.; Uruga, T.; Iwasawa, Y. Enhanced Oxygen Reduction Reaction Activity and Characterization of Pt-Pd/C Bimetallic Fuel Cell Catalysts with Pt-Enriched Surfaces in Acid Media. J. Phys. Chem. C 2012, 116, 23453–23464. [Google Scholar] [CrossRef]
  31. Hui, Y.; Nicolas, A.; Jean-Michel, L.; Claude, L. Tailoring, Structure, and Activity of Carbon-Supported Nanosized Pt-Cr Alloy Electrocatalysts for Oxygen Reduction in Pure and Methanol-Containing Electrolytes. J. Phys. Chem. B 2004, 108, 1938–1947. [Google Scholar]
  32. Jukk, K.; Kongi, N.; Tammeveski, K.; Solla-Gullón, J.; Feliu, J.M. PdPt alloy nanocubes as electrocatalysts for oxygen reduction reaction in acid media. Electrochem. Commun. 2015, 56, 11–15. [Google Scholar] [CrossRef] [Green Version]
  33. Gaurav, G.; Daniel, A.S.; Pavan, K.; Jaclyn, D.W.; Jeongnam, K.; Ryong, R.; Keith, J.S.; Keith, P.J. Highly Stable Pt/Ordered Graphitic Mesoporous Carbon Electrocatalysts for Oxygen Reduction. J. Phys. Chem. C 2010, 114, 10796–10805. [Google Scholar]
  34. Hussain, S.; Erikson, H.; Kongi, N.; Merisalu, M.; Ritslaid, P.; Sammelselg, V.; Tammeveski, K. Heat-treatment effects on the ORR activity of Pt nanoparticles deposited on multi-walled carbon nanotubes using magnetron sputtering technique. Int. J. Hydrogen Energy 2017, 42, 5958–5970. [Google Scholar] [CrossRef]
  35. Hui, Y.; Walter, V.; Claude, L.; Nicolas, A. Structure and Electrocatalytic Activity of Carbon-Supported Pt-Ni Alloy Nanoparticles toward the Oxygen Reduction Reaction. J. Phys. Chem. B 2004, 208, 11024–11034. [Google Scholar]
  36. Shao, M.; Peles, A.; Shoemaker, K. Electrocatalysis on platinum nanoparticles: Particle size effect on oxygen reduction reaction activity. Nano Lett. 2011, 11, 3714–3719. [Google Scholar] [CrossRef] [PubMed]
  37. Li, L.; Liu, H.; Wang, L.; Yue, S.; Tong, X.; Zaliznyak, T.; Taylor, G.T.; Wong, S.S. Chemical Strategies for Enhancing Activity and Charge Transfer in Ultrathin Pt Nanowires Immobilized onto Nanotube Supports for the Oxygen Reduction Reaction. ACS Appl. Mater. Interfaces 2016, 8, 34280–34294. [Google Scholar] [CrossRef] [PubMed]
  38. Guo, Y.; He, J.; Wang, T.; Xue, H.; Hu, Y.; Li, G.; Tang, J.; Sun, X. Enhanced electrocatalytic activity of platinum supported on nitrogen modified ordered mesoporous carbon. J. Power Sources 2011, 196, 9299–9307. [Google Scholar] [CrossRef]
  39. Zhang, L.; Zheng, N.; Gao, A.; Zhu, C.; Wang, Z.; Wang, Y.; Shi, Z.; Liu, Y. A robust fuel cell cathode catalyst assembled with nitrogen-doped carbon nanohorn and platinum nanoclusters. J. Power Sources 2012, 220, 449–454. [Google Scholar] [CrossRef]
Figure 1. X-ray diffraction (XRD) patterns of the carbon nanotubes (CNTs), Pt NCs/CNTs-10%, and standard bulk Pt.
Nanomaterials 08 00955 g001
Figure 2. (a) Transmission electron microscope (TEM) image; (b) histograms of Pt NCs size distribution; (c) C mapping; (d) Pt mapping and (e) Energy dispersive X-ray spectroscopy (EDS) spectrum of Pt NCs/CNTs-10%.
Nanomaterials 08 00955 g002
Figure 3. (a) N2 adsorption/desorption isotherms and (b) pore size distributions of CNTs, Pt NCs/CNTs-10%, and Pt/C-20%.
Nanomaterials 08 00955 g003
Figure 4. (a) Survey XPS spectrum and (b) Pt 4f spectrum of Pt NCs/CNTs-10%.
Nanomaterials 08 00955 g004
Figure 5. Cyclic voltammograms (CVs) of Pt NCs/CNTs-10% and Pt/C-20% in Ar-saturated 0.1 M HClO4 at 50 mV s−1.
Nanomaterials 08 00955 g005
Figure 6. (a) Comparison of RDE polarization curves of Pt NCs/CNTs-10% and Pt/C-20% at 1600 rpm in O2-saturated 0.1 M HClO4 solution at 10 mV s–1 and (b) Tafel plots for ORR derived from (a).
Nanomaterials 08 00955 g006
Figure 7. (a) RDE polarization curves for ORR on Pt NCs/CNTs-10% at different rotation speeds from 400 to 1600 rpm in O2-saturated 0.1 M HClO4 solution at 10 mV s–1 and (b) Corresponding K-L plot at different potentials.
Nanomaterials 08 00955 g007
Figure 8. Mass activity (MA) and specific activity (SA) of Pt NCs/CNTs-10% and Pt/C-20% in 0.1 M HClO4 at 0.85 V and 0.9 V.
Nanomaterials 08 00955 g008
Figure 9. Relative current-time profiles of Pt NCs/CNTs-10% and Pt/C-20% in 0.1 M O2-saturated HClO4.
Nanomaterials 08 00955 g009
Figure 10. (a) TEM image and (b) size distribution of Pt NCs/CNTs-10% after chronoamperometric measurement for 2 × 10⁴ s in O2-saturated 0.1 M HClO4.
Nanomaterials 08 00955 g010
Figure 11. (a) Chronoamperometric responses of Pt NCs/CNTs-10% and Pt/C-20% in 0.1 M O2-saturated HClO4 before and after addition of methanol; (b) Polarization curves for methanol oxidation on Pt NCs/CNTs-10% and Pt/C-20% catalysts in 0.1 M HClO4 and 0.5 M CH3OH solution saturated with N2 at scan rate of 10 mV s–1.
Nanomaterials 08 00955 g011
Table 1. Comparison of ORR performances for the present Pt NCs/CNTs-10% and the reported Pt-based catalysts in acid solution at 0.9 V. (NA: not available).
ElectroatalystPt LoadingORR PerformancesReferences
MA/mA mg–1SA/mA cm–2
Pt NCs/CNTs8.7 wt.%1670.194This work
Pt1Pd3/OMC18.96 wt.%14.020.034[26]
Pt3Co/C18.1 wt.%3210.501[27]
PtCo/C20 wt.%9.90.016[28]
Pd80Cu6Pt1423.5 wt.%4200.5[29]
Pt-VulcanNA1170.19[30]
Pt-Cr(1:1)/C10 wt.%650.175[31]
Pt nanocubes100 wt.%NA0.113[32]
Pt/GMC22 wt.%1400.208[33]
Pt/MWCNTNA16.90.23[34]
Pt0.65Ni0.35/C17.2 wt.%900.15[35]

