Direct Exfoliation of Natural SiO2-Containing Molybdenite in Isopropanol: A Cost Efficient Solution for Large-Scale Production of MoS2 Nanosheetes

 and
and
Abstract
:
1. Introduction
2. Materials and Methods
2.1. Materials
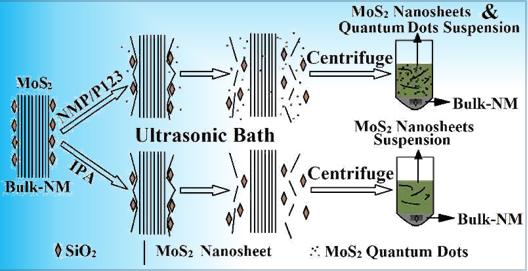
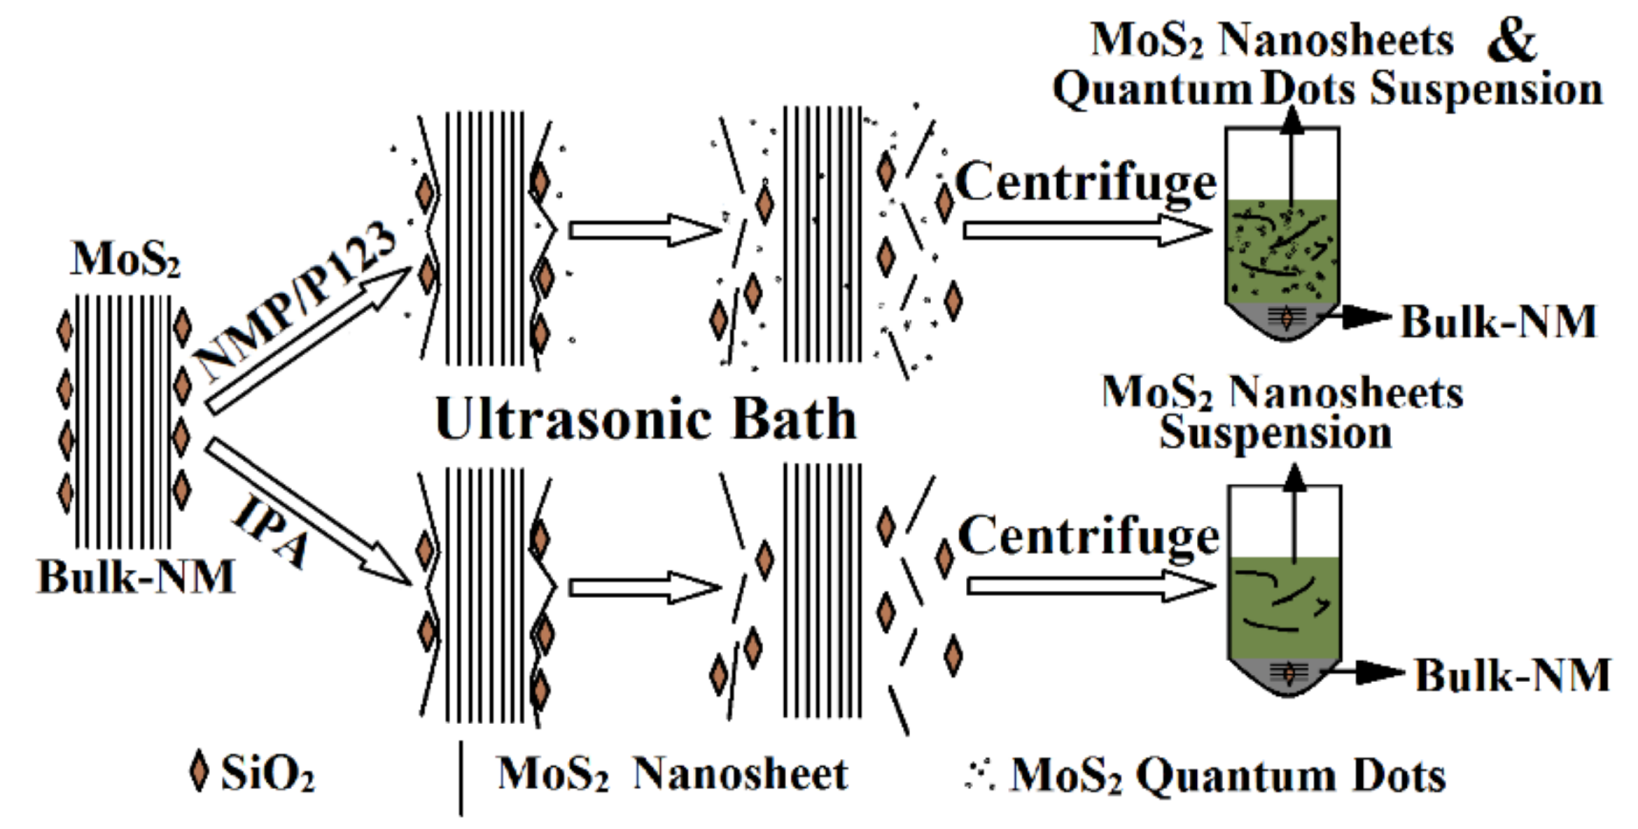
2.2. Exfoliation Process
2.3. Characterization
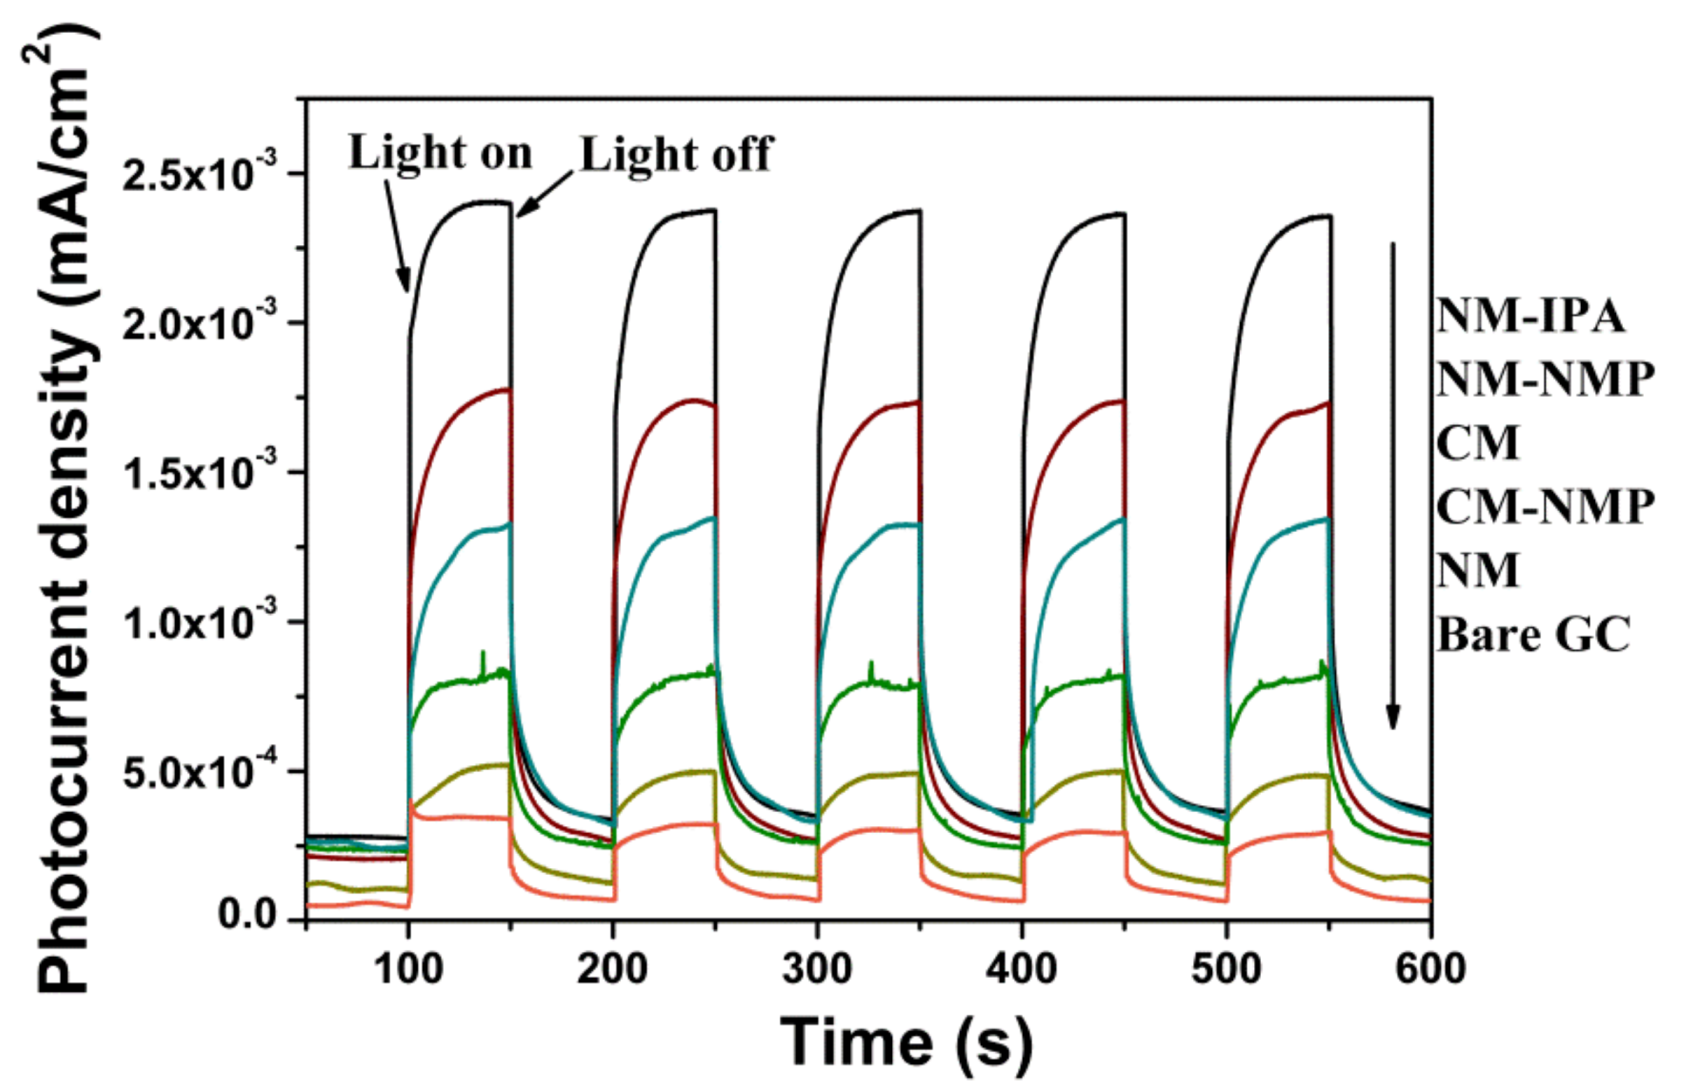
2.4. Photoelectrochemical Measurement
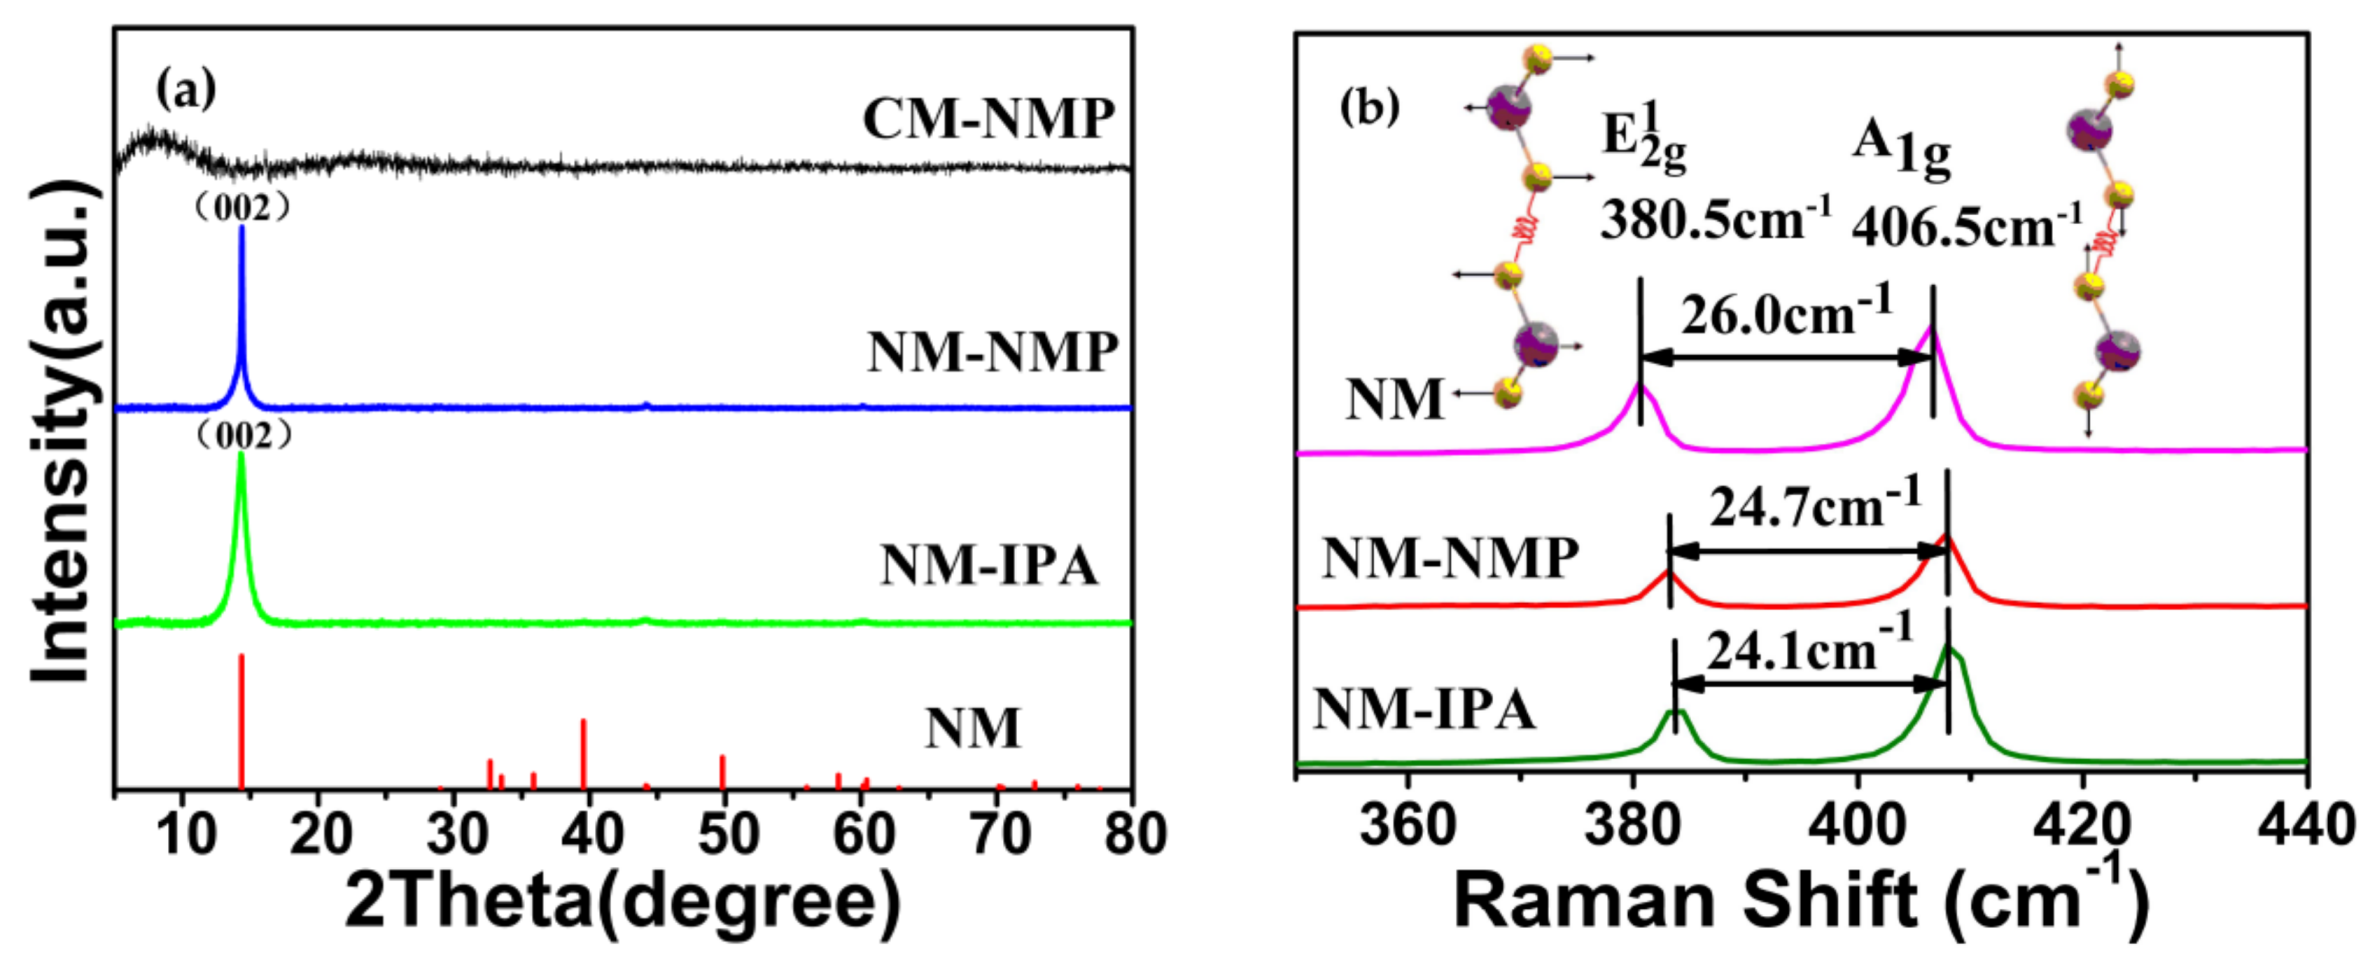
3. Results and Discussion
4. Conclusions
Supplementary Materials
Author Contributions
Funding
Conflicts of Interest
References
- Novoselov, K.S.; Geim, A.K.; Morozov, S.V.; Jiang, D.; Zhang, Y.; Dubonos, S.V.; Grigorieva, I.V.; Firsov, A.A. Electric field effect in atomically thin carbon films. Science 2004, 306, 666–669. [Google Scholar] [CrossRef] [PubMed]
- Tan, C.; Zhang, H. Two-dimensional transition metal dichalcogenide nanosheet-based composites. Chem. Soc. Rev. 2015, 44, 2713–2731. [Google Scholar] [CrossRef] [PubMed]
- Zhang, H. Ultrathin two-dimensional nanomaterials. ACS Nano 2015, 9, 9451–9469. [Google Scholar] [CrossRef] [PubMed]
- Zhang, X.; Lai, Z.C.; Tan, C.L.; Zhang, H. Solution-processed two-dimensional MoS2 nanosheets: preparation, hybridization, and application. Angew. Chem. Int. Ed. 2016, 55, 8816–8838. [Google Scholar] [CrossRef] [PubMed]
- Zhang, M.; Zhu, Y.; Wang, X.; Feng, Q.; Qiao, S.; Wen, W.; Chen, Y.; Cui, M.; Zhang, J.; Cai, C.; et al. Controlled synthesis of ZrS2 monolayer and few layers on hexagonal boron nitride. J. Am. Chem. Soc. 2015, 137, 7051–7054. [Google Scholar] [CrossRef] [PubMed]
- Xia, D.; Gong, F.; Pei, X.D.; Wang, W.B.; Li, H.; Zeng, W.; Wu, M.Q.; Papavassiliou, D.V. Molybdenum and tungsten disulfides-based nanocomposite films for energy storage and conversion: A review. Chem. Eng. J. 2018, 348, 908–928. [Google Scholar] [CrossRef]
- Nguyen, T.P.; Sohn, W.; Oh, J.H.; Jang, H.W.; Kim, S.Y. Size-dependent properties of two-dimensional MoS2 and WS2. J. Phys. Chem. C 2016, 120, 10078–10085. [Google Scholar] [CrossRef]
- Rao, C.N.R.; Gopalakrishnan, K.; Maitra, U. Comparative study of potential applications of graphene, MoS2, and other two-dimensional materials in energy devices, sensors, and related areas. ACS Appl. Mater. Interfaces 2015, 7, 7809–7832. [Google Scholar] [CrossRef] [PubMed]
- Huang, Y.X.; Guo, J.H.; Kang, Y.J.; Ai, Y.; Li, C.M. Two dimensional atomically thin MoS2 nanosheets and their sensing applications. Nanoscale 2015, 7, 19358–19376. [Google Scholar] [CrossRef] [PubMed]
- Xia, S.S.; Wang, Y.R.; Liu, Y.; Wu, C.H.; Wu, M.H.; Zhang, H.J. Ultrathin MoS2 nanosheets tightly anchoring onto nitrogen-doped graphene for enhanced lithium storage properties. Chem. Eng. J. 2018, 332, 431–439. [Google Scholar] [CrossRef]
- Jayabal, S.; Saranya, G.; Wu, J.; Liu, Y.Q.; Geng, D.S.; Meng, X.B. Understanding the high-electrocatalytic performance of two-dimensional MoS2 nanosheets and their composite materials. J. Mater. Chem. A 2017, 5, 24540–24563. [Google Scholar] [CrossRef]
- Yin, Z.; Li, H.; Li, H.; Jiang, L.; Shi, Y.; Sun, Y.; Lu, G.; Zhang, Q.; Chen, X.; Zhang, H. Single-layer MoS2 phototransistors. ACS Nano 2011, 6, 74–80. [Google Scholar] [CrossRef] [PubMed]
- Cunningham, G.; Lotya, M.; Cucinotta, C.S.; Sanvito, S.; Bergin, S.D.; Menzel, R.; Shaffer, M.S.P.; Coleman, J.N. Solvent exfoliation of transition metal dichalcogenides: dispersibility of exfoliated nanosheets varies only weakly between compounds. ACS Nano 2012, 6, 3468–3480. [Google Scholar] [CrossRef] [PubMed]
- Coleman, J.N.; Lotya, M.; O’Neill, A.; Bergin, S.D.; King, P.J.; Khan, U.; Young, K.; Gaucher, A.; De, S.; Smith, R.J.; et al. Two-dimensional nanosheets produced by liquid exfoliation of layered Materials. Science 2011, 331, 568–571. [Google Scholar] [CrossRef] [PubMed]
- Liu, Y.; He, X.; Hanlon, D.; Harvey, A.; Coleman, J.N.; Li, Y. Liquid phase exfoliated MoS2 nanosheets percolated with carbon nanotubes for high volumetric/areal capacity sodium-ion batteries. ACS Nano 2016, 10, 8821–8828. [Google Scholar] [CrossRef] [PubMed]
- Zeng, Z.; Sun, T.; Zhu, J.; Huang, X.; Yin, Z.; Lu, G.; Fan, Z.; Yan, Q.; Hng, H.H.; Zhang, H. An effective method for the fabrication of few-layer-thick inorganic nanosheets. Angew. Chem. Int. Ed. 2012, 51, 9052–9056. [Google Scholar] [CrossRef] [PubMed]
- Paredes, J.I.; Munuera, J.M.; Villar-Rodil, S.; Guardia, L.; Ayán-Varela, M.; Pagán, A.; Aznar-Cervantes, S.D.; Cenis, J.L.; Martínez-Alonso, A.; Tascon, J.M. Impact of covalent functionalization on the aqueous processability, Catalytic Activity, and Biocompatibility of Chemically Exfoliated MoS2 Nanosheets. ACS Appl. Mater. Interfaces 2016, 8, 27974–27986. [Google Scholar] [CrossRef] [PubMed]
- Lee, Y.H.; Zhang, X.Q.; Zhang, W.; Chang, M.T.; Lin, C.T.; Chang, K.D.; Yu, Y.C.; Wang, J.T.W.; Chang, C.S.; Li, L.J.; et al. Synthesis of large-area MoS2 atomic layers with chemical vapor deposition. Adv. Mater. 2012, 24, 2320–2325. [Google Scholar] [CrossRef] [PubMed]
- Najmaei, S.; Liu, Z.; Zhou, W.; Zou, X.; Shi, G.; Lei, S.; Yakobson, B.I.; Idrobo, J.C.; Ajayan, P.M.; Lou, J. Vapour phase growth and grain boundary structure of molybdenum disulphide atomic layers. Nat. Mater. 2013, 12, 754–759. [Google Scholar] [CrossRef] [PubMed] [Green Version]
- Halim, U.; Zheng, C.R.; Chen, Y.; Lin, Z.; Jiang, S.; Cheng, R.; Huang, Y.; Duan, X. A rational design of cosolvent exfoliation of layered materials by directly probing liquid-solid interaction. Nat. Commun. 2013, 4, 3213–3219. [Google Scholar] [CrossRef] [PubMed]
- Carey, B.J.; Daeneke, T.; Nguyen, E.P.; Wang, Y.; Ou, J.Z.; Zhuiykov, S.; Kalantar-zadeh, K. Two solvent grinding sonication method for the synthesis of two-dimensional tungsten disulphide flakes. Chem. Commun. 2015, 51, 3770–3773. [Google Scholar] [CrossRef] [PubMed]
- Shen, J.F.; Wu, J.J.; Wang, M.; Dong, P.; Xu, J.X.; Li, X.G.; Zhang, X.; Yuan, J.H.; Wang, X.F.; Ye, M.X.; et al. Surface tension components based selection of cosolvents for efficient liquid phase exfoliation of 2D materials. Small 2016, 12, 2741–2749. [Google Scholar] [CrossRef] [PubMed]
- Zhou, K.G.; Mao, N.N.; Wang, H.X.; Peng, Y.; Zhang, H.L. A mixed-solvent strategy for efficient exfoliation of inorganic graphene analogues. Angew. Chem. Int. Ed. 2011, 50, 10839–10842. [Google Scholar] [CrossRef] [PubMed]
- Nguyen, E.P.; Carey, B.J.; Daeneke, T.; Ou, J.Z.; Latham, K.; Zhuiykov, S.; Kalantar-zadeh, K. Investigation of two-solvent grinding-assisted liquid phase exfoliation of layered MoS2. Chem. Mater. 2015, 27, 53–59. [Google Scholar] [CrossRef]
- Arrigo, R.; Teresi, R.; Gambarotti, C.; Parisi, F.; Lazzara, G.; Dintcheva, N.T. Sonication-induced modification of carbon nanotubes: effect on the rheological and thermo-oxidative behaviour of polymer-based nanocomposites. Materials 2018, 11, 383. [Google Scholar] [CrossRef] [PubMed]
- Peng, J.; Wu, J.J.; Li, X.T.; Zhou, Y.; Yu, Z.; Guo, Y.Q.; Wu, J.C.; Lin, Y.; Li, Z.J.; Wu, X.J.; et al. Very large-sized transition metal dichalcogenides monolayers from fast exfoliation by manual shaking. J. Am. Chem. Soc. 2017, 139, 9019–9025. [Google Scholar] [CrossRef] [PubMed]
- Wang, Y.; Carey, B.J.; Zhang, W.; Chrimes, A.F.; Chen, L.; Kalantar-zadeh, K.; Ou, J.Z.; Daenekem, T. Intercalated 2D MoS2 utilizing a simulated sun assisted process: reducing the HER overpotential. J. Phys. Chem. C 2016, 120, 2447–2455. [Google Scholar] [CrossRef]
- Mohiuddin, M.; Wang, Y.; Zavabeti, A.; Syed, N.; Datta, R.S.; Ahmed, H.; Daeneke, T.; Russo, S.P.; Rezk, A.R.; Yeo, L.Y.; et al. Liquid phase acoustic wave exfoliation of layered MoS2: critical impact of electric field in efficiency. Chem. Mater. 2018, 30, 5593–5601. [Google Scholar] [CrossRef]
- Savjani, N.; Lewis, E.A.; Pattrick, R.A.D.; Haigh, S.J.; O'Brien, P. MoS2 nanosheet production by the direct exfoliation of molybdenite minerals from several type-localities. RSC Advances 2014, 4, 35609–35613. [Google Scholar] [CrossRef]
- Dong, H.N.; Chen, D.L.; Wang, K.; Zhang, R. High-yield preparation and electrochemical properties of few-Layer MoS2 nanosheets by exfoliating natural molybdenite powders directly via a coupled ultrasonication-milling process, Nanoscale Res. Lett. 2016, 11, 409. [Google Scholar] [CrossRef] [PubMed]
- Wang, T.; Liu, L.; Zhu, Z.; Papakonstantinou, P.; Hu, J.; Liu, H.; Li, M. Enhanced electrocatalytic activity for hydrogen evolution reaction from self-assembled monodispersed molybdenum sulfide nanoparticles on an Au electrode. Energy Environ. Sci. 2013, 6, 625–633. [Google Scholar] [CrossRef]
- Chikan, V.; Kelley, D.F. Size-dependent spectroscopy of MoS2 nanoclusters. J. Phys. Chem. B 2002, 106, 3794–3804. [Google Scholar] [CrossRef]
- Wilcoxon, J.P.; Newcomer, P.P.; Samara, G.A. Synthesis and optical properties of MoS2 and isomorphous nanoclusters in the quantum confinement regime. J. Appl. Phys. 1997, 81, 7934–7944. [Google Scholar] [CrossRef]
- Wilson, J.A.; Yoffe, A.D. The transition metal dichalcogenides discussion and interpretation of the observed optical, electrical and structural properties. Adv. Phys. 1969, 18, 193–335. [Google Scholar] [CrossRef]
- Wilcoxon, J.P.; Samara, G.A. Strong quantum-size effects in a layered semiconductor: MoS2 nanoclusters. Phys. Rev. B 1995, 51, 7299–7302. [Google Scholar] [CrossRef]
- Smith, R.J.; King, P.J.; Lotya, M.; Wirtz, C.; Khan, U.; De, S.; O’Neill, A.; Duesberg, G.S.; Grunlan, J.C.; Moriarty, G.; et al. Large-scale exfoliation of inorganic layered compounds in aqueous surfactant solutions. Adv. Mater. 2011, 23, 3944–3948. [Google Scholar] [CrossRef] [PubMed]
- Li, H.; Zhang, Q.; Yap, C.C.R.; Tay, B.K.; Edwin, T.H.T.; Olivier, A.; Baillargeat, D. From bulk to monolayer MoS2: evolution of Raman scattering. Adv. Funct. Mater. 2012, 22, 1385–1390. [Google Scholar] [CrossRef]
- Li, S.L.; Miyazaki, H.; Song, H.; Kuramochi, H.; Nakaharai, S.; Tsukagoshi, K. Quantitative Raman spectrum and reliable thickness identification for atomic layers on insulating substrates. ACS Nano 2012, 6, 7381–7388. [Google Scholar] [CrossRef] [PubMed]
- Yao, Y.G.; Lin, Z.Y.; Li, Z.; Song, X.J.; Moona, K.S.; Wong, C.P. Large-scale production of two-dimensional nanosheets. J. Mater. Chem. 2012, 22, 13494–13499. [Google Scholar] [CrossRef]
- Gopalakrishnan, D.; Damien, D.; Shaijumon, M.M. MoS2 quantum dot-interspersed exfoliated MoS2 Nanosheets. ACS Nano 2014, 8, 5297–5303. [Google Scholar] [CrossRef] [PubMed]
- Shen, J.; He, Y.; Wu, J.; Gao, C.; Keyshar, K.; Zhang, X.; Yang, Y.; Ye, M.; Vajtai, R.; Lou, J.; et al. Liquid phase exfoliation of two-dimensional materials by directly probing and matching surface tension components. Nano Lett. 2015, 15, 5449–5454. [Google Scholar] [CrossRef] [PubMed]
- Nicolosi, V.; Chhowalla, M.; Kanatzidis, M.G.; Strano, M.S.; Coleman, J.N. Liquid exfoliation of layered materials. Science 2013, 340, 1421–1439. [Google Scholar] [CrossRef]
- Splendiani, A.; Sun, L.; Zhang, Y.B.; Li, T.S.; Kim, J.; Chim, C.Y.; Galli, G.; Wang, F. Emerging photoluminescence in Monolayer MoS2. Nano Lett. 2010, 10, 1271–1275. [Google Scholar] [CrossRef] [PubMed]
- Chen, Z.; Forman, A.J.; Jaramillo, T.F. Bridging the gap between bulk and nanostructured photoelectrodes: the impact of surface states on the electrocatalytic and photoelectrochemical properties of MoS2. J. Phys. Chem.C 2013, 117, 9713–9722. [Google Scholar] [CrossRef]


| NM-NMP | NM-P123 | NM-IPA | CM-NMP | CM-P123 | CM-IPA | |
|---|---|---|---|---|---|---|
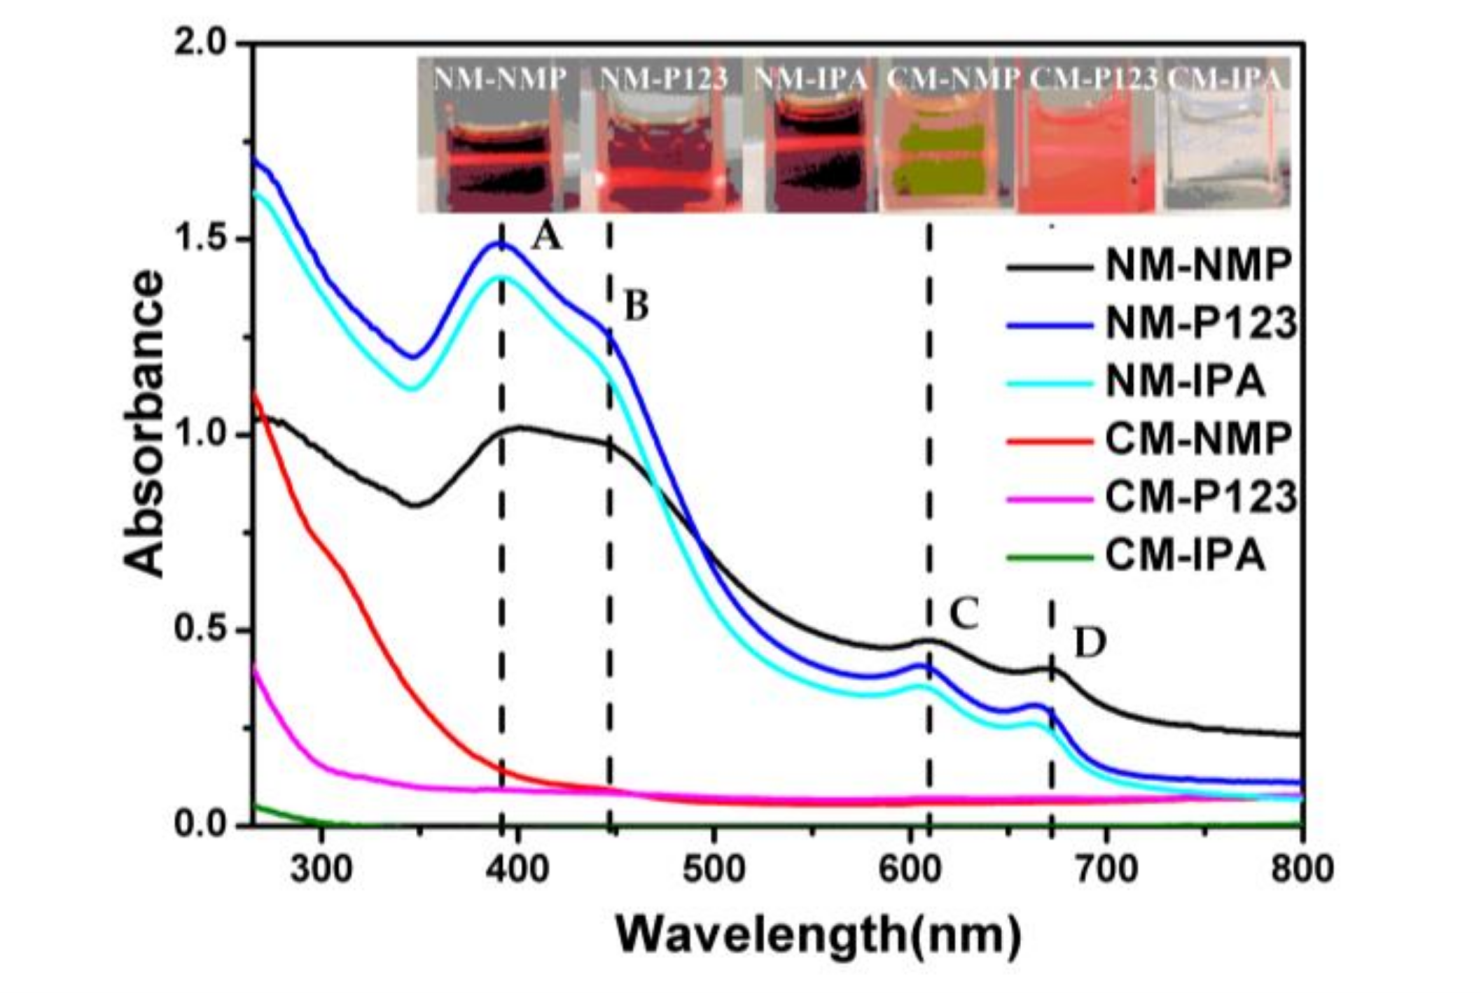
| Concentration of MoS2 (mg/L) | 485 | 596 | 252 | 239 | 485 | ―1 |
| Morphology of MoS2 | Nanosheets & quantum dots | Nanosheets & quantum dots | Nanosheets | quantum dots | Nanosheets & quantum dots | ―1 |
© 2018 by the authors. Licensee MDPI, Basel, Switzerland. This article is an open access article distributed under the terms and conditions of the Creative Commons Attribution (CC BY) license (http://creativecommons.org/licenses/by/4.0/).
Share and Cite
Zhao, W.; Jiang, T.; Shan, Y.; Ding, H.; Shi, J.; Chu, H.; Lu, A. Direct Exfoliation of Natural SiO2-Containing Molybdenite in Isopropanol: A Cost Efficient Solution for Large-Scale Production of MoS2 Nanosheetes. Nanomaterials 2018, 8, 843. https://doi.org/10.3390/nano8100843
Zhao W, Jiang T, Shan Y, Ding H, Shi J, Chu H, Lu A. Direct Exfoliation of Natural SiO2-Containing Molybdenite in Isopropanol: A Cost Efficient Solution for Large-Scale Production of MoS2 Nanosheetes. Nanomaterials. 2018; 8(10):843. https://doi.org/10.3390/nano8100843
Chicago/Turabian StyleZhao, Wenyan, Tao Jiang, Yujie Shan, Hongrui Ding, Junxian Shi, Haibin Chu, and Anhuai Lu. 2018. "Direct Exfoliation of Natural SiO2-Containing Molybdenite in Isopropanol: A Cost Efficient Solution for Large-Scale Production of MoS2 Nanosheetes" Nanomaterials 8, no. 10: 843. https://doi.org/10.3390/nano8100843