
Toxicity Testing of Pristine and Aged Silver Nanoparticles in Real Wastewaters Using Bioluminescent Pseudomonas putida


Abstract
:1. Introduction
2. Results
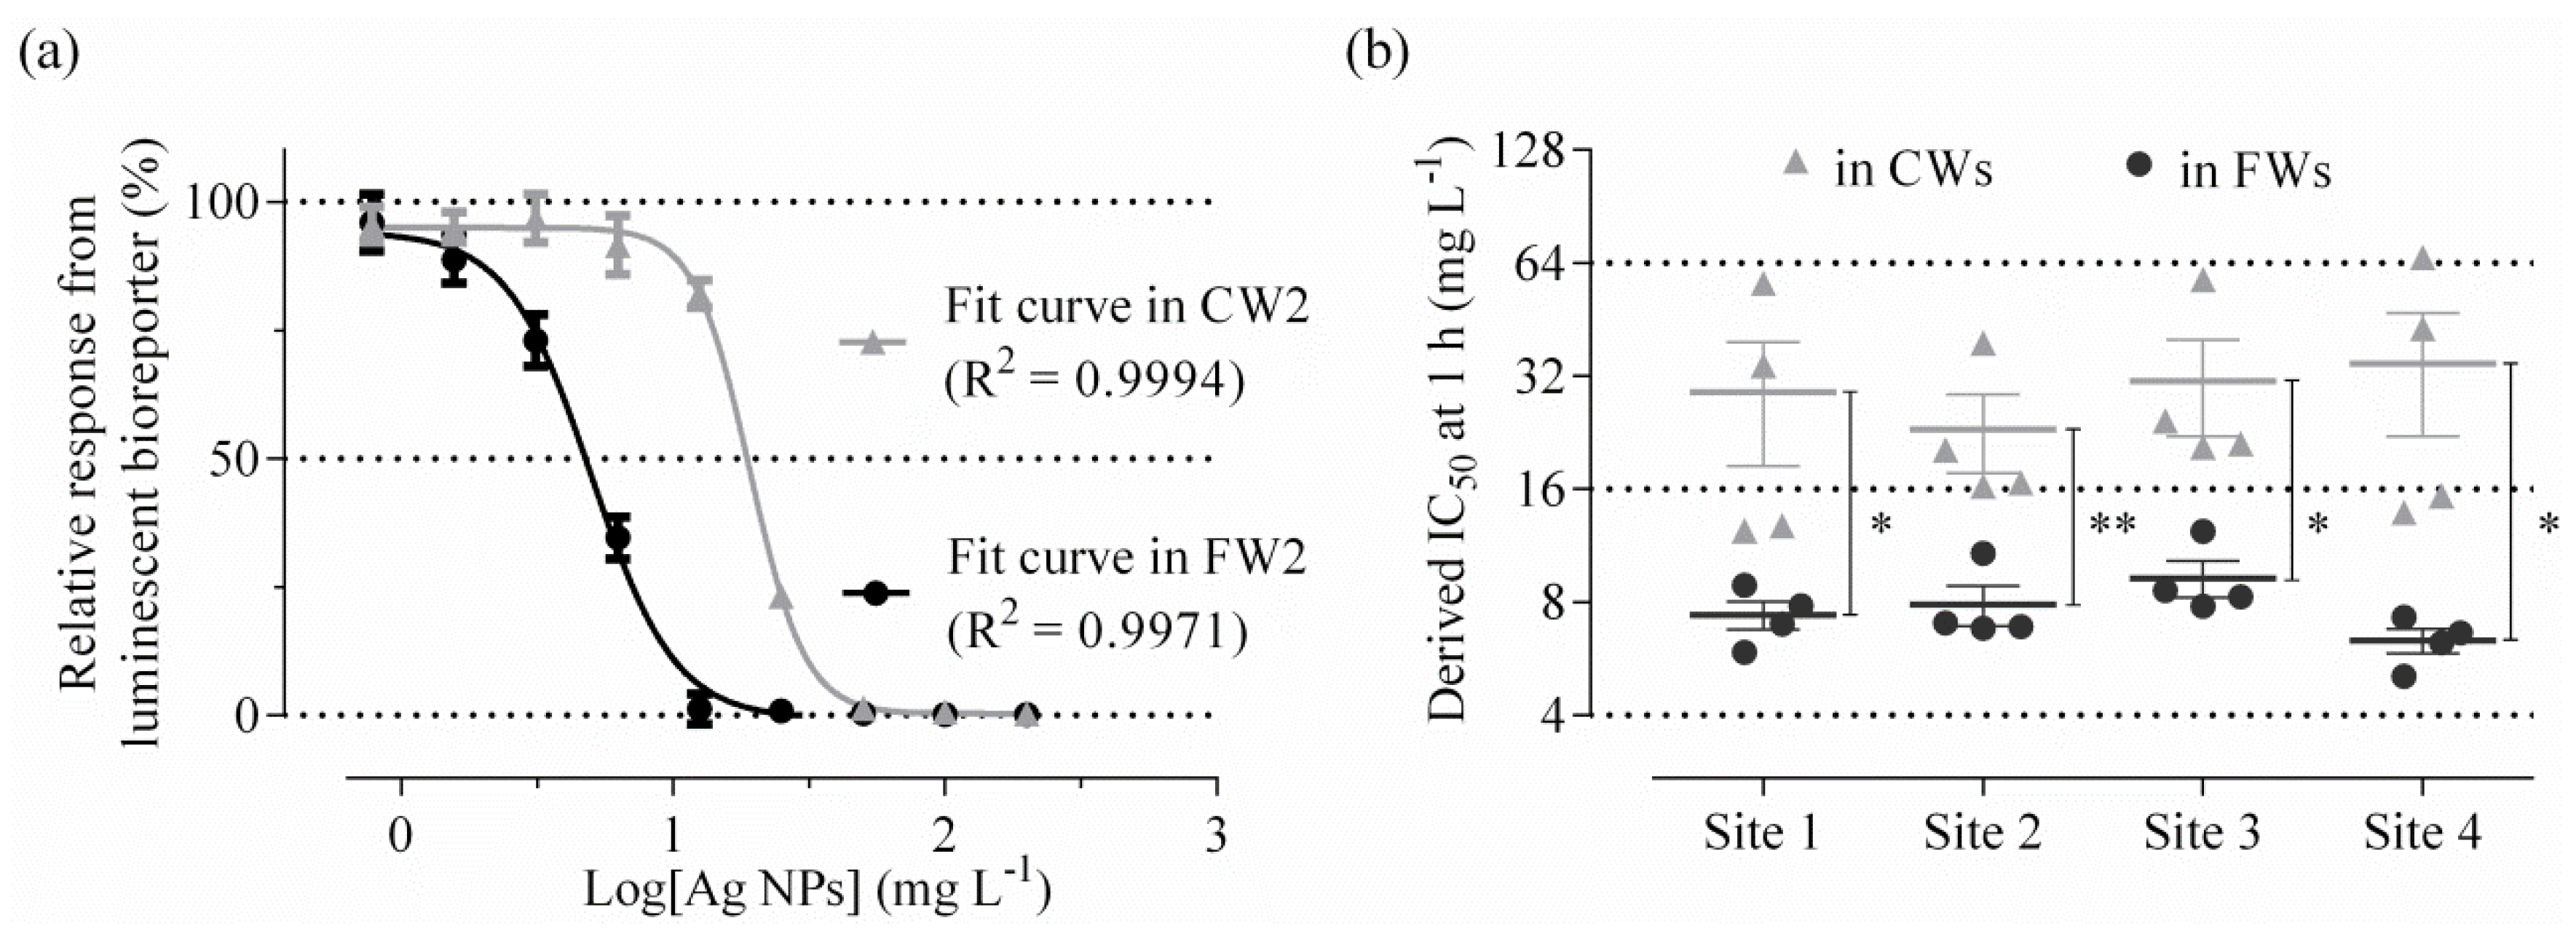
2.1. Acute Testing Using Freshly Added Ag NPs
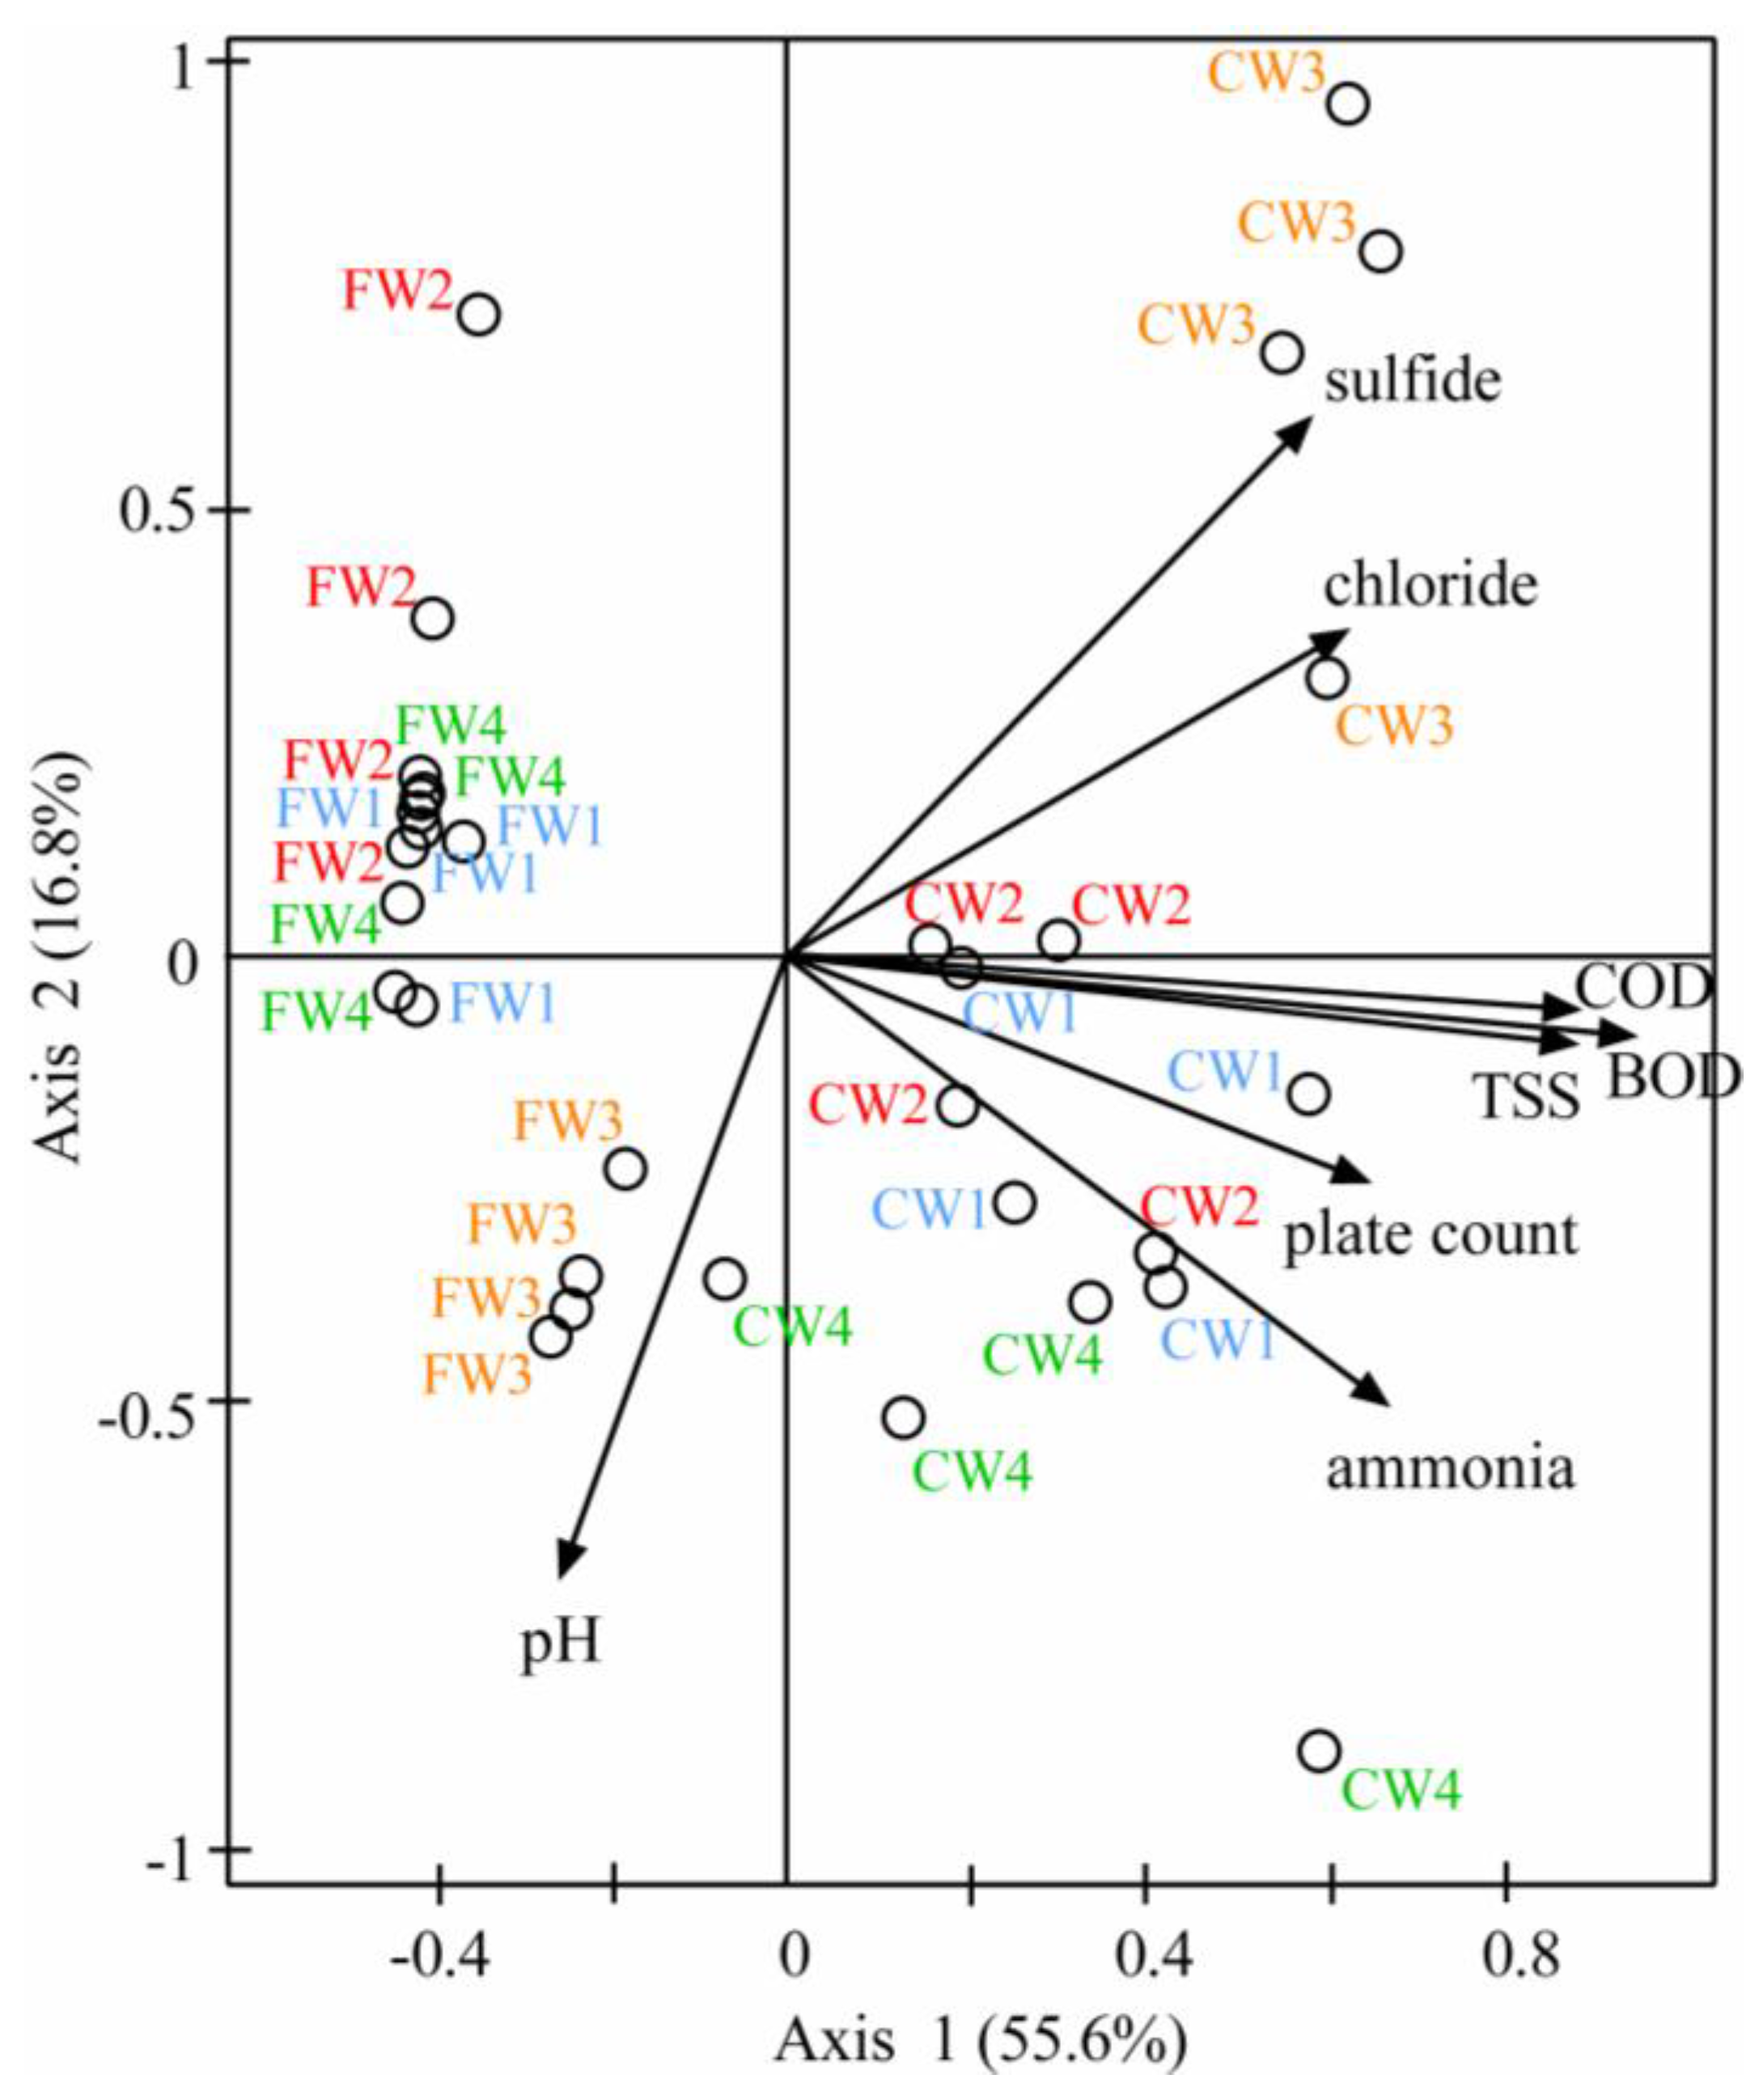
2.2. Wastewater Characterisation and Multivariate Analysis
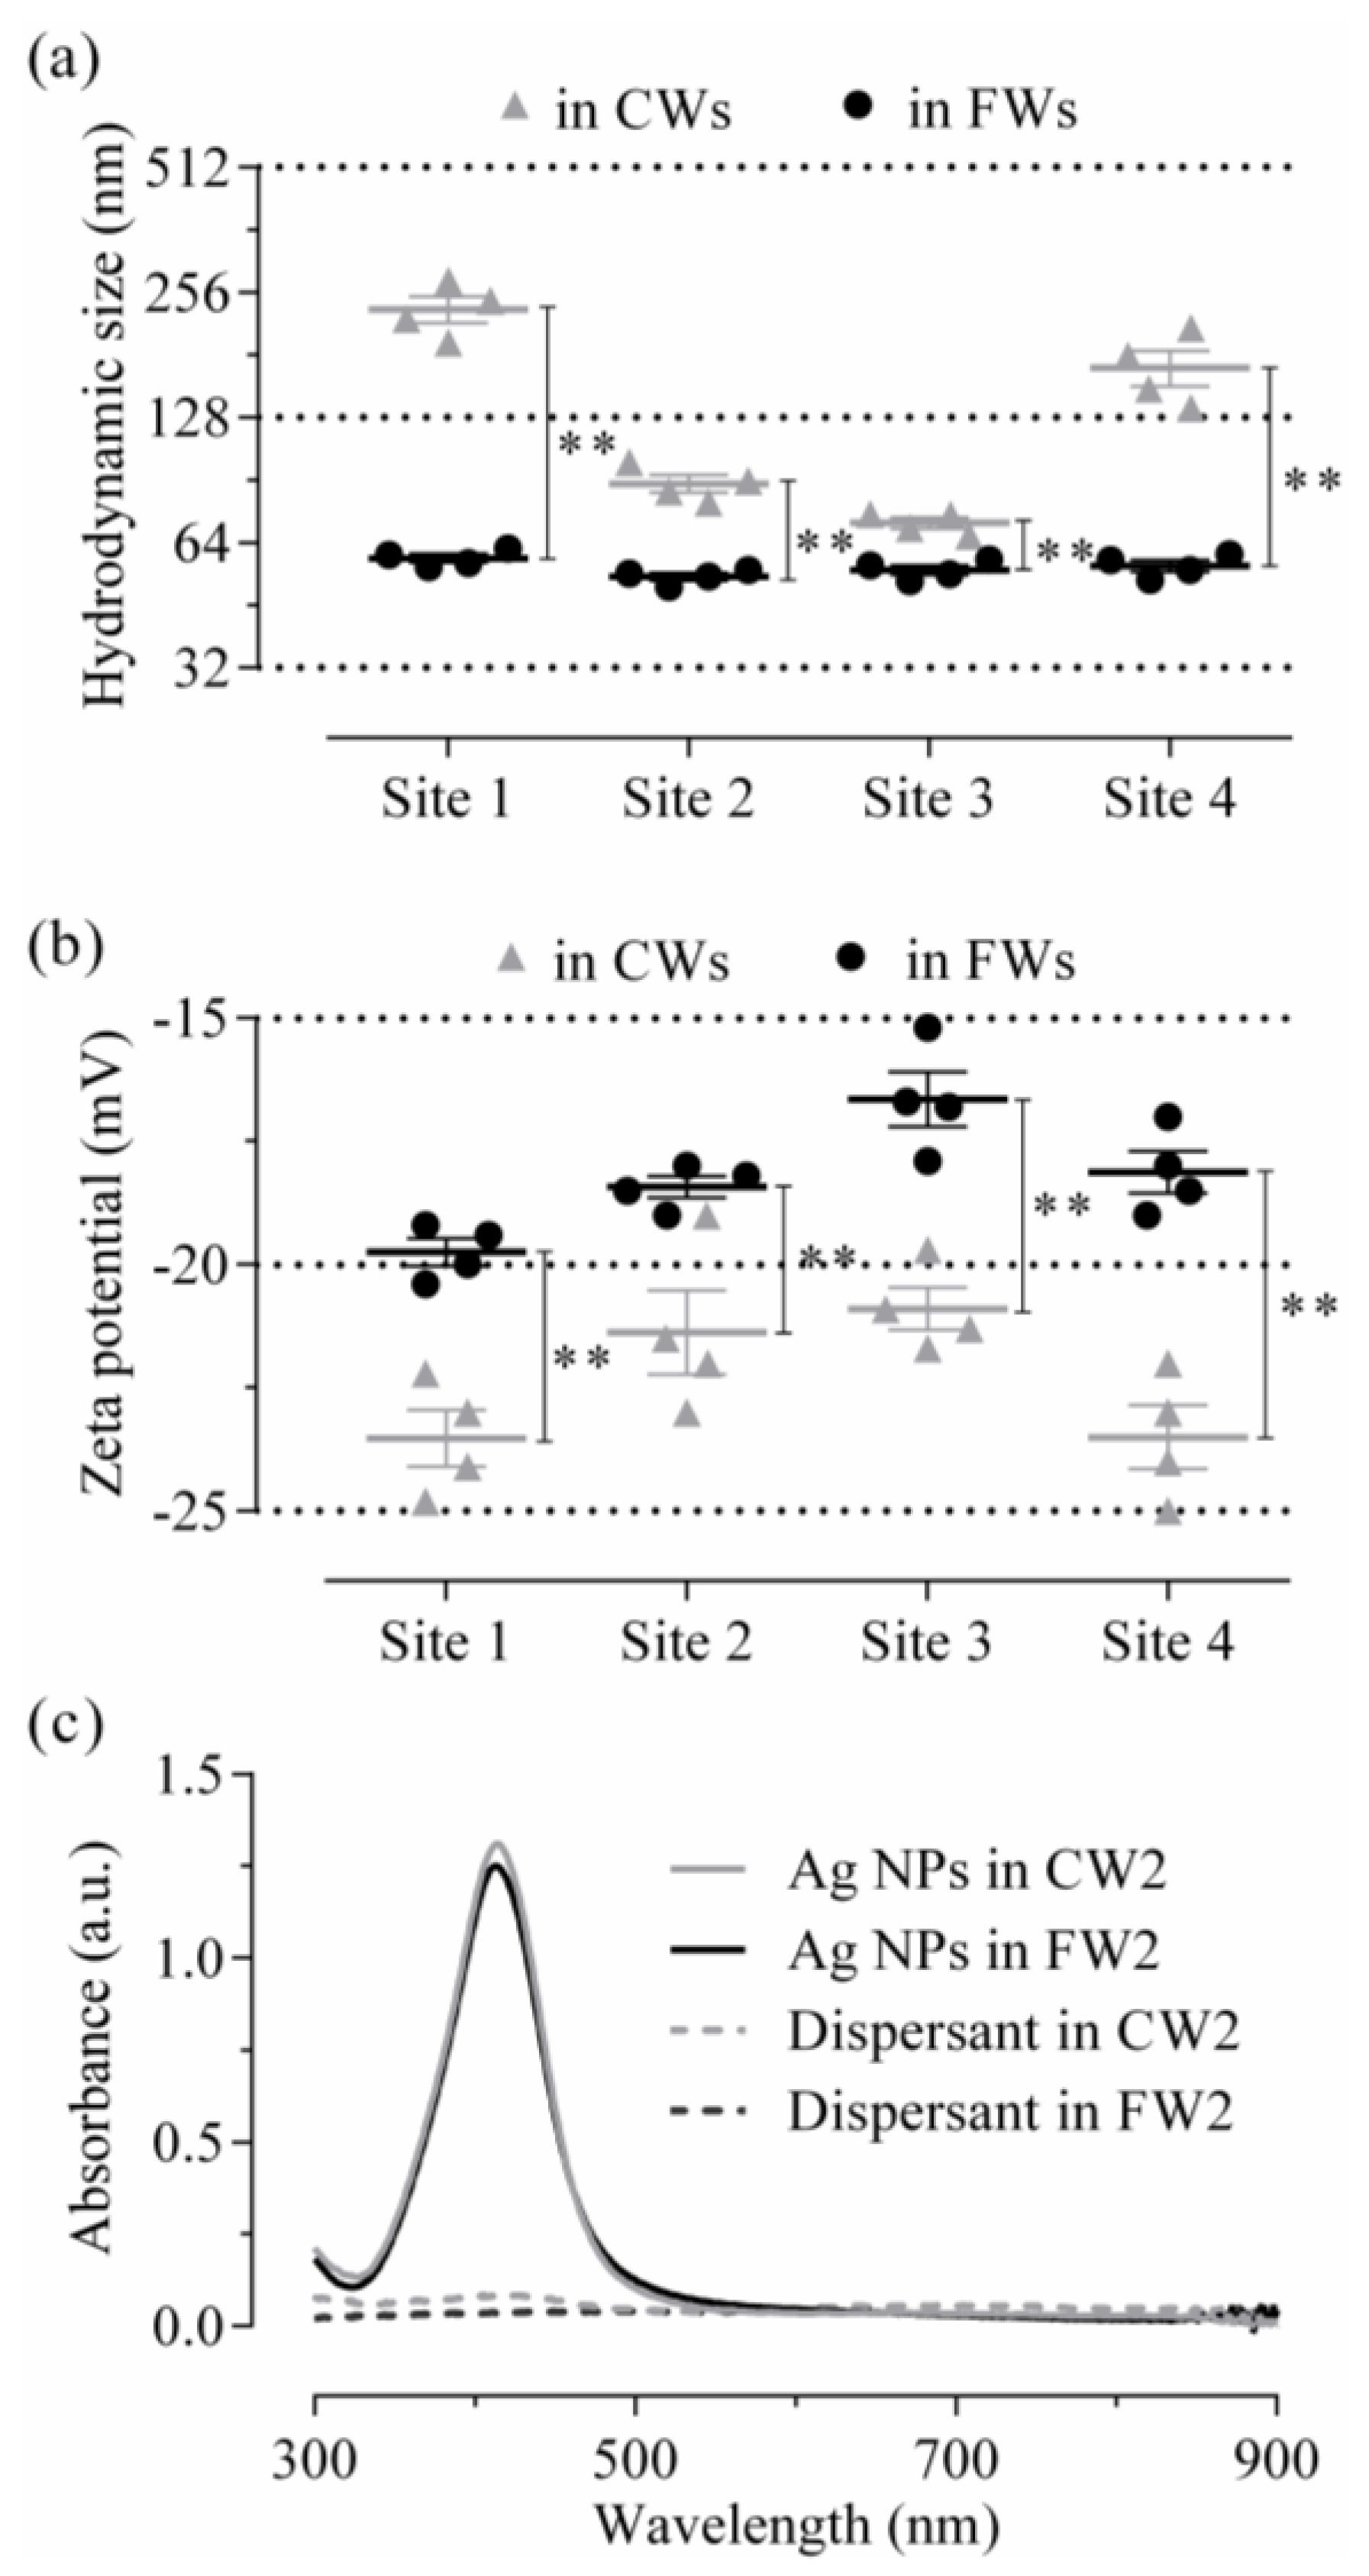
2.3. Freshly Added Ag NP Characterization
2.4. Impact of Aging
3. Discussion
3.1. Toxicity of Pristine Ag NPs in CWs and FWs
3.2. Comparative Toxicity of Aged Ag NPs
3.3. Relevance and Future Work
4. Materials and Methods
4.1. Materials
4.2. Methods
4.2.1. Acute Testing Using Freshly Added Ag NPs
4.2.2. Characterization of the Matrices
4.2.3. Characterization of the Ag NPs
4.2.4. Impact of Aging
4.2.5. Data Analyses
5. Conclusions
- Ag NPs exhibited ion based toxicity above the mg·L−1 range in all wastewater samples with toxicity patterns occurring at significantly lower concentrations in FWs compared to CWs;
- the impact of the wastewater composition on toxicity was driven by related BOD, COD, TSS, bacterial plate count, ammonia, chloride and sulfide loadings, which were all significantly more abundant in CWs;
- no significant site (i.e., WWTP) effect was observed on Ag NP toxicity despite clear differences in the physico-chemical characteristics between FWs and CWs; and
- Ag NP toxicity decreased significantly with aging in CWs due to occurring aggregation and complexation phenomena, but not in FWs.
Supplementary Materials
Acknowledgments
Author Contributions
Conflicts of Interest
References
- Ju-Nam, Y.; Lead, J.R. Manufactured nanoparticles: An overview of their chemistry, interactions and potential environmental implications. Sci. Total Environ. 2008, 400, 396–414. [Google Scholar] [CrossRef] [PubMed]
- Miller, K.P.; Wang, L.; Benicewicz, B.C.; Decho, A.W. Inorganic nanoparticles engineered to attack bacteria. Chem. Soc. Rev. 2015, 44, 7787–7807. [Google Scholar] [CrossRef] [PubMed]
- Juganson, K.; Ivask, A.; Blinova, I.; Mortimer, M.; Kahru, A. NanoE-Tox: New and in-depth database concerning ecotoxicity of nanomaterials. Beilstein J. Nanotechnol. 2015, 6, 1788–1804. [Google Scholar] [CrossRef] [PubMed]
- Yang, Y.; Westerhoff, P. Presence in, and release of, nanomaterials from consumer products. In Nanomaterial: Impacts on Cell Biology and Medicine; Capto, D., Chen, Y., Eds.; Springer Netherlands: Berlin, Germany, 2014; Volume 811, pp. 1–17. [Google Scholar]
- Marcoux, M.A.; Matias, M.; Olivier, F.; Keck, G. Review and prospect of emerging contaminants in waste—Key issues and challenges linked to their presence in waste treatment schemes: General aspects and focus on nanoparticles. Waste Manag. 2013, 33, 2147–2156. [Google Scholar] [CrossRef] [PubMed]
- Gottschalk, F.; Kost, E.; Nowack, B. Engineered nanomaterials in water and soils: A risk quantification based on probabilistic exposure and effect modeling. Environ. Toxicol. Chem. 2013, 32, 1278–1287. [Google Scholar] [CrossRef] [PubMed]
- Von der Kammer, F.; Ferguson, P.L.; Holden, P.A.; Masion, A.; Rogers, K.R.; Klaine, S.J.; Koelmans, A.A.; Horne, N.; Unrine, J.M. Analysis of engineered nanomaterials in complex matrices (environment and biota): General considerations and conceptual case studies. Environ. Toxicol. Chem. 2012, 31, 32–49. [Google Scholar] [CrossRef] [PubMed]
- Handy, R.D.; van den Brink, N.; Chappell, M.; Muehling, M.; Behra, R.; Dusinska, M.; Simpson, P.; Ahtiainen, J.; Jha, A.N.; Seiter, J.; et al. Practical considerations for conducting ecotoxicity test methods with manufactured nanomaterials: What have we learnt so far? Ecotoxicology 2012, 21, 933–972. [Google Scholar] [CrossRef] [PubMed]
- Eduok, S.; Martin, B.; Villa, R.; Nocker, A.; Jefferson, B.; Coulon, F. Evaluation of engineered nanoparticle toxic effect on wastewater microorganisms: Current status and challenges. Ecotoxicol. Environ. Saf. 2013, 95, 1–9. [Google Scholar] [CrossRef] [PubMed]
- Duester, L.; Burkhardt, M.; Gutleb, A.C.; Kaegi, R.; Macken, A.; Meermann, B.; von der Kammer, F. Toward a comprehensive and realistic risk evaluation of engineered nanomaterials in the urban water system. Front. Chem. 2014, 2. [Google Scholar] [CrossRef] [PubMed] [Green Version]
- Oomen, A.G.; Bos, P.M.J.; Fernandes, T.F.; Hund-Rinke, K.; Boraschi, D.; Byrne, H.J.; Aschberger, K.; Gottardo, S.; von der Kammer, F.; Kuehnel, D.; et al. Concern-driven integrated approaches to nanomaterial testing and assessment—Report of the nanosafety cluster working group 10. Nanotoxicology 2014, 8, 334–348. [Google Scholar] [CrossRef] [PubMed]
- Girotti, S.; Ferri, E.N.; Fumo, M.G.; Maiolini, E. Monitoring of environmental pollutants by bioluminescent bacteria. Anal. Chim. Acta 2008, 608, 2–29. [Google Scholar] [CrossRef] [PubMed]
- Van der Meer, J.R.; Belkin, S. Where microbiology meets microengineering: Design and applications of reporter bacteria. Nat. Rev. Microbiol. 2010, 8, 511–522. [Google Scholar] [CrossRef] [PubMed]
- Robbens, J.; Dardenne, F.; Devriese, L.; De Coen, W.; Blust, R. Escherichia coli as a bioreporter in ecotoxicology. Appl. Microbiol. Biotechnol. 2010, 88, 1007–1025. [Google Scholar] [CrossRef] [PubMed]
- Holden, P.A.; Schimel, J.P.; Godwin, H.A. Five reasons to use bacteria when assessing manufactured nanomaterial environmental hazards and fates. Curr. Opin. Biotechnol. 2014, 27, 73–78. [Google Scholar] [CrossRef] [PubMed]
- Djurisic, A.B.; Leung, Y.H.; Ng, A.M.C.; Xu, X.Y.; Lee, P.K.H.; Degger, N.; Wu, R.S.S. Toxicity of metal oxide nanoparticles: Mechanisms, characterization, and avoiding experimental artefacts. Small 2015, 11, 26–44. [Google Scholar] [CrossRef] [PubMed]
- Saleh, N.B.; Chambers, B.; Aich, N.; Plazas-Tuttle, J.; Phung-Ngoc, H.N.; Kirisits, M.J. Mechanistic lessons learned from studies of planktonic bacteria with metallic nanomaterials: Implications for interactions between nanomaterials and biofilm bacteria. Front. Microbiol. 2015, 6. [Google Scholar] [CrossRef] [PubMed]
- Mallevre, F.; Fernandes, T.F.; Aspray, T.J. Silver, zinc oxide and titanium dioxide nanoparticle ecotoxicity to bioluminescent Pseudomonas putida in laboratory medium and artificial wastewater. Environ. Pollut. 2014, 195, 218–225. [Google Scholar] [CrossRef] [PubMed]
- Applerot, G.; Lellouche, J.; Lipovsky, A.; Nitzan, Y.; Lubart, R.; Gedanken, A.; Banin, E. Understanding the antibacterial mechanism of CuO nanoparticles: Revealing the route of induced oxidative stress. Small 2012, 8, 3326–3337. [Google Scholar] [CrossRef] [PubMed]
- Li, F.F.; Lei, C.Y.; Shen, Q.P.; Li, L.J.; Wang, M.; Guo, M.L.; Huang, Y.; Nie, Z.; Yao, S.Z. Analysis of copper nanoparticles toxicity based on a stress-responsive bacterial biosensor array. Nanoscale 2013, 5, 653–662. [Google Scholar] [CrossRef] [PubMed]
- Damoiseaux, R.; George, S.; Li, M.; Pokhrel, S.; Ji, Z.; France, B.; Xia, T.; Suarez, E.; Rallo, R.; Madler, L.; et al. No time to lose-high throughput screening to assess nanomaterial safety. Nanoscale 2011, 3, 1345–1360. [Google Scholar] [CrossRef] [PubMed]
- Sanchez, A.; Recillas, S.; Font, X.; Casals, E.; Gonzalez, E.; Puntes, V. Ecotoxicity of, and remediation with, engineered inorganic nanoparticles in the environment. Trac-Trends Anal. Chem. 2011, 30, 507–516. [Google Scholar] [CrossRef]
- Otero-Gozalez, L.; Field, J.A.; Sierra-Alvarez, R. Inhibition of anaerobic wastewater treatment after long-term exposure to low levels of CuO nanoparticles. Water Res. 2014, 58, 160–168. [Google Scholar] [CrossRef] [PubMed]
- Impellitteri, C.A.; Harmon, S.; Silva, R.G.; Miller, B.W.; Scheckel, K.G.; Luxton, T.P.; Schupp, D.; Panguluri, S. Transformation of silver nanoparticles in fresh, aged, and incinerated biosolids. Water Res. 2013, 47, 3878–3886. [Google Scholar] [CrossRef] [PubMed]
- Kent, R.D.; Oser, J.G.; Vikesland, P.J. Controlled evaluation of silver nanoparticle sulfidation in a full-scale wastewater treatment plant. Environ. Sci. Technol. 2014, 48, 8564–8572. [Google Scholar] [CrossRef] [PubMed]
- Ma, R.; Levard, C.; Judy, J.D.; Unrine, J.M.; Durenkamp, M.; Martin, B.; Jefferson, B.; Lowry, G.V. Fate of zinc oxide and silver nanoparticles in a pilot wastewater treatment plant and in processed biosolids. Environ. Sci. Technol. 2014, 48, 104–112. [Google Scholar] [CrossRef] [PubMed]
- Kaegi, R.; Voegelin, A.; Ort, C.; Sinnet, B.; Thalmann, B.; Krismer, J.; Hagendorfer, H.; Elumelu, M.; Mueller, E. Fate and transformation of silver nanoparticles in urban wastewater systems. Water Res. 2013, 47, 3866–3877. [Google Scholar] [CrossRef] [PubMed]
- Wiles, S.; Whiteley, A.S.; Philp, J.C.; Bailey, M.J. Development of bespoke bioluminescent reporters with the potential for in situ deployment within a phenolic-remediating wastewater treatment system. J. Microbiol. Methods 2003, 55, 667–677. [Google Scholar] [CrossRef]
- Notter, D.A.; Mitrano, D.M.; Nowack, B. Are nanosized or dissolved metals more toxic in the environment? A meta-analysis. Environ. Toxicol. Chem. 2014, 33, 2733–2739. [Google Scholar] [CrossRef] [PubMed]
- Chernousova, S.; Epple, M. Silver as antibacterial agent: Ion, nanoparticle, and metal. Angew. Chem. Int. Ed. 2013, 52, 1636–1653. [Google Scholar] [CrossRef] [PubMed]
- Losasso, C.; Belluco, S.; Cibin, V.; Zavagnin, P.; Micetic, I.; Gallocchio, F.; Zanella, M.; Bregoli, L.; Biancotto, G.; Ricci, A. Antibacterial activity of silver nanoparticles: Sensitivity of different salmonella serovars. Front. Microbiol. 2014, 5. [Google Scholar] [CrossRef]
- Ma, R.; Levard, C.; Marinakos, S.M.; Cheng, Y.; Liu, J.; Michel, F.M.; Brown, G.E., Jr.; Lowry, G.V. Size-controlled dissolution of organic-coated silver nanoparticles. Environ. Sci. Technol. 2012, 46, 752–759. [Google Scholar] [CrossRef] [PubMed]
- Yang, Y.; Zhang, C.Q.; Hu, Z.Q. Impact of metallic and metal oxide nanoparticles on wastewater treatment and anaerobic digestion. Environ. Sci. Process. Impacts 2013, 15, 39–48. [Google Scholar] [CrossRef] [PubMed]
- Levard, C.; Hotze, E.M.; Lowry, G.V.; Brown, G.E., Jr. Environmental transformations of silver nanoparticles: Impact on stability and toxicity. Environ. Sci. Technol. 2012, 46, 6900–6914. [Google Scholar] [CrossRef] [PubMed]
- Westerhoff, P.K.; Kiser, A.; Hristovski, K. Nanomaterial removal and transformation during biological wastewater treatment. Environ. Sci. Technol. 2013, 30, 109–117. [Google Scholar] [CrossRef]
- Bondarenko, O.; Juganson, K.; Ivask, A.; Kasemets, K.; Mortimer, M.; Kahru, A. Toxicity of Ag, CuO and ZnO nanoparticles to selected environmentally relevant test organisms and mammalian cells in vitro: A critical review. Arch. Toxicol. 2013, 87, 1181–1200. [Google Scholar] [CrossRef] [PubMed]
- Chen, Y.G.; Chen, H.; Zheng, X.; Mu, H. The impacts of silver nanoparticles and silver ions on wastewater biological phosphorous removal and the mechanisms. J. Hazard. Mater. 2012, 239, 88–94. [Google Scholar] [CrossRef] [PubMed]
- Wang, Y.; Westerhoff, P.; Hristovski, K.D. Fate and biological effects of silver, titanium dioxide, and C60 (fullerene) nanomaterials during simulated wastewater treatment processes. J. Hazard. Mater. 2012, 201, 16–22. [Google Scholar] [CrossRef] [PubMed]
- Priester, J.H.; van de Werfhorst, L.C.; Ge, Y.; Adeleye, A.S.; Tomar, S.; Tom, L.M.; Piceno, Y.M.; Andersen, G.L.; Holden, P.A. Effects of TiO2 and Ag nanoparticles on polyhydroxybutyrate biosynthesis by activated sludge bacteria. Environ. Sci. Technol. 2014, 48, 14712–14720. [Google Scholar] [CrossRef] [PubMed]
- Sheng, Z.Y.; Liu, Y. Effects of silver nanoparticles on wastewater biofilms. Water Res. 2011, 45, 6039–6050. [Google Scholar] [CrossRef] [PubMed]
- Boholm, M.; Arvidsson, R. Controversy over antibacterial silver: Implications for environmental and sustainability assessments. J. Clean. Prod. 2014, 68, 135–143. [Google Scholar] [CrossRef]
- Limbach, L.K.; Bereiter, R.; Mueller, E.; Krebs, R.; Gaelli, R.; Stark, W.J. Removal of oxide nanoparticles in a model wastewater treatment plant: Influence of agglomeration and surfactants on clearing efficiency. Environ. Sci. Technol. 2008, 42, 5828–5833. [Google Scholar] [CrossRef] [PubMed]
- Dams, R.I.; Biswas, A.; Olesiejuk, A.; Fernandes, T.; Christofi, N. Silver nanotoxicity using a light-emitting biosensor Pseudomonas putida isolated from a wastewater treatment plant. J. Hazard. Mater. 2011, 195, 68–72. [Google Scholar] [CrossRef] [PubMed]
- Matzke, M.; Jurkschat, K.; Backhaus, T. Toxicity of differently sized and coated silver nanoparticles to the bacterium Pseudomonas putida: Risks for the aquatic environment? Ecotoxicology 2014, 23, 818–829. [Google Scholar] [CrossRef] [PubMed]
- El Badawy, A.M.; Luxton, T.P.; Silva, R.G.; Scheckel, K.G.; Suidan, M.T.; Tolaymat, T.M. Impact of environmental conditions (pH, ionic strength, and electrolyte type) on the surface charge and aggregation of silver nanoparticles suspensions. Environ. Sci. Technol. 2010, 44, 1260–1266. [Google Scholar] [CrossRef] [PubMed]
- Fabrega, J.; Fawcett, S.R.; Renshaw, J.C.; Lead, J.R. Silver nanoparticle impact on bacterial growth: Effect of pH, concentration, and organic matter. Environ. Sci. Technol. 2009, 43, 7285–7290. [Google Scholar] [CrossRef] [PubMed]
- Xiu, Z.-M.; Ma, J.; Alvarez, P.J.J. Differential effect of common ligands and molecular oxygen on antimicrobial activity of silver nanoparticles versus silver ions. Environ. Sci. Technol. 2011, 45, 9003–9008. [Google Scholar] [CrossRef] [PubMed]
- Kaegi, R.; Voegelin, A.; Sinnet, B.; Zuleeg, S.; Hagendorfer, H.; Burkhardt, M.; Siegrist, H. Behavior of metallic silver nanoparticles in a pilot wastewater treatment plant. Environ. Sci. Technol. 2011, 45, 3902–3908. [Google Scholar] [CrossRef] [PubMed]
- Gottschalk, F.; Sun, T.Y.; Nowack, B. Environmental concentrations of engineered nanomaterials: Review of modeling and analytical studies. Environ. Pollut. 2013, 181, 287–300. [Google Scholar] [CrossRef] [PubMed]
- Klein, C.; Comero, S.; Stahlmecke, B.; Romazanov, J.; Kuhlbusch, T.; van Doren, E.; Wick, P.; Locoro, G.; Koerdel, W.; Gawlik, B.; et al. NM-300 Silver Characterisation, Stability, Homogeneity; EUR—Scientific and Toxicological Sciences, Technical Research Reports 2011; JRC Publication No. JRC60709, EUR 24693 EN; Publications Office of the European Union: Luxembourg, 2011. [Google Scholar]
- Zook, J.M.; Long, S.E.; Cleveland, D.; Geronimo, C.L.A.; MacCuspie, R.I. Measuring silver nanoparticle dissolution in complex biological and environmental matrices using UV-visible absorbance. Anal. Bioanal. Chem. 2011, 401, 1993–2002. [Google Scholar] [CrossRef] [PubMed]


| Collection site | Site 1 | Site 2 | Site 3 | Site 4 | ||||
|---|---|---|---|---|---|---|---|---|
| Wastewater type | Crude | Final | Crude | Final | Crude | Final | Crude | Final |
| BOD (mg·L−1) | 181 ± 13.7 a | ≤3 | 163.7 ± 11.7 a | ≤3 | 166.4 ± 25.7 a | 16.8 ± 3.2 b | 133 ± 23.6 a | ≤3 |
| COD (mg·L−1) | 393.4 ± 30.9 a | 23.8 ± 3.1 | 407.2 ± 40.2 a | 22 ± 2.7 | 402.8 ± 51.3 a | 58.2 ± 4.9 b | 342.5 ± 70.5 a | 18.2 ± 1.1 |
| BOD/COD ratio | 0.46 ± 0.03 a | ≤0.15 | 0.41 ± 0.03 a | ≤0.16 | 0.41 ± 0.01 a | 0.28 ± 0.03 b | 0.40 ± 0.02 a | ≤0.18 |
| TSS (mg·L−1) | 203.6 ± 23.9 a | ≤10 | 235.8 ± 31.3 | N/A | 224.2 ± 29.4 a | 28.2 ± 2.7 | 179.7 ± 57.9 | N/A |
| Ammonia (mg·L−1) | 15.8 ± 1.1 a | 0.63 ± 0.19 | 17.5 ± 1.6 a | 0.43 ± 0.14 | 18 ± 2.2 | 20.5 ± 2.6 b | 32.6 ± 10.5 a | 0.125 ± 0.075 |
| pH | 6.8 ± 0.16 | 7 ± 0.08 | 6.59 ± 0.26 | 6.50 ± 0.2 | 6.45 ± 0.09 a | 7.56 ± 0.06 b | 7.12 ± 0.04 | 6.94 ± 0.12 |
| Total plate count (CFU·mL−1) | 9.2 ± 5.2 × 10⁶ a | 1.1 ± 0.7 × 10⁴ | 1.5 ± 0.3 × 10⁶ a | 3.3 ± 1.3 × 10³ | 4.1 ± 0.4 × 10⁶ a | 7.83 ± 1.9 × 10³ | 6.4 ± 2.8 × 10⁶ | 1.4 ± 0.9 × 10⁴ |
| Ag (mg·L−1) | <0.1 c | <0.1 c | <0.1 c | <0.1 c | <0.1 c | <0.1 c | <0.1 c | <0.1 c |
| Chloride (mg·L−1) | 119.6 ± 21.3 | 71.6 ± 12.9 | 95.8 ± 7.81 a | 47.5 ± 1.65 | 253.9 ± 37.9 a, b | 148.2 ± 29.8 b | 79 ± 8.2 a | 50.5 ± 1.7 |
| Sulfide (mg·L−1) | 0.166 ± 0.03 a | <0.010 | 0.362 ± 0.088 a | <0.010 | 3.681 ± 1.2 a, b | <0.010 | 0.272 ± 0.09 a | <0.010 |
© 2016 by the authors; licensee MDPI, Basel, Switzerland. This article is an open access article distributed under the terms and conditions of the Creative Commons by Attribution (CC-BY) license (http://creativecommons.org/licenses/by/4.0/).
Share and Cite
Mallevre, F.; Alba, C.; Milne, C.; Gillespie, S.; Fernandes, T.F.; Aspray, T.J. Toxicity Testing of Pristine and Aged Silver Nanoparticles in Real Wastewaters Using Bioluminescent Pseudomonas putida. Nanomaterials 2016, 6, 49. https://doi.org/10.3390/nano6030049
Mallevre F, Alba C, Milne C, Gillespie S, Fernandes TF, Aspray TJ. Toxicity Testing of Pristine and Aged Silver Nanoparticles in Real Wastewaters Using Bioluminescent Pseudomonas putida. Nanomaterials. 2016; 6(3):49. https://doi.org/10.3390/nano6030049
Chicago/Turabian StyleMallevre, Florian, Camille Alba, Craig Milne, Simon Gillespie, Teresa F. Fernandes, and Thomas J. Aspray. 2016. "Toxicity Testing of Pristine and Aged Silver Nanoparticles in Real Wastewaters Using Bioluminescent Pseudomonas putida" Nanomaterials 6, no. 3: 49. https://doi.org/10.3390/nano6030049