
Synthesis and Characterization of Titanium Nitride–Carbon Composites and Their Use in Lithium-Ion Batteries

 , , , and
Abstract
:1. Introduction
2. Methods
2.1. Materials Synthesis
2.2. Characterization
3. Results and Discussion
3.1. FTIR
3.2. SEM/EDS
3.3. TEM
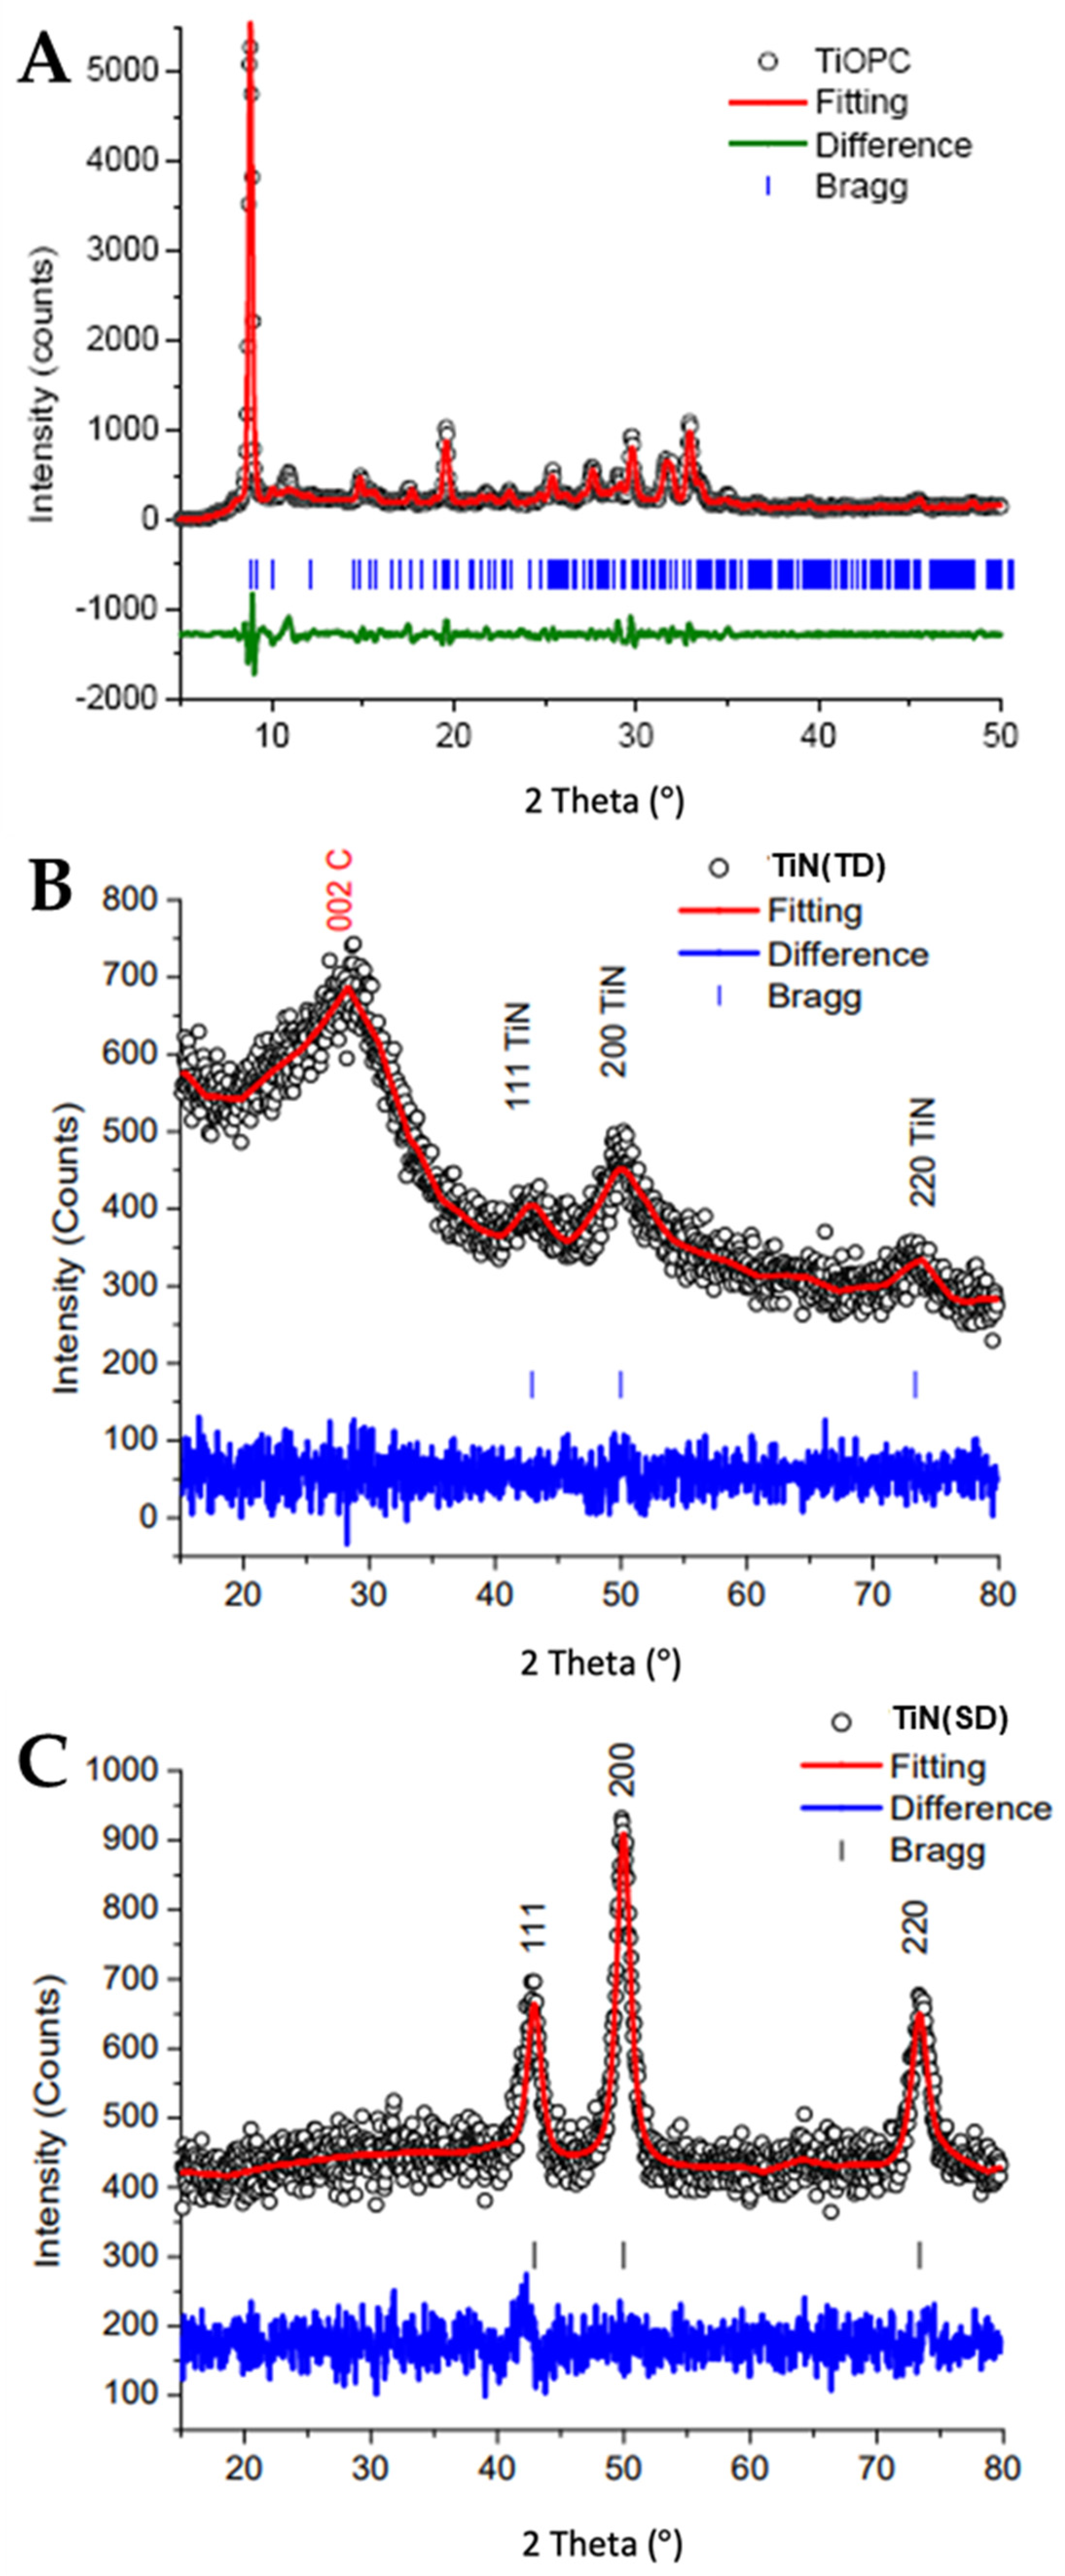
3.4. XRD
Titanium Compounds
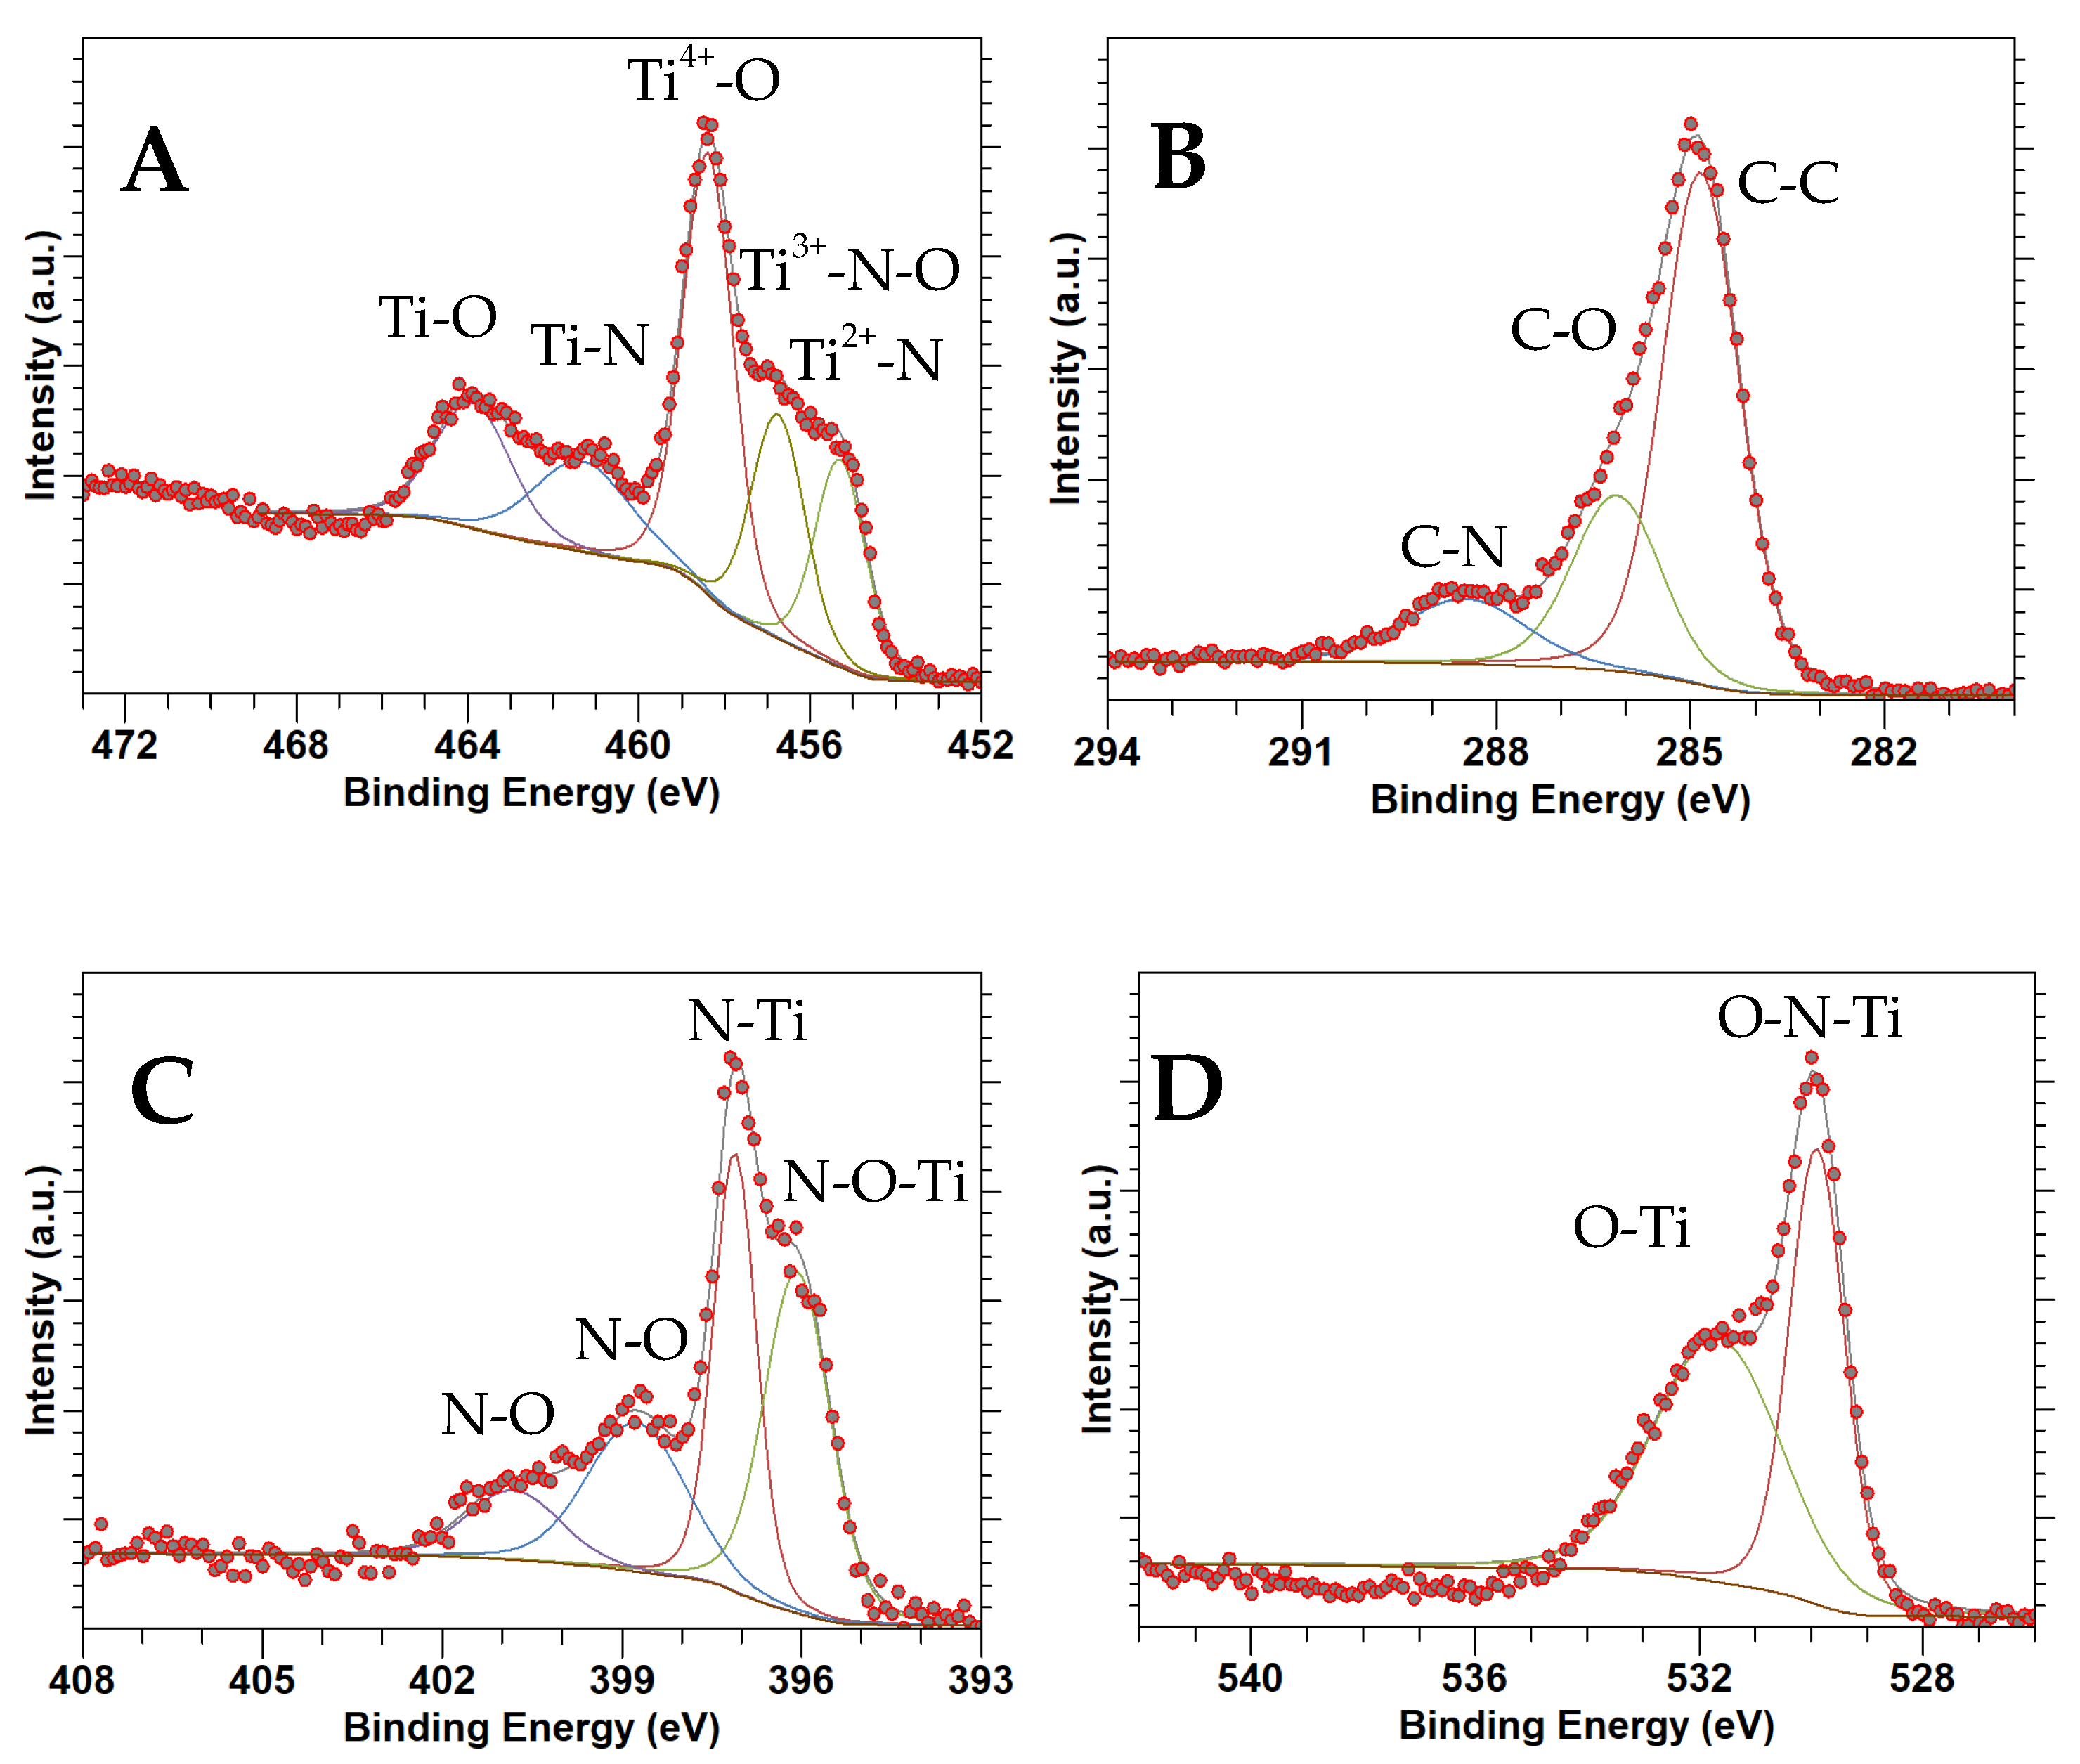
3.5. XPS
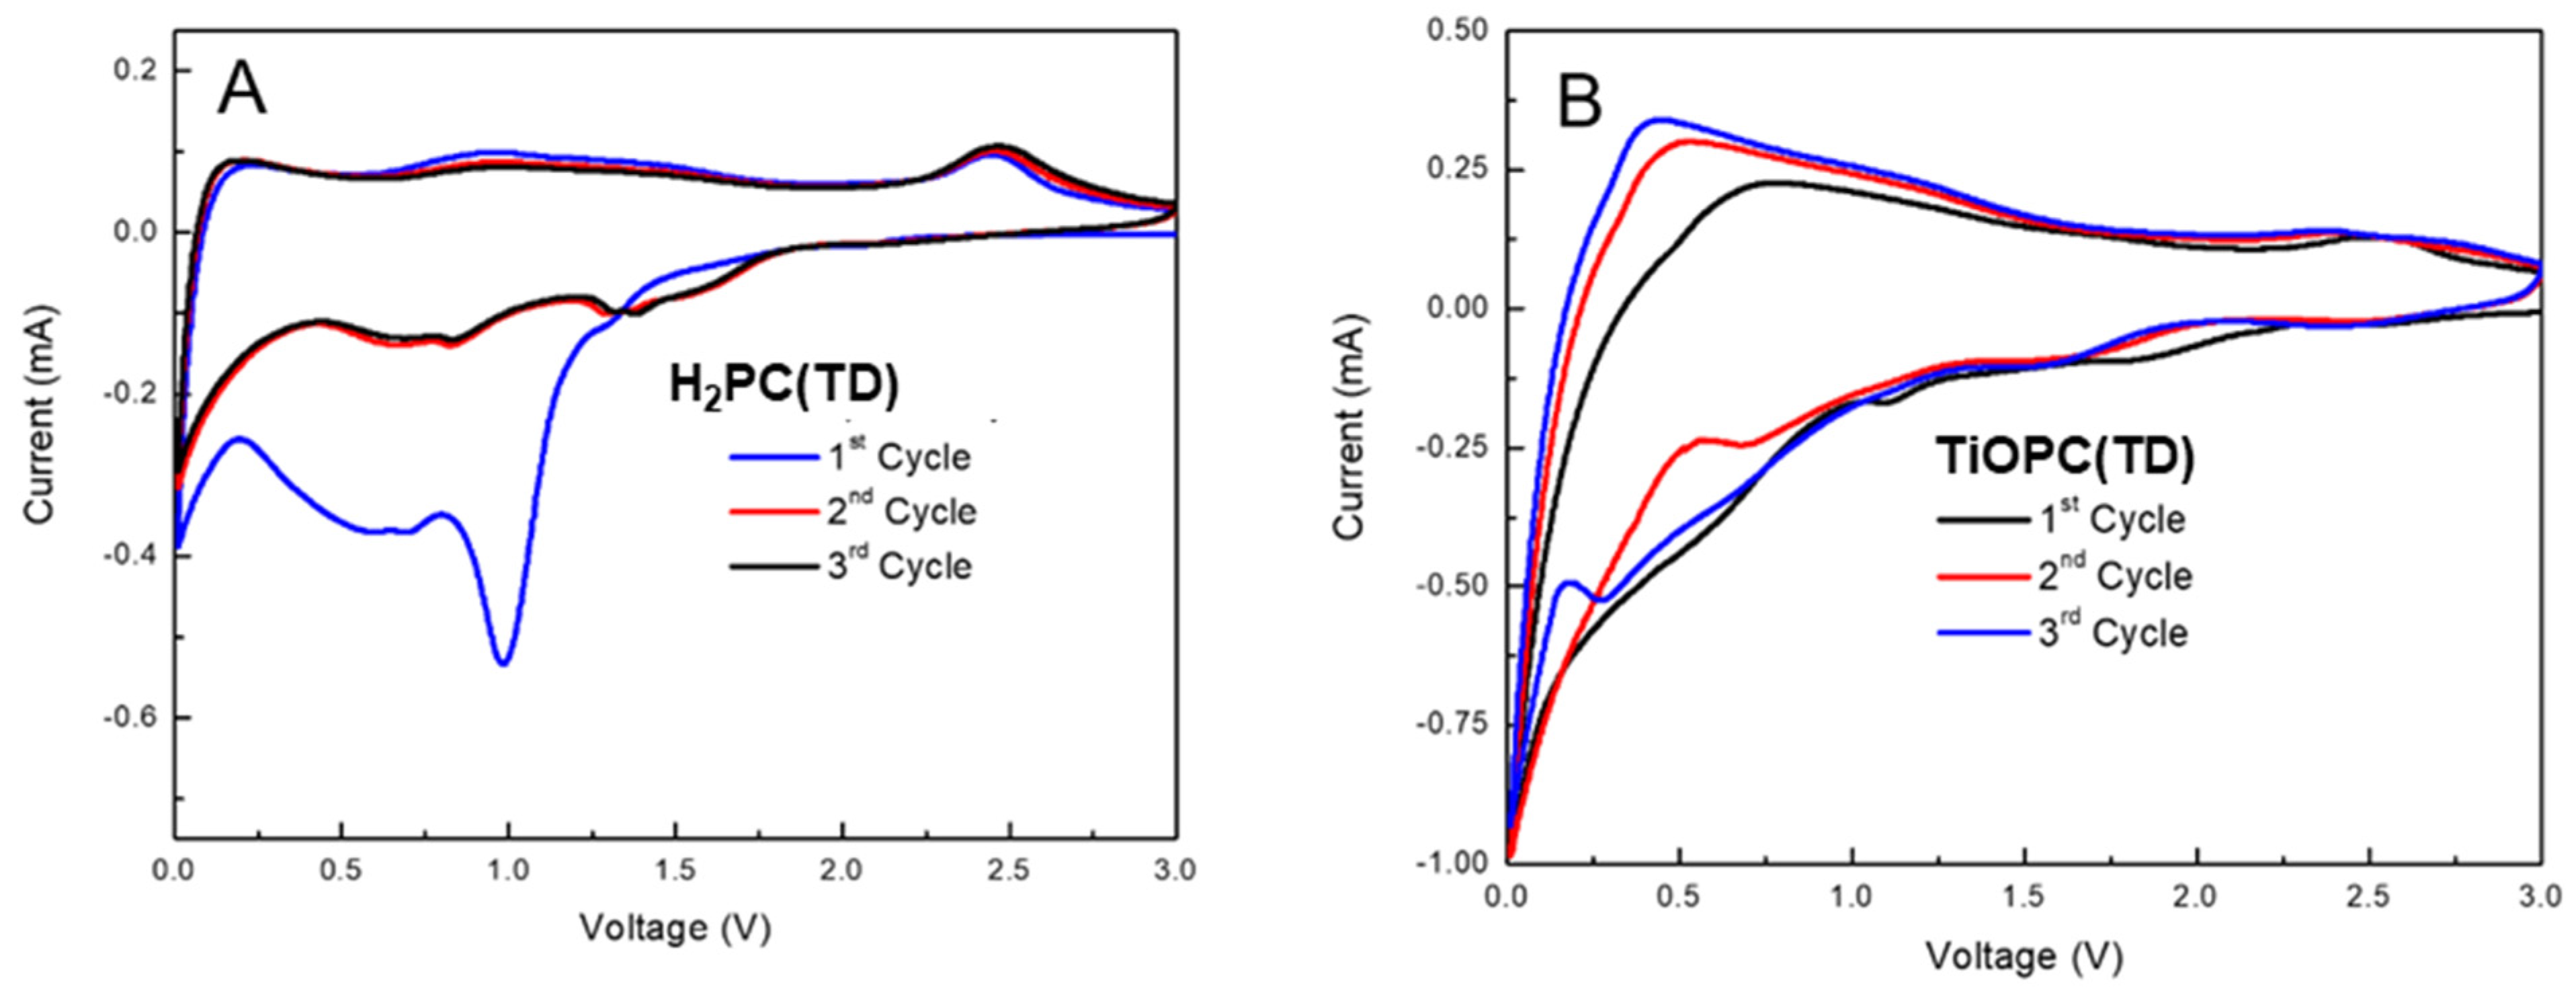
4. Cyclic Voltammetry
5. Conclusions
Author Contributions
Funding
Data Availability Statement
Conflicts of Interest
References
- Togonon, J.J.; Chiang, P.-C.; Lin, H.-J.; Tsai, W.-C.; Yen, H.-J. Pure carbon-based electrodes for metal-ion batteries. Carbon Trends 2021, 3, 100035. [Google Scholar] [CrossRef]
- Yao, F.; Pham, D.T.; Lee, Y.H. Carbon-Based Materials for Lithium-Ion Batteries, Electrochemical Capacitors, and Their Hybrid Devices. ChemSusChem 2015, 8, 2284–2311. [Google Scholar] [CrossRef] [PubMed]
- Yue, Y.; Han, P.; Dong, S.; Zhang, K.; Zhang, C.; Shang, C.; Cui, G. Nanostructured transition metal nitride composites as energy storage material. Chin. Sci. Bull. 2012, 57, 4111–4118. [Google Scholar] [CrossRef]
- Wang, P.; Zhao, B.; Bai, J.; Tong, P.; Zhu, X.; Sun, Y. Transition Metal Nitrides in Lithium- and Sodium-Ion Batteries: Recent Progress and Perspectives. Adv. Mater. Interfaces 2022, 9, 2200606. [Google Scholar] [CrossRef]
- Wang, L.; Zheng, H.; Jin, X.; Yuan, Y. Fe3O4 Hollow Nanospheres Grown In Situ in Three-Dimensional Honeycomb Macroporous Carbon Boost Long-Life and High-Rate Lithium Ion Storage. J. Electron. Mater. 2023, 52, 10–22. [Google Scholar] [CrossRef]
- Zhang, H.; Zhao, H.; Khan, M.A.; Zou, W.; Xu, J.; Zhang, L.; Zhang, J. Recent progress in advanced electrode materials, separators and electrolytes for lithium batteries. J. Mater. Chem. A 2018, 6, 20564–20620. [Google Scholar] [CrossRef]
- Zubi, G.; Dufo-López, R.; Carvalho, M.; Pasaoglu, G. The lithium-ion battery: State of the art and future perspectives. Renew. Sustain. Energy Rev. 2018, 89, 292–308. [Google Scholar] [CrossRef]
- Li, J.A.; Fleetwood, J.; Hawley, W.B.; Kays, W. From Materials to Cell: State-of-the-Art and Prospective Technologies for Lithium-Ion Battery Electrode Processing. Chem. Rev. 2022, 122, 903–956. [Google Scholar] [CrossRef]
- Nandi, D.K.; Sen, U.K.; Choudhury, D.; Mitra, S.; Sarkar, S. Atomic Layer Deposited Molybdenum Nitride Thin Film: A Promising Anode Material for Li Ion Batteries. ACS Appl. Mater. Interfaces 2014, 6, 6606–6615. [Google Scholar] [CrossRef] [PubMed]
- Gillot, F.; Oró-Solé, J.; Palacín, M.R. Nickel nitride as negative electrode material for lithium ion batteries. J. Mater. Chem. 2011, 21, 9997–10002. [Google Scholar] [CrossRef]
- Tang, D.; Yi, R.; Gordin, M.L.; Melnyk, M.; Dai, F.; Chen, S.; Song, J.; Wang, D. Titanium nitride coating to enhance the performance of silicon nanoparticles as a lithium-ion battery anode. J. Mater. Chem. 2014, 2, 10375–10378. [Google Scholar] [CrossRef]
- Balogun, M.-S.; Li, C.; Zeng, Y.; Yu, M.; Wu, Q.; Wu, M.; Lu, X.; Tong, Y. Titanium dioxide@titanium nitride nanowires on carbon cloth with remarkable rate capability for flexible lithium-ion batteries. J. Power Sources 2014, 272, 946–953. [Google Scholar] [CrossRef]
- Zheng, H.; Fang, S.; Tong, Z.; Pang, G.; Shen, L.; Li, H.; Yang, L.; Zhang, X. Stabilized titanium nitride nanowire supported silicon core–shell nanorods as high capacity lithium-ion anodes. J. Mater. Chem. A 2015, 3, 12476–12481. [Google Scholar] [CrossRef]
- Dong, S.; Chen, X.; Gu, L.; Zhou, X.; Xu, H.; Wang, H.; Lui, Z.; Han, P.; Yao, J.; Wang, L.; et al. Facile Preparation of Mesoporous Titanium Nitride Microspheres for Electrochemical Energy Storage. ACS Appl. Mater. Interfaces 2011, 3, 93–98. [Google Scholar] [CrossRef] [PubMed]
- Agrafiotis, C.C.; Puszynski, J.A.; Lavacek, V.H. Experimental Study on the Synthesis of Titanium and Tantalum Nitrides in the Self-Propagating Regime. Combust. Sci. Technol. 1991, 76, 187–218. [Google Scholar] [CrossRef]
- Giordano, C.; Erpen, C.; Yao, W.; Milke, B.; Antonietti, M. Metal Nitride Metal Carbide Nanoparticles by a Soft Urea Pathway. Chem. Mater. 2009, 21, 5136–5144. [Google Scholar] [CrossRef]
- Combadiere, L.; Machet, J. Reactive magnetron sputtering deposition of TiN films. II. Influence of substrate temperature on the mechanical properties of the films. Surf. Coat. Technol. 1997, 88, 28–37. [Google Scholar] [CrossRef]
- Bhaskar, U.; Bid, S.; Satpati, B.; Pradhan, S. Mechanosynthesis of nanocrystalline titanium nitride and its microstructure characterization. J. Alloys Compd. 2010, 493, 192–196. [Google Scholar] [CrossRef]
- Cai, P.-J.; Li, G.-Z.; Shi, C.; Huo, J.-H.; Liu, L.-H. A Low Temperature Synthetic Route to Nanocrystalline TiN. S. Afr. J. Chem. 2011, 64, 57–60. [Google Scholar]
- White, G.V.; Mackenzie, K.J.; Brown, I.W.; Bowden, M.E.; Johnston, J.H. Carbothermal synthesis of titanium nitride. J. Mater. Sci. 1992, 27, 4294–4299. [Google Scholar] [CrossRef]
- Grillo, A.; Moura, F.; Solorzano, G.; Brocchi, E.; Mendoza Oliveros, M. Vapour Phase Synthesis and Characterization of TiN Nanoparticles. Chem. Eng.Trans. 2017, 57, 1399–1404. [Google Scholar]
- Kaskel, S.A.; Schlichte, K.; Chaplais, G.; Khanna, M. Synthesis and characterisation of titanium nitride based nanoparticles. J. Mater. Chem. 2003, 13, 1496–1499. [Google Scholar] [CrossRef]
- Schaaf, P.; Kahle, M.; Carpene, E. Reactive laser synthesis of carbides and nitrides. Appl. Surf. Sci. 2005, 247, 607–615. [Google Scholar] [CrossRef]
- Vaidhyanathan, B.; Rao, K.J. Synthesis of Ti, Ga, and V Nitrides: Microwave-Assisted Carbothermal Reduction and Nitridation. Chem. Mater. 1997, 9, 1196–1200. [Google Scholar] [CrossRef]
- Wade, T.; Ross, C.B.; Crooks, R.M. Electrochemical Synthesis of Ceramic Materials. 5. An Electrochemical Method Suitable for the Preparation of Nine Metal Nitrides. Chem. Mater. 1997, 9, 248–254. [Google Scholar] [CrossRef]
- Fix, R.; Gordon, R.G.; Hoffman, D.M. Chemical vapor deposition of vanadium, niobium, and tantalum nitride thin films. Chem. Mater. 1993, 5, 614–619. [Google Scholar] [CrossRef]
- Gajbhiye, N.; Ningthoujam, R. Low temperature synthesis, crystal structure and thermal stability studies of nanocrystalline VN particles. Mater. Res. Bull. 2006, 41, 1612–1621. [Google Scholar] [CrossRef]
- Gomathi, A.; Rao, C. Nanostructures of the binary nitrides, BN, TiN, and NbN, prepared by the urea-route. Mater. Res. Bull. 2006, 41, 941–947. [Google Scholar] [CrossRef]
- Morlanés, N.; Almaksoud, W.; Rai, R.K.; Ould-Chikh, S.; Ali, M.M.; Vidjayacoumar, B.; Al-Sabban, B.E.; Albahily, K.; Basset, J.-M. Development of catalysts for ammonia synthesis based on metal phthalocyanine materials. Catal. Sci. Technol. 2020, 10, 844–852. [Google Scholar] [CrossRef]
- Sanchez-Sanchez, A.; Izquierdo, M.T.; Mathieu, S.; Ghanbaja, J.; Celzard, A.; Fierro, V. Structure and electrochemical properties of carbon nanostructures derived from nickel(II) and iron(II) phthalocyanines. J. Adv. Res. 2020, 22, 85–97. [Google Scholar] [CrossRef]
- Goedken, V.L.; Dessy, G.; Ercolani, C.; Fares, V. Synthesis, reactivity, and X-ray crystal structure of dichloro(phthalocyaninato)titanium(IV). Inorg. Chem. 1985, 24, 991–995. [Google Scholar] [CrossRef]
- Li, X.; Feng, Y.; Li, C.; Han, H.; Hu, X.; Ma, Y.; Yang, Y. One-step preparation of metal-free phthalocyanine with controllable crystal form. Green Process. Synth. 2021, 10, 95–100. [Google Scholar] [CrossRef]
- Hiller, W.; Strähle, J.; Kobel, W.; Hanack, M. Polymorphie, Leitfähigkeit und Kristallstrukturen von Oxo-phthalocyaninato-titan(IV). Z. Kristallogr. Cryst. Mater. 1982, 159, 173–184. [Google Scholar] [CrossRef]
- Brager, A. An X-ray examination of titanium nitride. Acta Physicochim. 1939, 9, 617–632. [Google Scholar]
- Rodríguez-Carvajal, J. Recent advances in magnetic structure determination by neutron powder diffraction. Physica B 1993, 192, 55–69. [Google Scholar] [CrossRef]
- Fairley, N.; Fernandez, V.; Richard-Plouet, M.; Guillot-Duendon, C.; Walton, J.; Smith, E.; Flahaut, D.; Greiner, M.; Biesinger, M.; Tougaard, S.; et al. Systematic and collaborative approach to problem solving using X-ray photoelectron spectroscopy. Appl. Surf. Sci. Adv. 2021, 5, 100112. [Google Scholar] [CrossRef]
- Harbeck, S.; Mack, H. Experimental and Theoretical Investigations on the IR and Raman Spectra for CuPc and TiOPc; Universitat Tubingen. 2013, pp. 1–19. Available online: http://hdl.handle.net/10900/49961 (accessed on 17 January 2024).
- Seoudi, R.; El-Bahy, G.; El Sayed, Z. FTIR, TGA and DC electrical conductivity studies of phthalocyanine and its complexes. J. Mol. Struct. 2005, 753, 119–126. [Google Scholar] [CrossRef]
- Ahmad, A.; Collins, R.A. FTIR characterization of triclinic lead phthalocyanine. J. Phys. D 1991, 24, 1894. [Google Scholar] [CrossRef]
- Fernandez, L.; Thussing, S.; Mänz, A.; Sundermeyer, J.; Witte, G.; Jakob, P. The discrete nature of inhomogeneity: The initial stages and local configurations of TiOPc during bilayer growth on Ag(111). Phys. Chem. Chem. Phys. 2017, 19, 2495–2502. [Google Scholar] [CrossRef]
- Denekamp, I.M.; Veenstra, F.L.; Jungbacker, P.; Rothenberg, G. A simple synthesis of symmetric phthalocyanines and their respective perfluoro and transition-metal complexes. Appl. Organomet. Chem. 2019, 33, 4872. [Google Scholar] [CrossRef]
- Neamtu, M.A.; Nadejde, C.; Brinza, L.; Dragos, O.; Gherghel, D.; Paul, A. Iron phthalocyanine-sensitized magnetic catalysts for BPA photodegradation. Sci. Rep. 2020, 10, 5376. [Google Scholar] [CrossRef]
- Cheng, H.; Garcia-Araez, N.; Hector, A.L.; Soulé, S. Synthesis of Hard Carbon-TiN/TiC Composites by Reacting Cellulose with TiCl4 Followed by Carbothermal Nitridation/Reduction. Inorg. Chem. 2019, 58, 5776–5786. [Google Scholar] [CrossRef]
- Jaeger, D.; Patscheider, J. A complete and self-consistent evaluation of XPS spectra of TiN. J. Electron. Spectrosc. Relat. Phenom. 2012, 185, 523–534. [Google Scholar] [CrossRef]
- Shen, H.; Wang, L. Corrosion resistance and electrical conductivity of plasma nitrided titanium. Int. J. Hydrogen Energy 2021, 46, 11084–11091. [Google Scholar] [CrossRef]
- Mucha, N.R.; Som, J.; Shaji, S.; Fialkova, S.; Apte, P.R.; Balasubramanian, B.; Shield, J.E.; Anderson, M.; Kumar, D. Electrical and optical properties of titanium oxynitride thin films. J. Mater. Sci. 2020, 55, 5123–5134. [Google Scholar] [CrossRef]
- Shi, P.; Song, Y.; Tang, J.; Nie, Z.; Chang, J.; Chen, Q.; He, Y.; Guo, T.; Zhang, J.; Wang, H. Ultra-narrow bandwidth red-emission carbon quantum dots and their bio-imaging. Physica E 2022, 142, 115197. [Google Scholar] [CrossRef]
- Scrocco, M.; Paoletti, A.M.; Ercolani, C. Electron Energy Level Transitions in Bis(phthalocyaninato)titanium(IV) Examined by UV−Visible, Near-IR, EELS, and XPS Spectra. Inorg. Chem. 1996, 35, 4479–4788. [Google Scholar] [CrossRef]
- Chan, M.H.; Lu, F.-H. X-ray photoelectron spectroscopy analyses of titanium oxynitride films prepared by magnetron sputtering using air/Ar mixtures. Thin Solid Films 2009, 517, 5006–5009. [Google Scholar] [CrossRef]
- Huizinga, T.; van ’T Blik, H.F.J.; Vis, J.C.; Prins, R. XPS investigations of Pt and Rh supported on γ-Al2O3 and TiO2. Surf. Sci. 1983, 135, 580–596. [Google Scholar] [CrossRef]
- Anatoly, I.; Wainstein, D.L.; Rashkovskiy, A.Y.; Osherov, A.; Golan, Y. Size shift of XPS lines observed from PbS nanocrystals. Surf. Interface Anal. 2010, 42, 850–854. [Google Scholar]
- Beaudette, C.A.; Tu, Q.; Ali Eslamisaray, M.; Kortshagen, U.R. Plasma-Synthesized Nitrogen-Doped Titanium Dioxide Nanoparticles with Tunable Visible Light Absorption and Photocatalytic Activity. ASME Open J. Eng. 2022, 1, 2770–3495. [Google Scholar] [CrossRef]
- Farahmand, S.; Ghiaci, M.; Asghari, S. Oxo-vanadium (IV) phthalocyanine implanted onto the modified SBA-15 as a catalyst for direct hydroxylation of benzene to phenol in acetonitrile-water medium: A kinetic study. Chem. Eng. Sci. 2021, 232, 116331. [Google Scholar] [CrossRef]
- Filik, J.; May, P.W.; Pearce, S.R.; Wild, R.K.; Hallam, K.R. XPS and laser Raman analysis of hydrogenated amorphous carbon films. Diam. Relat Mater. 2003, 12, 974–978. [Google Scholar] [CrossRef]
- Girolami, G.S.; Jensen, J.A.; Pollina, D.M.; Allocca, C.M.; Kaloyeros, A.E.; Williams, W.S. Organometallic route to the chemical vapor deposition of titanium carbide films at exceptionally low temperatures. J. Am. Chem. Soc. 1987, 109, 1579–1580. [Google Scholar] [CrossRef]
- Lewin, E.; Persson, P.; Lattemann, M.; Stüber, M.; Gorgoi, M.; Sandell, A.; Ziebert, C.; Schafers, F.; Braun, W.; Hailbritter, J.; et al. On the origin of a third spectral component of C1s XPS-spectra for nc-TiC/a-C nanocomposite thin films. Surf. Coat. Technol. 2008, 202, 3563–3570. [Google Scholar] [CrossRef]
- Shubina, T.E.; Marbach, H.; Flechtner, K.; Kretschmann, A.; Jux, N.; Buchner, F.; Steinruck, H.-P.; Clark, T.; Gottfried, J.M. Principle and Mechanism of Direct Porphyrin Metalation: Joint Experimental and Theoretical Investigation. J. Am. Chem. Soc. 2007, 129, 9476–9483. [Google Scholar] [CrossRef] [PubMed]
- Jones, T.E.; Rocha, T.C.R.; Knop-Gericke, A.; Stampfl, C.; Schlogl, R.; Piccinin, S. Thermodynamic and spectrocopic properties of oxygen atmosphere. Phys. Chem. Chem. Phys. 2015, 17, 9288. [Google Scholar] [CrossRef]
- Ageeva, T.A.; Golubev, D.V.; Gorshkova, A.S.; Ionov, A.M.; Kopylova, E.V.; Koifman, O.I.; Mozhchil, R.N.; Rozhkova, E.P.; Rumyantseva, V.D.; Sigov, A.S.; et al. XPS and IR Spectroscopic Studies of Titanyl and Vanadyl Complexes. Macroheterocycles 2019, 12, 148–153. [Google Scholar] [CrossRef]
- Zhang, C.; Yang, F.; Zhang, D.; Xue, C.; Zou, Y.; Li, C.; Chen, B.; Wang, Q. A binder-free Si-based anode for Li-ion batteries. RSC Adv. 2015, 5, 15940–15943. [Google Scholar] [CrossRef]
- Balogun, M.-S.; Qiu, W.; Wang, W.; Fang, P.; Lu, X.; Tong, Y. Recent advances in metal nitrides as high-performance electrode materials for energy storage devices. J. Mater. Chem. A 2015, 3, 1364–1387. [Google Scholar] [CrossRef]
- Ji, L.; Meduri, P.; Agubra, V.; Xiao, X.; Alcoutlabi, M. Graphene-Based Nanocomposites for Energy Storage. Adv. Energy Mater. 2016, 6, 1502159. [Google Scholar] [CrossRef]
- Chavez, R.O.; Lodge, T.P.; Alcoutlabi, M. Recent developments in centrifugally spun composite fibers and their performance as anode materials for lithium-ion and sodium-ion batteries. Mater. Sci. Eng. 2021, 266, 115024. [Google Scholar] [CrossRef]
- Chavez, R.O.; Lodge, T.P.; Huitron, J.; Chipara, M.; Alcoutlabi, M. Centrifugally spun carbon fibers prepared from aqueous poly(vinylpyrrolidone) solutions as binder-free anodes in lithium-ion batteries. J. Appl. Polym. Sci. 2021, 138, 50396. [Google Scholar] [CrossRef]
- Agubra, A.; Zuniga, L.; Flores, D.; Campos, H.; Villarreal, J.; Alcoutlabi, M. A comparative study on the performance of binary SnO2/NiO/C and Sn/C composite nanofibers as alternative anode materials for lithium ion batteries. Electrochim. Acta 2017, 224, 608–621. [Google Scholar] [CrossRef]
- Kim, I.-S.; Kumta, P.N.; Blomgren, G.E. Si/TiN Nanocomposites Novel Anode Materials for Li-Ion Batteries. Electrochem. Solid-State Lett. 2000, 3, 493. [Google Scholar] [CrossRef]
- Lui, M.; Li, X.; Ming, H.; Adkins, J.; Zhao, X.; Su, L.; Zhou, Q.; Zheng, J. TiN surface modified SnO2 as an efficient anode material for lithium ion batteries. New J. Chem. 2013, 37, 2096–2102. [Google Scholar]


| H2PC Band Position (cm−1) | TiOPC Band Position (cm−1) | Assignment |
|---|---|---|
| 710 | C-N [37] | |
| 729 | 724 | C-H out of plane deformation [38,39] |
| 762 | 751 | Macrocycle ring stretching [c] [37] |
| 778 | 778 | C-N stretching [38] |
| 798 | N-Ti stretching [37] | |
| 839 | 832 | C-N-C ring breathing |
| 872 | 877 | N-H stretching coupling with isoindole deformation [37] |
| 889 | Isoindole deformation with coupling aza stretching [37] | |
| 944 | ||
| 961 | Ti=O [31,37,40] | |
| 998 | 1002 | Benzene ring and C=C [37] |
| 1064 | 1062 | C–N stretching in pyrrole vibration [38] |
| 1075 | ||
| 1091 | ||
| 1116 | 1117 | C–H in-plane deformation [37,38,39] |
| 1157 | 1158 | C–N in-plane and C–H in-plane [38,41] |
| 1187 | Isoindole stretching [38] | |
| 1275 | ||
| 1299 | 1286 | C–N in isoindole stretching [37,38] |
| 1324 | ||
| 1336 | 1330 | C–C in isoindole [38] |
| 1417 | 1413 | Isoindole stretching [37] |
| 1437 | ||
| 1461 | 1460 | C–H in-plane bending [38] |
| 1477 | 1474 | C=N pyrrole [37] |
| 1501 | 1489 | C–H bending in aryl [38] |
| 1523 | C–H aryl [38] | |
| 1576 | ||
| 1595 | 1585 | Benzene C-C stretching [42] |
| 1610 | 1609 | C–C stretching vibration in pyrrole [38] |
| 2923 | 2923 | C–H stretching [38] |
| 3004 | 3004 | C-H stretching [38] |
| 3050 | 3050 | C–H stretching vibration in ring [38] |
| 3282 | N-H [38] |
| Compound | Space Group | a (Å) | b (Å) | c (Å) | α (°) | β (°) | γ (°) | * χ2 | Reference |
|---|---|---|---|---|---|---|---|---|---|
| α-H2PCsyn | C2/n | 25.755 | 3.773 | 23.398 | 90 | 93.111 | 90 | 2.07 | This Work |
| α-H2PClit | C2/n | 26.121 | 3.797 | 23.875 | 90 | 94.16 | 90 | ** N/A | [32] |
| TiOPCsyn | P-1 | 12.269 | 12.598 | 8.594 | 95.067 | 96.127 | 67.818 | 3.74 | This Work |
| TiOPClit | P-1 | 12.17 | 12.58 | 8.64 | 95 | 96.3 | 67.9 | N/A | [33] |
| TiN(TD) | FM3-M | 4.24 (0) | 4.24 (0) | 4.24 (0) | 90.0 | 90.0 | 90.0 | 1.05 | This Work |
| TiN(SG) | FM3-M | 4.24 (0) | 4.24 (0) | 4.24 (0) | 90.0 | 90.0 | 90.0 | 1.50 | This Work |
| TiNlit | FM3-M | 4.244 | 4.244 | 4.244 | 90.0 | 90.0 | 90.0 | N/A | [34] |
| Sample | %Ti | %N | %C | %O |
|---|---|---|---|---|
| TiOPC | 0.6 | 11.3 | 81.7 | 6.4 |
| TiN(TD) | 1.3 | 5.0 | 82.5 | 11.3 |
| TiN(SG) | 16.1 | 12.5 | 52.2 | 19.2 |
| Sample | Ti 2p3/2 | Energy (eV) | Ti2P1/2 | O 1s | Energy (eV) | N1S | Energy (eV) | C 1s | Energy (eV) |
|---|---|---|---|---|---|---|---|---|---|
| TiOPC | Ti4+-N/O | 457.2 | 463.1 | O-Ti | 529.3 | N-Ti | 397.9 | C-C | 283.7 |
| O-H | 531.4 | N-C | 399.3 | C=C | 284.9 | ||||
| O2ads | 532.9 | C-N | 287.4 | ||||||
| TiN(TD) | Ti-N | 456.7 | 462.9 | O-N-Ti | 529.9 | N-Ti | 398.2 | C-C | 284.5 |
| Ti-N-O | 458.1 | O-H | 532.2 | N-C | 400.5 | C-O/C-N | 285.7 | ||
| Ti-O | 459.1 | 464.2 | Satellite | 288.4 | |||||
| TiN(SG) | Ti-N | 455.5 | 461.3 | O2ads | 529.9 | N-O-Ti | 396.1 | C-C | 284.8 |
| Ti-N-O | 456.7 | O-N-Ti | 531.7 | N-Ti | 397.1 | C-O/C-N | 286.1 | ||
| Ti-O | 458.4 | 469.3 | N-O | 398.8 | Satellite | 288.4 | |||
| N=O | 400.8 |
Disclaimer/Publisher’s Note: The statements, opinions and data contained in all publications are solely those of the individual author(s) and contributor(s) and not of MDPI and/or the editor(s). MDPI and/or the editor(s) disclaim responsibility for any injury to people or property resulting from any ideas, methods, instructions or products referred to in the content. |
© 2024 by the authors. Licensee MDPI, Basel, Switzerland. This article is an open access article distributed under the terms and conditions of the Creative Commons Attribution (CC BY) license (https://creativecommons.org/licenses/by/4.0/).
Share and Cite
Morales, H.M.; Vieyra, H.; Sanchez, D.A.; Fletes, E.M.; Odlyzko, M.; Lodge, T.P.; Padilla-Gainza, V.; Alcoutlabi, M.; Parsons, J.G. Synthesis and Characterization of Titanium Nitride–Carbon Composites and Their Use in Lithium-Ion Batteries. Nanomaterials 2024, 14, 624. https://doi.org/10.3390/nano14070624
Morales HM, Vieyra H, Sanchez DA, Fletes EM, Odlyzko M, Lodge TP, Padilla-Gainza V, Alcoutlabi M, Parsons JG. Synthesis and Characterization of Titanium Nitride–Carbon Composites and Their Use in Lithium-Ion Batteries. Nanomaterials. 2024; 14(7):624. https://doi.org/10.3390/nano14070624
Chicago/Turabian StyleMorales, Helia Magali, Horacio Vieyra, David A. Sanchez, Elizabeth M. Fletes, Michael Odlyzko, Timothy P. Lodge, Victoria Padilla-Gainza, Mataz Alcoutlabi, and Jason G. Parsons. 2024. "Synthesis and Characterization of Titanium Nitride–Carbon Composites and Their Use in Lithium-Ion Batteries" Nanomaterials 14, no. 7: 624. https://doi.org/10.3390/nano14070624