
Nanoporous Amorphous Carbon with Exceptional Ultra-High Strength

 , , , and
Abstract
:1. Introduction
2. Methods
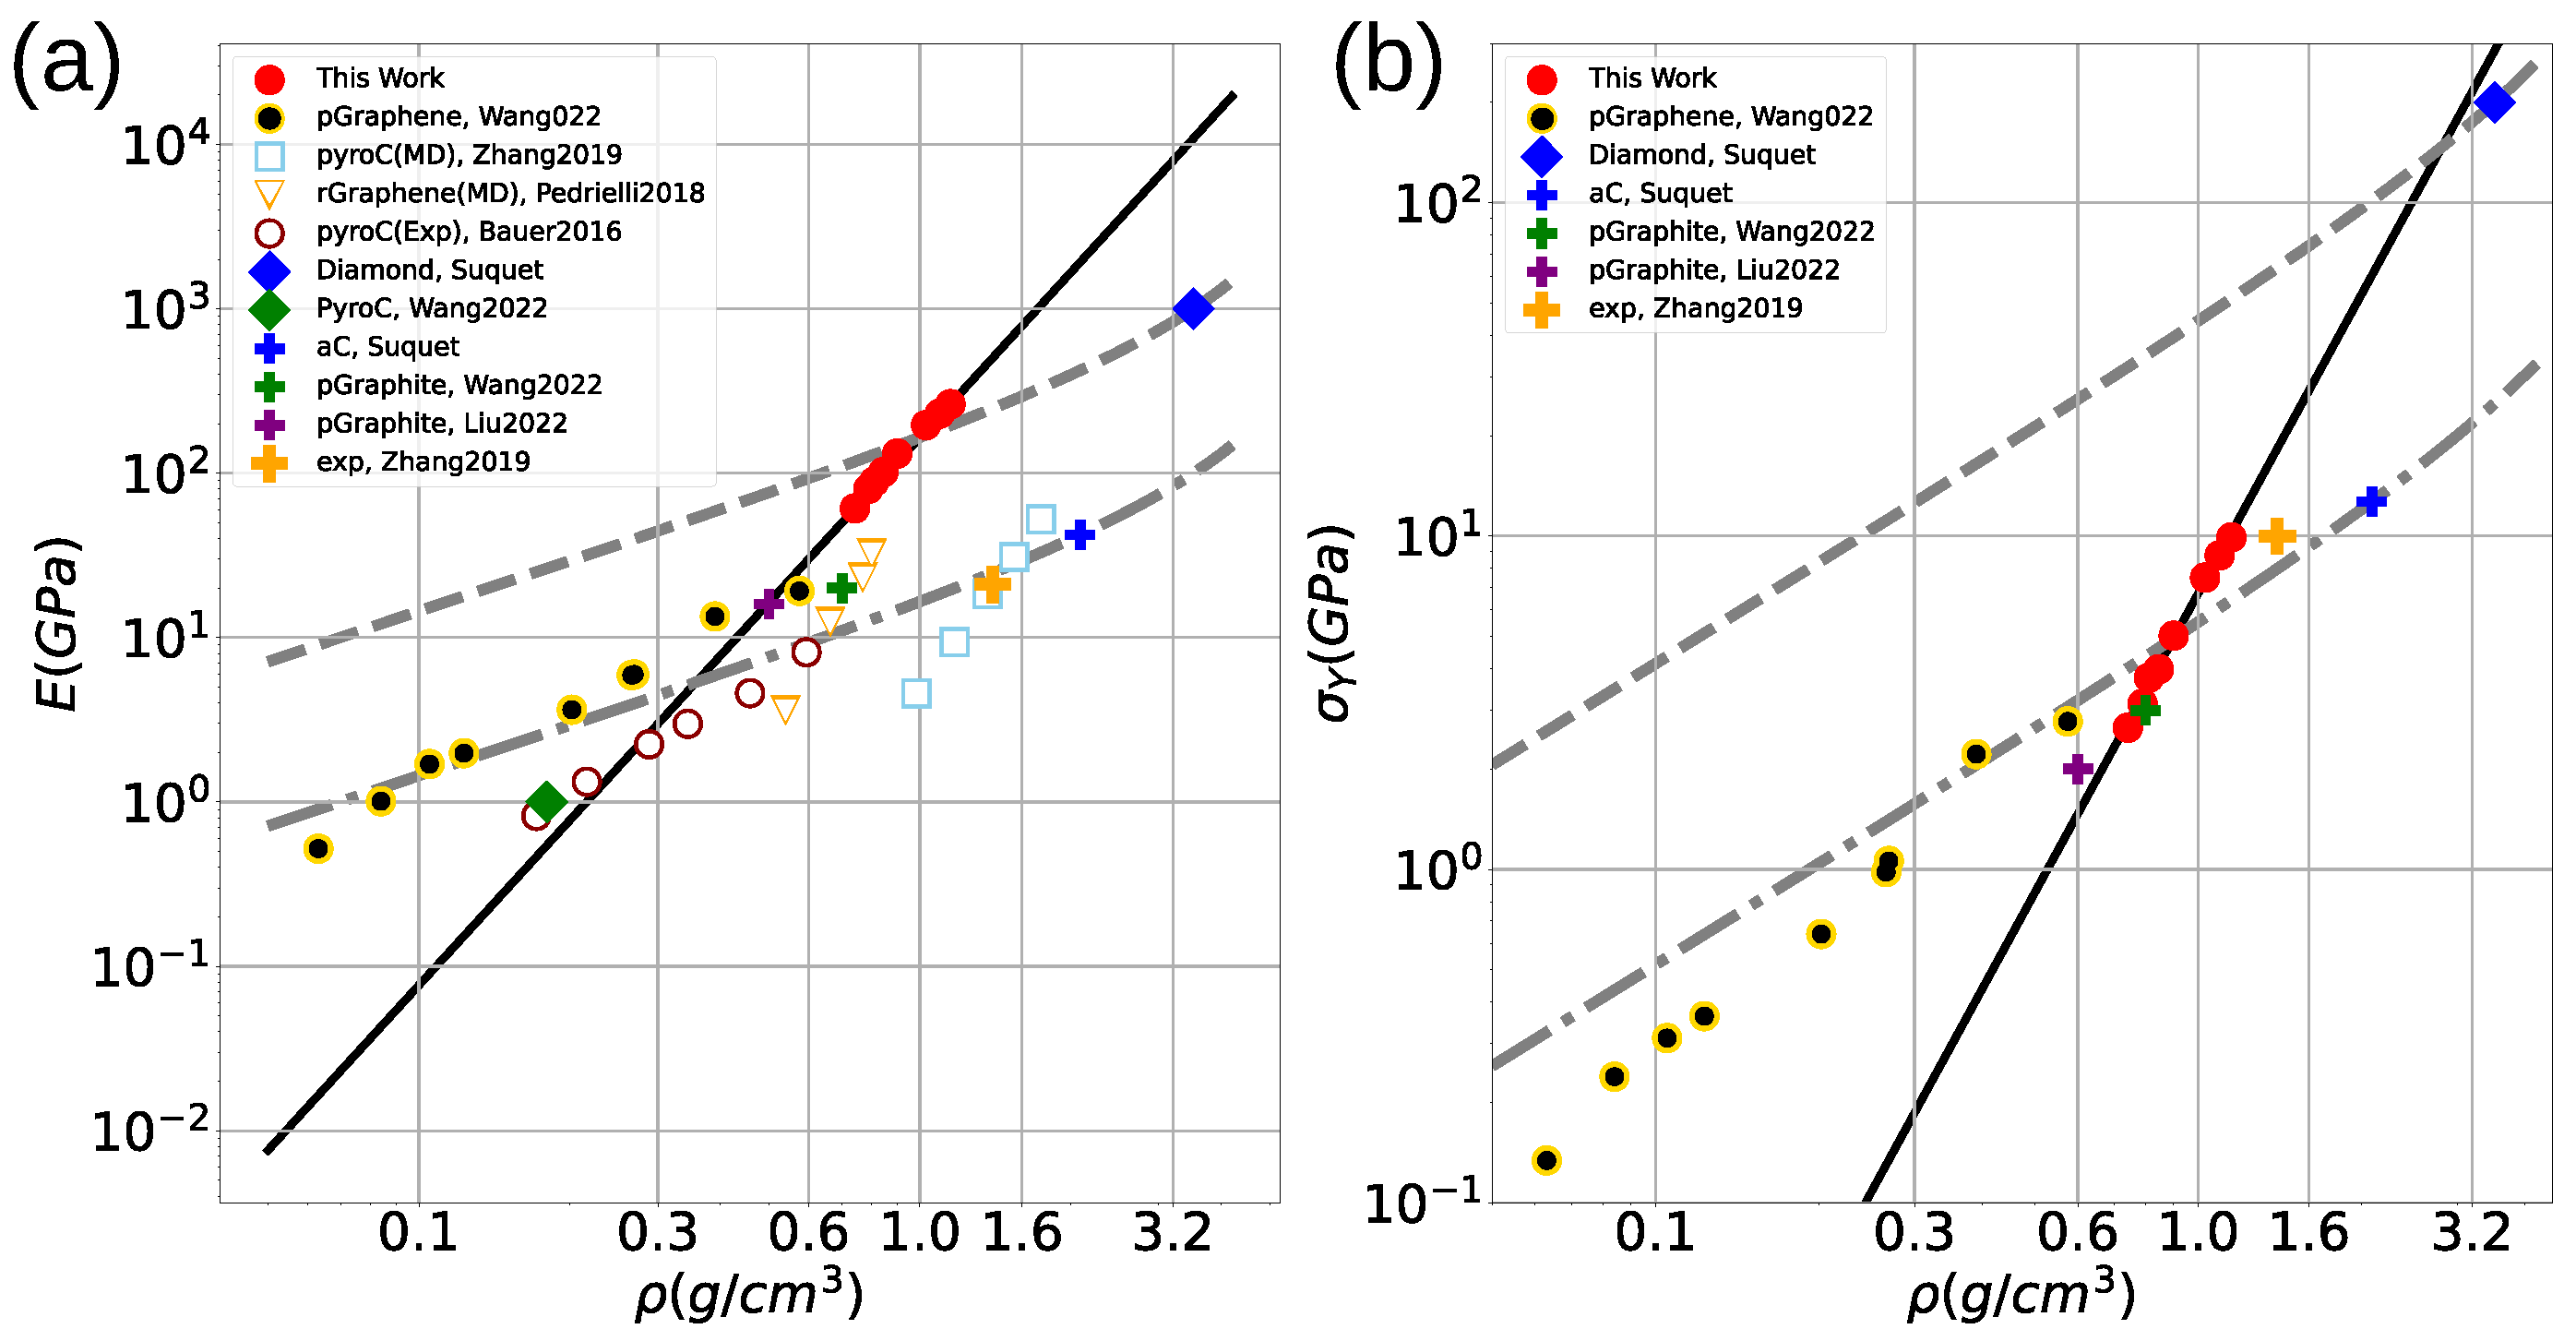
3. Results
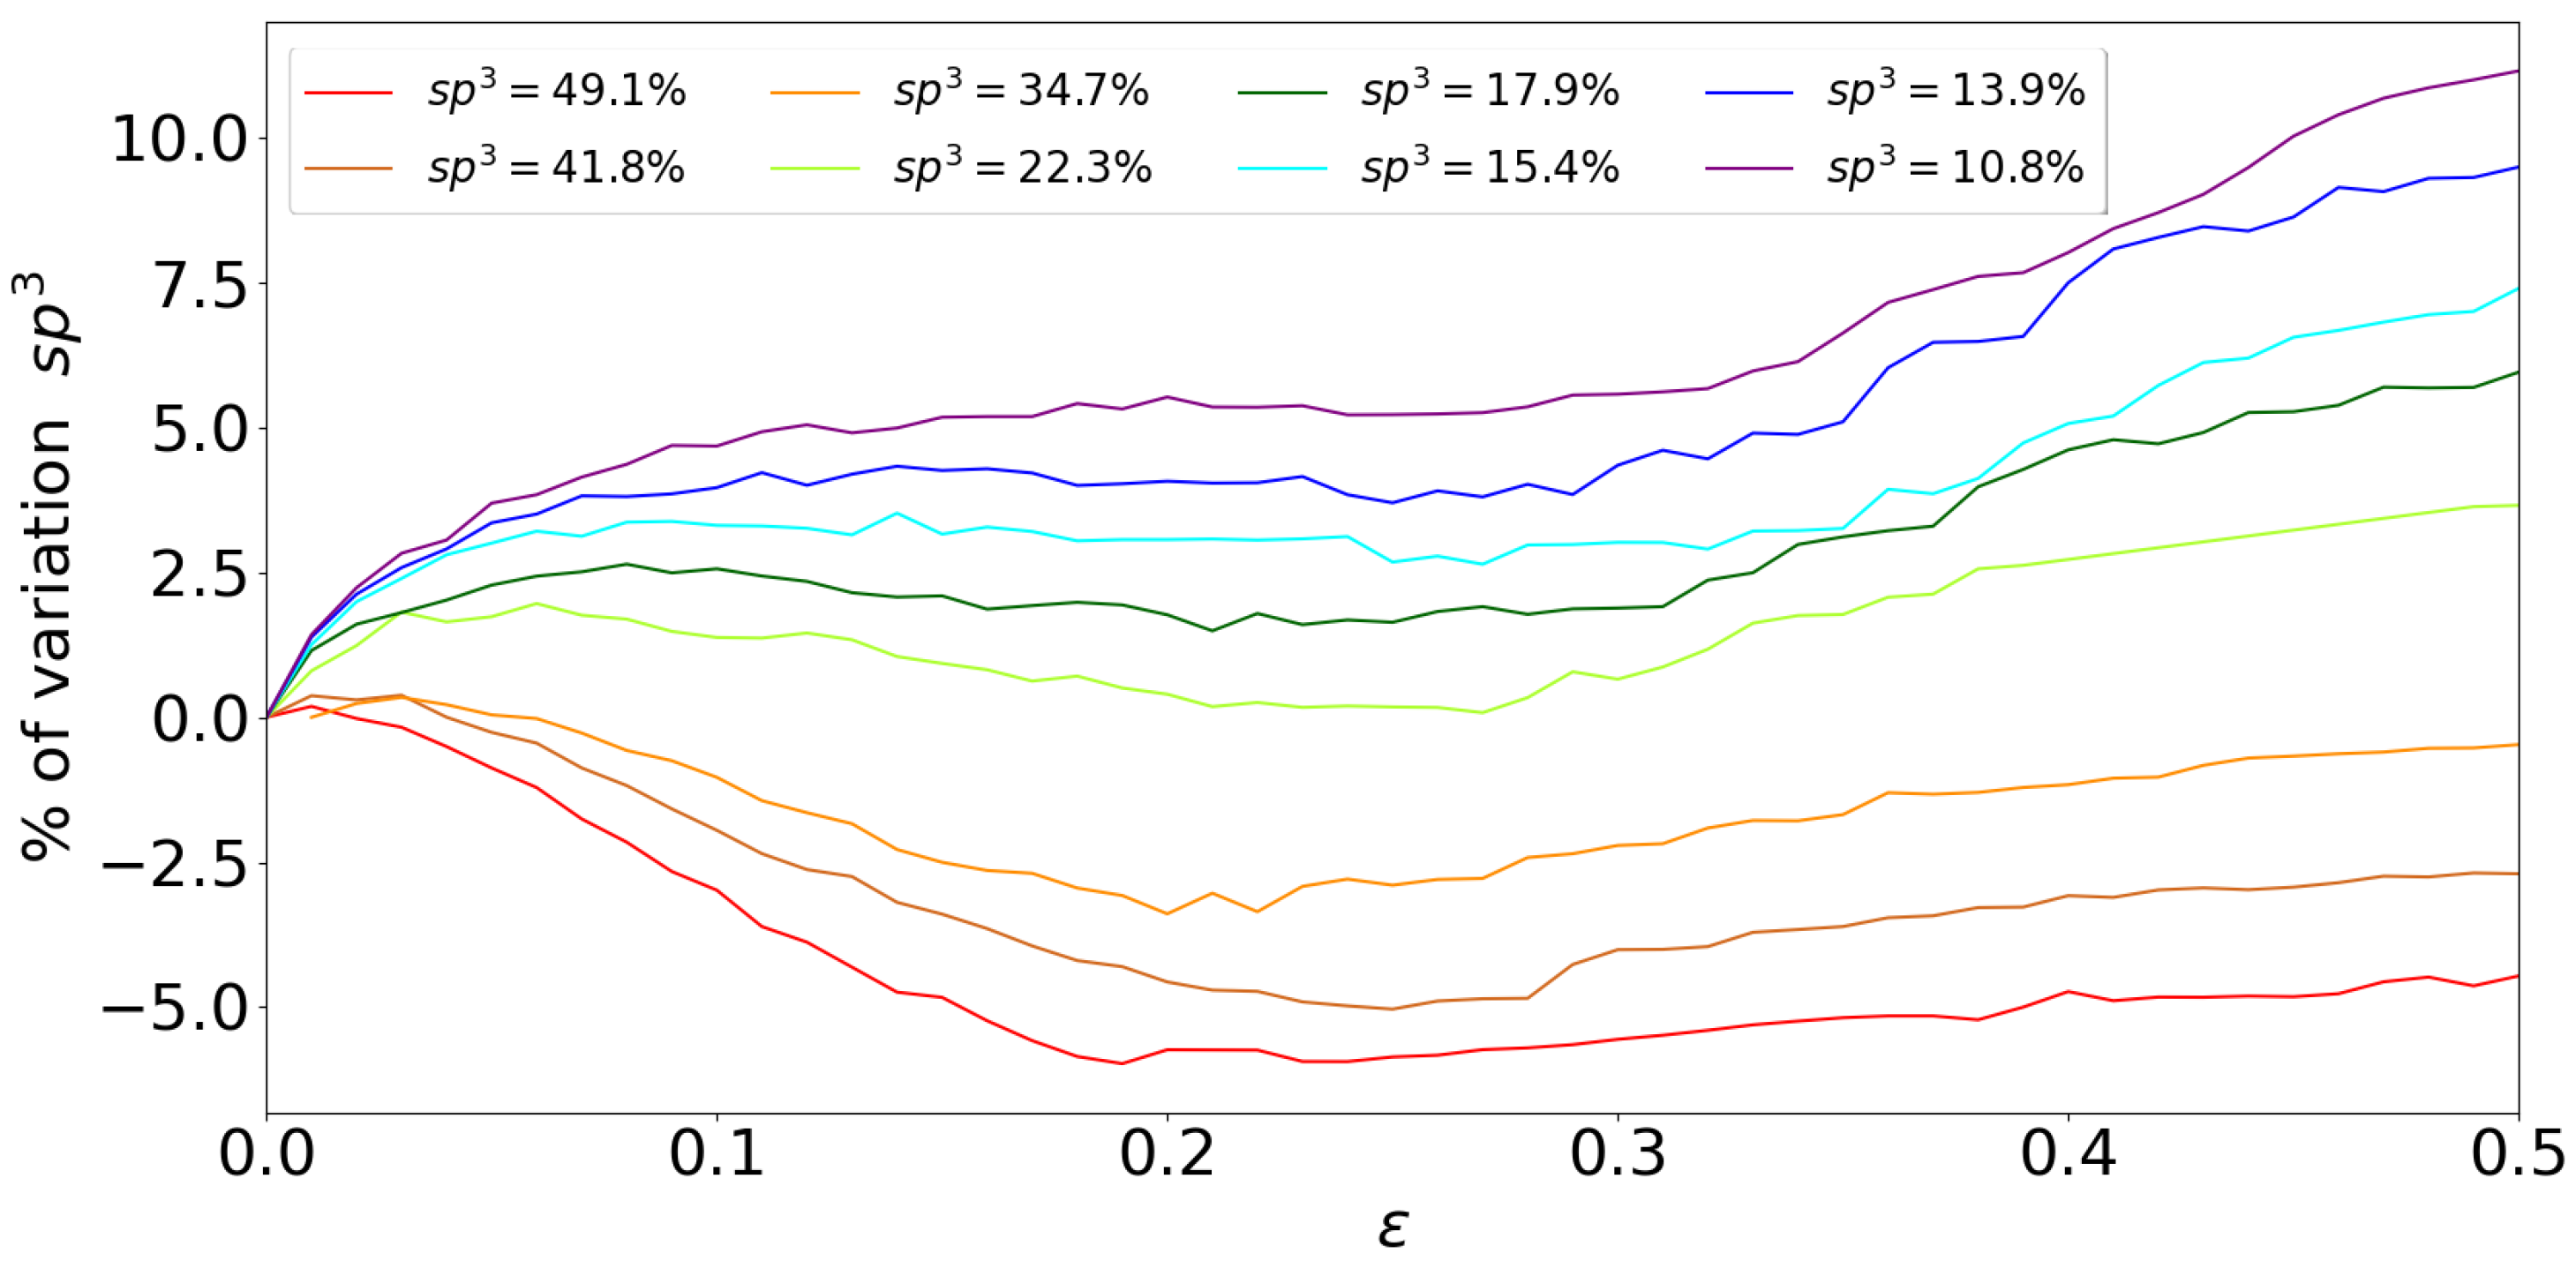
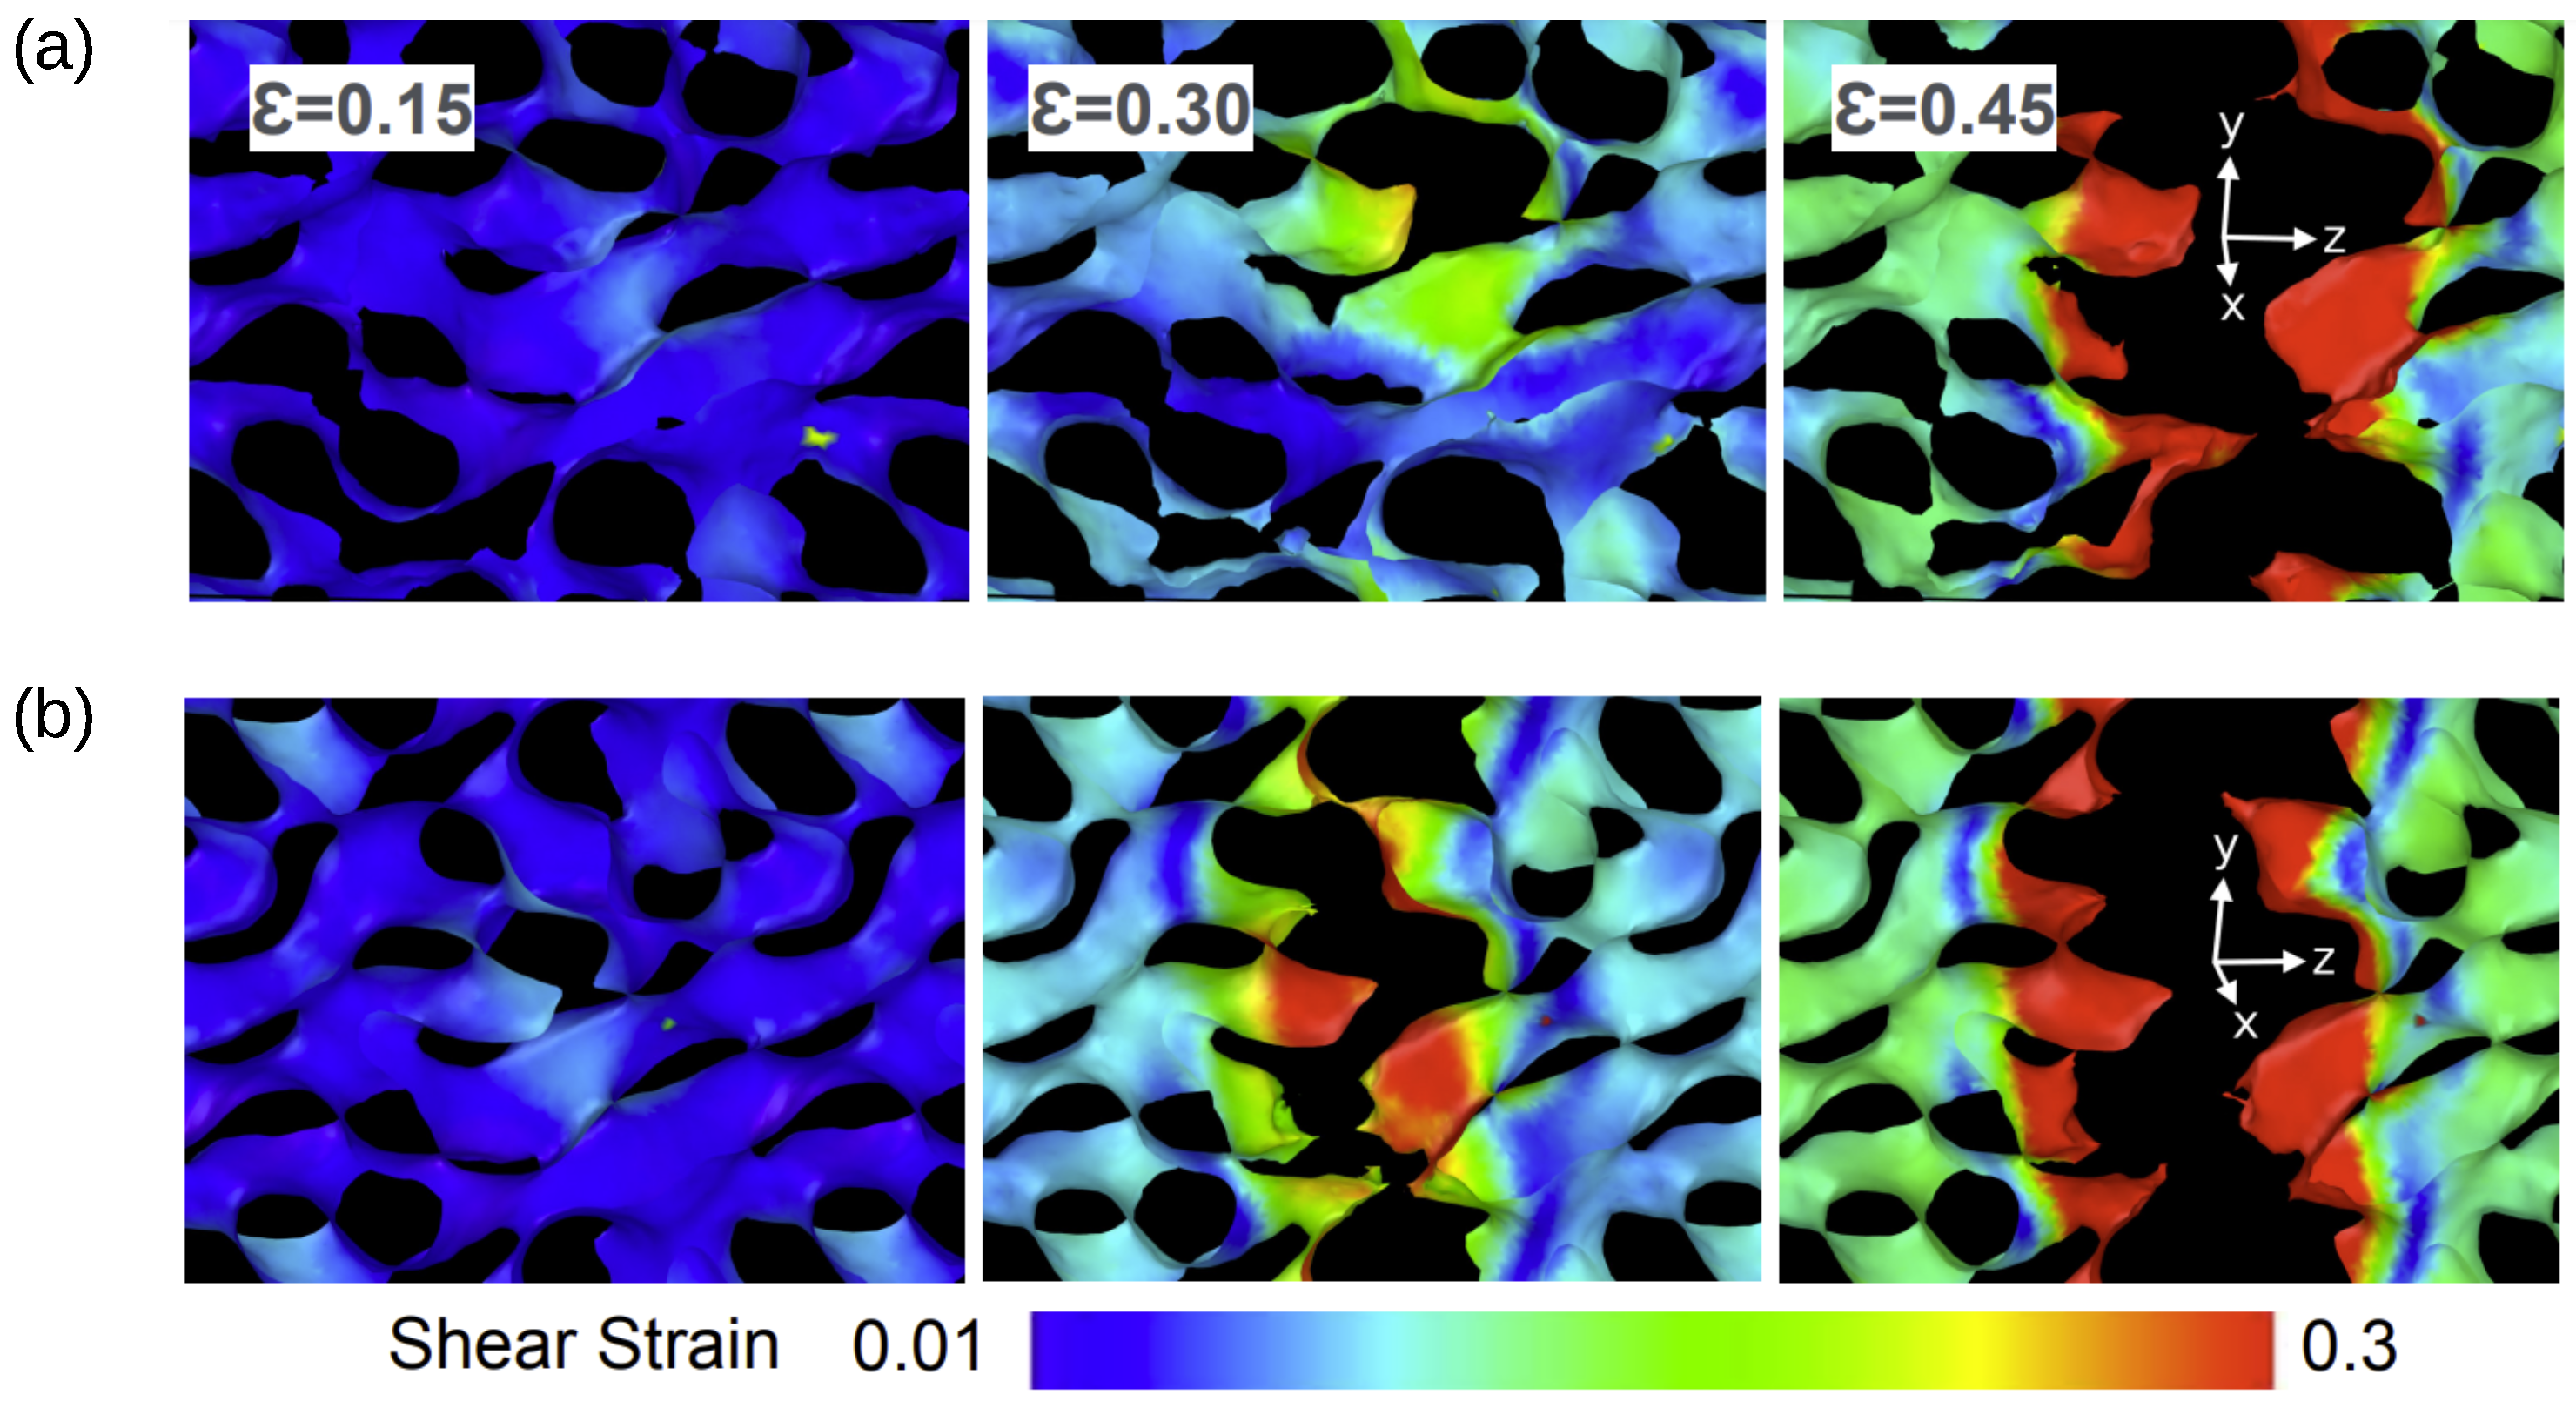
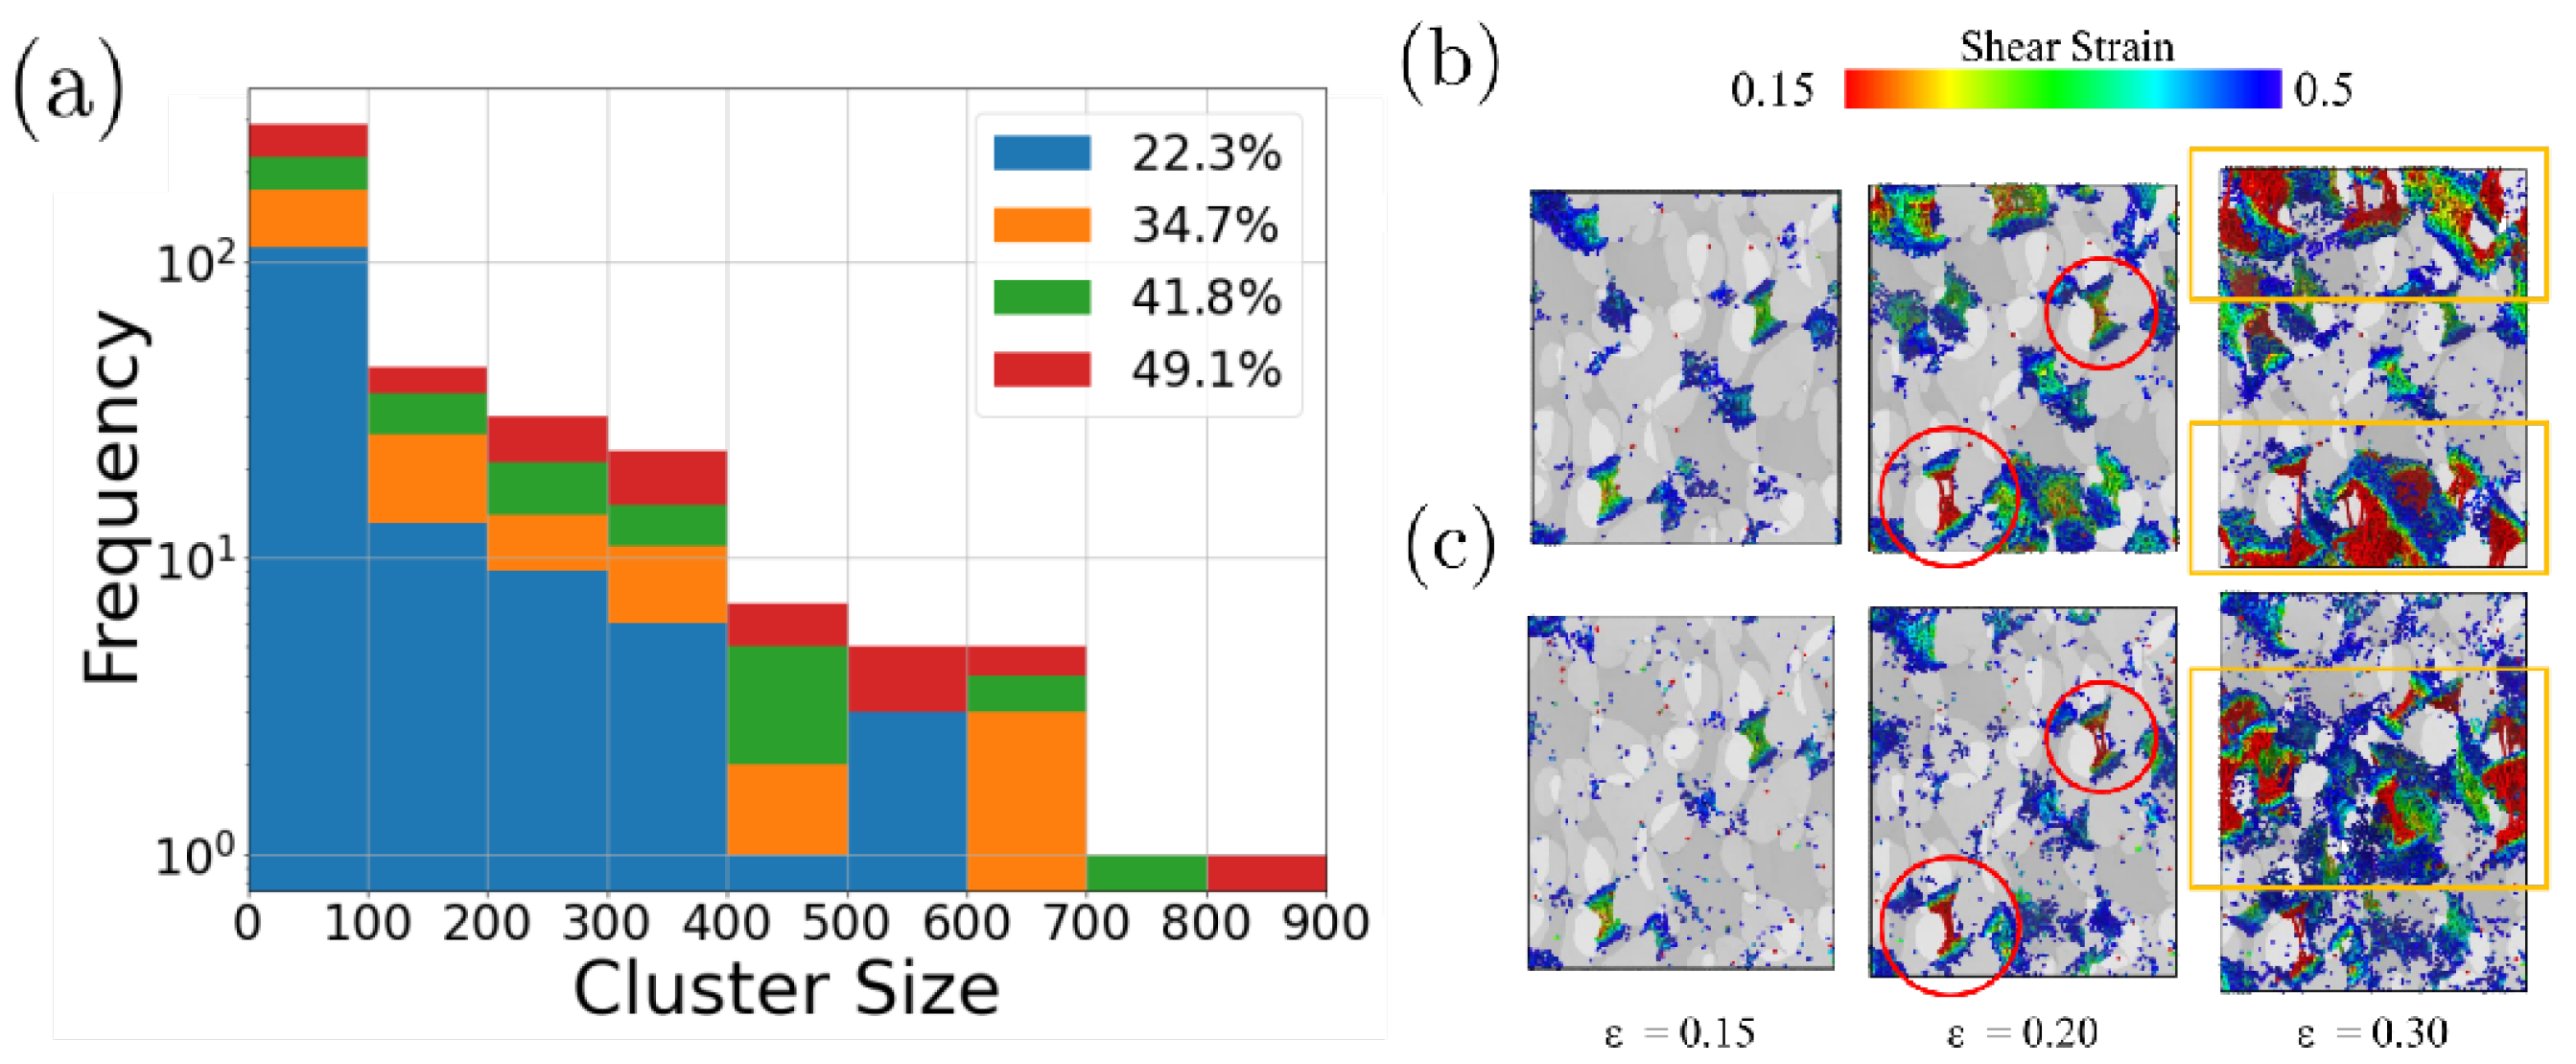
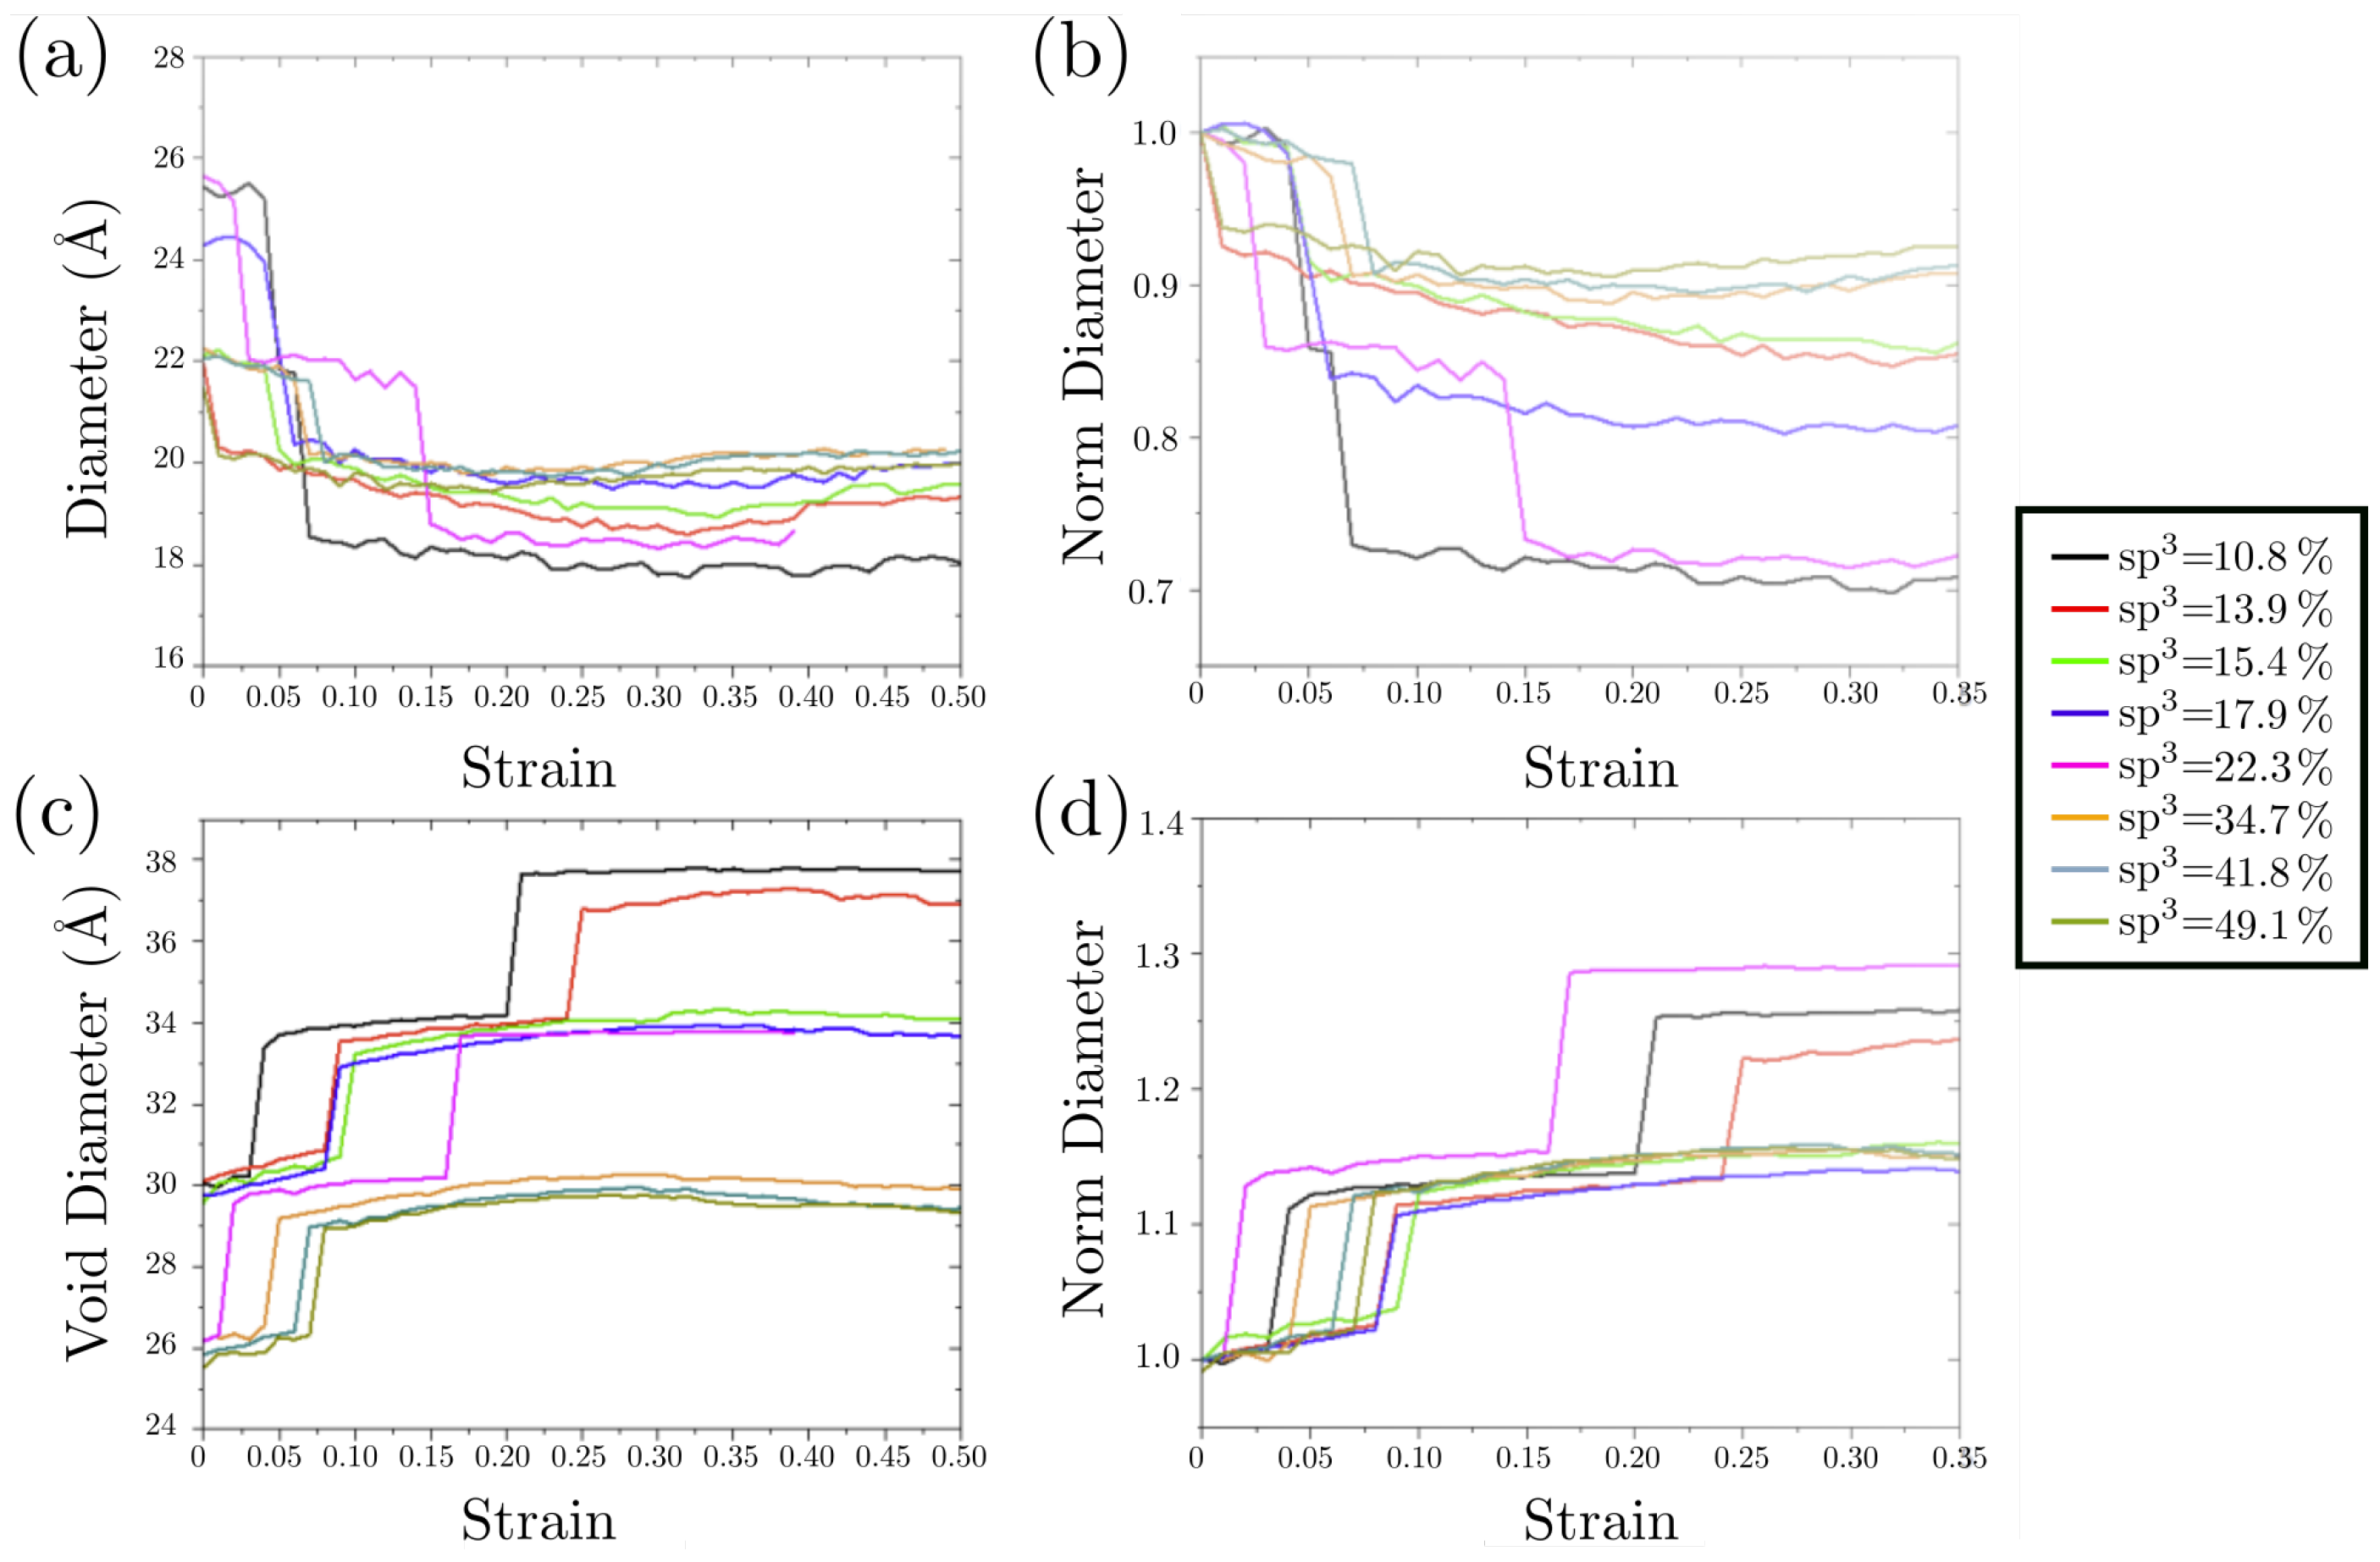
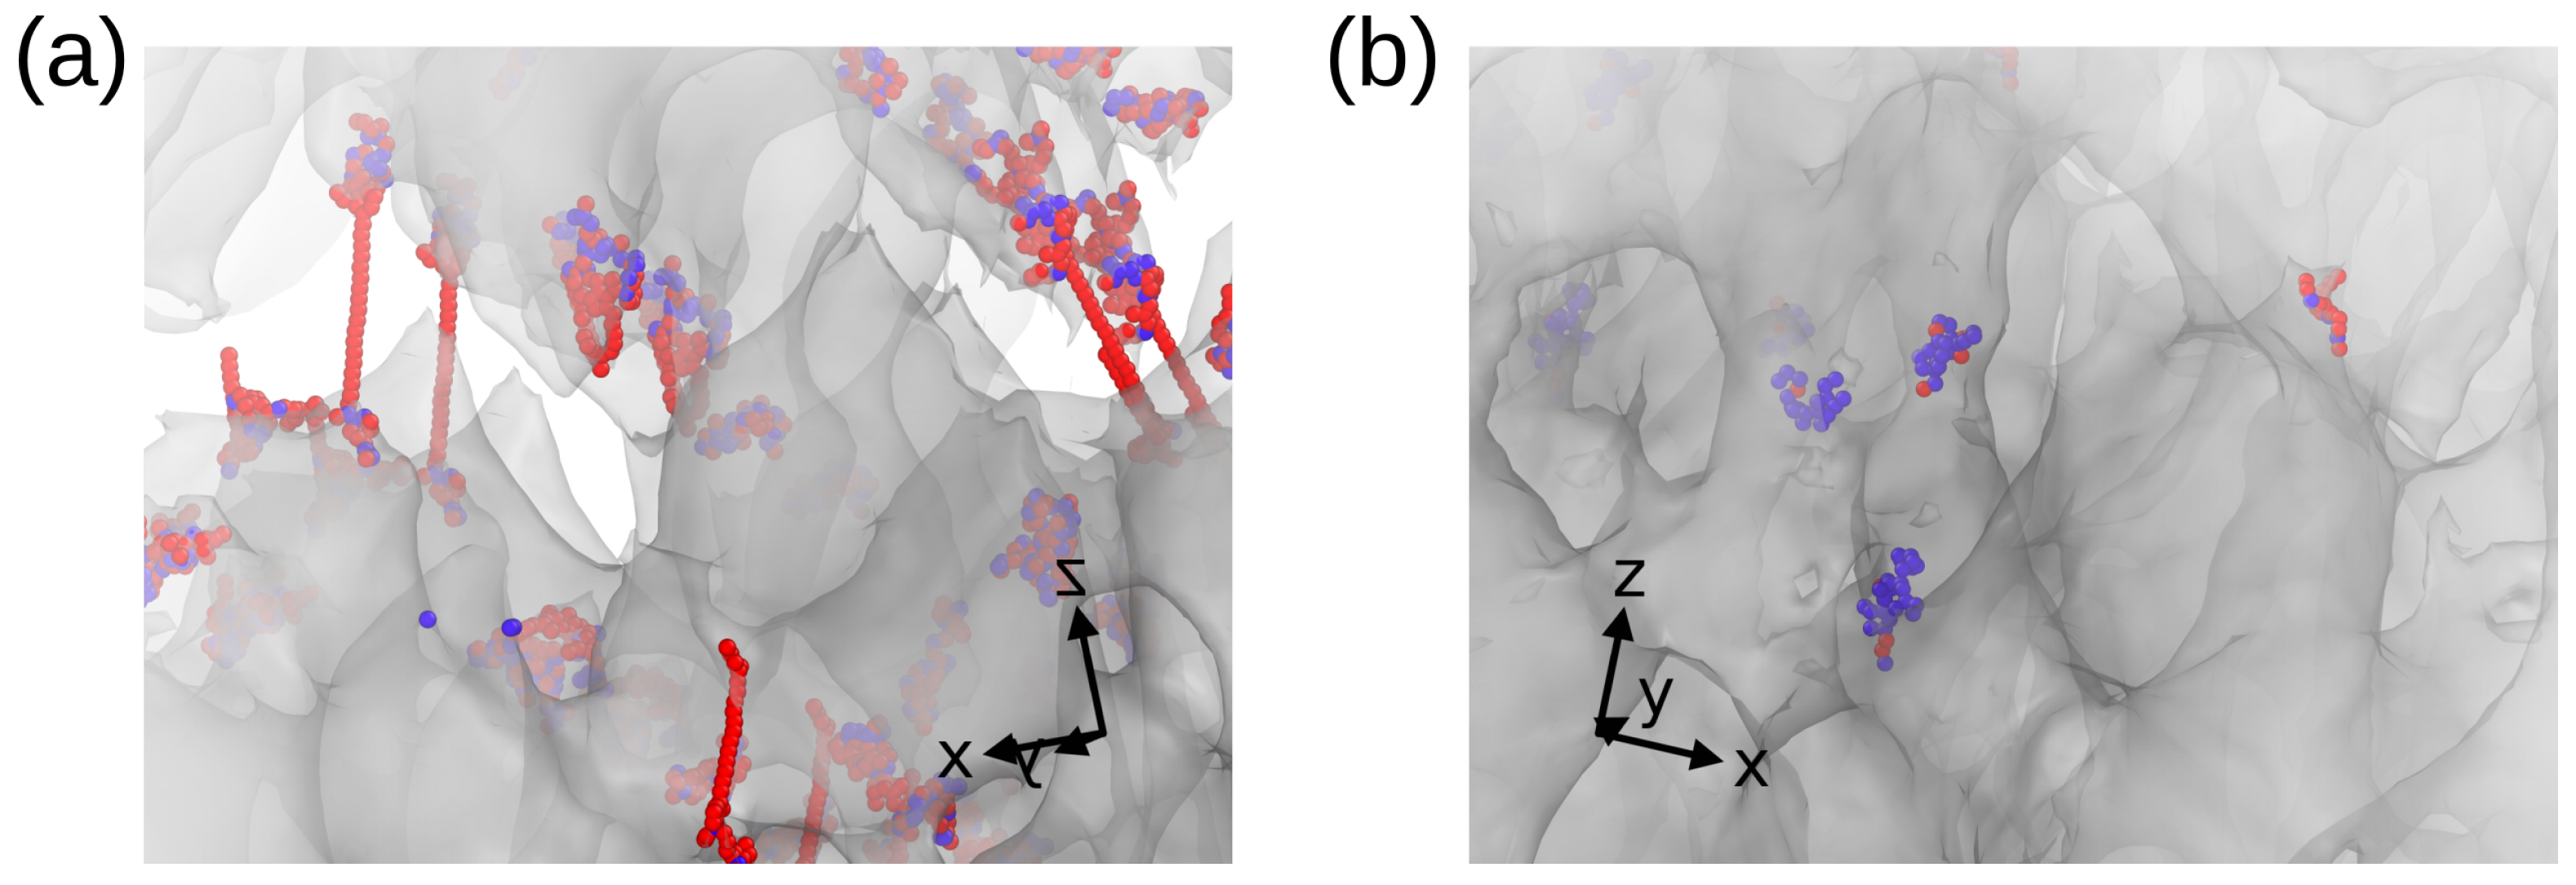
Plastic Deformation
4. Conclusions
Supplementary Materials
Author Contributions
Funding
Data Availability Statement
Acknowledgments
Conflicts of Interest
References
- Chandrasekaran, S.; Campbell, P.G.; Baumann, T.F.; Worsley, M.A. Carbon aerogel evolution: Allotrope, graphene-inspired, and 3D-printed aerogels. J. Mater. Res. 2017, 32, 4166–4185. [Google Scholar] [CrossRef]
- Jun, S.; Joo, S.H.; Ryoo, R.; Kruk, M.; Jaroniec, M.; Liu, Z.; Ohsuna, T.; Terasaki, O. Synthesis of new, nanoporous carbon with hexagonally ordered mesostructure. J. Am. Chem. Soc. 2000, 122, 10712–10713. [Google Scholar] [CrossRef]
- Manandhar, S.; Roder, P.B.; Hanson, J.L.; Lim, M.; Smith, B.E.; Mann, A.; Pauzauskie, P.J. Rapid sol–gel synthesis of nanodiamond aerogel. J. Mater. Res. 2014, 29, 2905–2911. [Google Scholar] [CrossRef]
- Shen, Y.; Du, A.; Wu, X.L.; Li, X.G.; Shen, J.; Zhou, B. Low-cost carbon nanotube aerogels with varying and controllable density. J. Sol-Gel Sci. Technol. 2016, 79, 76–82. [Google Scholar] [CrossRef]
- Tang, J.; Liu, J.; Torad, N.L.; Kimura, T.; Yamauchi, Y. Tailored design of functional nanoporous carbon materials toward fuel cell applications. Nano Today 2014, 9, 305–323. [Google Scholar] [CrossRef]
- Huang, X.; Qian, K.; Yang, J.; Zhang, J.; Li, L.; Yu, C.; Zhao, D. Functional nanoporous graphene foams with controlled pore sizes. Adv. Mater. 2012, 24, 4419–4423. [Google Scholar] [CrossRef]
- Wei, W.; Yang, S.; Zhou, H.; Lieberwirth, I.; Feng, X.; Müllen, K. 3D graphene foams cross-linked with pre-encapsulated Fe3O4 nanospheres for enhanced lithium storage. Adv. Mater. 2013, 25, 2909–2914. [Google Scholar] [CrossRef]
- Narayan, R.J.; Jin, C.; Menegazzo, N.; Mizaikoff, B.; Gerhardt, R.A.; Andara, M.; Agarwal, A.; Shih, C.C.; Shih, C.M.; Lin, S.J.; et al. Nanoporous hard carbon membranes for medical applications. J. Nanosci. Nanotechnol. 2007, 7, 1486–1493. [Google Scholar] [CrossRef]
- Lan, J.; Cao, D.; Wang, W.; Ben, T.; Zhu, G. High-capacity hydrogen storage in porous aromatic frameworks with diamond-like structure. J. Phys. Chem. Lett. 2010, 1, 978–981. [Google Scholar] [CrossRef]
- Hu, N.; Li, H.; Wei, Q.; Zhou, K.; Zhu, W.; Zhang, L.; Li, S.; Ye, W.; Jiao, Z.; Luo, J.; et al. Continuous diamond-carbon nanotube foams as rapid heat conduction channels in composite phase change materials based on the stable hierarchical structure. Compos. Part B Eng. 2020, 200, 108293. [Google Scholar] [CrossRef]
- Letellier, M.; Delgado-Sanchez, C.; Khelifa, M.; Fierro, V.; Celzard, A. Mechanical properties of model vitreous carbon foams. Carbon 2017, 116, 562–571. [Google Scholar] [CrossRef]
- Wang, Y.; Zhang, X.; Li, Z.; Gao, H.; Li, X. Achieving the theoretical limit of strength in shell-based carbon nanolattices. Proc. Natl. Acad. Sci. USA 2022, 119, e2119536119. [Google Scholar] [CrossRef]
- Zhang, X.; Vyatskikh, A.; Gao, H.; Greer, J.R.; Li, X. Lightweight, flaw-tolerant, and ultrastrong nanoarchitected carbon. Proc. Natl. Acad. Sci. USA 2019, 116, 6665–6672. [Google Scholar] [CrossRef]
- Nomura, K.; Nishihara, H.; Yamamoto, M.; Gabe, A.; Ito, M.; Uchimura, M.; Nishina, Y.; Tanaka, H.; Miyahara, M.T.; Kyotani, T. Force-driven reversible liquid–gas phase transition mediated by elastic nanosponges. Nat. Commun. 2019, 10, 2559. [Google Scholar] [CrossRef]
- Pauzauskie, P.J.; Crowhurst, J.C.; Worsley, M.A.; Laurence, T.A.; Kilcoyne, A.D.; Wang, Y.; Willey, T.M.; Visbeck, K.S.; Fakra, S.C.; Evans, W.J.; et al. Synthesis and characterization of a nanocrystalline diamond aerogel. Proc. Natl. Acad. Sci. USA 2011, 108, 8550–8553. [Google Scholar] [CrossRef]
- Zhu, L.; Yao, M.; Dong, J.; Hu, K.; Liu, R.; Gong, C.; Wang, Y.; Liu, B. Direct conversion of graphene aerogel into low-density diamond aerogel composed of ultrasmall nanocrystals. J. Phys. Chem. C 2018, 122, 13193–13198. [Google Scholar] [CrossRef]
- Honda, K.; Rao, T.N.; Tryk, D.; Fujishima, A.; Watanabe, M.; Yasui, K.; Masuda, H. Electrochemical characterization of the nanoporous honeycomb diamond electrode as an electrical double-layer capacitor. J. Electrochem. Soc. 2000, 147, 659. [Google Scholar] [CrossRef]
- Ye, W.; Wei, Q.; Zhang, L.; Li, H.; Luo, J.; Ma, L.; Deng, Z.; Lin, C.T.; Zhou, K. Macroporous diamond foam: A novel design of 3D interconnected heat conduction network for thermal management. Mater. Des. 2018, 156, 32–41. [Google Scholar] [CrossRef]
- Mora-Barzaga, G.; Valencia, F.J.; Carrasco, M.I.; González, R.I.; Parlanti, M.G.; Miranda, E.N.; Bringa, E.M. Enhancing the Thermal Conductivity of Amorphous Carbon with Nanowires and Nanotubes. Nanomaterials 2022, 12, 2835. [Google Scholar] [CrossRef]
- Frese, N.; Taylor Mitchell, S.; Bowers, A.; Gölzhäuser, A.; Sattler, K. Diamond-like carbon nanofoam from low-temperature hydrothermal carbonization of a sucrose/naphthalene precursor solution. J. Carbon Res. 2017, 3, 23. [Google Scholar] [CrossRef]
- Rode, A.V.; Gamaly, E.G.; Luther-Davies, B. Formation of cluster-assembled carbon nano-foam by high-repetition-rate laser ablation. Appl. Phys. A 2000, 70, 135–144. [Google Scholar] [CrossRef]
- Arčon, D.; Jagličič, Z.; Zorko, A.; Rode, A.V.; Christy, A.; Madsen, N.; Gamaly, E.G.; Luther-Davies, B. Origin of magnetic moments in carbon nanofoam. Phys. Rev. B 2006, 74, 014438. [Google Scholar] [CrossRef]
- Charitidis, C. Nanomechanical and nanotribological properties of carbon-based thin films: A review. Int. J. Refract. Met. Hard Mater. 2010, 28, 51–70. [Google Scholar] [CrossRef]
- Valencia, F.J.; Santiago, J.; González, R.I.; González-Arrabal, R.; Ruestes, C.; Díaz, M.P.; Monclus, M.A.; Molina-Aldareguia, J.; Nuñez, P.D.; Munoz, F.; et al. Nanoindentation of Amorphous Carbon: A combined experimental and simulation approach. Acta Mater. 2021, 203, 116485. [Google Scholar] [CrossRef]
- Logothetidis, S.; Kassavetis, S.; Charitidis, C.; Panayiotatos, Y.; Laskarakis, A. Nanoindentation studies of multilayer amorphous carbon films. Carbon 2004, 42, 1133–1136. [Google Scholar] [CrossRef]
- Cui, Y.; Ma, J.; Wang, T.; Yan, B.; Qi, H.; Cai, Y.; Zhang, D.; Tian, Y.; Jaffery, S.H.I. Synergistic friction-reducing and anti-wear behaviors of DLC on NCD films via in-situ synthesis by fs laser ablation. Surf. Coatings Technol. 2021, 409, 126947. [Google Scholar] [CrossRef]
- Paul, R.; Das, S.; Dalui, S.; Gayen, R.; Roy, R.; Bhar, R.; Pal, A. Synthesis of DLC films with different sp2/sp3 ratios and their hydrophobic behaviour. J. Phys. D Appl. Phys. 2008, 41, 055309. [Google Scholar] [CrossRef]
- Yang, W.; Mao, S.; Yang, J.; Shang, T.; Song, H.; Mabon, J.; Swiech, W.; Vance, J.R.; Yue, Z.; Dillon, S.J.; et al. Large-deformation and high-strength amorphous porous carbon nanospheres. Sci. Rep. 2016, 6, 24187. [Google Scholar] [CrossRef]
- Yang, W.; Yang, J.; Dong, Y.; Mao, S.; Gao, Z.; Yue, Z.; Dillon, S.J.; Xu, H.; Xu, B. Probing buckling and post-buckling deformation of hollow amorphous carbon nanospheres: In-situ experiment and theoretical analysis. Carbon 2018, 137, 411–418. [Google Scholar] [CrossRef]
- Şopu, D.; Soyarslan, C.; Sarac, B.; Bargmann, S.; Stoica, M.; Eckert, J. Structure-property relationships in nanoporous metallic glasses. Acta Mater. 2016, 106, 199–207. [Google Scholar] [CrossRef]
- Wang, C.; Li, Z.; Zhu, S.; Liang, Y.; Cui, Z.; Wu, S.; Qin, C.; Luo, S.; Inoue, A. Dual-phase nanostructuring as a route to flexible nanoporous metals with outstanding comprehensive mechanical properties. Sci. China Mater. 2021, 64, 2289–2304. [Google Scholar] [CrossRef]
- Chae, K.; Shi, Y.; Huang, L. Nanocasting of hierarchical nanostructured porous carbon in molecular dynamics simulation. J. Mater. Chem. A 2013, 1, 3886–3894. [Google Scholar] [CrossRef]
- Pedrielli, A.; Taioli, S.; Garberoglio, G.; Pugno, N.M. Designing graphene based nanofoams with nonlinear auxetic and anisotropic mechanical properties under tension or compression. Carbon 2017, 111, 796–806. [Google Scholar] [CrossRef]
- Degirmenci, U.; Kirca, M. Design and mechanical characterization of a novel carbon-based hybrid foam: A molecular dynamics study. Comput. Mater. Sci. 2018, 154, 122–131. [Google Scholar] [CrossRef]
- Degirmenci, U.; Kirca, M. Carbon-based nano lattice hybrid structures: Mechanical and thermal properties. Phys. E Low-Dimens. Syst. Nanostructures 2022, 144, 115392. [Google Scholar]
- Pedrielli, A.; Taioli, S.; Garberoglio, G.; Pugno, N.M. Mechanical and thermal properties of graphene random nanofoams via molecular dynamics simulations. Carbon 2018, 132, 766–775. [Google Scholar] [CrossRef]
- Liu, S.; Duan, K.; Feng, J.; Li, L.; Wang, X.; Hu, Y.; Qin, Z. The design of strongly bonded nanoarchitected carbon materials for high specific strength and modulus. Carbon 2022, 195, 387–394. [Google Scholar] [CrossRef]
- Tangarife, E.; Gonzalez, R.; Cardenas, C.; Bringa, E.; Munoz, F. Molecular simulations of carbon allotropes in processes with creation and destruction of chemical bonds. Carbon 2019, 144, 177–184. [Google Scholar]
- Marks, N.A. Generalizing the environment-dependent interaction potential for carbon. Phys. Rev. B 2000, 63, 035401. [Google Scholar] [CrossRef]
- Plimpton, S. Fast parallel algorithms for short-range molecular dynamics. J. Comput. Phys. 1995, 117, 1–19. [Google Scholar] [CrossRef]
- Pastewka, L.; Klemenz, A.; Gumbsch, P.; Moseler, M. Screened empirical bond-order potentials for Si-C. Phys. Rev. B 2013, 87, 205410. [Google Scholar] [CrossRef]
- Perriot, R.; Gu, X.; Lin, Y.; Zhakhovsky, V.V.; Oleynik, I.I. Screened environment-dependent reactive empirical bond-order potential for atomistic simulations of carbon materials. Phys. Rev. B 2013, 88, 064101. [Google Scholar] [CrossRef]
- Tersoff, J. Empirical interatomic potential for carbon, with applications to amorphous carbon. Phys. Rev. Lett. 1988, 61, 2879. [Google Scholar] [CrossRef] [PubMed]
- de Tomas, C.; Aghajamali, A.; Jones, J.L.; Lim, D.J.; Lopez, M.J.; Suarez-Martinez, I.; Marks, N.A. Transferability in interatomic potentials for carbon. Carbon 2019, 155, 624–634. [Google Scholar] [CrossRef]
- Gayk, F.; Ehrens, J.; Heitmann, T.; Vorndamme, P.; Mrugalla, A.; Schnack, J. Young’s moduli of carbon materials investigated by various classical molecular dynamics schemes. Phys. E Low-Dimens. Syst. Nanostruct. 2018, 99, 215–219. [Google Scholar] [CrossRef]
- Marks, N.A.; Cooper, N.; McKenzie, D.; McCulloch, D.; Bath, P.; Russo, S. Comparison of density-functional, tight-binding, and empirical methods for the simulation of amorphous carbon. Phys. Rev. B 2002, 65, 075411. [Google Scholar] [CrossRef]
- de Tomas, C.; Suarez-Martinez, I.; Marks, N.A. Graphitization of amorphous carbons: A comparative study of interatomic potentials. Carbon 2016, 109, 681–693. [Google Scholar] [CrossRef]
- Soyarslan, C.; Bargmann, S.; Pradas, M.; Weissmüller, J. 3D stochastic bicontinuous microstructures: Generation, topology and elasticity. Acta Mater. 2018, 149, 326–340. [Google Scholar] [CrossRef]
- Farkas, D.; Caro, A.; Bringa, E.; Crowson, D. Mechanical response of nanoporous gold. Acta Mater. 2013, 61, 3249–3256. [Google Scholar] [CrossRef]
- Voyiadjis, G.Z.; Saffarini, M.H.; Ruestes, C.J. Characterization of the strain rate effect under uniaxial loading for nanoporous gold. Comput. Mater. Sci. 2021, 194, 110425. [Google Scholar] [CrossRef]
- Aparicio, E.; Tangarife, E.; Munoz, F.; Gonzalez, R.; Valencia, F.; Careglio, C.; Bringa, E.M. Simulated mechanical properties of finite-size graphene nanoribbons. Nanotechnology 2020, 32, 045709. [Google Scholar] [CrossRef]
- Stukowski, A. Visualization and analysis of atomistic simulation data with OVITO–the Open Visualization Tool. Model. Simul. Mater. Sci. Eng. 2009, 18, 015012. [Google Scholar] [CrossRef]
- Aparicio, E.; Millán, E.N.; Ruestes, C.J.; Bringa, E.M. FoamExplorer: Automated measurement of ligaments and voids for atomistic systems. Comput. Mater. Sci. 2020, 185, 109942. [Google Scholar] [CrossRef]
- Li, W.; Feng, L.; Shi, X.; Wang, Y. Mechanical and Electromagnetic Shielding Properties of Carbon Foam. Adv. Eng. Mater. 2021, 23, 2100452. [Google Scholar] [CrossRef]
- Caicedo, J.; Ramirez-Malule, H.; Aperador, W. Mechanical properties evolution in carbon foams obtained from Guadua angustifolia. Diam. Relat. Mater. 2020, 107, 107901. [Google Scholar] [CrossRef]
- Zhang, Y.; Xian, Y.; Li, J.; Ding, S.; Liu, S.; Xia, R. Atomistic investigation on the mechanical properties of 3D nanoporous metallic glasses under uniaxial tension and compression. Mater. Today Commun. 2021, 27, 102460. [Google Scholar] [CrossRef]
- Gunkelmann, N.; Bringa, E.M.; Rosandi, Y. Molecular dynamics simulations of aluminum foams under tension: Influence of oxidation. J. Phys. Chem. C 2018, 122, 26243–26250. [Google Scholar] [CrossRef]
- He, H.; Thorpe, M.F. Elastic properties of glasses. Phys. Rev. Lett. 1985, 54, 2107. [Google Scholar] [CrossRef]
- Li, J.; Xian, Y.; Zhou, H.; Wu, R.; Hu, G.; Xia, R. Microstructure-sensitive mechanical properties of nanoporous gold: A molecular dynamics study. Model. Simul. Mater. Sci. Eng. 2018, 26, 075003. [Google Scholar] [CrossRef]
- Vidable, G.G.; Gonzalez, R.; Valencia, F.; Amigo, N.; Tramontina, D.; Bringa, E. Simulations of plasticity in diamond nanoparticles showing ultrahigh strength. Diam. Relat. Mater. 2022, 126, 109109. [Google Scholar] [CrossRef]
- Bauer, J.; Schroer, A.; Schwaiger, R.; Kraft, O. Approaching theoretical strength in glassy carbon nanolattices Simulations of plasticity in diamond nanoparticles showing ultrahigh. Nat. Matter. 2016, 15, 438. [Google Scholar] [CrossRef] [PubMed]


| 10.8 | 0.742 |
| 13.9 | 0.790 |
| 15.4 | 0.811 |
| 17.9 | 0.846 |
| 22.3 | 0.901 |
| 34.7 | 1.029 |
| 41.8 | 1.095 |
| 49.1 | 1.152 |
| Elastic Constant | Fitting Parameters | |
|---|---|---|
| E | GPa | 4.42 |
| GPa | 1.93 |
Disclaimer/Publisher’s Note: The statements, opinions and data contained in all publications are solely those of the individual author(s) and contributor(s) and not of MDPI and/or the editor(s). MDPI and/or the editor(s) disclaim responsibility for any injury to people or property resulting from any ideas, methods, instructions or products referred to in the content. |
© 2023 by the authors. Licensee MDPI, Basel, Switzerland. This article is an open access article distributed under the terms and conditions of the Creative Commons Attribution (CC BY) license (https://creativecommons.org/licenses/by/4.0/).
Share and Cite
Castillo-Castro, D.; Correa, F.; Aparicio, E.; Amigo, N.; Prada, A.; Figueroa, J.; González, R.I.; Bringa, E.; Valencia, F.J. Nanoporous Amorphous Carbon with Exceptional Ultra-High Strength. Nanomaterials 2023, 13, 1429. https://doi.org/10.3390/nano13081429
Castillo-Castro D, Correa F, Aparicio E, Amigo N, Prada A, Figueroa J, González RI, Bringa E, Valencia FJ. Nanoporous Amorphous Carbon with Exceptional Ultra-High Strength. Nanomaterials. 2023; 13(8):1429. https://doi.org/10.3390/nano13081429
Chicago/Turabian StyleCastillo-Castro, Daniel, Felipe Correa, Emiliano Aparicio, Nicolás Amigo, Alejandro Prada, Juan Figueroa, Rafael I. González, Eduardo Bringa, and Felipe J. Valencia. 2023. "Nanoporous Amorphous Carbon with Exceptional Ultra-High Strength" Nanomaterials 13, no. 8: 1429. https://doi.org/10.3390/nano13081429