Article

Novel Sol-Gel Route to Prepare Eu3+-Doped 80SiO2-20NaGdF4 Oxyfluoride Glass-Ceramic for Photonic Device Applications

1
Instituto de Cerámica y Vidrio, CSIC, 28049, Madrid, Spain
2
IFN-CNR CSMFO Laboratory and FBK Photonics Unit, Via alla Cascata 56/C Povo, 38123 Trento, Italy
3
Department of Physics, Politecnico di Milano, Piazza Leonardo da Vinci 32, 20133 Milano, Italy
4
Department of Materials Technology, Faculty of Applied Science, Ho Chi Minh City University of Technology and Education, Vo Van Ngan Street 1, Thu Duc District, 720214 Ho Chi Minh City, Vietnam
5
Donostia International Physics Center (DIPC), 20018 San Sebastian, Spain
6
Department Física Aplicada, Escuela Superior de Ingeniería, Universidad del País Vasco (UPV-EHU), 48013 Bilbao, Spain
7
Centro de Física de Materiales, (CSIC-UPV/EHU), 20018 San Sebastian, Spain
*
Author to whom correspondence should be addressed.
Nanomaterials 2023, 13(5), 940; https://doi.org/10.3390/nano13050940
Submission received: 31 January 2023 / Revised: 1 March 2023 / Accepted: 3 March 2023 / Published: 5 March 2023

Abstract

:
Oxyfluoride glass-ceramics (OxGCs) with the molar composition 80SiO2-20(1.5Eu3+: NaGdF4) were prepared with sol-gel following the “pre-crystallised nanoparticles route” with promising optical results. The preparation of 1.5 mol % Eu3+-doped NaGdF4 nanoparticles, named 1.5Eu3+: NaGdF4, was optimised and characterised using XRD, FTIR and HRTEM. The structural characterisation of 80SiO2-20(1.5Eu3+: NaGdF4) OxGCs prepared from these nanoparticles’ suspension was performed by XRD and FTIR revealing the presence of hexagonal and orthorhombic NaGdF4 crystalline phases. The optical properties of both nanoparticles’ phases and the related OxGCs were studied by measuring the emission and excitation spectra together with the lifetimes of the 5D0 state. The emission spectra obtained by exciting the Eu3+-O2− charge transfer band showed similar features in both cases corresponding the higher emission intensity to the 5D07F2 transition that indicates a non-centrosymmetric site for Eu3+ ions. Moreover, time-resolved fluorescence line-narrowed emission spectra were performed at a low temperature in OxGCs to obtain information about the site symmetry of Eu3+ in this matrix. The results show that this processing method is promising for preparing transparent OxGCs coatings for photonic applications.

1. Introduction

The development of transparent glass-ceramics (GC) has drawn the attention of numerous researchers, and they have been extensively studied due to their important optical applications [1]. GCs can be used for light-emitting diodes, solar cells, sensing catalysis or in biomedical materials [2,3]. Particularly, when fluoride nanocrystals smaller than 40 nm are dispersed in an oxide glass matrix, the resulting materials are transparent GCs, called oxyfluoride glass-ceramics (OxGCs), which have attractive properties [4]. These materials are transparent from the visible to near-infrared region and are compatible with new optical devices for communications or sensors. Furthermore, OxGCs retain the most relevant properties of glasses—good mechanical and thermal stability—and present properties characteristic of fluoride crystals as an effective optical media for light propagation and luminescence enhancement, and a high linear and nonlinear refractive index [5,6,7,8]. The crystal structure of fluorides as hosts of RE ions reduces the probabilities of multiphonon relaxation, resulting in high luminescence efficiencies [9,10,11,12]. Thus, the efficiency of the emission, optical transmission and spectra profile can be modified depending on the fluoride phase and the dopant. Among fluoride nanoparticles, those with the formula ALnF4 (where A is an alkaline element and Ln a lanthanide) have become more attractive in comparison to other fluorides due to their lowest phonon energies and wide band gap (9–10 eV) [13]. Particularly, NaGdF4 nanoparticles have been prepared both in cubic (α-phase) and hexagonal (β-phase). Thoma, B.R.E. et al. [14] reported the influence of a precursors ratio to prepare either a cubic or hexagonal phase, and later, You, F. et al. [15] presented the lattice parameters of both phases and studied the optical behaviour of the Eu3+-doped nanoparticles with promising results. In the last decade, many authors reported the preparation of RE-doped NaGdF4 nanoparticles and their luminescent properties, showing their excellent behaviour for both down and up conversion processes [16,17,18]. Oxyfluoride glass-ceramics with NaGdF4 have also been prepared using a melting-quenching process (MQ) [19]. The preparation of GCs via MQ requires the melting of inorganic raw materials at high temperatures (1400 °C–1700 °C) followed by a controlled heat treatment for generating precipitation and crystal growth. In 2013, Herrmann, A. et al. [20] obtained the NaGdF4 in cubic and hexagonal phases by heat treatment at 750 °C. One of the limitations of the MQ process is the low maximum amount of active phase that can be obtained due to the volatilisation of fluorides at the high temperatures needed in the process. In addition, in many cases, MQ materials require very long heat treatments (3 h–80 h) to reach the desired crystallisation. Moreover, OxGCs prepared by MQ are usually bulk materials, and this processing method is not suitable for preparing coatings [20,21,22,23].
Sol-gel (SG) appeared as an alternative method, emphasised in the chemistry of the process, to avoid the drawbacks of MQ [24,25,26]. It is a favourable process through which highly homogeneous materials can be obtained at low temperatures (<500 °C) [27,28]. Furthermore, various material forms, e.g., bulks, powders and coatings, can be processed through the hydrolysis and polycondensation of metal alkoxide precursors, such as tetraethyl orthosilicate (TEOS) in a solvent, typically alcohol. Sol-gel allows us to control the structures in the molecular scale of the materials throughout the whole process, allowing for the preparation of highly homogeneous materials [29].
In 2019, Velázquez, J.J. et al. [13] reported the preparation of novel transparent OxGCs with NaGdF4 using the sol-gel technique. The authors reported the precipitation of β-NaGdF4 crystals through the heat treatment of a sol prepared in two steps, commonly called the TFA route [30]. In this case, silica precursors are mixed with a solution of rare-earth precursors in TFA, followed by a controlled heat treatment. The optical results obtained showed an efficient energy transfer from Gd3+ to Eu3+ as well as comparable lifetime values compared with the literature. Nevertheless, the OxGCs materials prepared using the TFA route are limited to transparent self-supported layers and powders. Although transparent and homogeneous OxGCs coatings were prepared using the TFA route, the densification of the films occurred during the heat treatment and concurrently with the crystallisation process, resulting in crystals that were too small, with sizes below 3 nm. The emission spectra of these OxGCs coatings revealed that rare-earth ions were located in an amorphous environment, suggesting that they were not successfully incorporated into the crystals, probably due to their small size [31].
In 2020, the GlaSS group from the Instituto de Cerámica y Vidrio (CSIC) reported an alternative route, labelled as the “pre-crystallised nanoparticles route” [30], based on the previous synthesis of crystalline fluoride nanoparticle aqueous suspensions that are subsequently incorporated into a silica sol [32]. Using this method, it is possible to control the morphology and size of the nanocrystals before their incorporation into the silica matrix. In a previous work, Cruz et al. [32] reported the preparation of Nd3+-doped 80SiO2-20LaF3 oxyfluoride glass-ceramic powders via the pre-crystallised nanoparticles route with encouraging photonic results. The authors studied the stability of the LaF3 nanoparticles in the silica matrix before and after the heat treatment at 450 °C, reporting the best luminescence results after the heat treatment when organics are eliminated. The optical characterisation of the OxGCs powders was also reported, with similar lifetimes to those for nanoparticles. Later, the GlaSS group reported the preparation of OxGCs coatings with the composition Nd3+-doped 80SiO2-20LaF3, obtaining a bulk-like lifetime value of 440 µs [33].
A key point of the “pre-crystallised nanoparticles route” is the processing of the fluoride nanoparticle suspensions. Some authors reported the preparation of NaGdF4 nanoparticle suspensions [34,35,36,37]. In 2004, Mech et al. [38] stated for the first time the preparation via hydrothermal synthesis of Eu3+-doped NaGdF4 and KGdF4 nanoparticles [38,39]. They prepared the nanoparticles by mixing the rare-earth oxides in a hydrochloric acid solution with further incorporation of sodium fluoride. The results were auspicious, showing good optical properties, with sharp and well-defined peaks for Eu3+ emissions through the excitation of Gd3+. Later, Sudheendra, L. et al. [40] described the preparation of Eu3+-doped NaGdF4 using a sodium citrate solution, indicating that the Gd3+-Eu3+ host–dopant couple is the best system for down-conversion after UV excitation as the emission energy transition within Gd3+ can resonantly couple to the excited state of Eu3+ ions. The authors demonstrated that in Eu3+-doped NaGdF4 nanoparticles, the emission of the hexagonal phase is 25% more intense than those of the cubic structure. Although different papers reported the preparation of powdered NaGdF4 nanoparticles via hydrothermal synthesis in an autoclave controlling the pressure and temperature [40,41,42], only a few papers have reported the use of this process to obtain aqueous nanoparticle suspensions to control the morphology of the nanoparticles.
The objective of this work was the preparation and characterisation of optically active oxyfluoride glass-ceramics through the incorporation of Eu3+-doped NaGdF4 nanoparticle aqueous suspensions into a silica sol. In this work, powdered glass-ceramics were prepared, and the suitability of this processing method to prepare transparent OxGCs was demonstrated. This is a promising method for preparing transparent coatings and overcoming the drawbacks of the traditional melting-quenching method. Moreover, the selection of Eu3+ ions as a dopant is due to its excellent properties as a local probe, providing important information on the environmental structure where it is located [43].

2. Materials and Methods

2.1. Synthesis of 1.5Eu3+: NaGdF4 Aqueous Suspensions

Nanoparticle suspensions of NaGdF4 undoped and doped with 1.5 mol. % Eu3+ were prepared by mixing gadolinium nitrate (Gd (NO3)3, Merk) with europium acetate (Eu(CH3CO2)3, Merk) in a molar ratio of 1Gd(NO3)3: 0.015Eu(CH3CO2)3 with 20 mL of water at room temperature to obtain a homogeneous solution. After 30 min of stirring, 1 g of sodium fluoride (NaF, Merk) was incorporated into the solution, before stirring for another 15 min at room temperature. The final solution was transferred to a Teflon cup and put into a stainless-steel autoclave, heated up to 180 °C and maintained for 20 h and 24 h. The suspensions were collected and used directly. The nanoparticles were labelled according to the reaction time: 1.5Eu3+: NaGdF4-20 or 1.5Eu3+: NaGdF4-24.

2.2. Synthesis of OxGCs with Composition 80SiO2-20(1.5Eu3+: NaGdF4)

OxGCs with the composition 80SiO2-20(1.5 Eu3+: NaGdF4) were prepared following the “pre-crystallised nanoparticles route” [30]. First, tetraethyl orthosilicate (TEOS, Sigma Aldrich) and methyl-triethoxysilane (MTES, ABCR) were mixed with a molar ratio of 1TEOS:1MTES, followed by the incorporation of the previously prepared aqueous nanoparticle suspensions, 1.5Eu3+: NaGdF4-24, to reach a final molar relation of 80SiO2-20(1.5 Eu3+: NaGdF4). After the incorporation of the nanoparticle suspensions, concentrated hydrochloric acid (HCl, Sigma Aldrich) was added under vigorous stirring to catalyse the hydrolysis and condensation reactions. The solution was immersed in an ice bath for 2 min to stop the reaction. After that, the sol was stirred for 15 min at room temperature. Finally, absolute ethanol was used to dilute the final sol up to a final concentration of 171 g L−1.

2.3. Characterisation of 1.5Eu3+: NaGdF4 Aqueous Suspensions

1.5Eu3+: NaGdF4-20 and 1.5Eu3+: NaGdF4-24 suspensions were centrifuged at 6000 rpm for 5 min, and the resulting powders were rinsed with deionised water; the rinsing process was repeated three times. The powders were dried at 75 °C overnight, then heat-treated at 450 °C and 550 °C for 5 h in an oven in an air atmosphere and further characterised.
X-ray diffractions were used to characterise the powders of both compositions Eu3+: NaGdF4-20 heat-treated at 450 °C for 5 h and Eu3+: NaGdF4-24 heat-treated at 450 °C and 550 °C for 5 h using an X-ray powder diffractometer (D8 advance, Bruker) with CuKα radiation (λ = 1.5406 A). The diffraction patterns were acquired in the range 10° < 2Ɵ < 70° with a step of 0.03°. The nano-crystalline sizes were calculated by using the Scherrer equation shown in Equation (1).
D hkl = k λ β 2 b 2 cos θ
where Dhkl is the calculated crystallite size, k = 0.94 for spherical crystals, θ is the Bragg angle, β is the full width of the diffraction peak at half maximum intensity (FWHM) and b is the correction of the instrument. The fits were performed using Origin software and the pseudo-Voigt function.
The size was also calculated using the Williamson–Hall (W-H) plot from which the strain broadening was estimated. To perform the W-H plot, the peak width was studied as a function of 2θ degree. The strain () was calculated using Equation (2) for each peak of the XRD pattern. By using the calculated and the Dhkl taken from the Scherrer equation (Equation (1)) for all peaks, a linear regression was generated with its corresponding slope and y-intercept. Considering that the linear regression corresponds to Equation (3), the strain component was calculated from the slope and the crystallite size from the y-intercept [33,34,44].
E = β 4 cos θ
β cos θ = K λ 1 D hkl + 4 E sin θ
Fourier transform infrared spectroscopy (FTIR) spectra of undoped NaGdF4 NPs, 1.5Eu3+: NaGdF4-24 dried at 75 °C overnight and 1.5Eu3+: NaGdF4-24 heat-treated at 450 °C for 5 h were recorded using Perkin–Elmer spectrum 100 FT-IR equipment, in the range of 4000 cm−1–450 cm−1 with a resolution of 4 cm−1.
High-Resolution Transmission Electron Microscopy (HRTEM) was used to characterise 1.5Eu3+: NaGdF4 NPs heat-treated at 450 °C for 5 h. The powder was re-dispersed in ethanol and then dripped onto a carbon-coated copper grid (Lacey Carbon, LC-200-Cu 25/pk). HRTEM images were taken with a HRTEM-JEO 2100 microscope, and the particle size distribution was determined through ImageJ® software, using a maximum of 10 images. The lattice parameters of NaGdF4 were determined using the Image-J source.

2.4. Characterisation of OxGCs with Composition 80SiO2-20(1.5Eu3+: NaGdF4)

The OxGCs with the composition 80SiO2-20(1.5 Eu3+: NaGdF4) was dried at 75 °C overnight and then heat-treated at 450 °C for 5 h.
Structural properties of OxGCs powders were studied using X-ray diffraction (XRD) following the procedure described in Section 2.3. In addition, FTIR spectra of 80SiO2-20(1.5Eu3+: NaGdF4) OxGCs before and after the heat treatment were also performed following the setup described in Section 2.3.

2.5. Optical Characterisation

Room temperature emission and excitation spectra, as well as luminescence decays of 1.5Eu3+: NaGdF4 NPs and OxGCs with the composition 80SiO2-20(1.5Eu3+: NaGdF4), with both powders heat-treated at 450 °C for 5 h, were recorded by using a FS5 fluorescence spectrometer (Edinburg Instruments Ltd., UK) equipped with a 150 W xenon lamp. The lifetime value estimation was performed by fitting the exponential decay. The emission was detected using a Hamamatsu R928P photomultiplier.
The absolute photoluminescence quantum yield (PL QY) measurements were studied by using Hamamatsu Quantaurus-QY C11347-11, utilising an integrated sphere to measure all luminous flux. The excitation source was a 150 W xenon light source. The absolute photoluminescence quantum yield was measured under excitation wavelength λexc = 270 ± 10 nm, and the considered PL range for the QY calculation was from 400 nm to 700 nm. The procedure of each measurement was as follows: (i) measurement of a quartz Petri dish with cap, (ii) measurement of the quartz Petri disk containing the powder with cap, and (iii) calculation of the PL QY, following Equation (4).
PL   QY = Number   of   photons   emitted   as   PL   from   the   sample Number   of   photons   absorbed   by   the   sample
This measurement was repeated 10 times, and the final value of absolute photoluminescence quantum yield was obtained as the average of the 10 measurements.
Resonant time-resolved fluorescence line-narrowed (TRFLN) spectra of the 5D07F0,1,2 transitions of Eu3+ were performed by exciting the OxGCs with the composition 80SiO2-20(1.5Eu3+: NaGdF4) heat-treated at 450 °C for 5 h into the 7F05D0 transition with a pulsed frequency doubled Nd: YAG pumped tuneable dye laser of 9 ns pulsed width and 0.08 cm−1 linewidth and detected by an EGG&PAR Optical Multichannel Analyzer. The measurements were carried out by keeping the sample temperature at 9 K in a closed cycle helium cryostat.

3. Results and Discussion

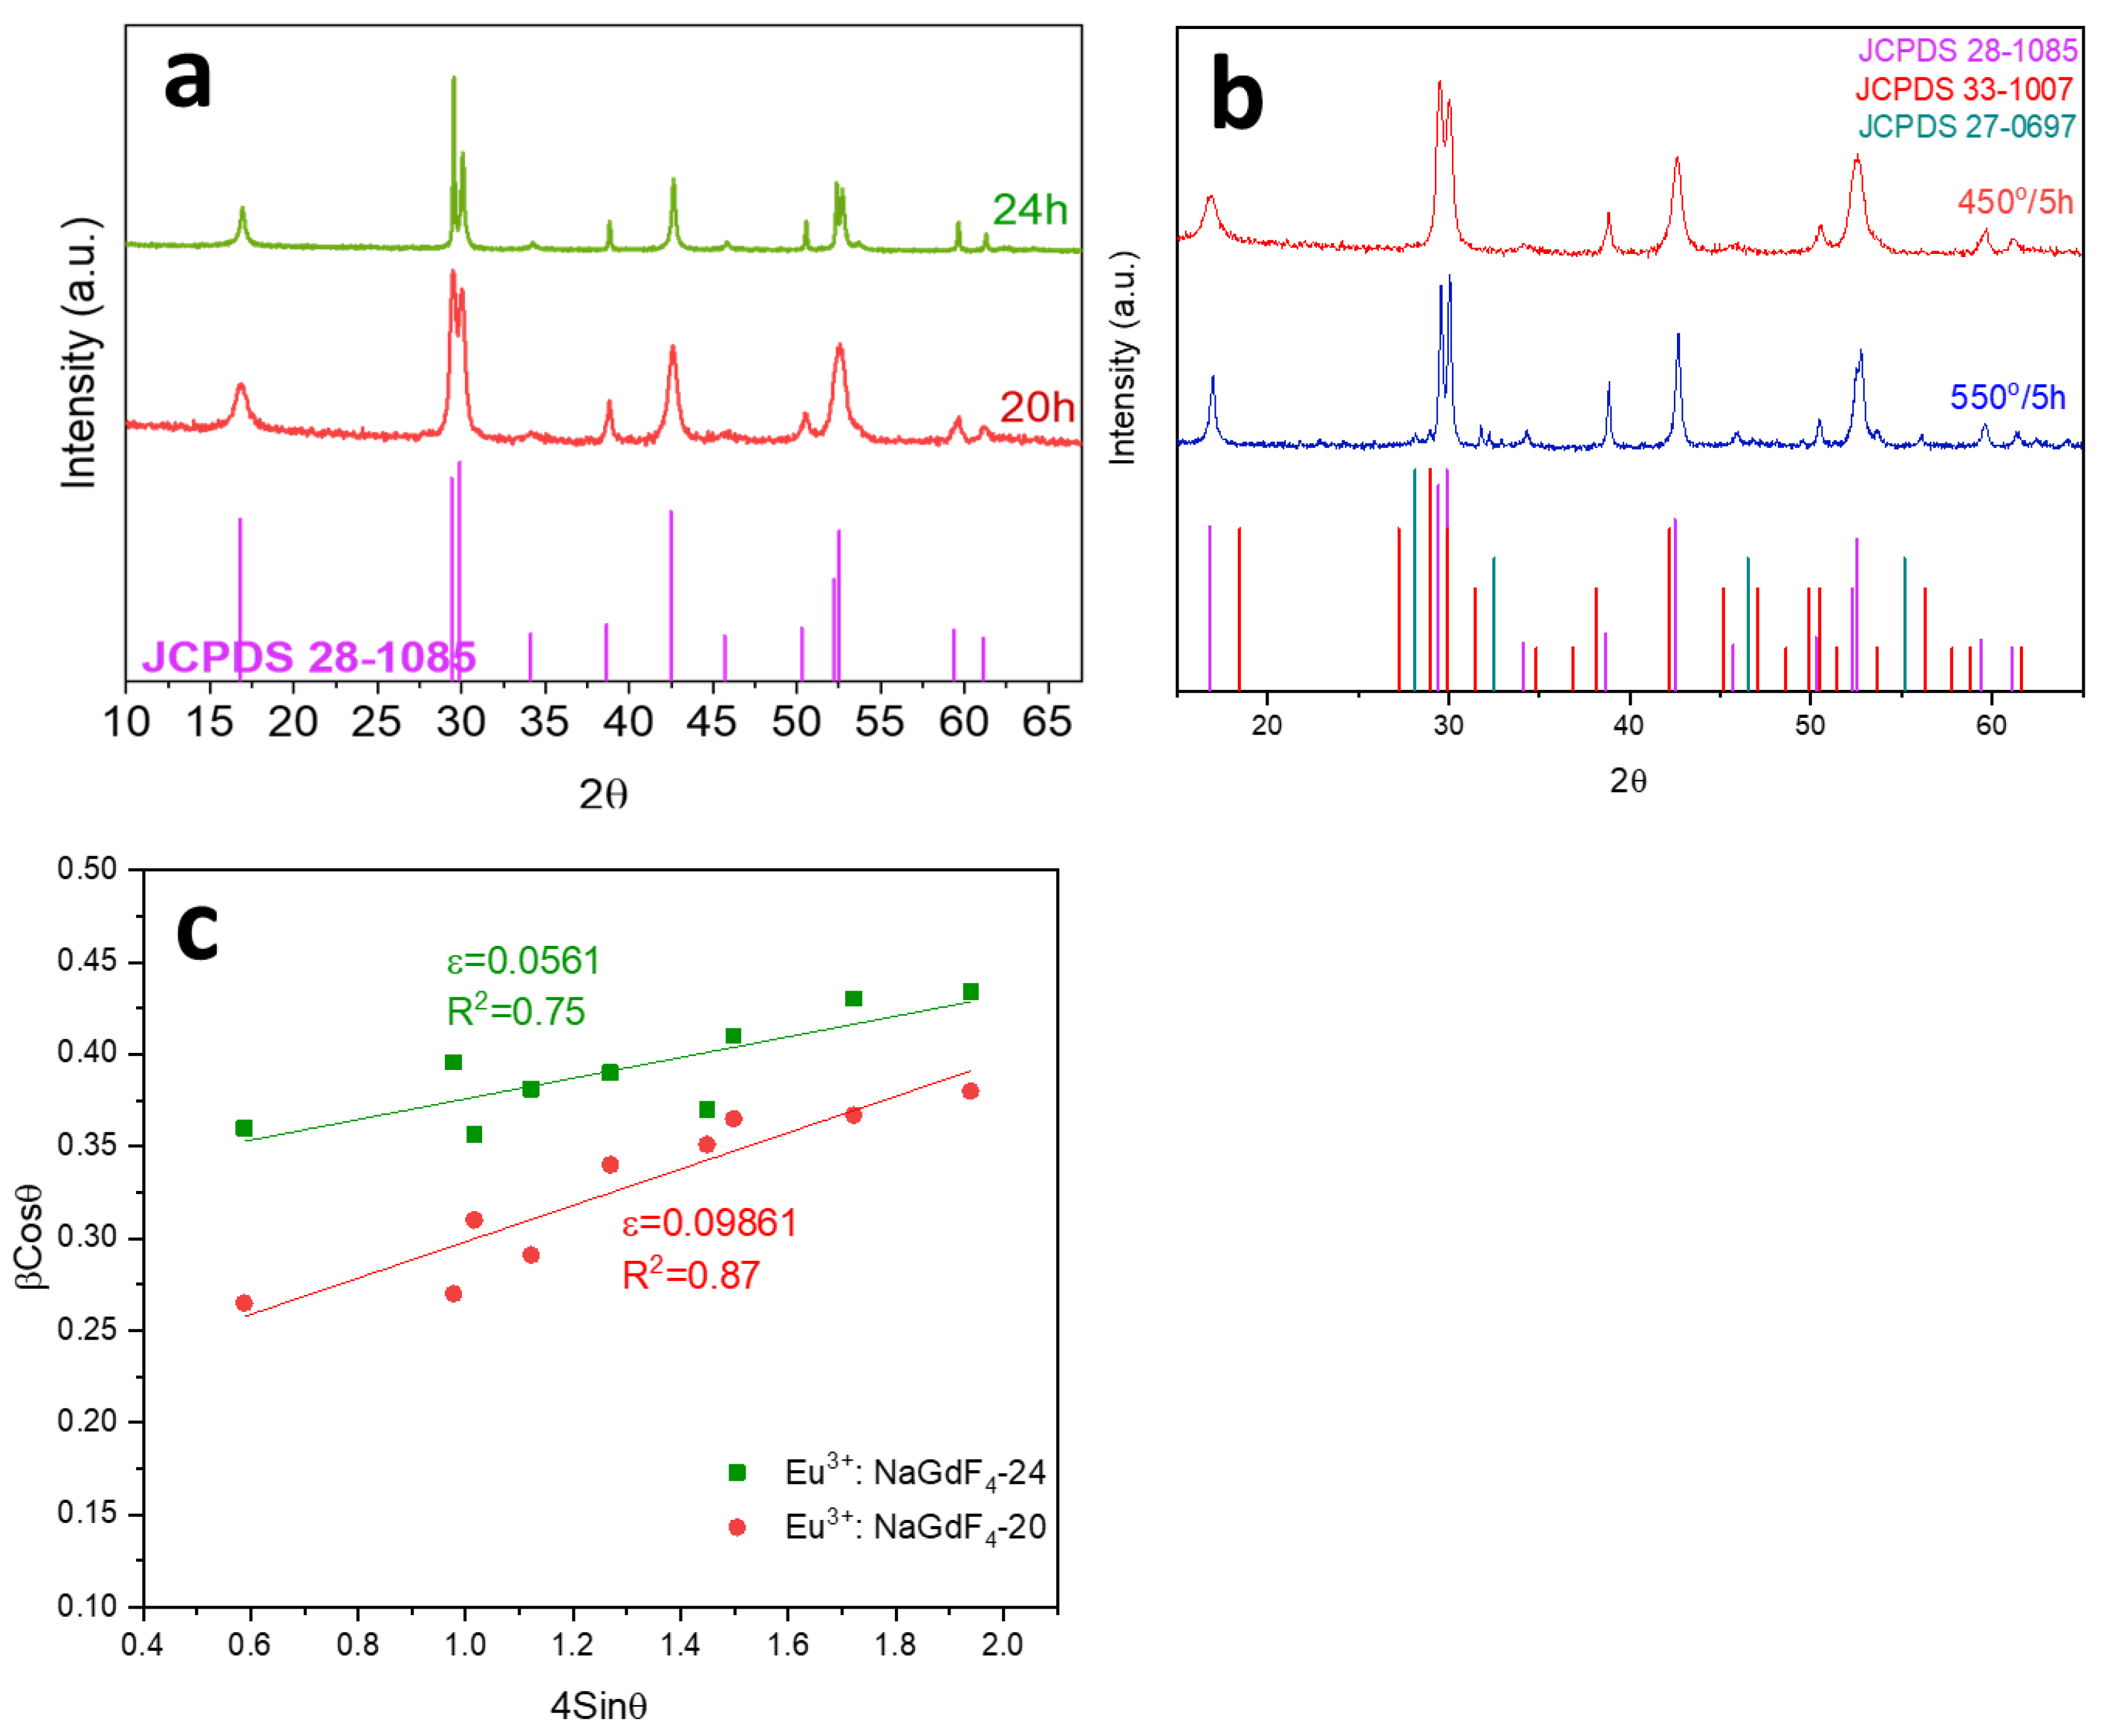
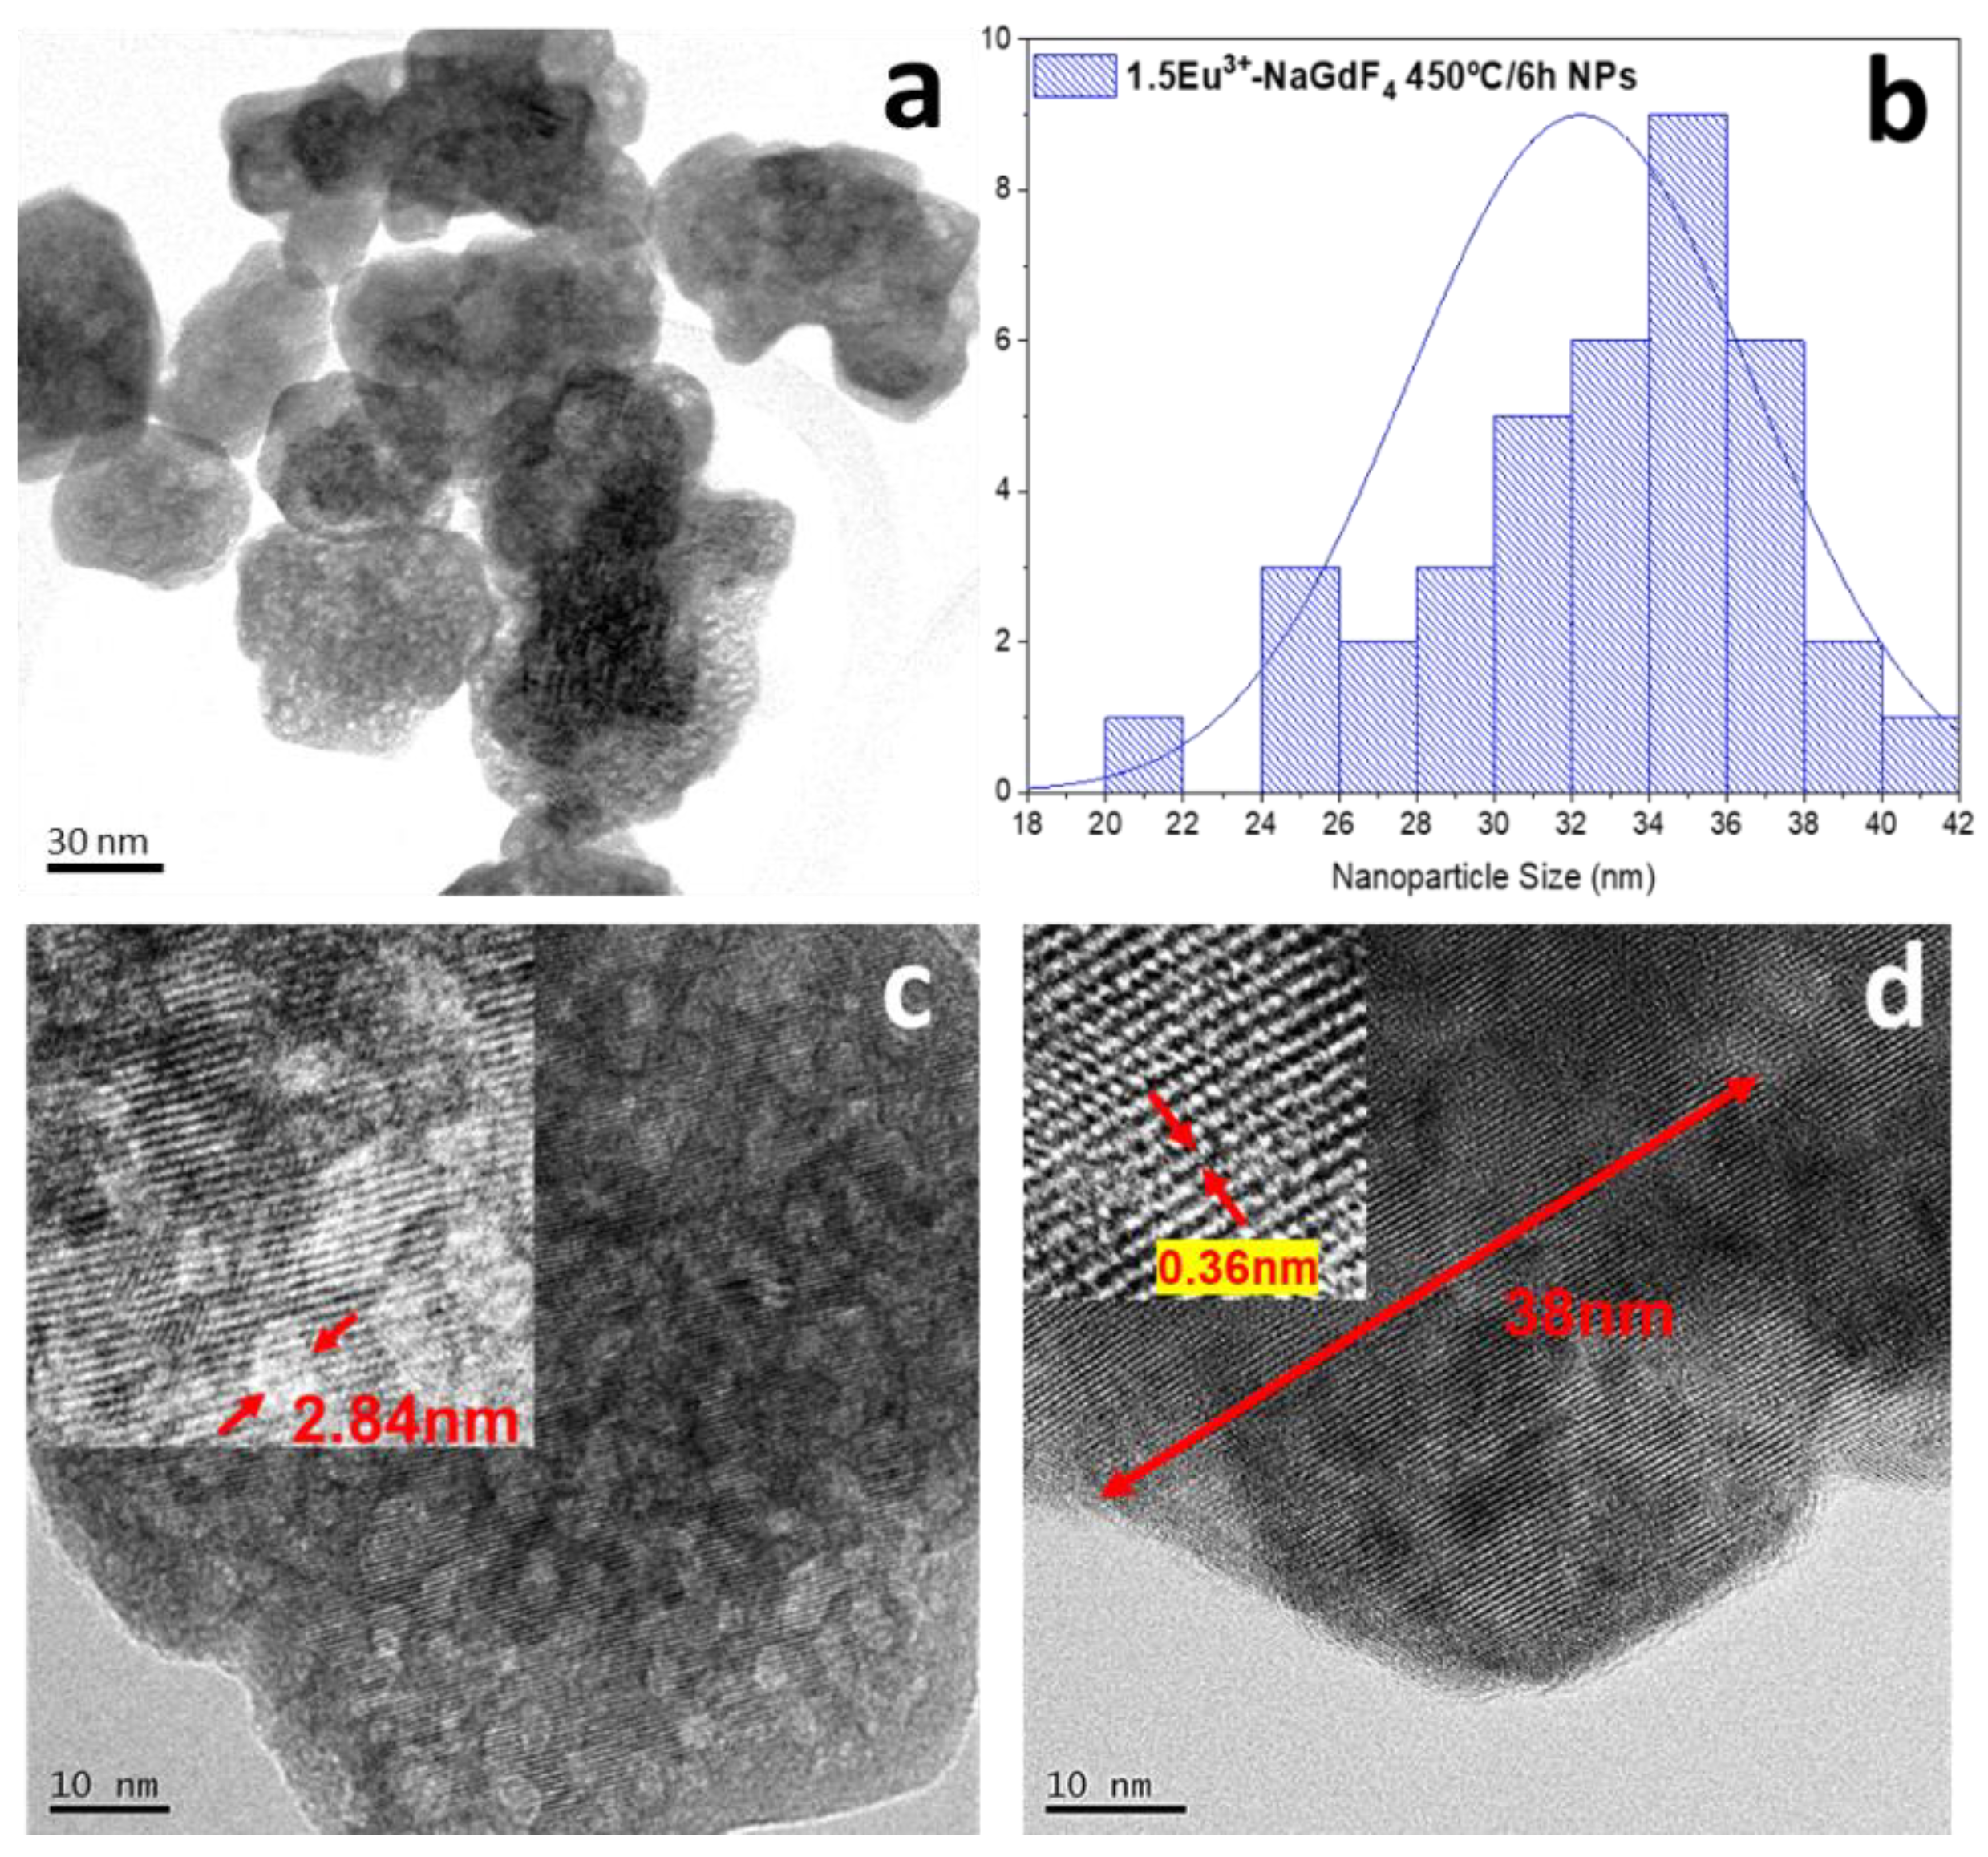
3.1. Structural Characterisation of 1.5Eu3+: NaGdF4 NPs

Stable aqueous suspensions of NaGdF4 nanoparticles, undoped and doped with 1.5Eu3+, were successfully prepared at two reaction times (20 h and 24 h). Then, 1.5Eu3+: NaGdF4-20 and 1.5Eu3+: NaGdF4-24 nanoparticle suspensions were centrifuged and dried at 75 °C overnight to obtain the powders. Both powders were heat-treated at 450 °C for 5 h and characterised by X-ray diffraction in the range 10° < 2Ɵ < 70°. The XRD diffractograms, shown in Figure 1a, confirm the crystallisation of NaGdF4 in the hexagonal phase (JCPDS 28-1085) as the only appearing phase. Nevertheless, the definition of the peaks increases when increasing the reaction time from 20 to 24 h, suggesting bigger and better crystallised nanoparticles. The differences observed in the intensities of the peaks of XRD patterns are associated with a preferential orientation of the nanoparticles. This phenomenon can occur mainly due to the method of preparing the XRD samples. In the present work, the XRD samples were prepared by pressing the powder on a glass substrate with a small amount of Vaseline. Thus, the pressing procedure on the glass substrate could generate the preferential orientation of the nanoparticles. However, this procedure was chosen because the preparation of samples using other routes, such as putting the powder directly on the sample holder, could lead to the contamination of the XRD equipment [45].
The particle size, calculated using the Scherrer equation, increased from 30 nm to 70 nm for a reaction time of 20 to 24 h, respectively. He, F. et al. [46] described the preparation of hexagonal NaGdF4 nanoparticles via hydrothermal synthesis where the crystal size increased from 170 nm to 1 µm when the reaction time increased from 2 h to 24 h. The growth of NaGdF4 nanoparticles during hydrothermal synthesis is associated with a nucleation process followed by a crystal growth. Thus, the nucleation rate determines the growing crystal rate, and both processes are in competition [47].
To avoid a scattering process associated with large nanoparticle size or their agglomerations, a reaction time of 20 h was selected for the rest of the studies, to ensure particle sizes below 30 nm.
Furthermore, 1.5Eu3+: NaGdF4-20 nanoparticle suspension was sintered and heat-treated at 450 °C or 550 °C for 5 h. Figure 1b shows the XRD pattern of 1.5Eu3+: NaGdF4-20 NPs heat-treated at 450 °C and 550 °C for 5 h. In the case of 1.5Eu3+: NaGdF4-20 nanoparticles heat-treated at 550 °C, a partial transformation of hexagonal to cubic (JCPDS 27-0697) and orthorhombic (JCPDS 33-1007) phases is observed, associated with the presence of peaks at 2θ = 31° and 56°, while only the hexagonal phase is detected at 450 °C. For this reason, a sintering condition of 450 °C for 5 h was chosen to ensure the presence of the hexagonal phase as unique.
Figure 1c shows the W-H plot corresponding to the 1.5Eu3+: NaGdF4-20 and 1.5Eu3+: NaGdF4-24, both heat-treated at 450 °C for 5 h. The strain of the crystallites was calculated from the slope of each linear regression, and the strain decreases from 0.0986 to 0.0561 for 1.5Eu3+: NaGdF4-20 to 1.5Eu3+: NaGdF4-24, respectively. Moreover, the particle size, calculated from the y-intercept, increases from 16 nm for the sample 1.5Eu3+: NaGdF4-20 to 60 nm for 1.5Eu3+: NaGdF4-24. The fact that the crystal size calculated using the W-H plot for Eu3+: NaGdF4-20 is around half that calculated using the Scherrer equation likely indicates that a great part of the width of the XRD peaks corresponds to the intrinsic strain of the nanoparticles. By contrast, nanoparticles obtained with a high reaction time (1.5Eu3+: NaGdF4-24) present lower differences between the crystallite size calculated using the W-H and Scherrer equations, evidencing smaller strain contributions, probably due to nanoparticles with a bigger size and higher molecular order.
Figure 2 shows the HR-TEM images corresponding to 1.5Eu3+: NaGdF4-20 nanoparticles heat-treated at 450 °C for 5 h. Figure 2a shows nanoparticles with irregular shapes and sizes around 30 nm, around double of that calculated with the W-H plot, which is associated with the tendency of nanoparticles to agglomerate during synthesis and further centrifugation to obtain powders. The hexagonal shape is not clearly observed, probably due to the low amount of phase present in the nanoparticles. Wu, Y. et al. [48] reported the hydrothermal preparation of hexagonal NaGdF4 NPs using the same temperature and reaction times, observing that when NaF is used as a fluoride precursor, and for pH = 7, nanoparticles tend to have irregular shapes, as shown in this work. The size distribution is shown in Figure 2b, and a broad peak is observed with NP sizes between 20 nm and 42 nm with an average size of 34 nm. Figure 2c shows an amplified image of Figure 2a, revealing the existence of pores of around 2.5–3 nm inside the NP. The presence of pores can be attributed to a rapid formation of the nanoparticles followed by a long time for growing during which pores can be formed, as mentioned before [49]. The corresponding fast Fourier transform (FFT) pattern from the marked area in Figure 2d displays an interplanar distance of nearly 0.36 nm associated with the (001) plane of the NaGdF4 hexagonal phase, confirming the XRD results.
The structural characterisation of the 1.5Eu3+: NaGdF4 nanoparticles reveals that, even though 1.5Eu3+: NaGdF4-24 nanoparticles show a higher crystallisation degree, those synthesised for 20 h are more suitable for being incorporated into silica sol due to their smaller particle size. Moreover, a heat treatment of 450 °C for 5 h was chosen for these nanoparticles to avoid undesired crystallisation together with the hexagonal NaGdF4. For these reasons, 20 h was selected as the best reaction time to prepare NaGdF4 nanoparticle suspensions to carry out the further preparation of the OxGCs, and a heat treatment of 450 °C for 5 h as the best condition for sintering and performing the further characterisations.

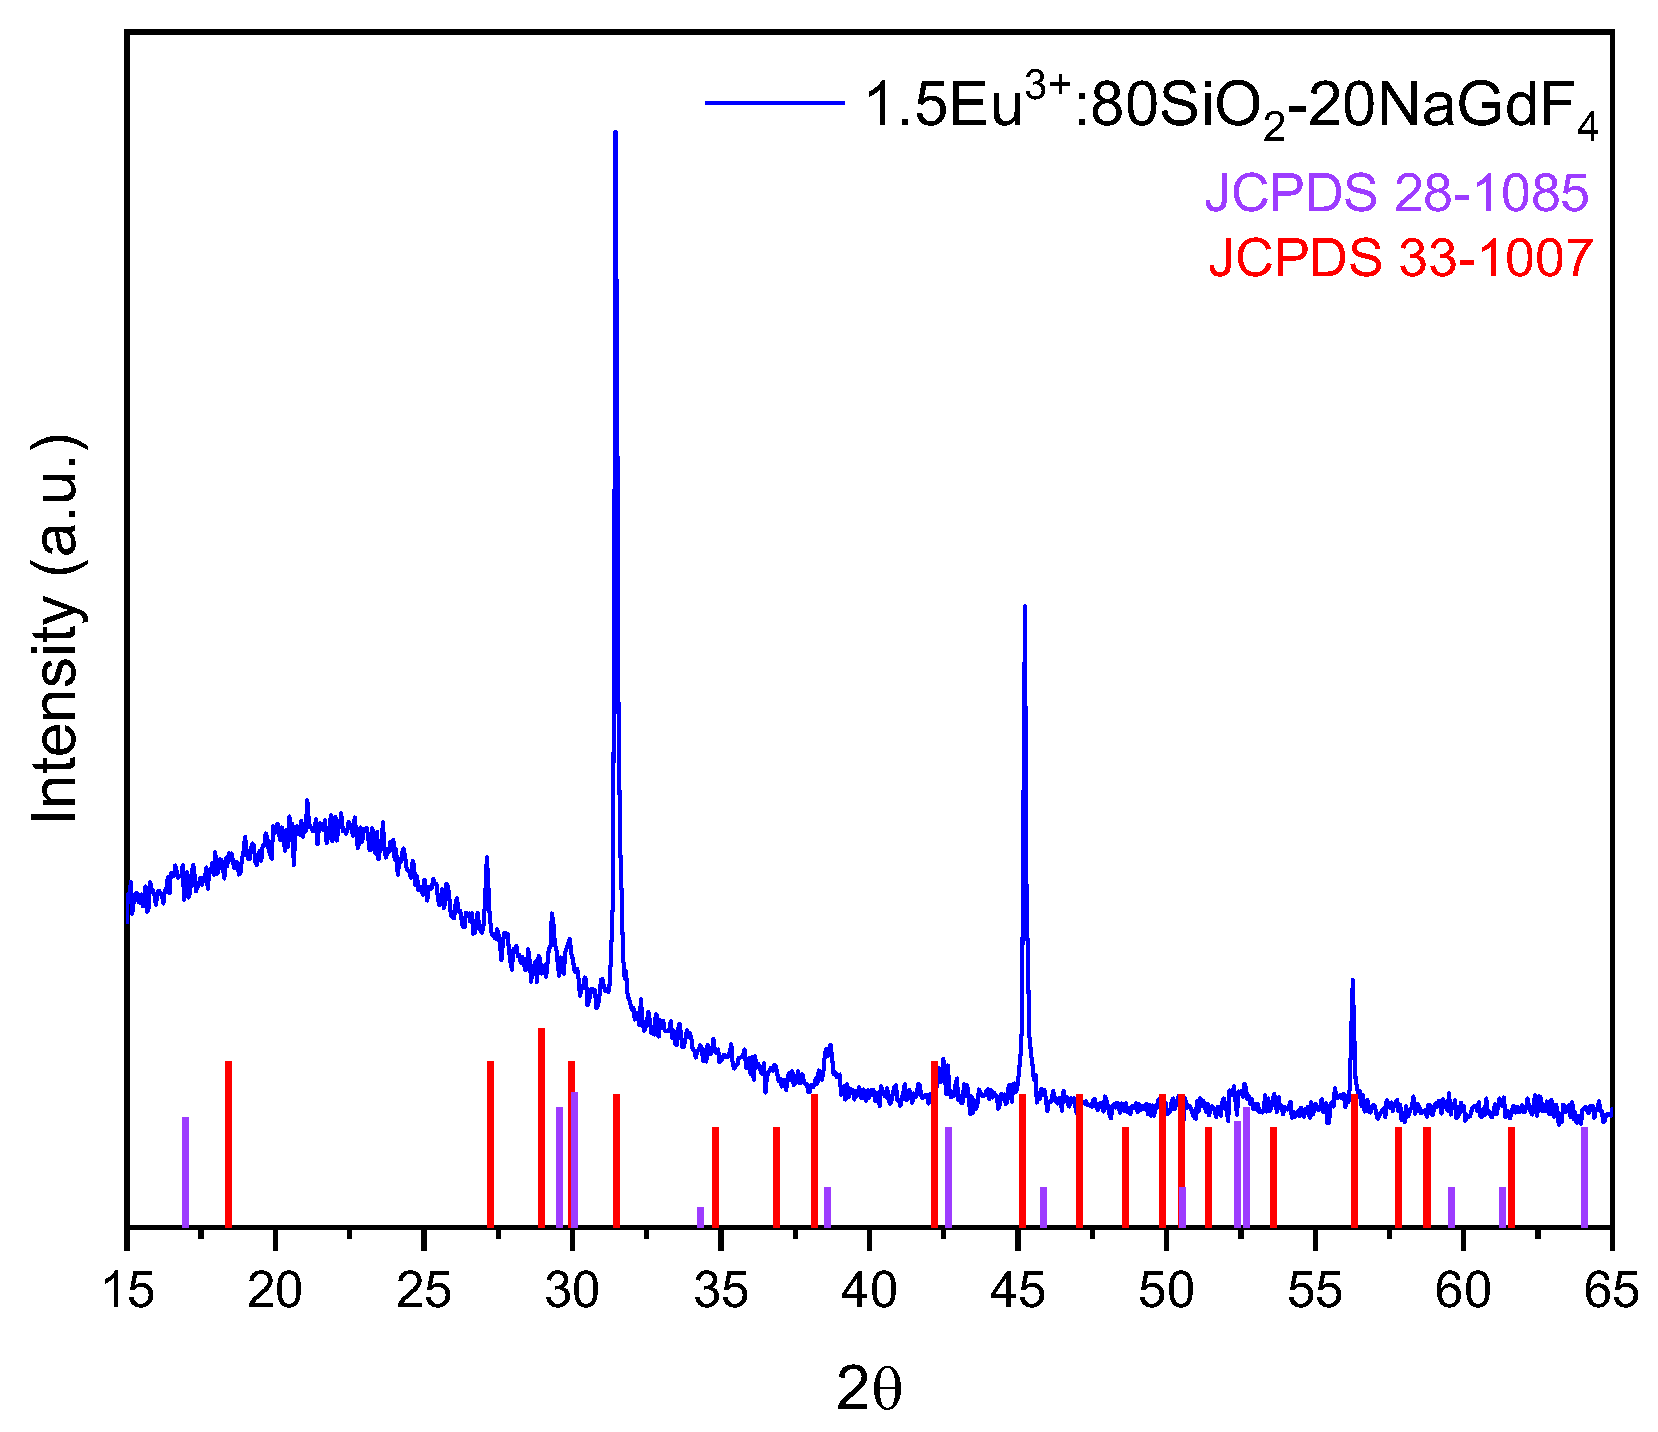
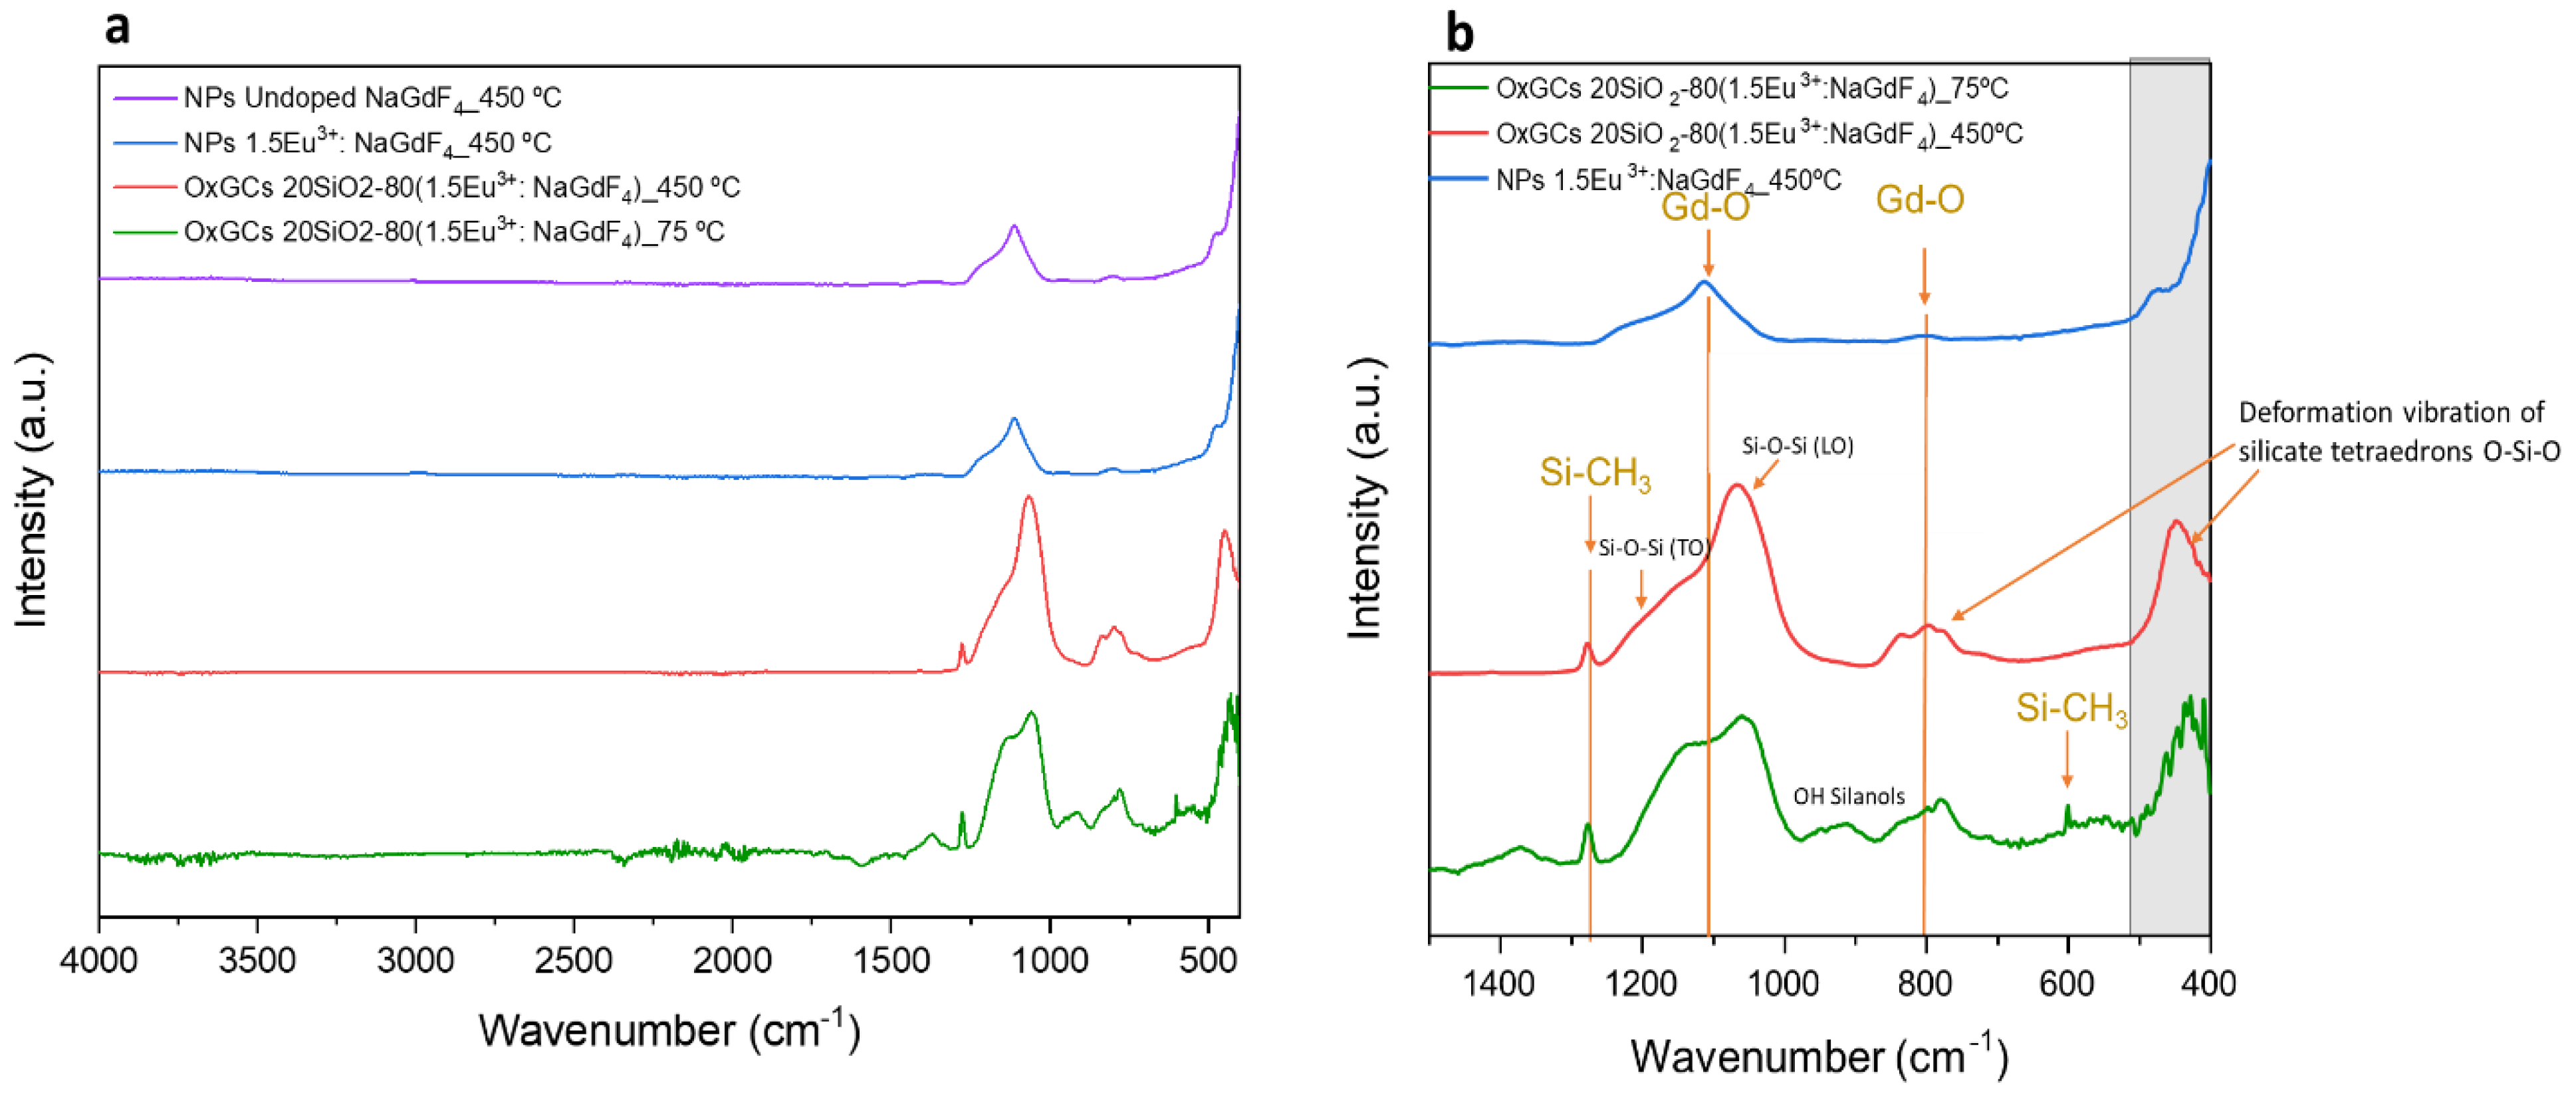
3.2. Structural Characterisation of 80SiO2-20(1.5 Eu3+: NaGdF4) OxGCs Powders

OxGCs with the composition 80SiO2-20(1.5Eu3+-NaGdF4) were prepared through the incorporation of 1.5Eu3+: NaGdF4-20 nanoparticles in aqueous suspension in the silica sol precursors. For XRD characterisation, the 80SiO2-20(1.5Eu3+: NaGdF4) sol was dried and heat-treated at 450 °C for 5 h. Figure 3 shows the presence of hexagonal (JCPDS 28-1085) and orthorhombic (JCPDS 33-1007) phases. The partial phase transformation can be attributed to the change in pH during the preparation of the sol, from pH 7 of NP suspension to pH 2 of the final sol. Some authors reported that the nanoparticles with the formula NaLnF4 (Ln = Gd, Y, Li) are very sensitive to pH changes [46,50].
Figure 4a shows the FTIR spectra obtained for undoped and 1.5Eu3+-doped NaGdF4 nanoparticles heat-treated at 450 °C for 5 h (violet and blue line, respectively) and 80SiO2-20(1.5 Eu3+: NaGdF4) heat-treated at 450 °C for 5 h and dried at 75 °C overnight (red and green line, respectively) in the range of 4000 cm−1 to 400 cm−1. In all cases, no clear peaks were detected in the range of 3000 cm−1–4000 cm−1, indicating that the materials were free of water (-OH bonds should appear around 3000–3500 cm−1). Figure 4b shows the amplified spectra between 1500 cm−1 and 400 cm−1. In the 1.5Eu3+-doped NaGdF4 nanoparticles, at around 500 cm−1, a rising peak is identified associated with the tetrafluoride bond vibration [51] and confirming the formation of NaGdF4 nanoparticles. This peak is not completely observed due to the range limitation of the equipment. A small peak at 807 cm−1 and a broad double peak around 1114 cm−1 are also observed, associated with traces of Gd-O bonds, indicating the presence of oxygen defects in the nanoparticle lattice [52,53]. These defects could be due to the reactions of acetates with nitrate precursors, since these peaks appear for both doped and undoped NP samples. These traces can affect the luminescence properties [54]. On the other hand, in the spectrum corresponding to the OxGC dried at 75 °C (green plot), a sharp band is identified at about 1260 cm−1 together with a small band at 600 cm−1 associated with Si-CH3 groups from the silica precursor. The band at 1260 cm−1 remains after the heat treatment (red plot), indicating the presence of Si-CH3 groups. In both OxGCs spectra (green and red plots), a broad band between 1200 and 1000 cm−1 is assigned to Si-O-Si bonds, with overlapping bands such as the 1040 cm−1 and 1170 cm−1 peaks associated with the transversal optical (TO) and longitudinal optical (LO) asymmetric stretching modes of Si-O-(Si), respectively, and possible Gd-O bonds (at 1114 cm−1) overlapped with Si-O-Si vibrations, also identified in the 1.5Eu3+: NaGdF4 NPs (blue plot). On the other hand, a small broad band is observed around 930 cm−1, associated with Si-O(H) stretching vibration and/or non-bridging oxygen vibration. This band disappears after the heat treatment of OxGC, confirming the cross-linking of the SiO2 network. A further band around 800 cm−1 corresponds to the deformation vibration of silicate tetrahedrons (O-Si-O) and Gd-O bonds. The vibration band appearing at 472 cm−1 is assigned to deformation vibrations of silicate tetrahedrons, ν4 (O-Si-O), which becomes better defined after the heat treatment of OxGC (red plot). Finally, in both OxGCs spectra, the band around 400 cm−1 associated with crystalline tetrafluoride, also identified in the NP spectrum (blue line), is difficult to assign due to the proximity of the silicate tetrahedrons band and the limitation of the equipment [13].
These results confirm the successful incorporation of the 1.5Eu3+: NaGdF4 nanoparticles into the silica sol as their presence was evidenced both in the XRD pattern and FTIR spectra. However, the partial crystal transformation that takes place during the formation of the sol, from hexagonal to orthorhombic, should affect the optical properties of the OxGCs due to a reduction in the crystal symmetry. Nevertheless, molecular characteristics of the nanoparticles, such as the oxygen defect revealed in the FTIR spectra, suggest that the hexagonal nanoparticles that remain keep their properties throughout the sol formation.

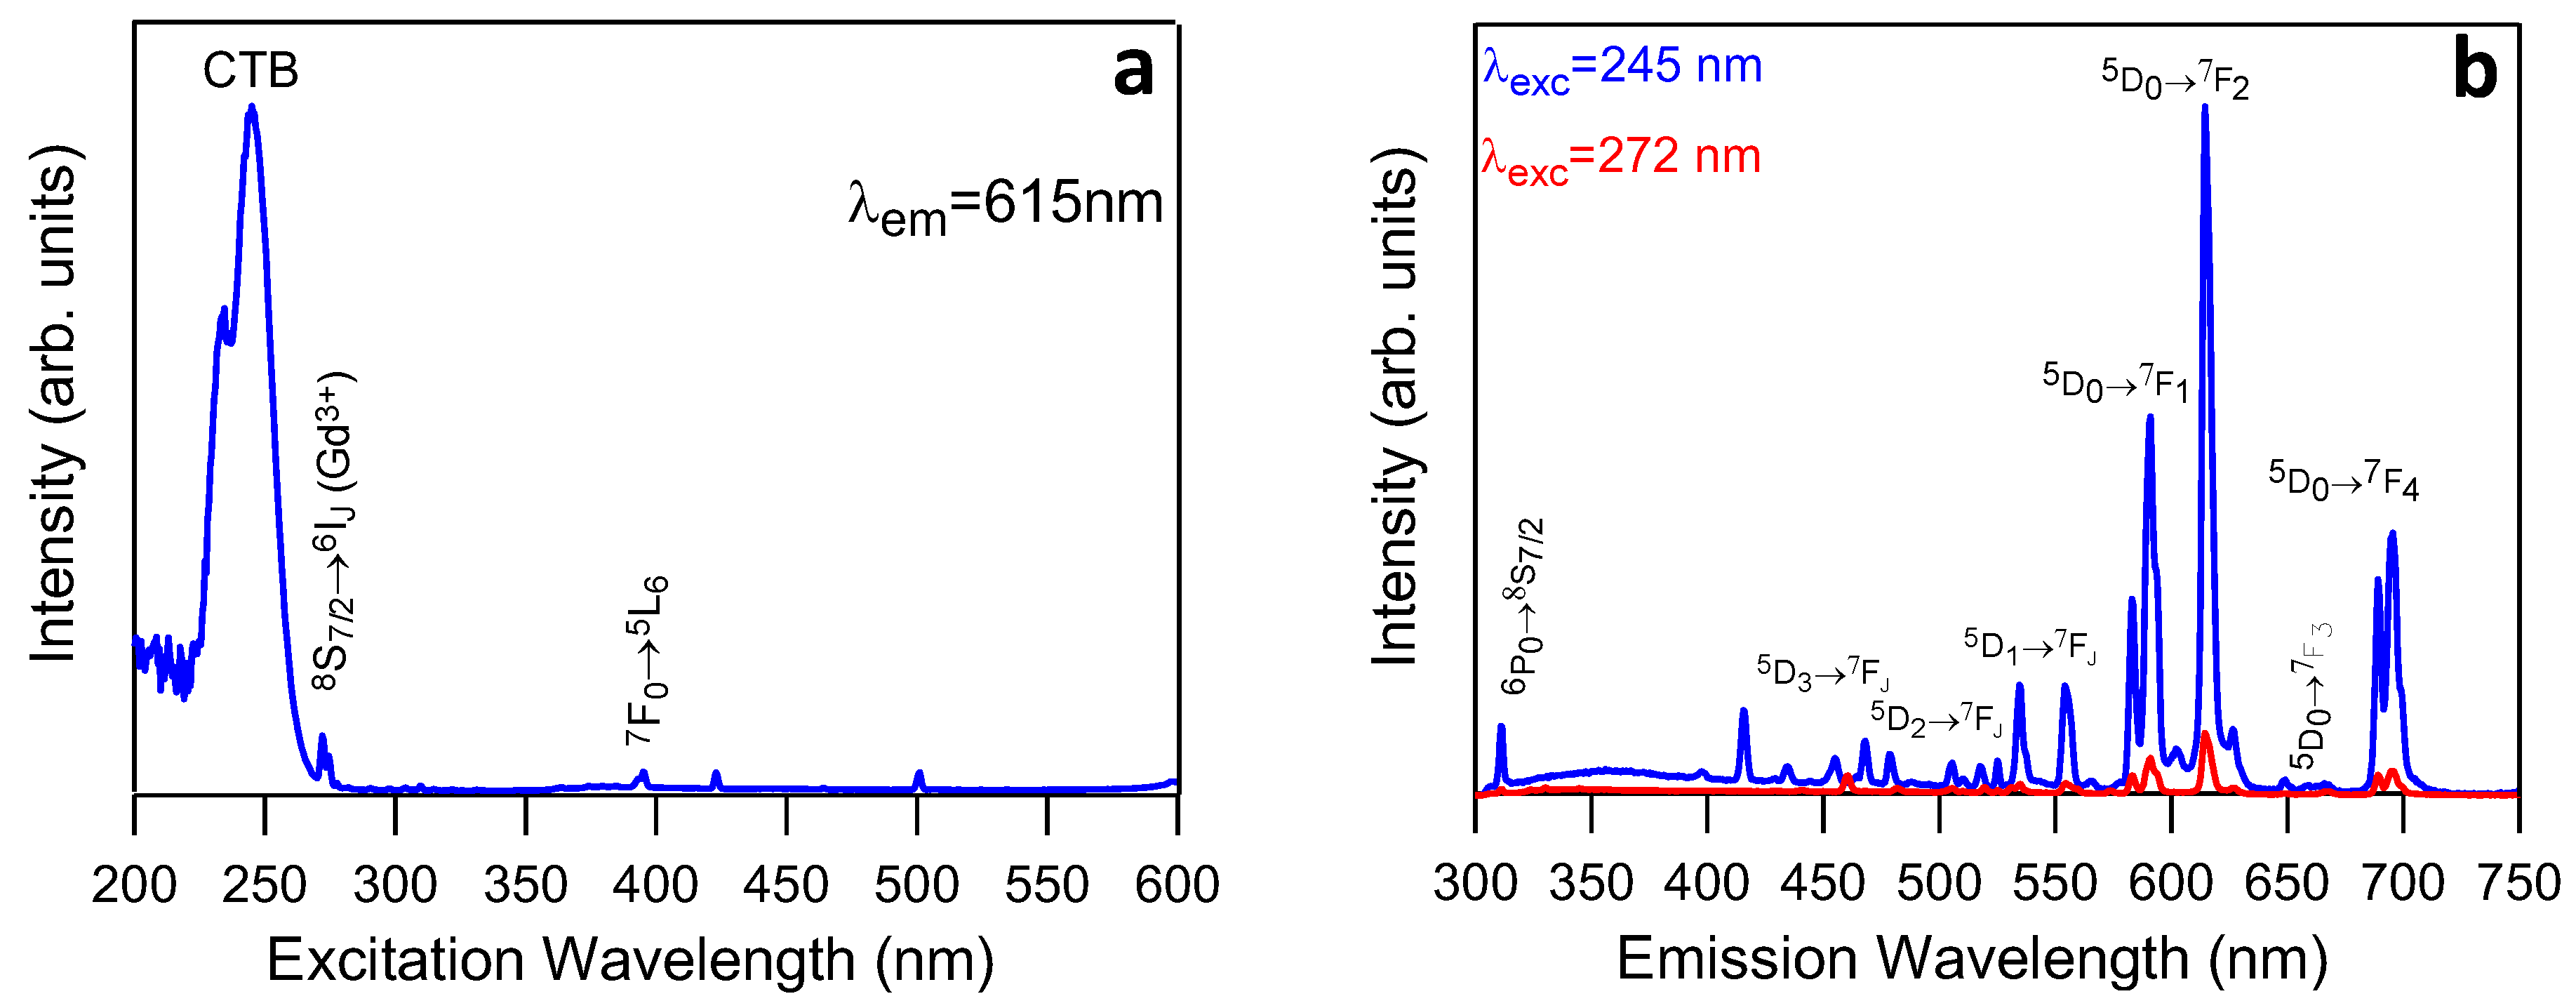
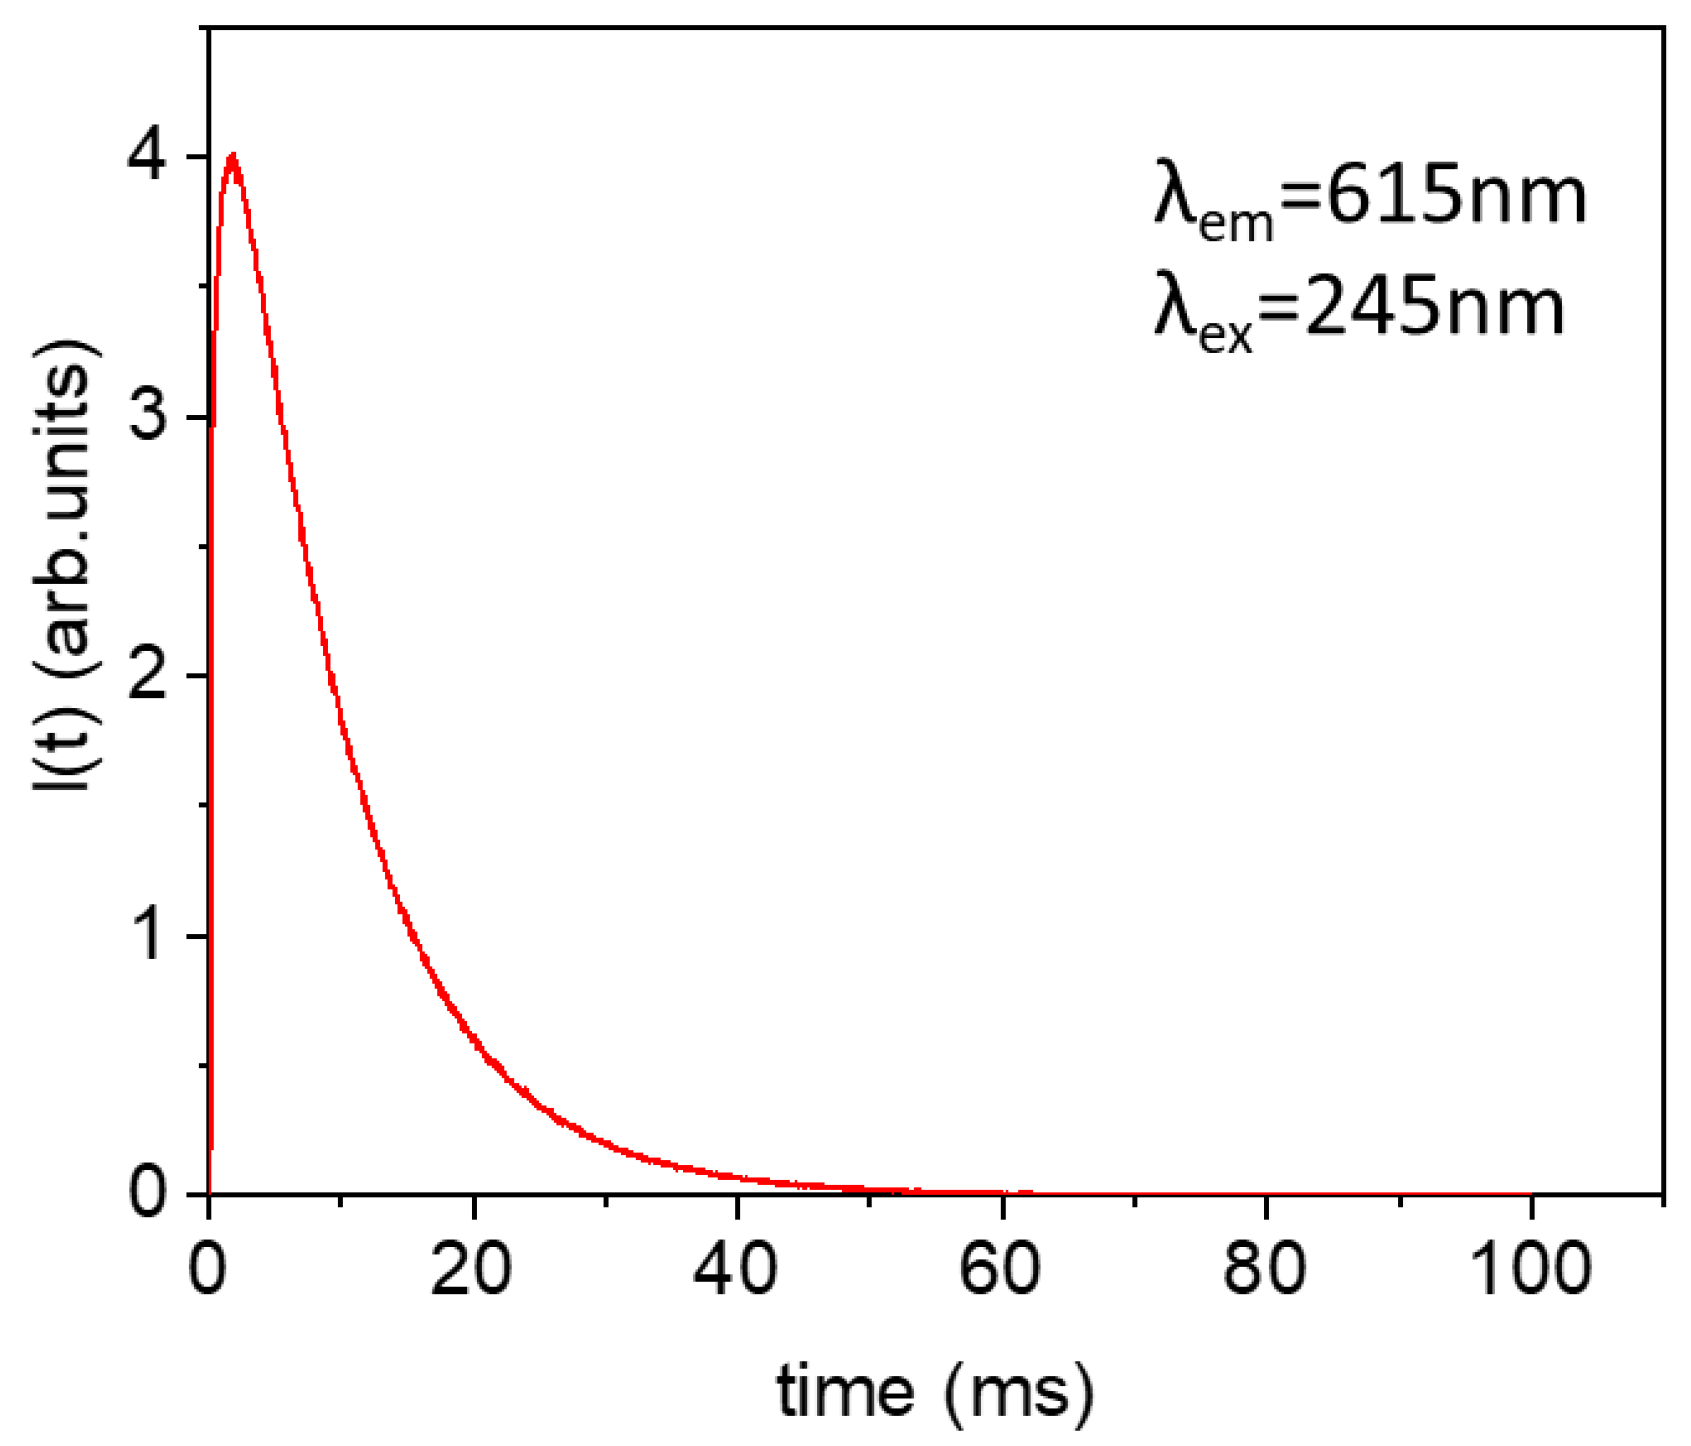
3.3. Luminescence Properties of 1.5Eu3+: NaGdF4 NPs

Figure 5a shows the excitation spectrum of the heat-treated 1.5 Eu3+: NaGdF4 NPs recorded by monitoring the 5D07F2 emission of Eu3+ at 615nm. The spectrum shows a broad band centred around 245 nm attributed to the Eu3+-O2-charge transfer band (CTB). The CTB reflects the accommodation of oxygen into a lattice of the NaGdF4 NPs, which has already been reported for fluoride nanoparticles prepared via wet chemistry [38], and it is in concordance with the FTIR spectra shown in Section 3.2, where oxygen bonds have been identified. In addition to the CTB, the spectrum shows a peak at 272 nm attributed to the 8S7/26IJ transition of Gd3+ and the 7F05L6 peak of Eu3+ at 395 nm. The presence of the Gd3+ peak in the excitation spectrum obtained by monitoring the Eu3+ luminescence confirms the Gd-Eu energy transfer. The other two small peaks at 423 and 501 nm are from the xenon lamp used for excitation.
The emission spectra of the 1.5 Eu3+: NaGdF4 NPs, shown in Figure 5b, were obtained under excitation at 245 nm (CTB) and 272 nm (8S7/26IJ) (Gd3+), respectively. The spectra show the Gd3+ emission (6P08S7/2) around 311 nm together with the Eu3+ emissions. The Gd3+ emission appears superimposed to a weak broad band centred at around 360 nm, likely associated with the 4f65d-4f7 transition of Eu2+. For both excitations, the main emissions correspond to the 5D07FJ transitions of Eu3+. A small contribution of the 5D1,2,37FJ transition is also observed. The observed wavelength emissions, shown in Table 1, are similar to those published in the literature for other fluoride phases, such as GdF3 or NaLaF4. Moreover, the emission spectrum obtained after excitation through the charge transfer band (λexc = 245 nm) is much higher in intensity than that obtained after Gd3+ excitation at 272 nm, in accordance with the most efficient energy transfer.
The most intense peak of the spectra corresponds to the electric dipole 5D07F2 transition, indicating that Eu3+ ions are in a non-centrosymmetric site; the intensity of this hypersensitive transition is strongly affected by the local field [55]. The asymmetry ratio, R, defined as the ratio of the 5D07F2 and 5D07F1 emission intensities, was calculated to describe this behaviour. The lower this value, the closer the local symmetry is to the one with an inversion centre [55]. The obtained value of 1.46 confirms the non-centrosymmetric site, which can be attributed to the substitution of a F ion by an O2− ion in the coordination environment of an Eu3+ which lowers the site symmetry of the Eu3+ in the oxygen-free NaGdF4 crystal [54].
In addition, the quantum yield calculated under excitation at λexc = 270 nm for the 1.5 Eu3+: NaGdF4 NPs gives a value of 43.1%. The quantum yield of Eu3+-doped fluorides with Gd3+ ions has been calculated by many authors, most of them reporting a theoretical value of 200% due to the energy transfer between Gd3+ and Eu3+ with exciting Gd3+ [56,57,58]. The low emission efficiency after Gd3+ excitation, evidenced through the quantum yield value, could be due to the presence of oxygen impurities in the NaGdF4 nanoparticles, as it is known that even a small amount of oxygen in the vicinity of Eu3+ ions can lead to a reduction in the photon emission [9].
The experimental decay curve from the 5D0 level was obtained by exciting at 245 nm through the CTB and collecting the luminescence of the 5D07F2 transition at 615 nm. The decay curve, displayed in Figure 6, shows a rise time of 0.44 ms, due to the population of the 5D0 level from higher energy levels, followed by a single exponential decay with a lifetime of 9.6 ms. This lifetime value is longer than some of those reported for hexagonal nanoparticles with the composition Eu3+: NaYF4 or Eu3+: NaGdF4 [59,60,61] and is similar to that found by Karbowiak et al. for Eu3+: NaGdF4 nanocrystals [62].

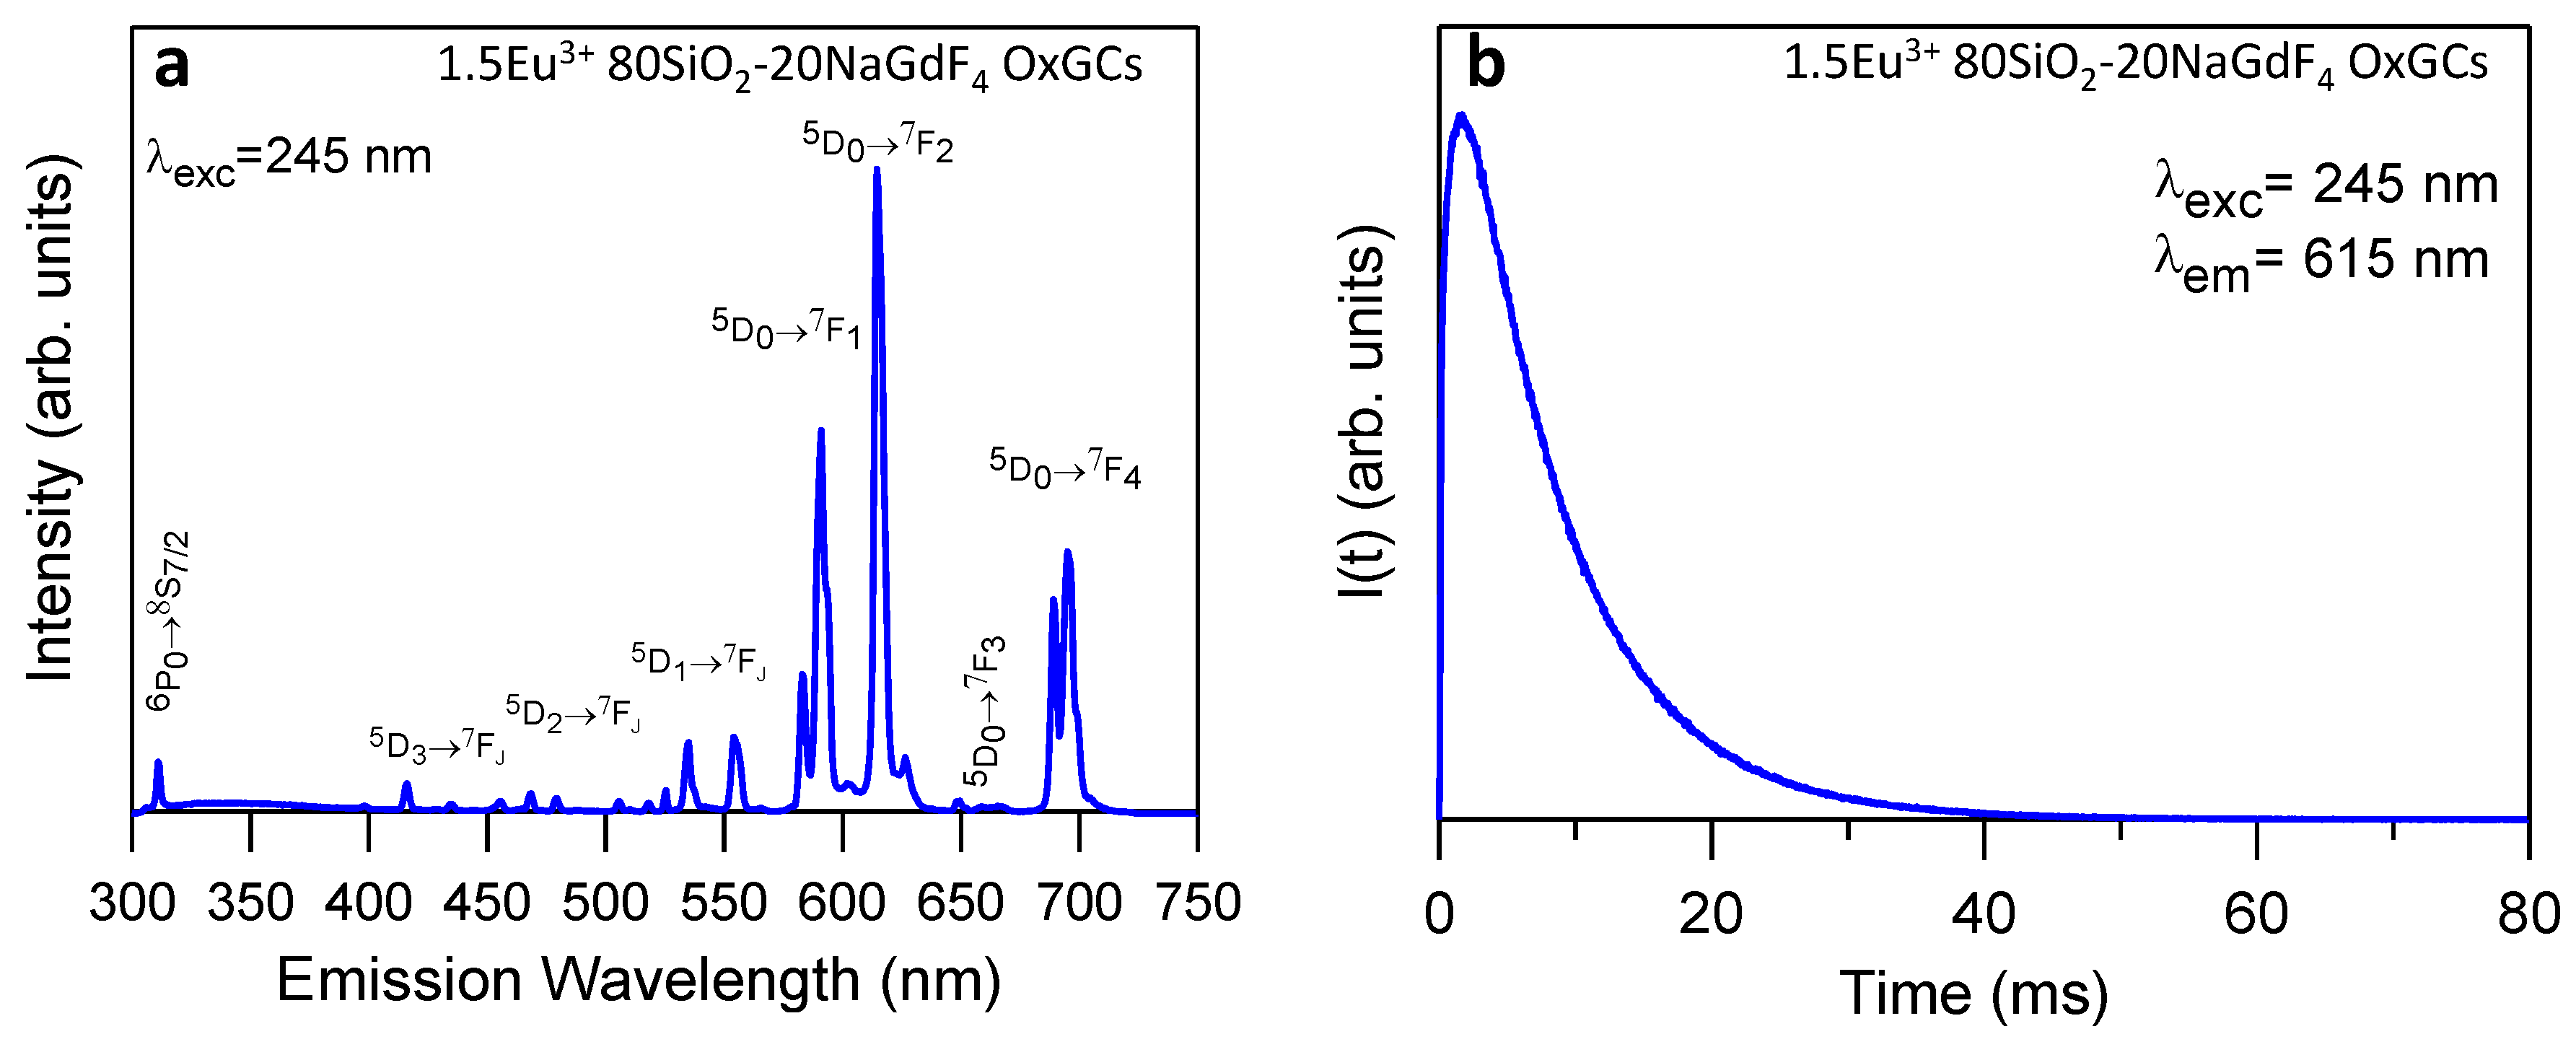
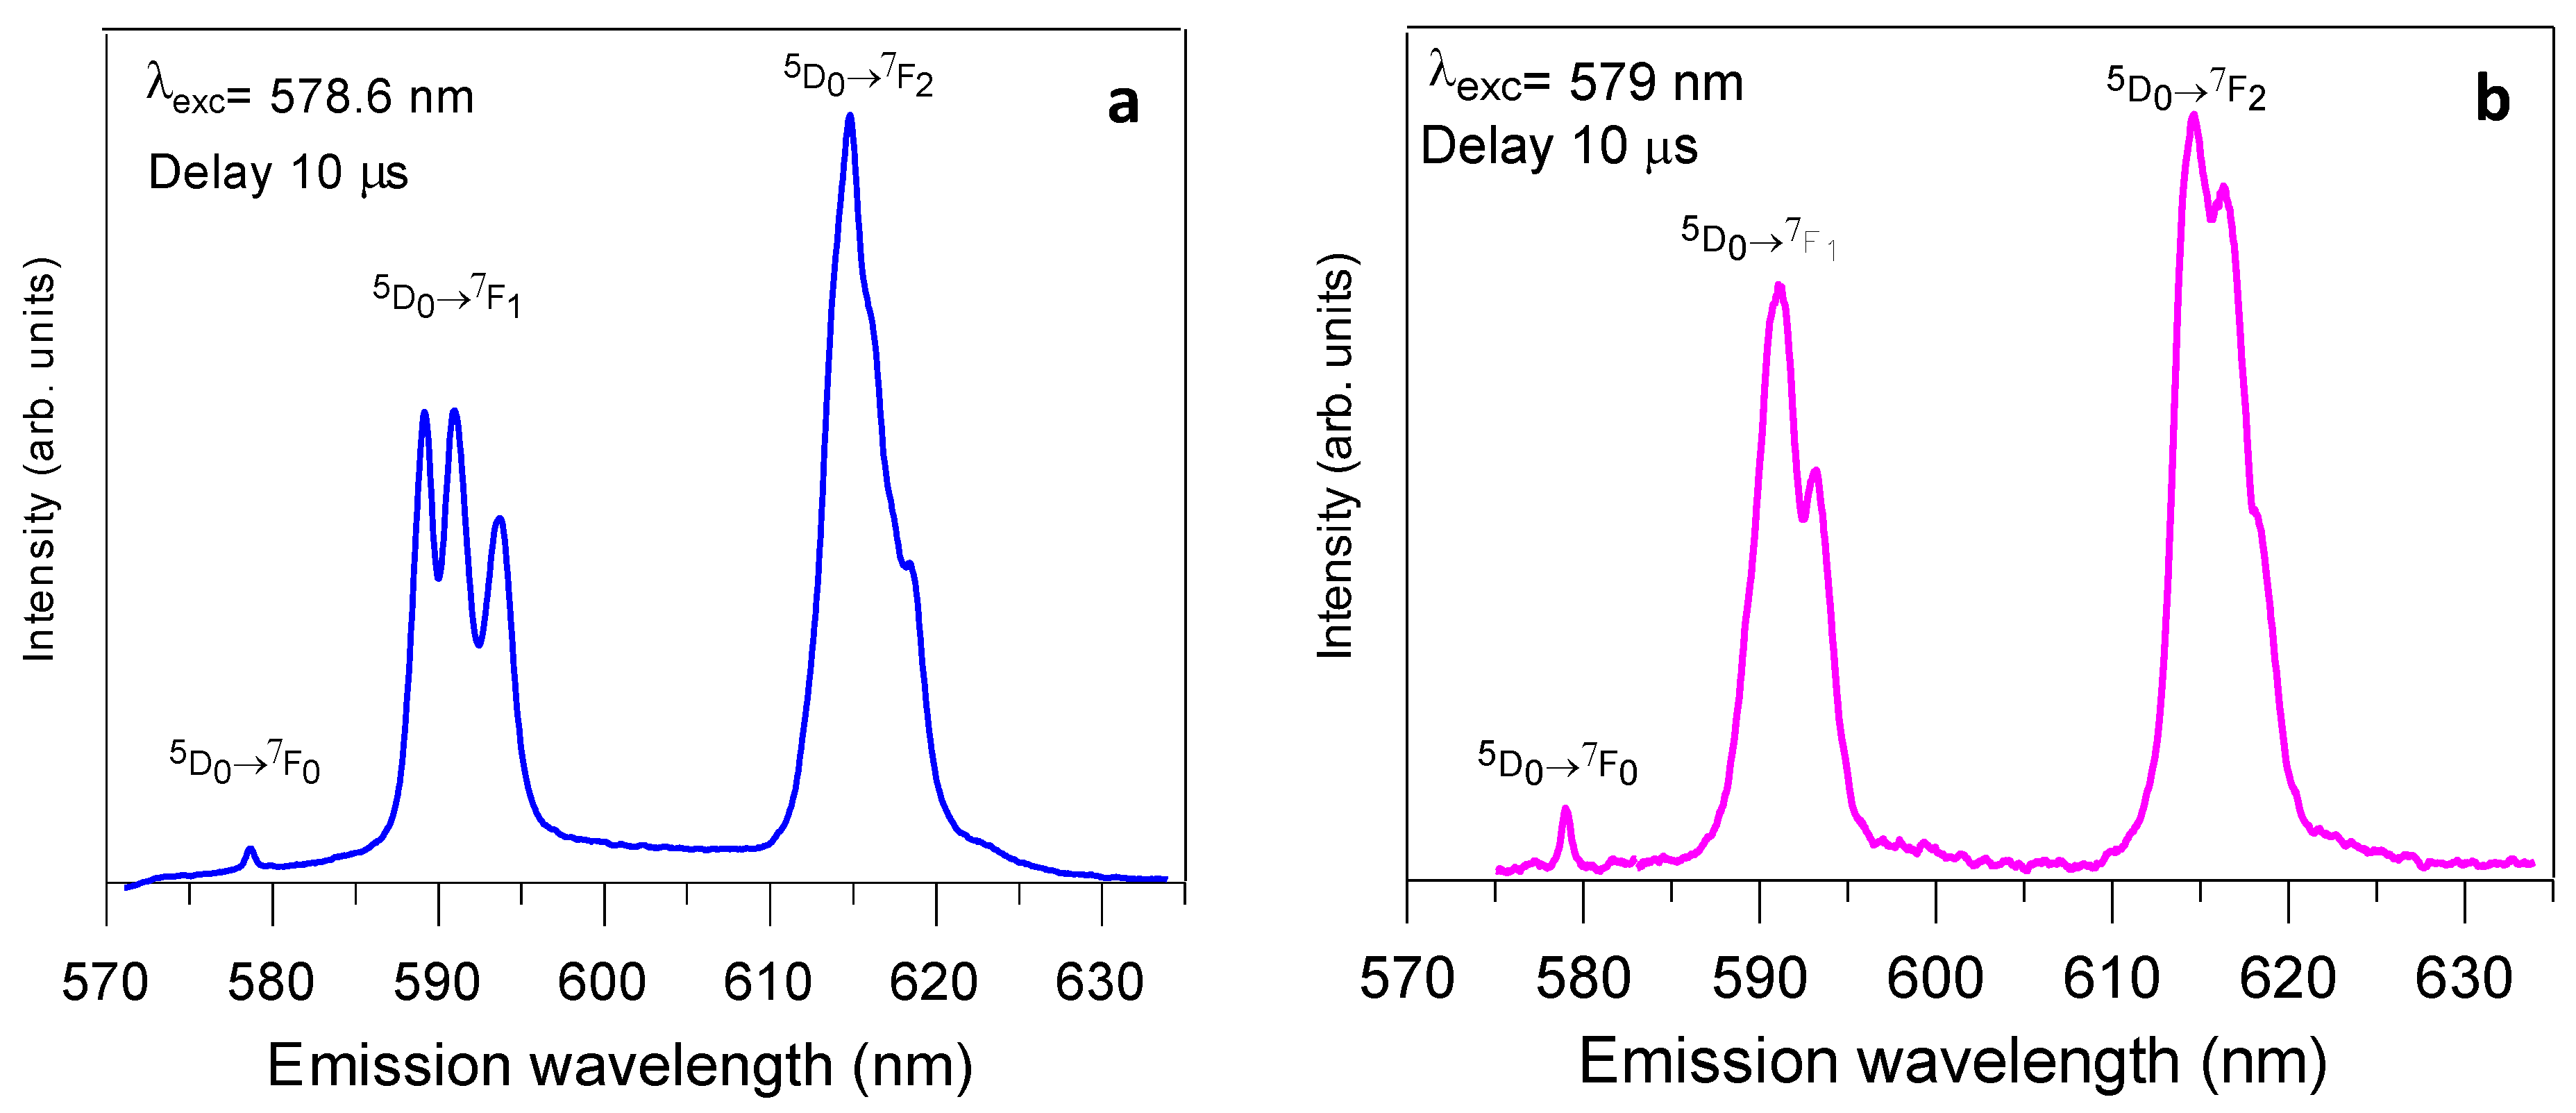
3.4. Luminescence Properties of 80SiO2-20(1.5Eu3+NaGdF4) OxGCs

The luminescent properties of the OxGCs powders with the composition 80SiO2-20(1.5Eu3+-20NaGdF4) heat-treated at 450 °C for 5 h are presented in Figure 7a, which shows the emission spectrum recorded under excitation at 245 nm. The spectral features are similar to those obtained for 1.5Eu3+: NaGdF4 NPs, with the peaks revealing the transition 6P08S7/2 of Gd3+ and the 5D07FJ transition from the Eu3+ ion. In addition to the nanoparticles study, the most intense peak was found to be corresponding to the 5D07F2 transition, in agreement with a non-centrosymmetric site for the Eu3+ ion. In this case, the calculated R-value is also 1.46, which is similar to that of the NPs. Furthermore, the wavelength of the emissions is the same as that detected for the nanoparticles reported in the previous section.
Figure 7b shows the luminescence decay curve from the 5D0 level recorded while collecting the emission at 615 nm and exciting the CTB at 245 nm. The wavelength emissions are listed in Table 1. The lifetime value obtained was 7.9 ms, which was lower than the one obtained for the nanoparticles (9.6 ms). The decrease in the lifetime value could be due to the presence of the remaining organics in the silica matrix from the sol-gel precursor, as shown in the FTIR spectra of Section 3.2, where a peak of CH3 from the MTES was identified. Moreover, the rising time was 0.4 ms, which was similar to that from the NPs.
Table 1. Emission wavelengths corresponding to the observed transitions of Gd3+ and Eu3+ in NPs and OxGCs.
Observed TransitionsWavelength (Figure 5b and Figure 7a)NaGdF4 [63]NaLaF4 [64,65]EuF3 [66]GdF3 [67]
6P08S7/2311 nm
5D37F1415.5 nm
5D37F2429 nm
5D37F3434.5 nm
5D37F4468 nm
5D27F2478.5 nm
5D27F3505.5
5D17F0525 nm
5D17F1534.5 nm
5D17F2554 nm
5D07F1583 nm, 591 nm592 mm592 mm590 nm591 nm
5D07F2614.5 nm613 nm615 nm612/617 nm615 nm
5D07F3649 nm653 nm650 nm 652 nm
5D07F4689 nm, 695.5 nm695 nm695 nm
As mentioned before, the optical properties of trivalent Eu are highly sensitive to the local environment. Since the 5D0 state is non-degenerative under any symmetry, the structure of the 5D07FJ emissions is only determined by the splitting of the terminal levels caused by the local crystal field. Moreover, as the 7F0 level is also non-degenerative, site-selective excitation within the 7F05D0 absorption band can be performed using fluorescence line narrowing (FLN) spectroscopy, useful for distinguishing between different local environments around the Eu3+.
Time-resolved fluorescence line-narrowed (TRFLN) spectra of the 5D07F0-2 transitions of 80SiO2-20(1.5Eu3+: NaGdF4) powders heat-treated at 450 °C for 5 h were obtained at 9 K using different resonant excitation wavelengths throughout the 7F05D0 transition with a time delay of 10 μs. Depending on the excitation wavelength, the emission spectra present different characteristics, mainly related to the relative intensity and the level splitting of the transitions.
Figure 8 shows the low temperature (9 K) 5D07F0-2 emission spectra, obtained under excitation at 578.6 nm and 579 nm, both with a time delay of 10 µs after the laser pulse. These excitation wavelengths correspond to the highest emission intensities, with the spectrum obtained at 578.6 nm being more intense. Under excitation at 578.6 nm (Figure 8a), the 5D07F1 transition displays three stark components, which is in agreement with an Eu3+ occupying a site with orthorhombic symmetry, point group C2v, or lower [68]. The spectrum obtained under 579 nm excitation (Figure 8b) shows two components for the 5D07F1 transition. The presence of two components for the splitting of the 7F1 level and three for the 7F2 level is compatible with trigonal site symmetry (C3, C3v) for Eu3+ ions. It is well known that the expected space group for β-NaGdF4 is P 6 ¯ where Gd3+ occupy point symmetry C3h sites [38]. In this point symmetry, the 5D07F0 transition is forbidden and the number of lines for the 5D07F1,2 transitions are two and one, respectively [68]. However, the spectrum in Figure 8b shows the presence of the resonant 5D07F0 line as well as two and three components for the 5D07F1,2 emissions, respectively. This implies that a breaking symmetry occurs produced by lattice distortions which may reduce the original C3h symmetry to C3 according to the branching rules of the 32 point groups [69]. The presence of two distinguishable sites for Eu3+ ions is, therefore, compatible with the observed hexagonal and orthorhombic phases detected in the XRD patterns of the OxGCs powders.

4. Conclusions

Stable 1.5Eu3+: NaGdF4 nanoparticle suspensions were successfully prepared via hydrothermal synthesis.
Nanoparticle synthesis is described as a process consisting of a first nucleation step, followed by a competition with the crystal growth.
XRD confirmed that hexagonal NaGdF4 is the only present phase after sintering at 450 °C for 5 h.
FTIR spectra revealed that 1.5Eu3+: NaGdF4 nanoparticles synthesised for 20 h present oxygen defects, probably forming Gd-O bonds.
In addition, nanoparticles present pores, likely due to the long synthesis process during which the crystal growth needs a much longer time than the nucleation step.
Although it is still possible to fit synthesis parameters to obtain better crystallised and defect-free hexagonal NaGdF4 nanoparticles, these results are promising, opening a new route to prepare NaGdF4 nanoparticle aqueous suspensions without any addition of organic dispersant.
It was confirmed that the acid media in which the OxGCs were prepared affects the stability of NaGdF4, generating a partial crystal transformation from hexagonal to orthorhombic.
Emission and excitation spectra together with the lifetimes of the 5D0 state were measured for NPs and OxGCs with 1.5% Eu3+. The excitation spectra showed the Eu3+-O2− charge transfer band in accordance with the presence of oxygen in the lattice of the NPs. The emission spectra obtained by exciting the charge transfer band show similar features in both NPs and OxGCs, corresponding the higher emission intensity to the 5D07F2 transition which indicates a non-centrosymmetric site for Eu3+. The reduction in the lifetime value of the 5D0 level from 9.6 ms in the NPs to 7.9 ms in OxGCs could be attributed to the presence of the remaining organics in the silica matrix. TRFLN spectra obtained under selective excitation in the 7F05D0 absorption band at 9 K allow us to identify the existence of two distinguishable sites for Eu3+ ions in the OxGCs powders with C2v and C3 symmetries, which are compatible with the observed hexagonal and orthorhombic phases detected in the XRD diffraction patterns.

Author Contributions

Conceptualization, A.D. and Y.C.; Methodology, M.E.C., T.N.L.T. and R.B.; Formal analysis, M.E.C., T.N.L.T., A.C., R.B. and Y.C.; Investigation, M.E.C. and Y.C.; Data curation, M.E.C., A.D., J.F., R.B. and Y.C.; Writing—original draft, M.E.C. and Y.C.; Writing—review & editing, M.E.C., T.N.L.T., A.C., A.D., J.F., R.B. and Y.C.; Supervision, Y.C.; Funding acquisition, A.D. and R.B. All authors have read and agreed to the published version of the manuscript.

Funding

This project received funding from the European Union’s Horizon 2020 research and innovation program under grant agreement no. 739566. The authors acknowledge financial support from MICINN under projects PID2020-115419GB-C21-C22/AEI/10.13039/501100011033 and University of the Basque Country (Project GIU21/006).

Institutional Review Board Statement

Not applicable.

Informed Consent Statement

Not applicable.

Data Availability Statement

Data are available upon request.

Acknowledgments

The authors acknowledge financial support from MICINN under projects PID2020-115419GB-C21-C22/AEI /10.13039/501100011033 and from the University of the Basque Country (Project GIU21/006). This article is a part of the dissemination activities of the project FunGlass, which has received funding from the European Union’s Horizon 2020 research and innovation program under grant agreement No 739566.

Conflicts of Interest

The authors declare no conflict of interest.

References

  1. Boulard, B.; Dieudonné, B.; Gao, Y.; Chiasera, A.; Ferrari, M. Up-conversion visible emission in rare-earth doped fluoride glass waveguides. Opt. Eng. 2014, 53, 071814. [Google Scholar] [CrossRef]
  2. Cruz, M.E.; Castro, Y.; Durán, A. Glasses and Glass-Ceramics Prepared by Sol–Gel. Ref. Modul. Mater. Sci. Mater. Eng. 2020, 2, 695–708. [Google Scholar] [CrossRef]
  3. Sharma, R.K.; Mudring, A.V.; Ghosh, P. Recent trends in binary and ternary rare-earth fluoride nanophosphors: How structural and physical properties influence optical behavior. J. Lumin. 2017, 189, 44–63. [Google Scholar] [CrossRef]
  4. De Pablos-Martin, A.; Ferrari, M.; Pascual, M.J.; Righini, G.C. Glass-ceramics: A class of nanostructured materials for photonics. Riv. Del Nuovo Cim. 2015, 38, 311–369. [Google Scholar] [CrossRef]
  5. Gorni, G.; Velázquez, J.J.; Mosa, J.; Balda, R.; Fernández, J.; Durán, A.; Castro, Y. Transparent glass-ceramics produced by Sol-Gel: A suitable alternative for photonic materials. Materials 2018, 11, 212. [Google Scholar] [CrossRef] [Green Version]
  6. Sharma, R.K.; Ghosh, P. Lanthanide-Doped Luminescent Nanophosphors via Ionic Liquids. Front. Chem. 2021, 9, 715531. [Google Scholar] [CrossRef]
  7. Fedorov, P.P.; Luginina, A.A.; Popov, A.I. Transparent oxyfluoride glass ceramics. J. Fluor. Chem. 2015, 172, 22–50. [Google Scholar] [CrossRef]
  8. Alombert-Goget, G.; Armellini, C.; Berneschi, S.; Chiappini, A.; Chiasera, A.; Ferrari, M.; Guddala, S.; Moser, E.; Pelli, S.; Rao, D.N.; et al. Tb3+/Yb3+ co-activated Silica-Hafnia glass ceramic waveguides. Opt. Mater. 2010, 33, 227–230. [Google Scholar] [CrossRef]
  9. Lezhnina, M.M.; Jüstel, T.; Kätker, H.; Wiechert, D.U.; Kynast, U.H. Efficient luminescence from rare-earth fluoride nanoparticles with optically functional shells. Adv. Funct. Mater. 2006, 16, 935–942. [Google Scholar] [CrossRef]
  10. Biswas, K.; Sontakke, A.D.; Ghosh, J.; Annapurna, K. Enhanced blue emission from transparent oxyfluoride glass-ceramics containing Pr3+: BaF2 nanocrystals. J. Am. Ceram. Soc. 2010, 93, 1010–1017. [Google Scholar] [CrossRef]
  11. Dong, C.; Pichaandi, J.; Regier, T.; Van Veggel, F.C.J.M. Nonstatistical dopant distribution of Ln3+-doped NaGdF 4 nanoparticles. J. Phys. Chem. C 2011, 115, 15950–15958. [Google Scholar] [CrossRef]
  12. Tissue, B.M. Synthesis and luminescence of lanthanide ions in nanoscale insulating hosts. Chem. Mater. 1998, 10, 2837–2845. [Google Scholar] [CrossRef]
  13. Velázquez, J.J.; Mosa, J.; Gorni, G.; Balda, R.; Fernández, J.; Durán, A.; Castro, Y. Novel sol-gel SiO2-NaGdF4 transparent nano-glass-ceramics. J. Non. Cryst. Solids 2019, 520, 119447. [Google Scholar] [CrossRef]
  14. Thoma, B.R.E.; Insley, H. The Sodium Fluoride-Lanthanide. Inorg. Chem. 1964, 1005, 1222–1229. [Google Scholar]
  15. You, F.; Wang, Y.; Lin, J.; Tao, Y. Hydrothermal synthesis and luminescence properties of NaGdF4:Eu. J. Alloys Compd. 2002, 343, 151–155. [Google Scholar] [CrossRef]
  16. Sun, L.; Shi, S.; Geng, H.; Huang, Y.; Qiao, Y.; Song, J.; Yang, L.; Grimes, C.A.; Feng, X.; Cai, Q. NaGdF4:Nd@NaGdF4 Core-Shell Down-Conversion Nanoparticles as NIR-II Fluorescent Probes for Targeted Imaging of Bacteria. ACS Appl. Nano Mater. 2021, 4, 11231–11238. [Google Scholar] [CrossRef]
  17. Chen, G.; Yang, C. Nanophotonics and Nanochemistry: Controlling the Excitation Dynamics for Frequency Up- and Down-Conversion in Lanthanide-Doped Nanoparticles. Acc. Chem. Res. 2013, 46, 1474–1486. [Google Scholar] [CrossRef]
  18. Ramasamy, P.; Chandra, P.; Rhee, S.W.; Kim, J. Enhanced upconversion luminescence in NaGdF4:Yb,Er nanocrystals by Fe3+ doping and their application in bioimaging. Nanoscale 2013, 5, 8711–8717. [Google Scholar] [CrossRef]
  19. Xin, F.; Zhao, S.; Huang, L.; Deng, D.; Jia, G.; Wang, H.; Xu, S. Up-conversion luminescence of Er3+ - doped glass ceramics containing β-NaGdF4 nanocrystals for silicon solar cells. Mater. Lett. 2012, 78, 75–77. [Google Scholar] [CrossRef]
  20. Herrmann, A.; Tylkowski, M.; Bocker, C.; Rüssel, C. Cubic and hexagonal NaGdF4 crystals precipitated from an aluminosilicate glass: Preparation and luminescence properties. Chem. Mater. 2013, 25, 2878–2884. [Google Scholar] [CrossRef]
  21. Wei, Y.; Li, J.; Yang, J.; Chi, X.; Guo, H. Enhanced green upconversion in Tb3+–Yb3+ co-doped oxyfluoride glass ceramics containing LaF3 nanocrystals. J. Lumin. 2013, 137, 70–72. [Google Scholar] [CrossRef]
  22. Sarakovskis, A.; Krieke, G. Upconversion luminescence in erbium doped transparent oxyfluoride glass ceramics containing hexagonal NaYF4 nanocrystals. J. Eur. Ceram. Soc. 2015, 35, 3665–3671. [Google Scholar] [CrossRef]
  23. Cao, J.; Chen, W.; Xu, D.; Hu, F.; Chen, L.P.; Guo, H. Wide-range thermometry based on green up-conversion of Yb3+/Er3+ co-doped KLu2F7 transparent bulk oxyfluoride glass ceramics. J. Lumin. 2018, 194, 219–224. [Google Scholar] [CrossRef]
  24. Fiume, E.; Cao, S.P.O.; Na, M.; Migneco, C.; Vern, E. Comparison between Bioactive Sol-Gel and Melt-Derived Glasses/Glass-Ceramics Based on the Multicomponent SiO2–P2O5–CaO–MgO–Na2O–K2O System. Materials 2020, 13, 540. [Google Scholar] [CrossRef] [PubMed] [Green Version]
  25. Cruz, M.E.; Sedano, M.; Castro, Y.; Pascual, M.J.; Fernández, J.; Balda, R.; Durán, A. Rare-earth doped transparent oxyfluoride glass-ceramics: Processing is the key [Invited]. Opt. Mater. Express 2022, 12, 3493. [Google Scholar] [CrossRef]
  26. Pierre, A.C. The Sol-Gel Chemistry of Oxides from Alkoxides. In Introduction to Sol-Gel Processing; Springer: Berlin/Heidelberg, Germany, 2020; ISBN 9783030381431. [Google Scholar]
  27. Brinker, C.J.; Scherer, G.W. Sol-Gel Science—The Physics and Chemistry of Sol-Gel Processing; Academic Press, Inc.: San Diego, CA, USA, 1990; p. 462. [Google Scholar] [CrossRef]
  28. Roy, R. Ceramics by the solution-sol-gel route. Science 1987, 238, 1664–1669. [Google Scholar] [CrossRef] [PubMed]
  29. Hench, L.L.; West, J.K. The Sol-Gel Process. Chem. Rev. 1990, 90, 33–72. [Google Scholar] [CrossRef]
  30. Cruz, M.E.; Castro, Y.; Durán, A. Transparent oxyfluoride glass-ceramics obtained by different sol-gel routes. J. Sol-Gel Sci. Technol. 2022, 102, 523–533. [Google Scholar] [CrossRef]
  31. Gorni, G.; Velázquez, J.J.; Mosa, J.; Mather, G.C.; Serrano, A.; Vila, M.; Castro, G.R.; Bravo, D.; Balda, R.; Fernández, J.; et al. Transparent sol-gel oxyfluoride glass-ceramics with high crystalline fraction and study of re incorporation. Nanomaterials 2019, 9, 530. [Google Scholar] [CrossRef] [Green Version]
  32. Cruz, M.E.; Durán, A.; Balda, R.; Fernández, J.; Mather, G.C.; Castro, Y. A new sol–gel route towards Nd3+ -doped SiO2 –LaF3 glass-ceramics for photonic applications. Mater. Adv. 2020, 1, 3589–3596. [Google Scholar] [CrossRef]
  33. Cruz, M.E.; Fernandez, J.; Durán, A.; Balda, R.; Castro, Y. Optically active nano-glass-ceramic coatings of Nd3+ doped-80SiO2-20LaF3 prepared by the pre-crystallized nanoparticles sol-gel route. J. Non. Cryst. Solids 2023, 601, 122050. [Google Scholar] [CrossRef]
  34. Zhang, W.; Zang, Y.; Lu, Y.; Han, J.; Xiong, Q.; Xiong, J. Synthesis of Rare-Earth Nanomaterials Ag-Doped NaYF4: Yb3+/Er3+ @ NaYF 4: Nd 3 + @ NaGdF 4 for In Vivo Imaging. Nanomaterials 2022, 12, 728. [Google Scholar] [CrossRef] [PubMed]
  35. Ranasinghe, M.; Arifuzzaman, M.; Rajamanthrilage, A.C.; Willoughby, W.R.; Dickey, A.; McMillen, C.; Kolis, J.W.; Bolding, M.; Anker, J.N. X-ray excited luminescence spectroscopy and imaging with NaGdF4:Eu and Tb. RSC Adv. 2021, 11, 31717–31726. [Google Scholar] [CrossRef]
  36. Shao, Q.; Yang, C.; Chen, X.; Zhang, H.; Feng, G.; Zhou, S.; Zhou, S. Core-mediated synthesis, growth mechanism and near-infrared luminescence enhancement of α-NaGdF4@β-NaLuF4:Nd3+ core-shell nanocrystals. CrystEngComm 2020, 22, 1359–1367. [Google Scholar] [CrossRef]
  37. Rahman, P.; Green, M. The synthesis of rare earth fluoride based nanoparticles. Nanoscale 2009, 1, 214–224. [Google Scholar] [CrossRef] [PubMed]
  38. Mech, A.; Karbowiak, M.; Kȩpiński, L.; Bednarkiewicz, A.; Strȩk, W. Structural and luminescent properties of nano-sized NaGdF4:Eu3+ synthesised by wet-chemistry route. J. Alloys Compd. 2004, 380, 315–320. [Google Scholar] [CrossRef]
  39. Karbowiak, M.; Mech, A.; Bednarkiewicz, A.; Strȩk, W. Structural and luminescent properties of nanostructured KGdF4:Eu3+ synthesised by coprecipitation method. J. Alloys Compd. 2004, 380, 321–326. [Google Scholar] [CrossRef]
  40. Sudheendra, L.; Das, G.K.; Li, C.; Stark, D.; Cena, J.; Cherry, S.; Kennedy, I.M. NaGdF4:Eu3+ nanoparticles for enhanced X-ray excited optical imaging. Chem. Mater. 2014, 26, 1881–1888. [Google Scholar] [CrossRef] [PubMed]
  41. Xu, D.K.; Yang, S.H.; Zhang, Y.L. Down-converted luminescence and energy transfer of α -KGd 1−x Eu x F 4 nanophosphors with selective excitation. J. Lumin. 2013, 143, 298–303. [Google Scholar] [CrossRef]
  42. Khan, L.U.; Khan, Z.U.; Rodrigues, R.V.; da Costa, L.S.; Gidlund, M.; Brito, H.F. Synthesis and characterization of tunable color upconversion luminescence β-NaGdF4:Yb3+,Er3+ nanoparticles. J. Mater. Sci. Mater. Electron. 2019, 30, 16856–16863. [Google Scholar] [CrossRef]
  43. Balda, R.; Fernández, J.; Adam, J. Time-resolved fluorescence-line narrowing and energy-transfer studies in a-doped fluorophosphate glass. Phys. Rev. B-Condens. Matter Mater. Phys. 1996, 54, 12076–12086. [Google Scholar] [CrossRef] [PubMed]
  44. Chamuah, A.; Ojha, S.; Bhattacharya, K.; Ghosh, C.K.; Bhattacharya, S. AC conductivity and electrical relaxation of a promising Ag2S-Ge-Te-Se chalcogenide glassy system. J. Phys. Chem. Solids 2022, 166, 110695. [Google Scholar] [CrossRef]
  45. Da Silva, A.L.; de Oliveira, A.H.; Fernandes, M.L.S. Influence of preferred orientation of minerals in the mineralogical identification process by X-ray diffraction. In Proceedings of the INAC 2011: International Nuclear Atlantic Conference, Belo Horizonte, MG, Brazil, 24–25 October 2011; Volume 11. [Google Scholar]
  46. He, F.; Yang, P.; Wang, D.; Niu, N.; Gai, S.; Li, X. Self-assembled β-NaGdF4 microcrystals: Hydrothermal synthesis, morphology evolution, and luminescence properties. Inorg. Chem. 2011, 50, 4116–4124. [Google Scholar] [CrossRef] [PubMed]
  47. Bogachev, N.A.; Betina, A.A.; Bulatova, T.S.; Nosov, V.G.; Kolesnik, S.S.; Tumkin, I.I.; Ryazantsev, M.N.; Skripkin, M.Y.; Mereshchenko, A.S. Lanthanide-Ion-Doping Effect on the Morphology and the Structure of NaYF4:Ln3+ Nanoparticles. Nanomaterials 2022, 12, 2972. [Google Scholar] [CrossRef]
  48. Wu, Y.; Li, C.; Yang, D.; Lin, J. Rare earth β-NaGdF4 fluorides with multiform morphologies: Hydrothermal synthesis and luminescent properties. J. Colloid Interface Sci. 2011, 354, 429–436. [Google Scholar] [CrossRef] [PubMed]
  49. Teng, X.; Liang, X.; Maksimuk, S.; Yang, H. Synthesis of porous platinum nanoparticles. Small 2006, 2, 249–253. [Google Scholar] [CrossRef]
  50. Liu, J.; Yu, H.; Zhang, L.; Dong, H.; Liu, S.; Zhao, L. Controlling the final phase of multiphase KGdF4 materials via chemical synthesis and structural phase transition. J. Mater. Sci. Mater. Electron. 2020, 31, 18096–18104. [Google Scholar] [CrossRef]
  51. Cruz, M.E.; Li, J.; Gorni, G.; Durán, A.; Mather, G.C.; Balda, R.; Fernández, J.; Castro, Y. Nd3+doped- SiO2–KLaF4 oxyfluoride glass-ceramics prepared by sol-gel. J. Lumin. 2021, 235, 118035. [Google Scholar] [CrossRef]
  52. Vijayaprasath, G.; Murugan, R.; Hayakawa, Y.; Ravi, G. Optical and magnetic studies on Gd doped ZnO nanoparticles synthesized by co-precipitation method. J. Lumin. 2016, 178, 375–383. [Google Scholar] [CrossRef]
  53. Passuello, T.; Pedroni, M.; Piccinelli, F.; Polizzi, S.; Marzola, P.; Tambalo, S.; Conti, G.; Benati, D.; Vetrone, F.; Bettinelli, M.; et al. PEG-capped, lanthanide doped GdF3 nanoparticles: Luminescent and T2 contrast agents for optical MRI multimodal imaging. Nanoscale 2012, 4, 7682–7689. [Google Scholar] [CrossRef] [Green Version]
  54. Ptacek, P.; Schäfer, H.; Kömpe, K.; Haase, M. Crystal phase control of luminescing NaGdF4:Eu3+ nanocrystals. Adv. Funct. Mater. 2007, 17, 3843–3848. [Google Scholar] [CrossRef]
  55. Reisfeld, R.; Zigansky, E.; Gaft, M. Europium probe for estimation of site symmetry in glass films, glasses and crystals. Mol. Phys. 2004, 102, 1319–1330. [Google Scholar] [CrossRef]
  56. Ghosh, P.; Tang, S.; Mudring, A.V. Efficient quantum cutting in hexagonal NaGdF4:Eu3+ nanorods. J. Mater. Chem. 2011, 21, 8640–8644. [Google Scholar] [CrossRef] [Green Version]
  57. Wegh, R.; Donker, H.; Meijerink, A.; Lamminmäki, R.; Hölsä, J. Vacuum-ultraviolet spectroscopy and quantum cutting for Gd3+ in LYF4. Phys. Rev. B-Condens. Matter Mater. Phys. 1997, 56, 13841–13848. [Google Scholar] [CrossRef] [Green Version]
  58. Lepoutre, S.; Boyer, D.; Mahiou, R. Quantum cutting abilities of sol-gel derived LiGdF4:Eu3+ powders. J. Lumin. 2008, 128, 635–641. [Google Scholar] [CrossRef]
  59. Rabouw, F.T.; Prins, P.T.; Norris, D.J. Europium-Doped NaYF4 Nanocrystals as Probes for the Electric and Magnetic Local Density of Optical States throughout the Visible Spectral Range. Nano Lett. 2016, 16, 7254–7260. [Google Scholar] [CrossRef] [Green Version]
  60. Pathak, T.K.; Kumar, A.; Swart, H.C.; Kroon, R.E. Effect of annealing on structural and luminescence properties of Eu3+ doped NaYF4 phosphor. Phys. B Condens. Matter 2018, 535, 132–137. [Google Scholar] [CrossRef]
  61. Liu, Y.; Tu, D.; Zhu, H.; Li, R.; Luo, W.; Chen, X. A strategy to achieve efficient dual-mode luminescence of Eu3+ in Lanthanides doped multifuncional NaGdF4 nanocrystals. Adv. Mater. 2010, 22, 3266–3271. [Google Scholar] [CrossRef] [PubMed]
  62. Karbowiak, M.; Mech, A.; Bednarkiewicz, A.; Strȩk, W.; Kȩpiński, L. Comparison of different NaGdF4:Eu3+ synthesis routes and their influence on its structural and luminescent properties. J. Phys. Chem. Solids 2005, 66, 1008–1019. [Google Scholar] [CrossRef]
  63. Zhang, W.; Shen, Y.; Liu, M.; Gao, P.; Pu, H.; Fan, L.; Jiang, R.; Liu, Z.; Shi, F.; Lu, H. Sub-10 nm Water-Dispersible β-NaGdF4:X% Eu3+ Nanoparticles with Enhanced Biocompatibility for in Vivo X-ray Luminescence Computed Tomography. ACS Appl. Mater. Interfaces 2017, 9, 39985–39993. [Google Scholar] [CrossRef] [PubMed]
  64. Tuomela, A.; Pankratov, V.; Sarakovskis, A.; Doke, G.; Grinberga, L.; Vielhauer, S.; Huttula, M. Oxygen influence on luminescence properties of rare-earth doped NaLaF4. J. Lumin. 2016, 179, 16–20. [Google Scholar] [CrossRef]
  65. Ladol, J.; Khajuria, H.; Khajuria, S.; Sheikh, H.N. Hydrothermal synthesis, characterization and luminescent properties of lanthanide-doped NaLaF4 nanoparticles. Bull. Mater. Sci. 2016, 39, 943–952. [Google Scholar] [CrossRef] [Green Version]
  66. Zhu, L.; Liu, X.; Meng, J.; Cao, X. Facile sonochemical synthesis of single-crystalline europium fluorine with novel nanostructure. Cryst. Growth Des. 2007, 7, 2505–2511. [Google Scholar] [CrossRef]
  67. Kasturi, S.; Sivakumar, V.; Jeon, D.Y. Europium-activated rare earth fluoride (LnF3:Eu3+–Ln = La, Gd) nanocrystals prepared by using ionic liquid/NH4F as a fluorine source via hydrothermal synthesis. Luminescence 2016, 31, 1138–1145. [Google Scholar] [CrossRef]
  68. Binnemans, K. Interpretation of europium(III) spectra. Coord. Chem. Rev. 2015, 295, 1–45. [Google Scholar] [CrossRef] [Green Version]
  69. Butler, P.H. Point Group Symmetry Application: Method and Tables; in Plenum 5; Springer: Berlin/Heidelberg, Germany, 1981. [Google Scholar]
Figure 1. XRD patterns of (a) 1.5Eu3+: NaGdF4 NPs synthesised for 20 h and 24 h at 180 °C in the autoclave; (b) 1.5Eu3+: NaGdF4 NPs synthesised for 20 h at 180 °C and heat-treated at 450 °C and 550 °C for 5 h. (c) Williamson–Hall plot from the XRD of 1.5Eu3+: NaGdF4 NPs synthesised for 20 h and 24 h.
Nanomaterials 13 00940 g001
Figure 2. HR TEM images of (a) 1.5Eu3+: NaGdF4 NPs heat-treated at 450 °C for 5 h; (b) the corresponding nanoparticle size distribution taken from the image on “a”; (c) amplification of the area selected in “a” with the porous size measurement; (d) amplification of the area selected in “a” with the lattice distance measurement.
Nanomaterials 13 00940 g002
Figure 3. XRD pattern of OxGCs with the composition 80SiO2-20(1.5Eu3+: NaGdF4) heat-treated at 450 °C for 5 h.
Nanomaterials 13 00940 g003
Figure 4. (a) FTIR spectra from 4000 cm−1 to 450 cm−1 of undoped NaGdF4 NPs, 1.5Eu3+: NaGdF4 NPs (violet and blue line, respectively) and OxGCs with the composition 80SiO2-20(1.5Eu3+: NaGdF4) dried overnight at 75 °C and heat-treated at 450 °C for 5 h (red and green line, respectively) and (b) FTIR spectra recorded from 1500 to 400 cm−1 of 1.5Eu3+: NaGdF4 NPs and 80SiO2-20(1.5Eu3+: NaGdF4) OxGCs with the composition (blue, red and green line, respectively).
Nanomaterials 13 00940 g004
Figure 5. (a) Excitation spectrum of Eu3+ and Gd3+ ions from 1.5Eu3+: NaGdF4 NPs heat-treated at 450 °C for 5 h, collecting the luminescence at 615 nm. (b) Emission spectra of Eu3+ and Gd3+ ions from 1.5Eu3+: NaGdF4 NPs heat-treated at 450 °C for 5 h, excited at 245 nm (blue line) and 272 nm (red line).
Nanomaterials 13 00940 g005
Figure 6. Experimental decay curve from 5D0 level of Eu3+ in 1.5Eu3+: NaGdF4 NPs heat-treated at 450 °C for 5 h, taken under excitation at 245 nm and collecting the luminescence at 615 nm.
Nanomaterials 13 00940 g006
Figure 7. (a) Emission spectrum of Eu3+ and Gd3+ ions from OxGCs powders with the composition 80SiO2-20(1.5Eu3+: NaGdF4) under excitation at 245 nm and (b) experimental decay curve from the 5D0 level obtained by collecting the luminescence at 615 nm.
Nanomaterials 13 00940 g007
Figure 8. Time-resolved fluorescence line-narrowed emission spectra of the 5D07F0,1,2 transitions of Eu3+ ions measured at 9 K at a time delay of 10 µs after the laser pulse under an excitation at (a) 578.6 nm and (b) 579 nm, respectively, for the 80SiO2-20(1.5Eu3+: NaGdF4) powders heat-treated at 450 °C for 5 h.
Nanomaterials 13 00940 g008
Disclaimer/Publisher’s Note: The statements, opinions and data contained in all publications are solely those of the individual author(s) and contributor(s) and not of MDPI and/or the editor(s). MDPI and/or the editor(s) disclaim responsibility for any injury to people or property resulting from any ideas, methods, instructions or products referred to in the content.

