
Rhodium-Based Catalysts: An Impact of the Support Nature on the Catalytic Cyclohexane Ring Opening
 , ,
, ,
Abstract
:1. Introduction
2. Materials and Methods
2.1. Materials
2.2. Methods
2.3. Synthetic Procedure
3. Results
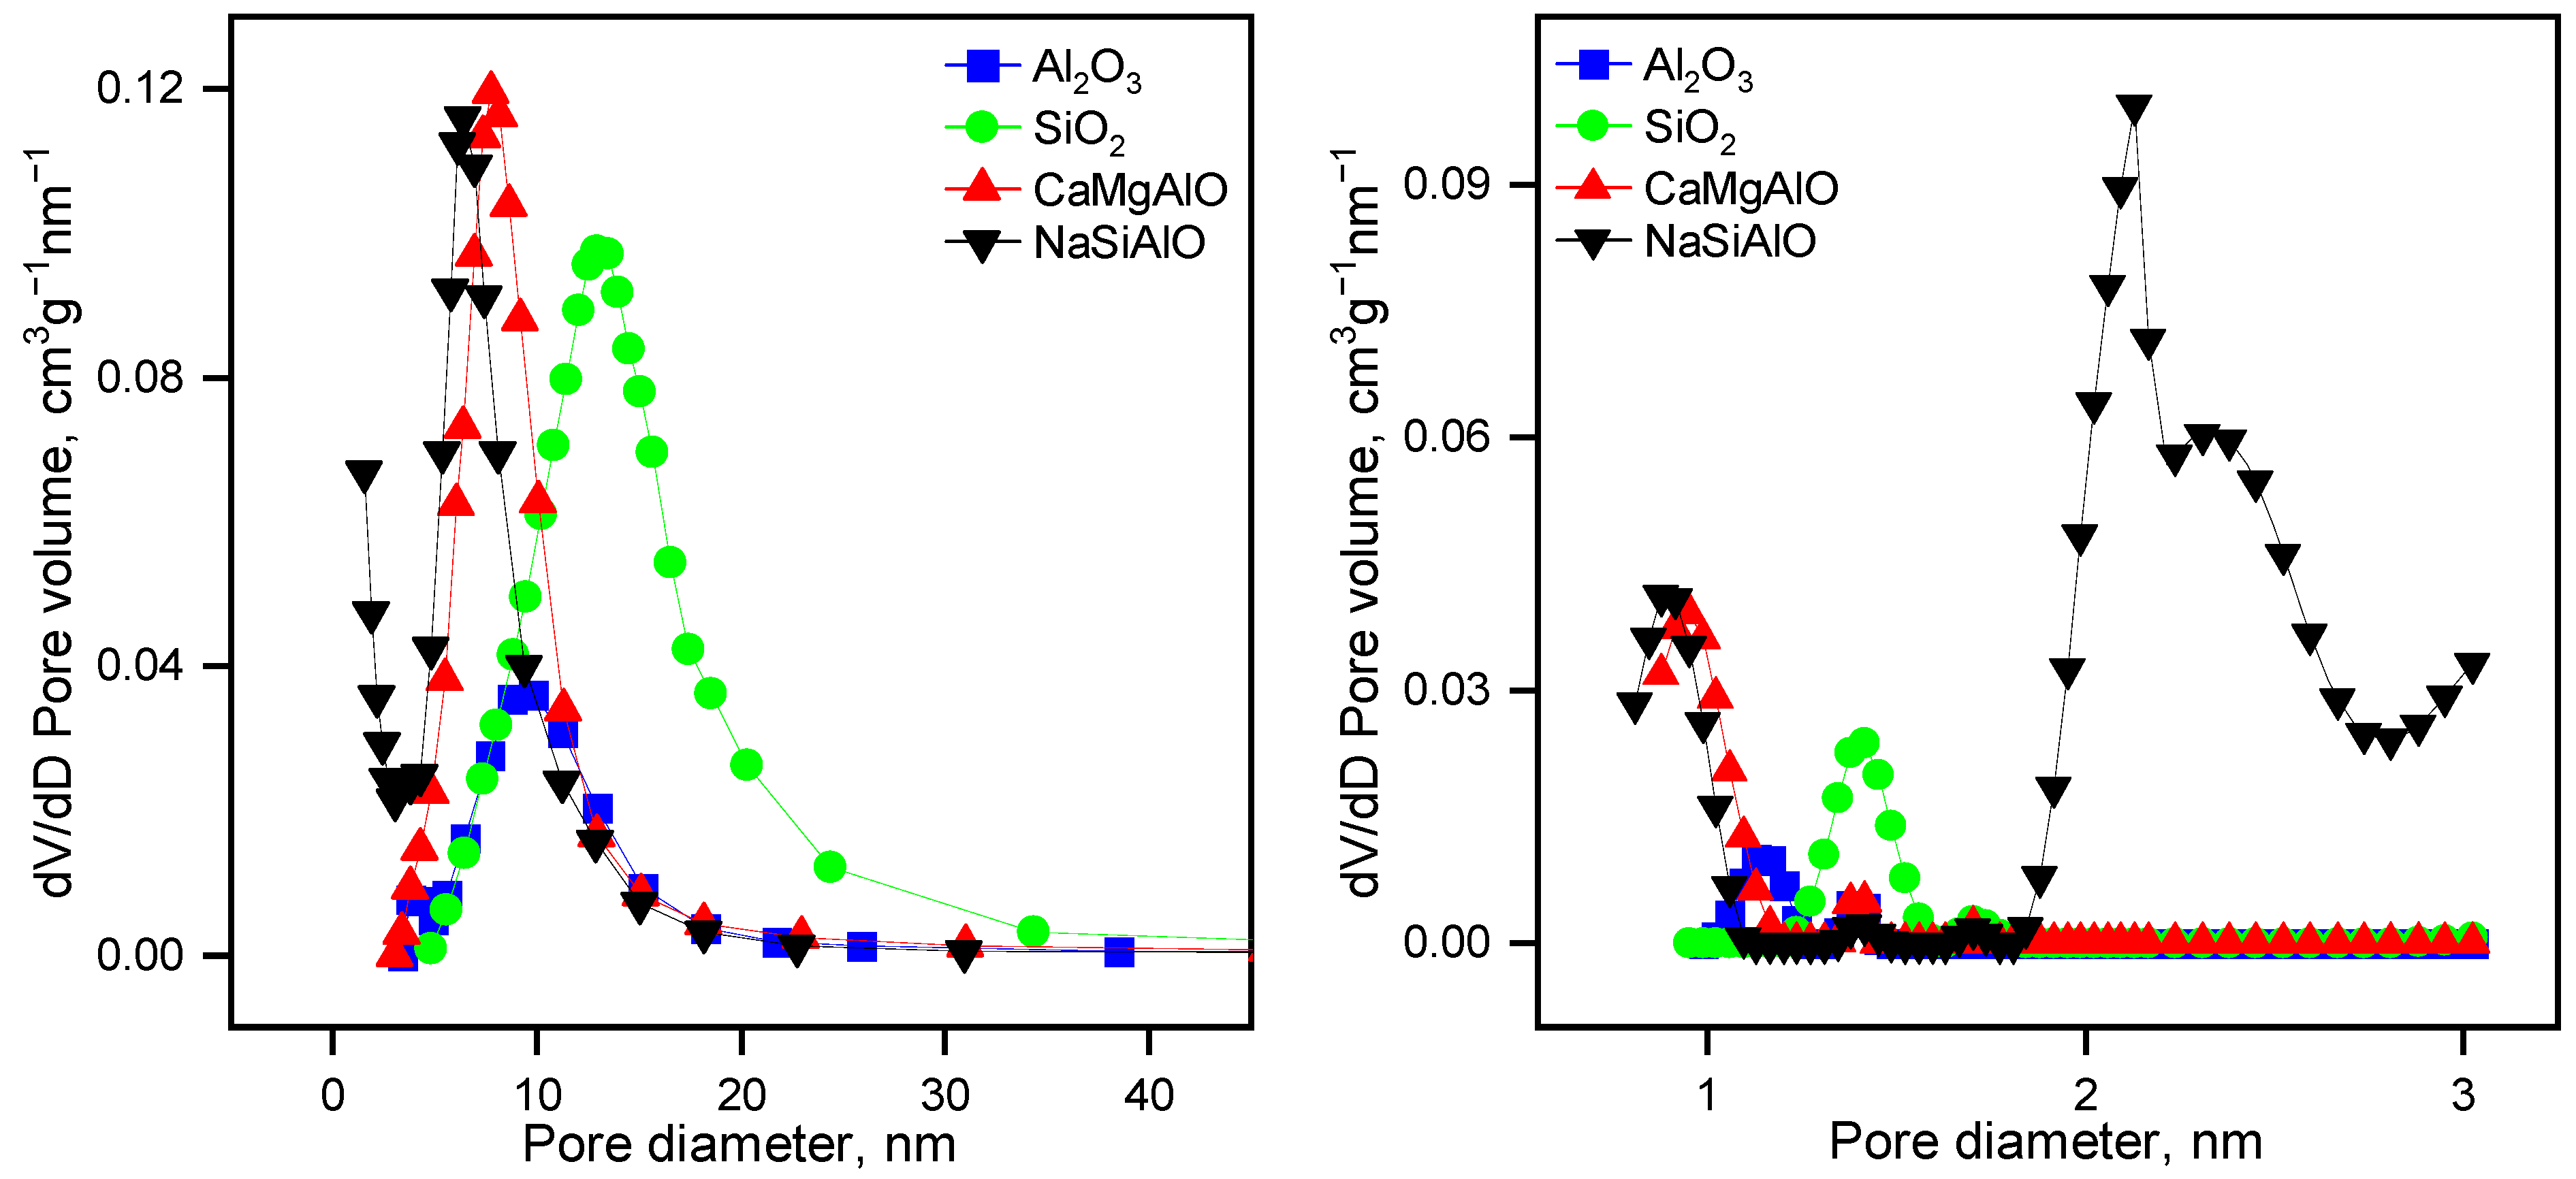
3.1. BJH–BET Measurements
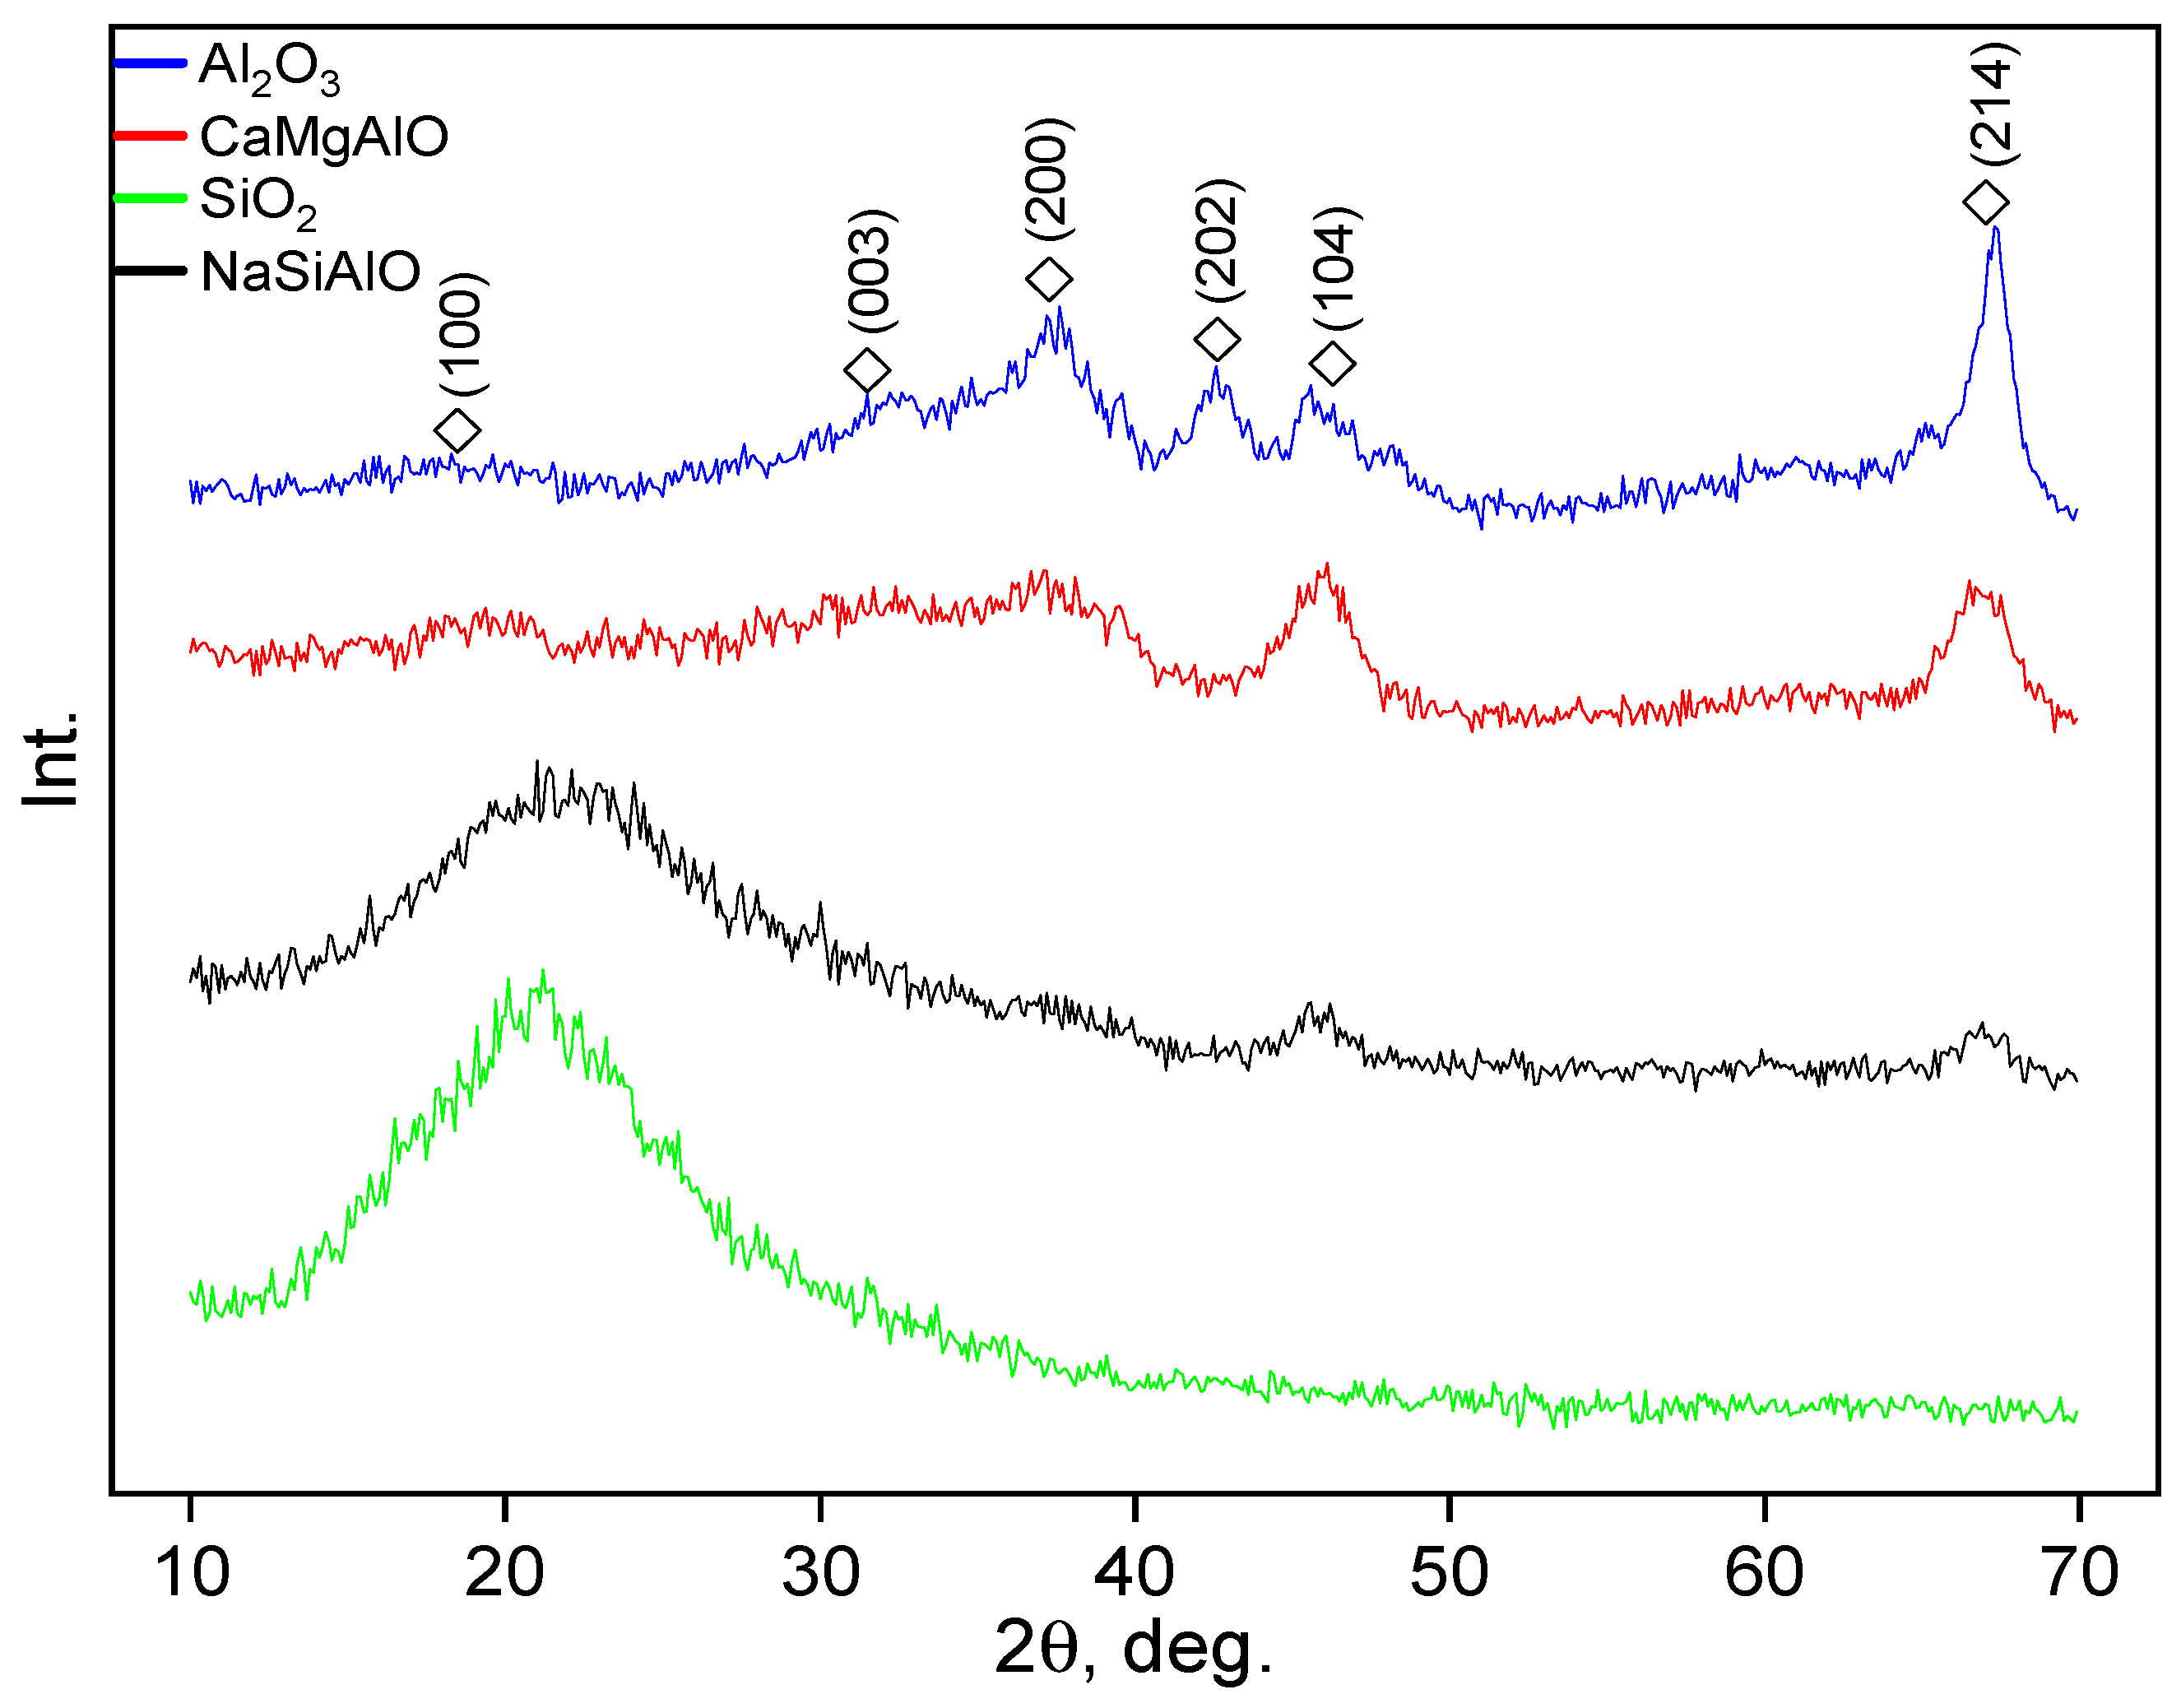
3.2. XRD
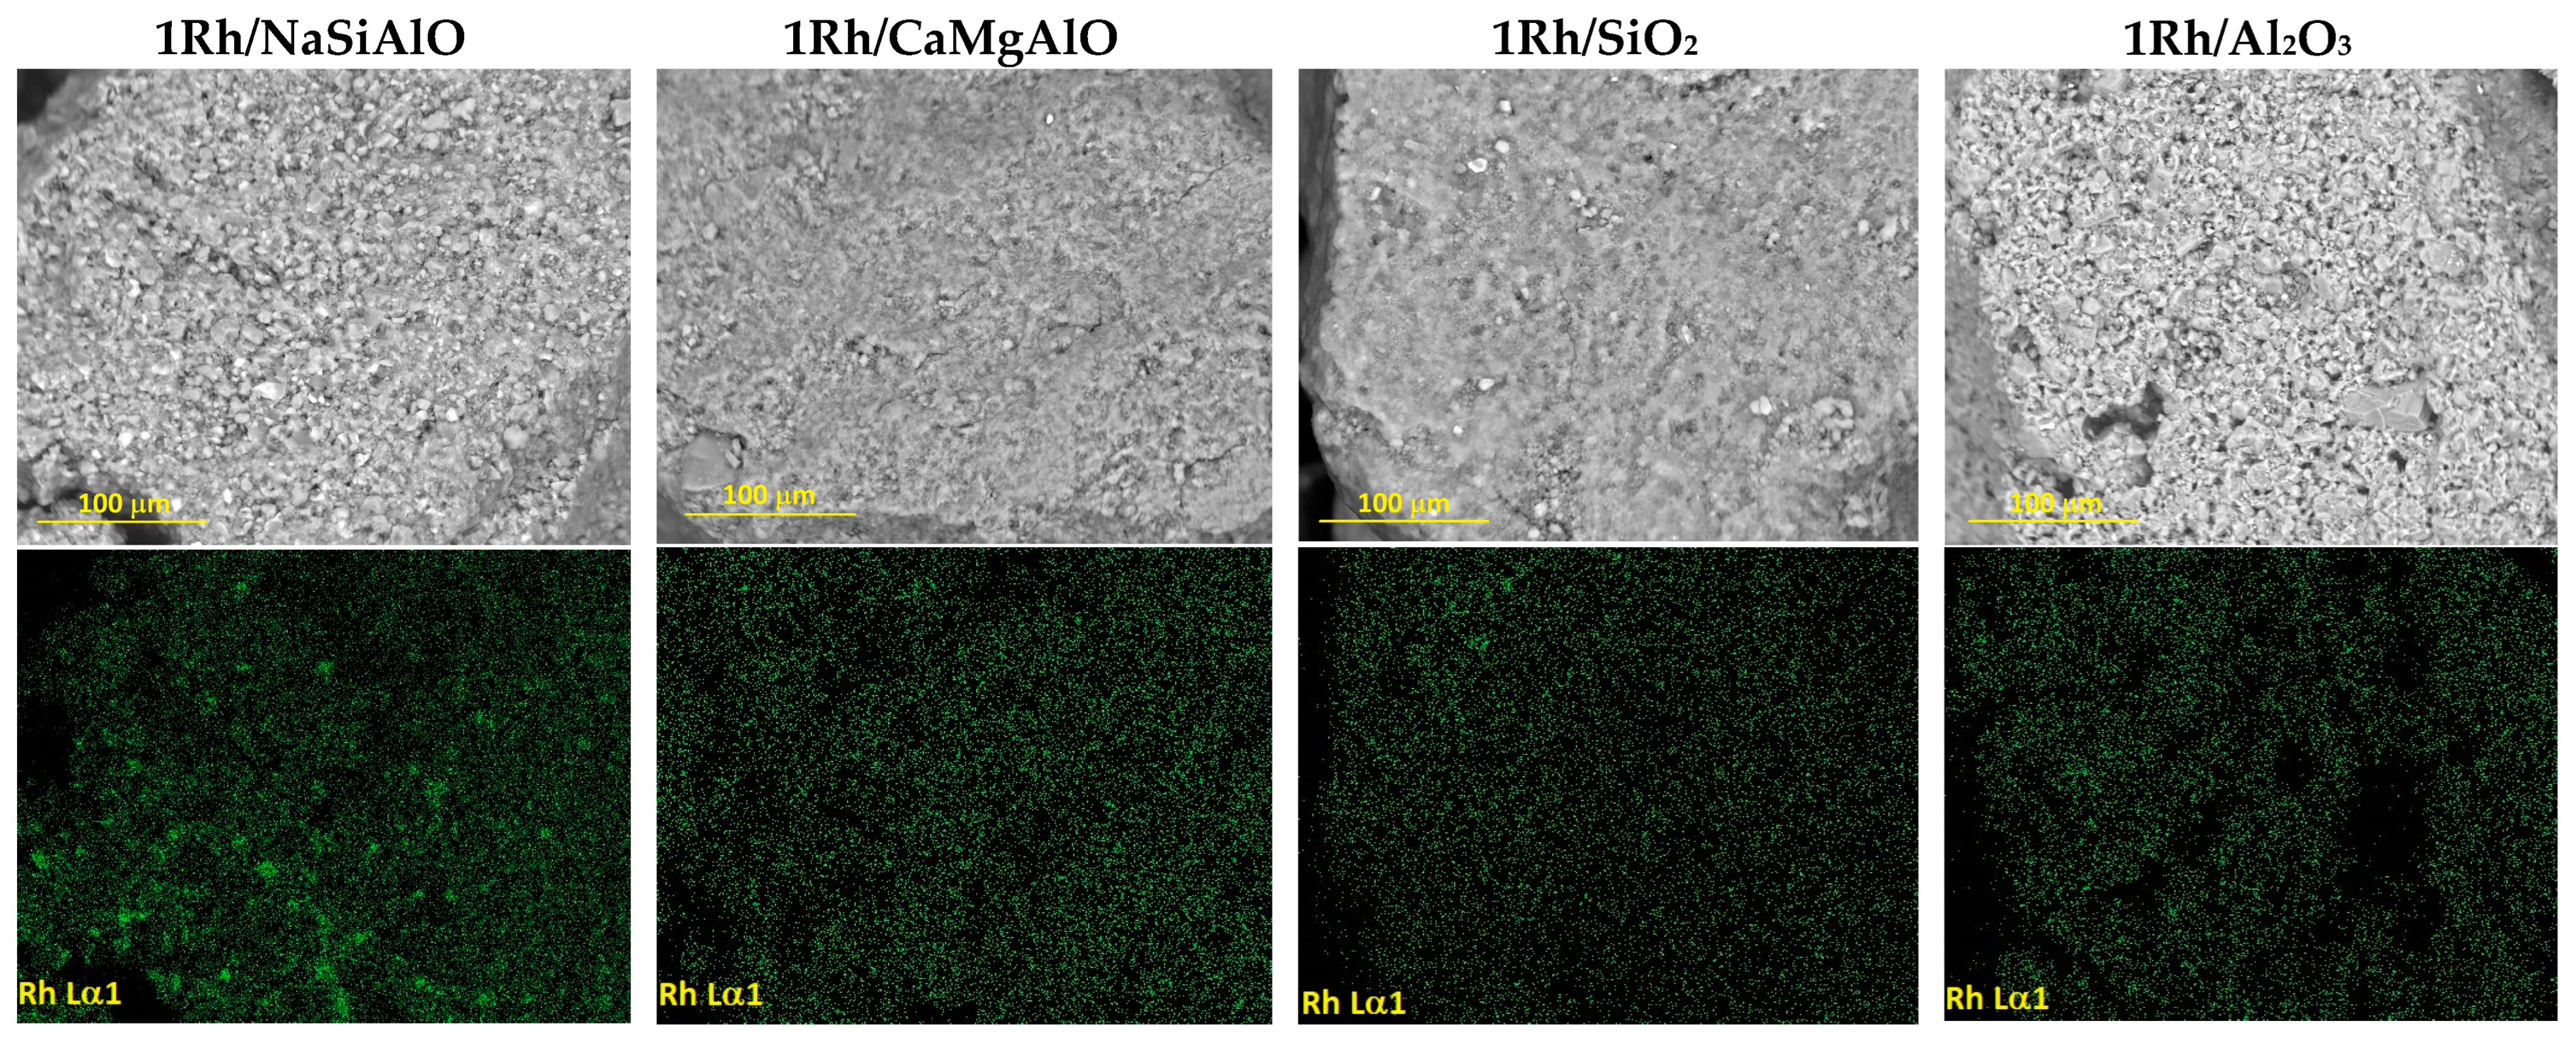
3.3. SEM and EDX Characterisation
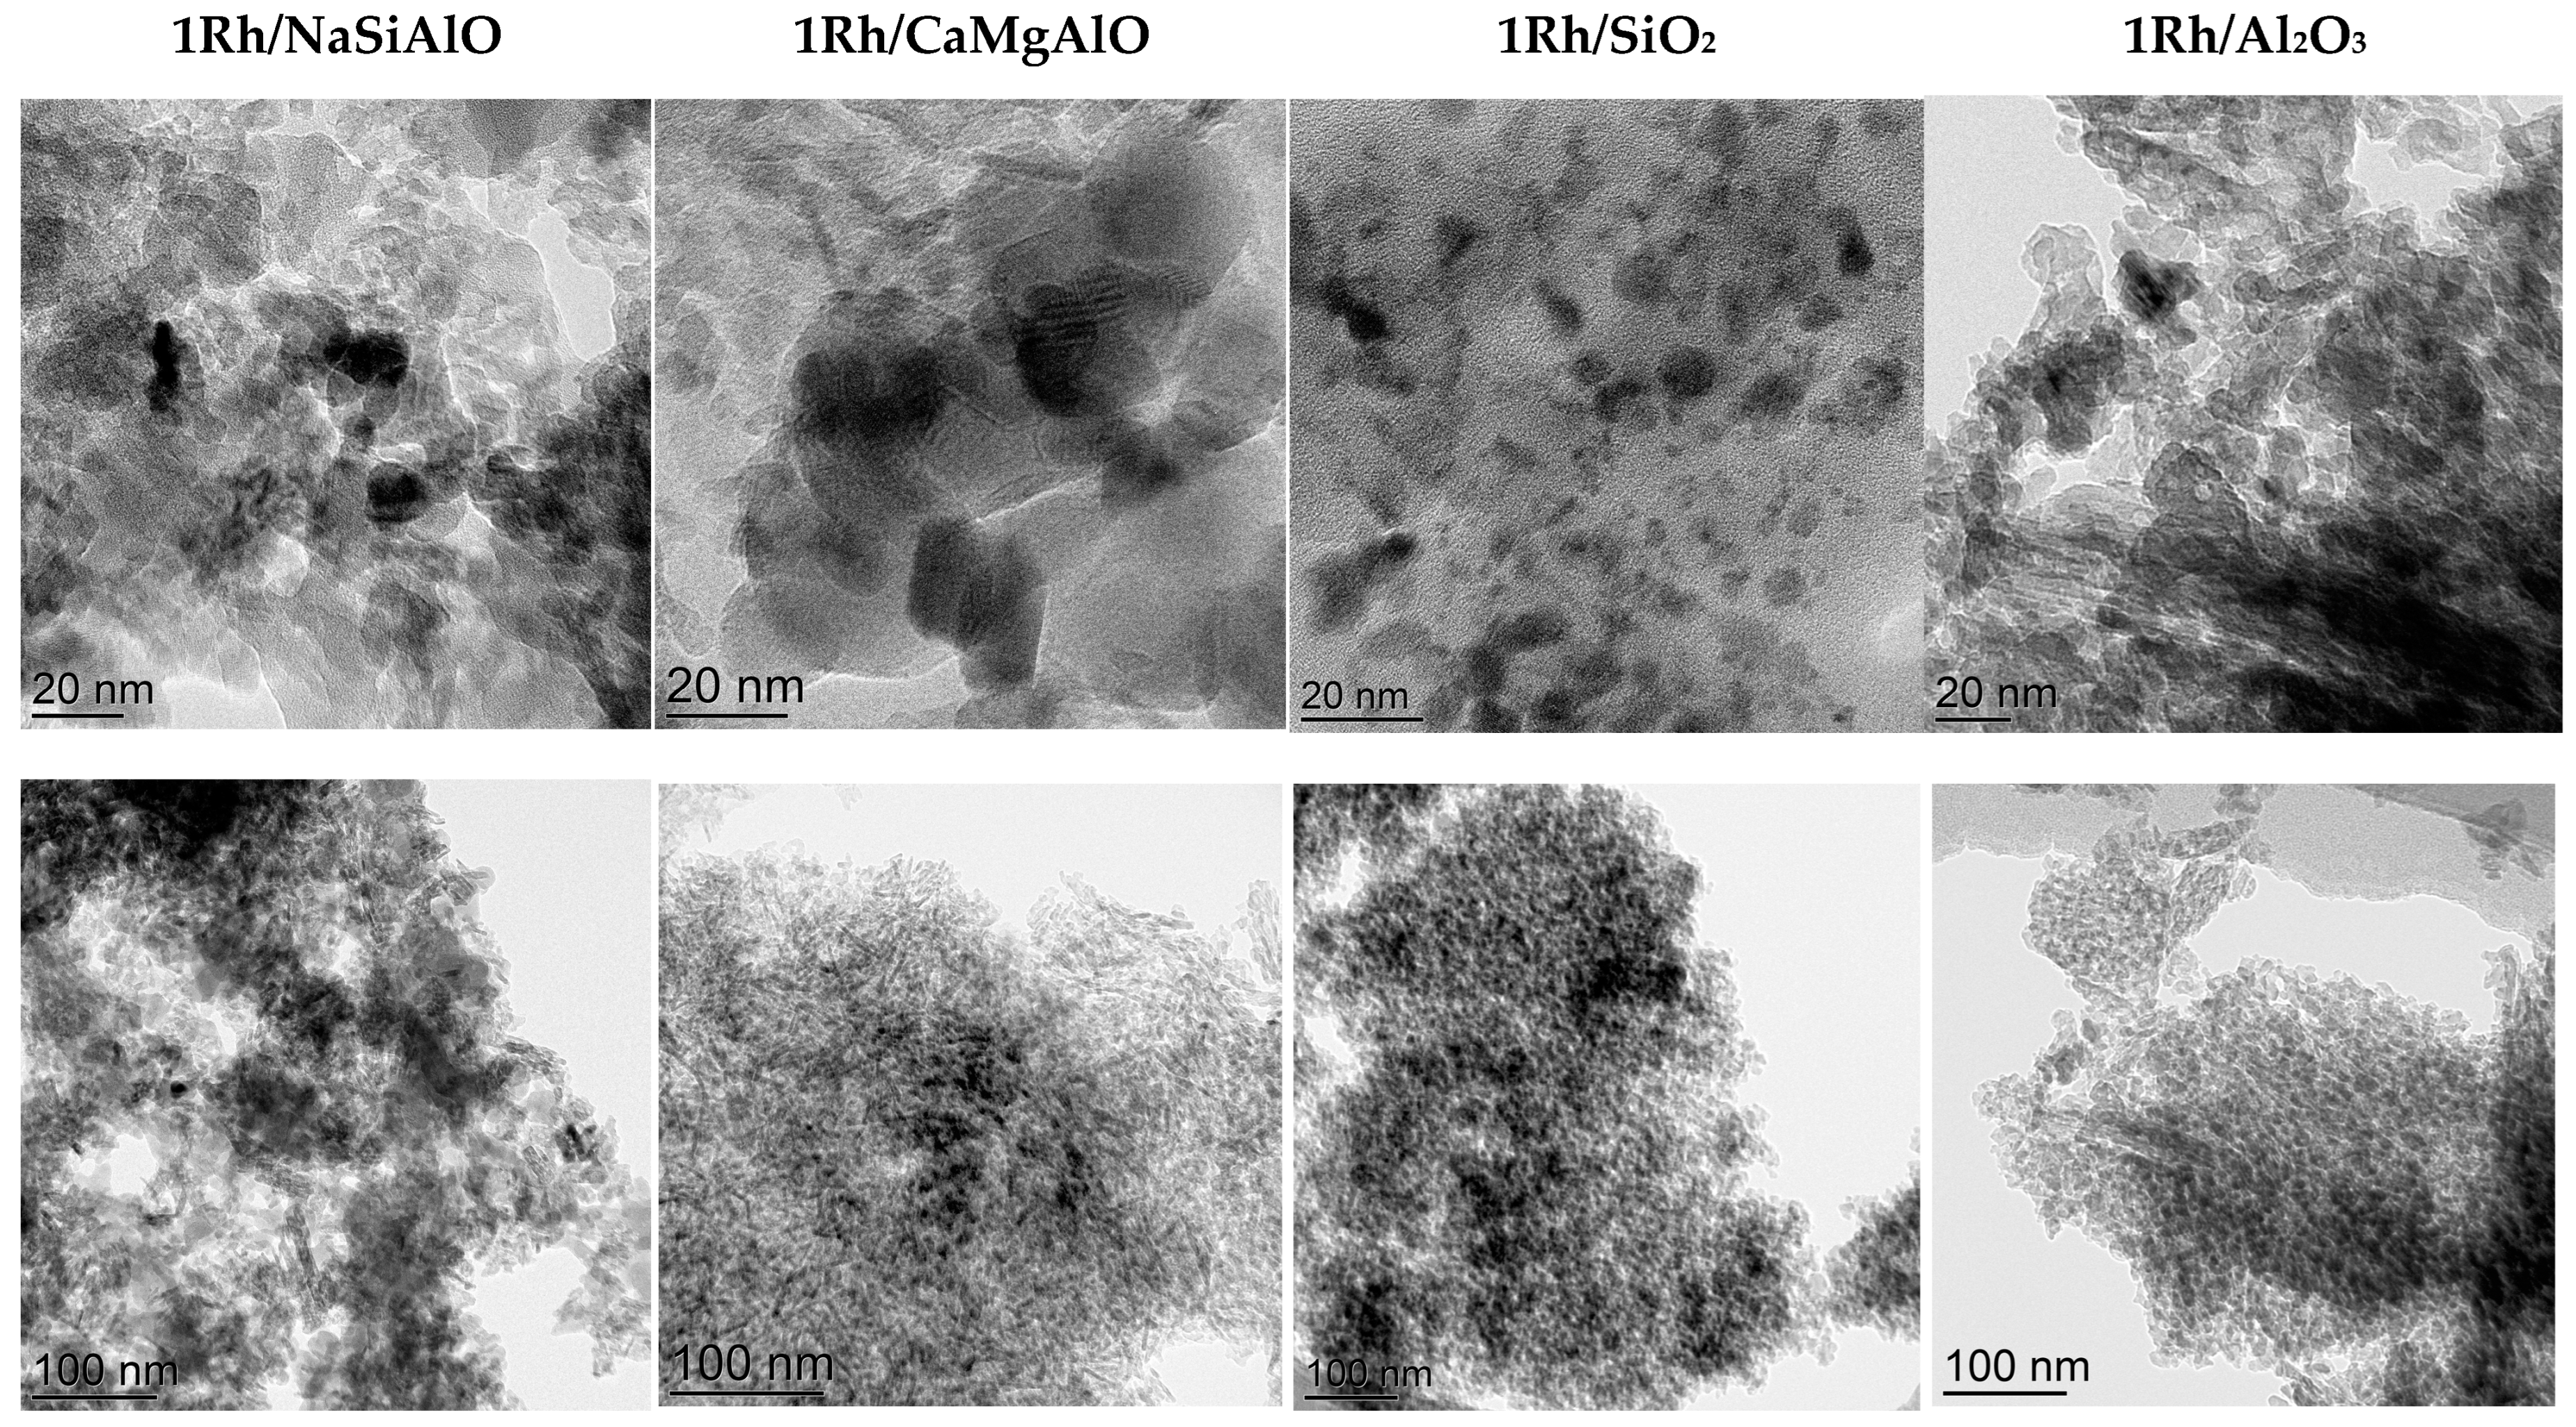
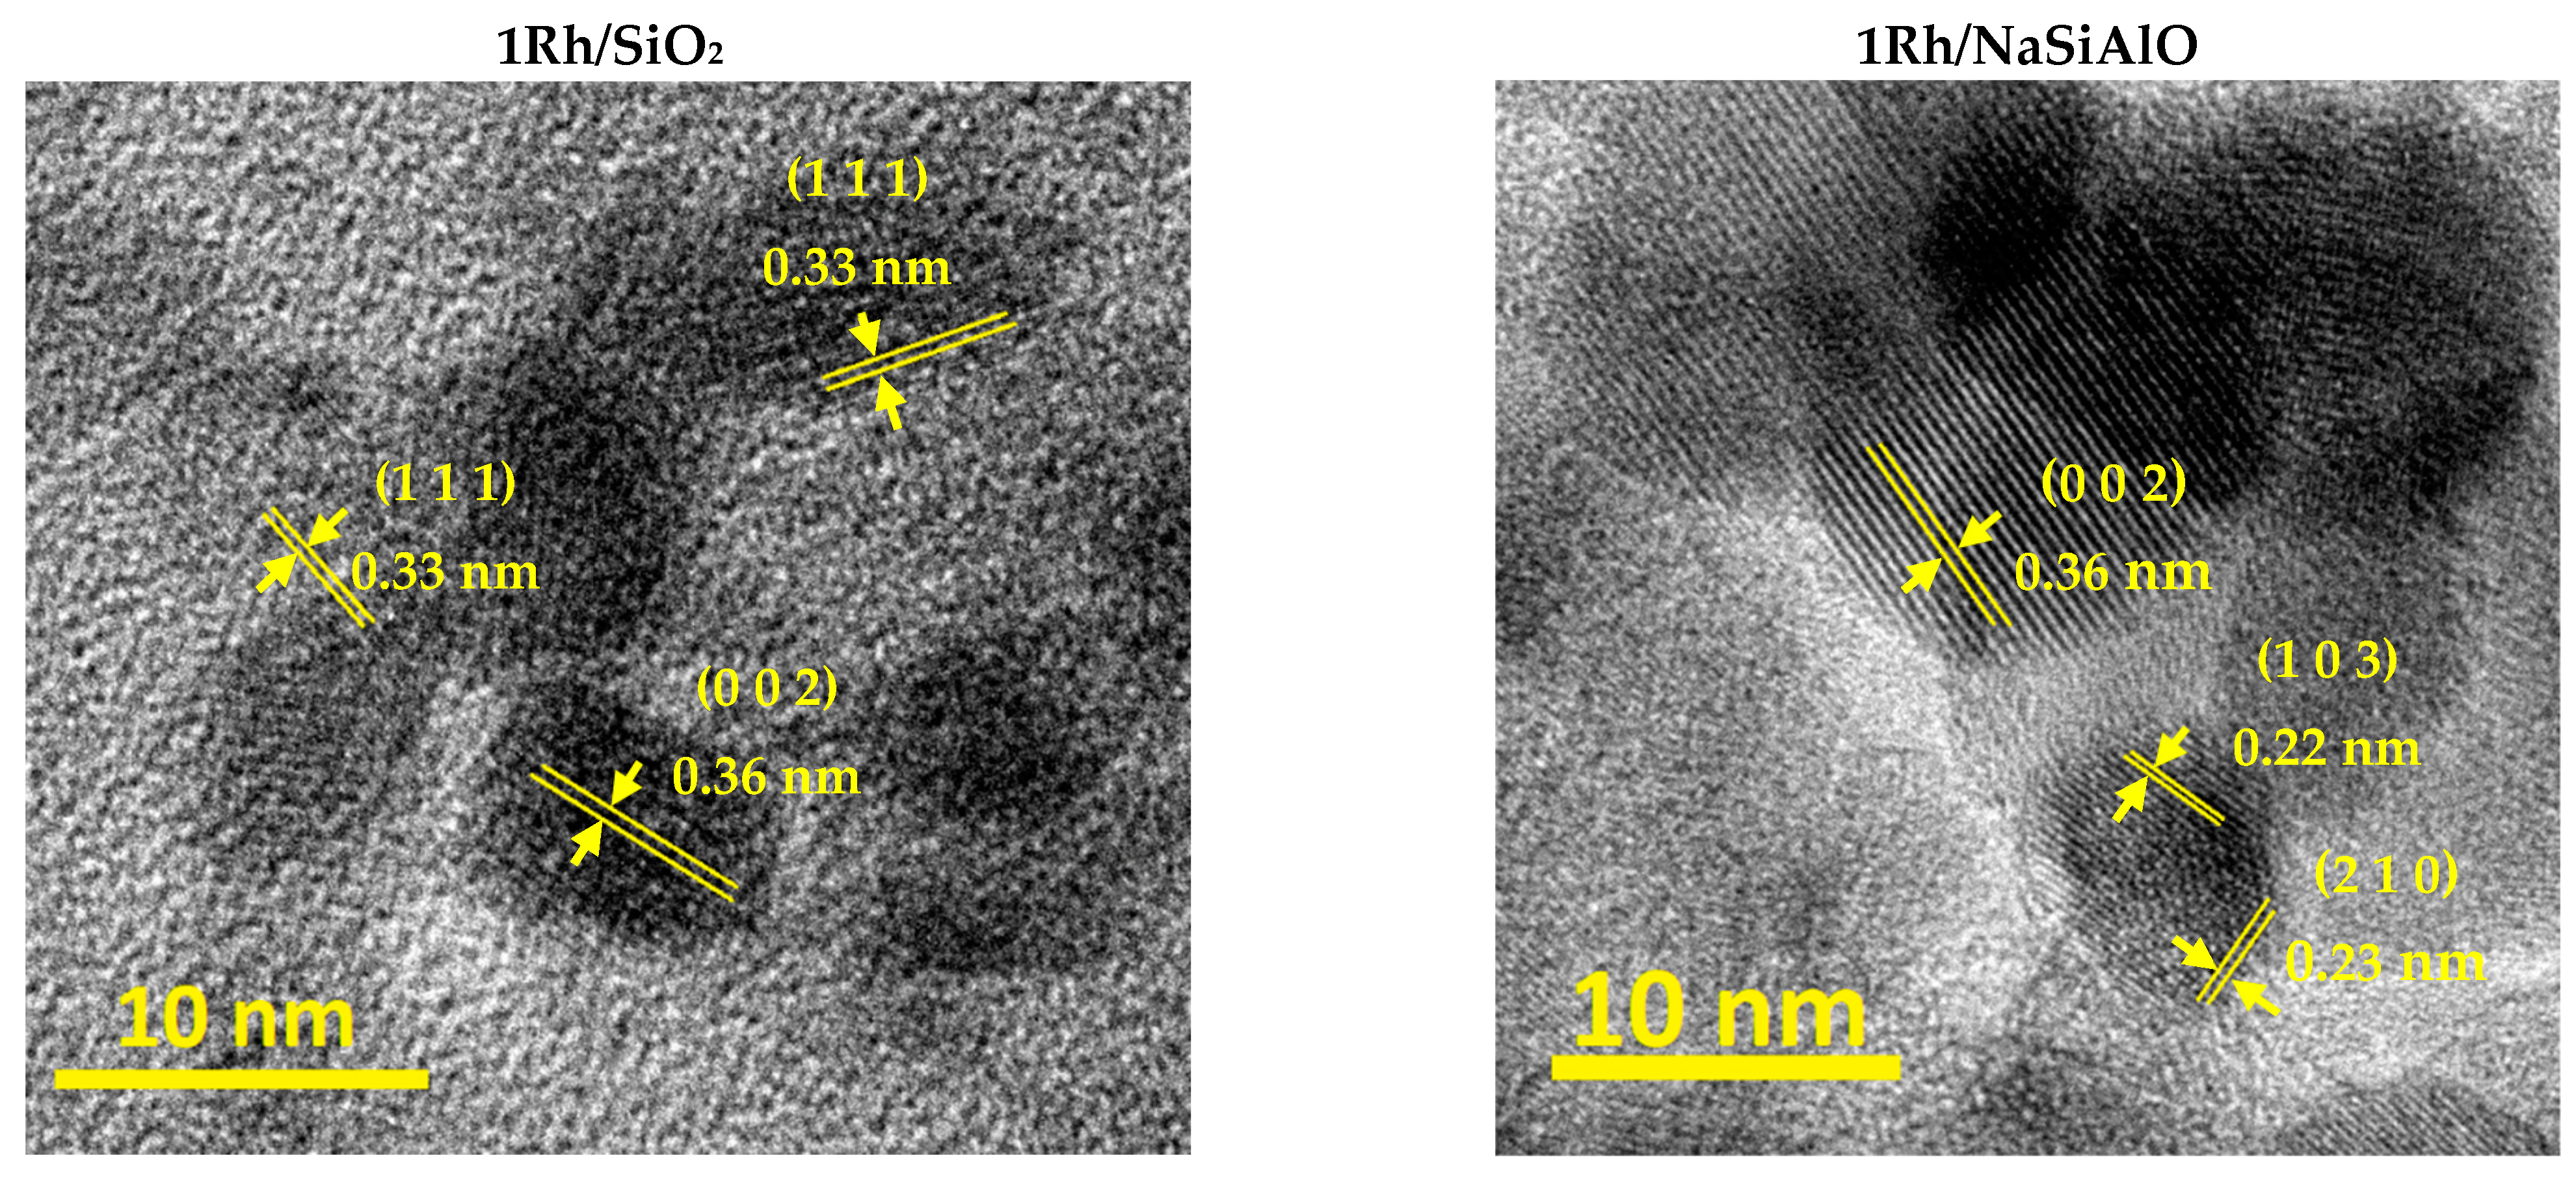
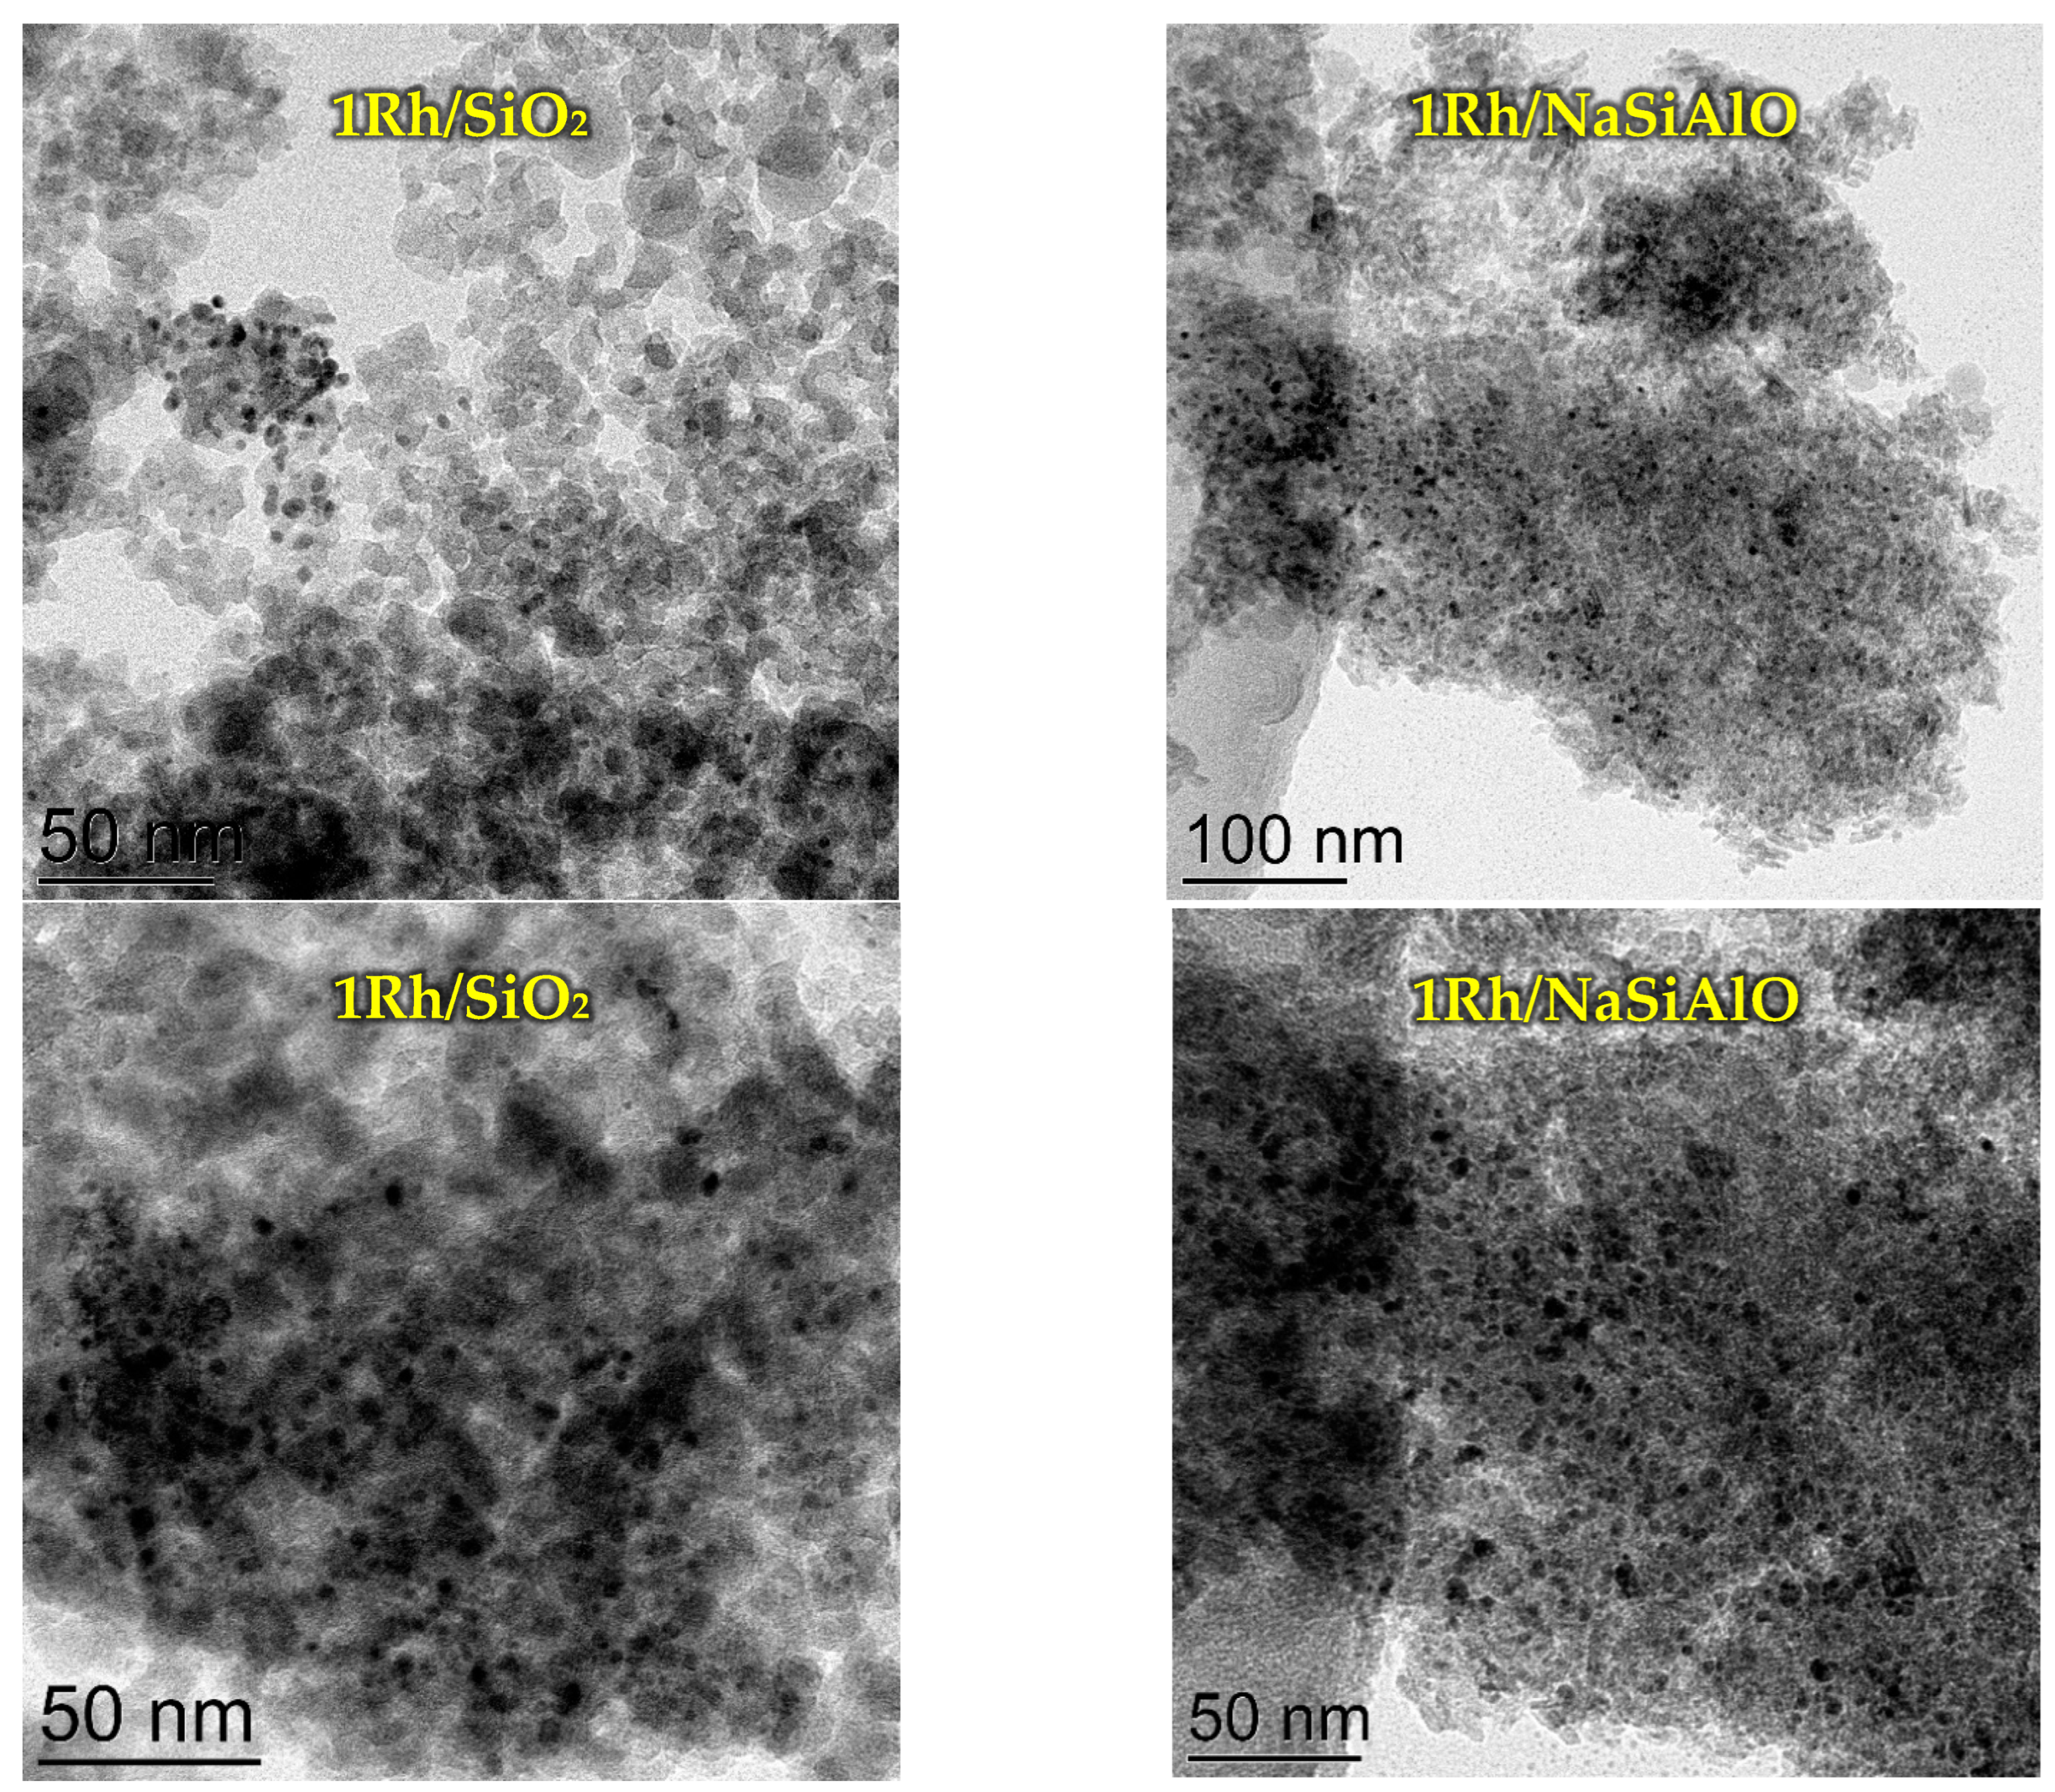
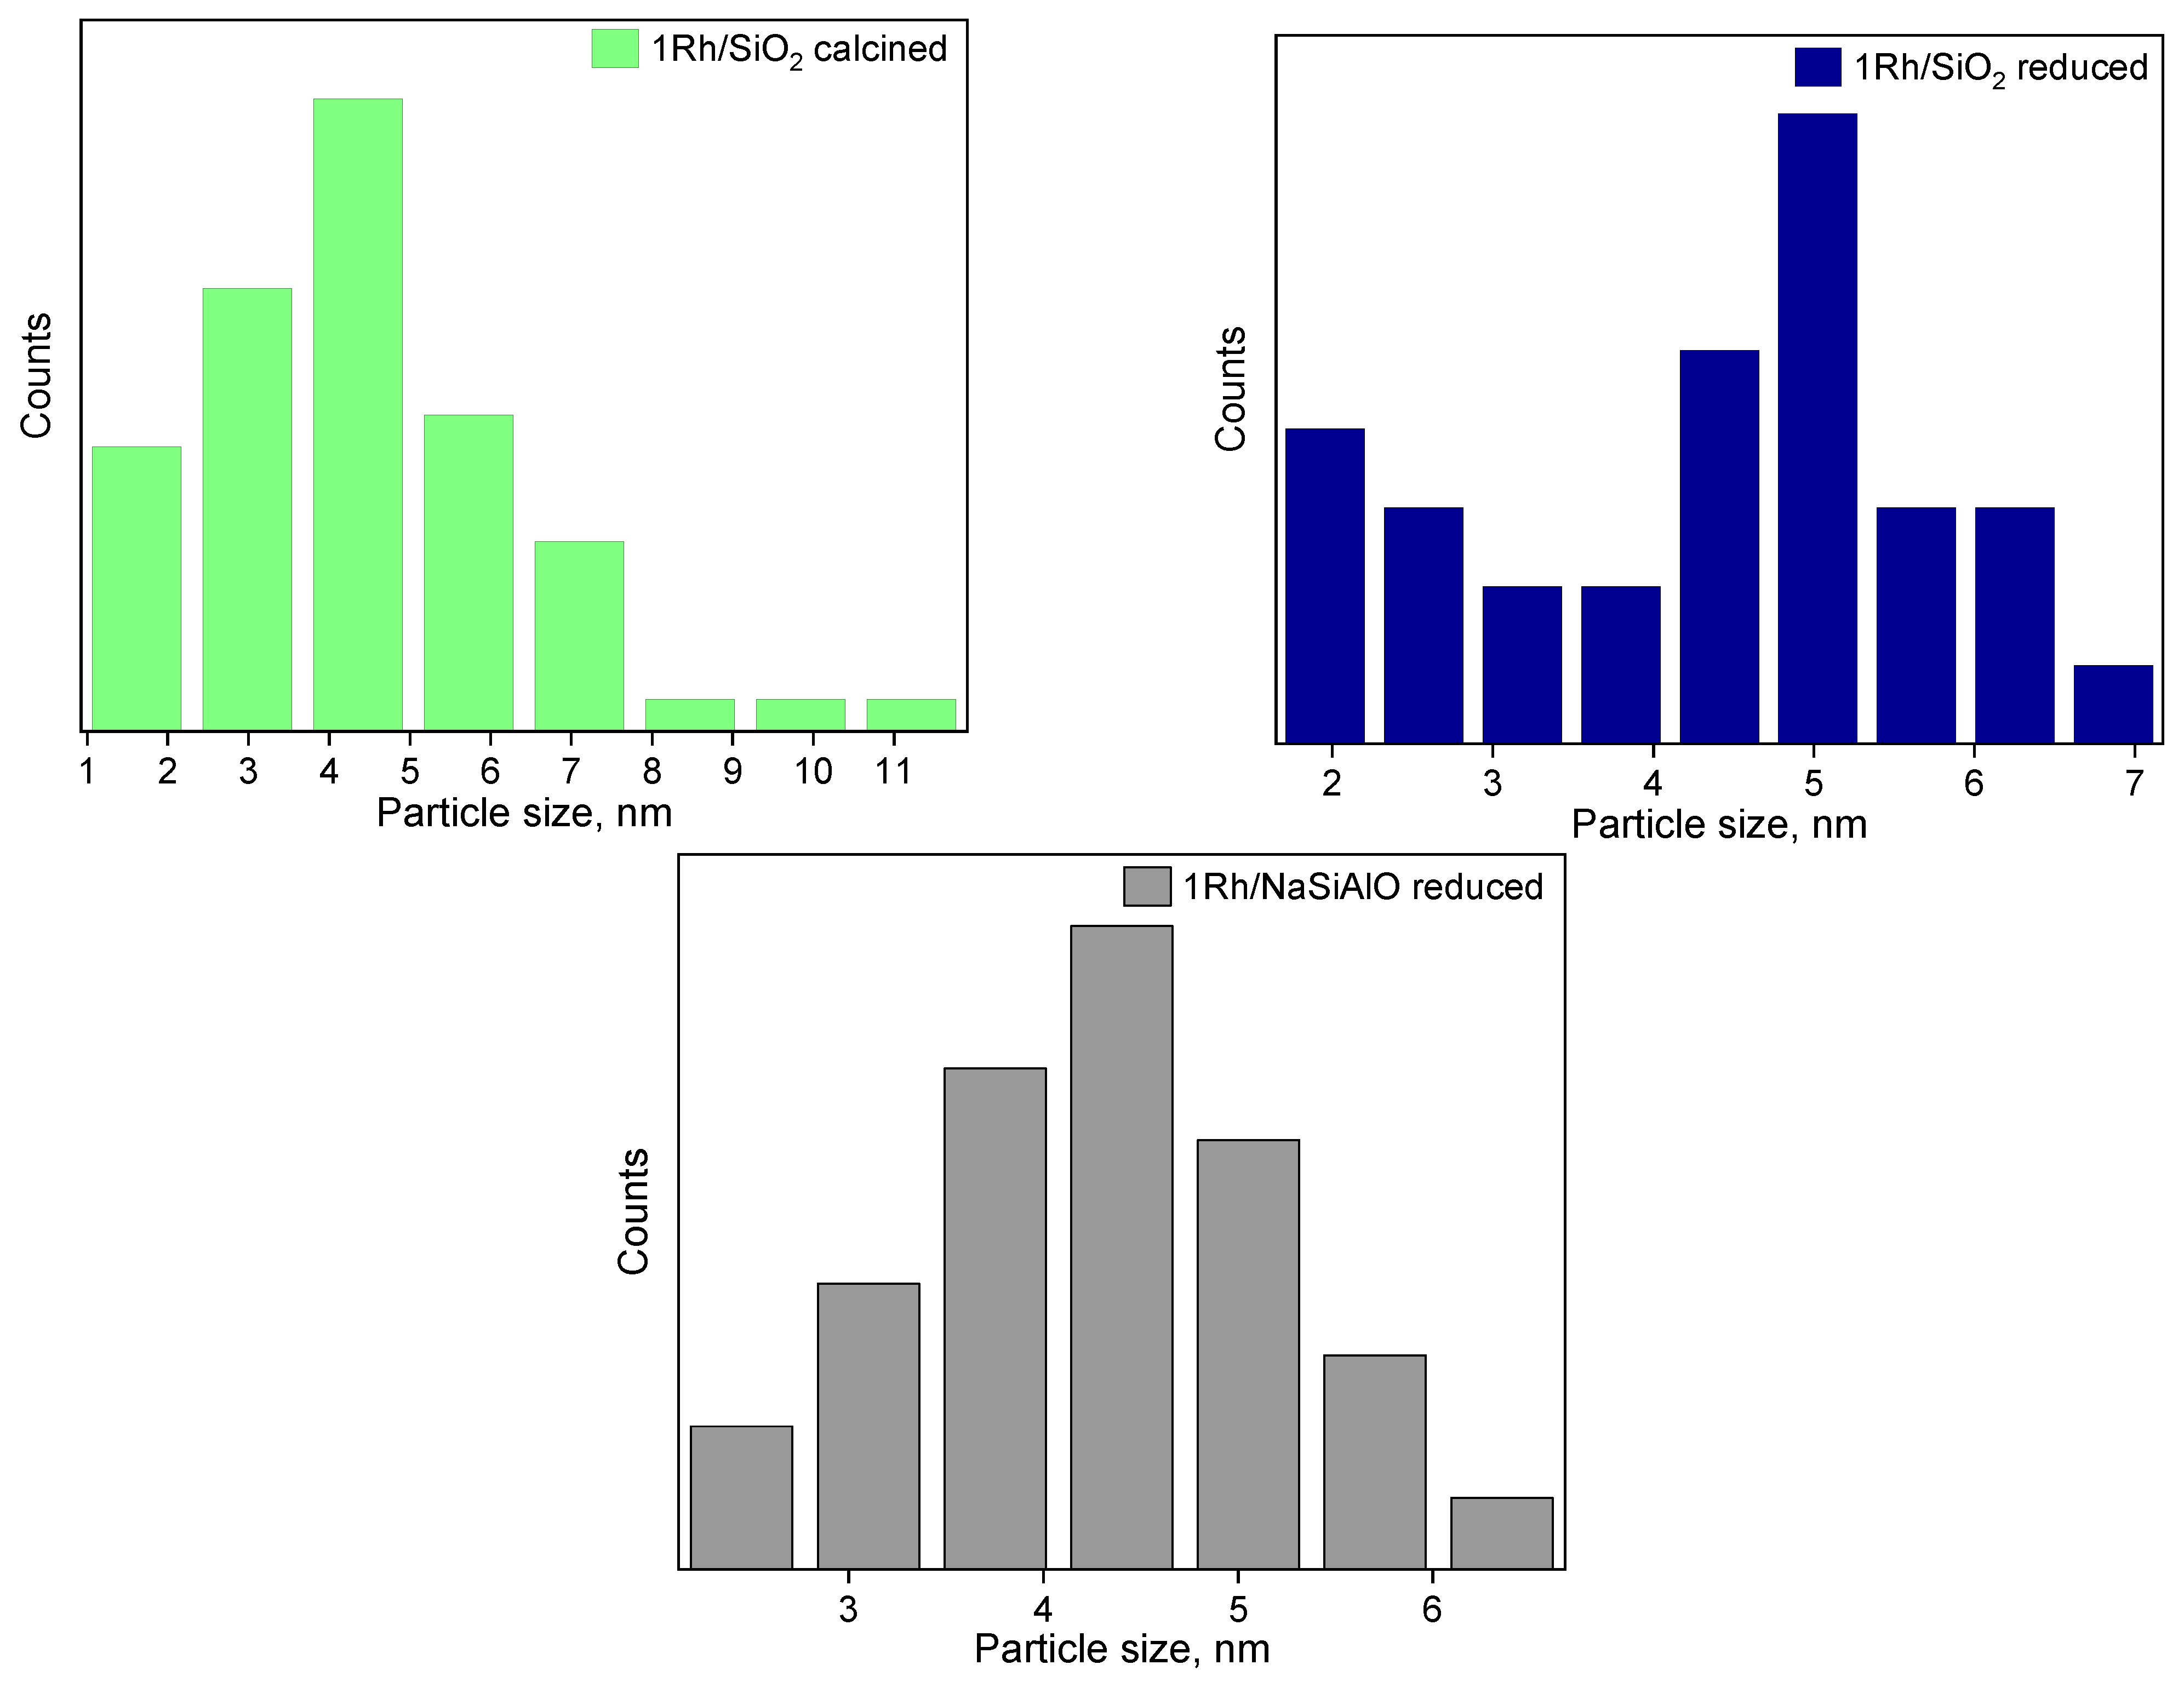
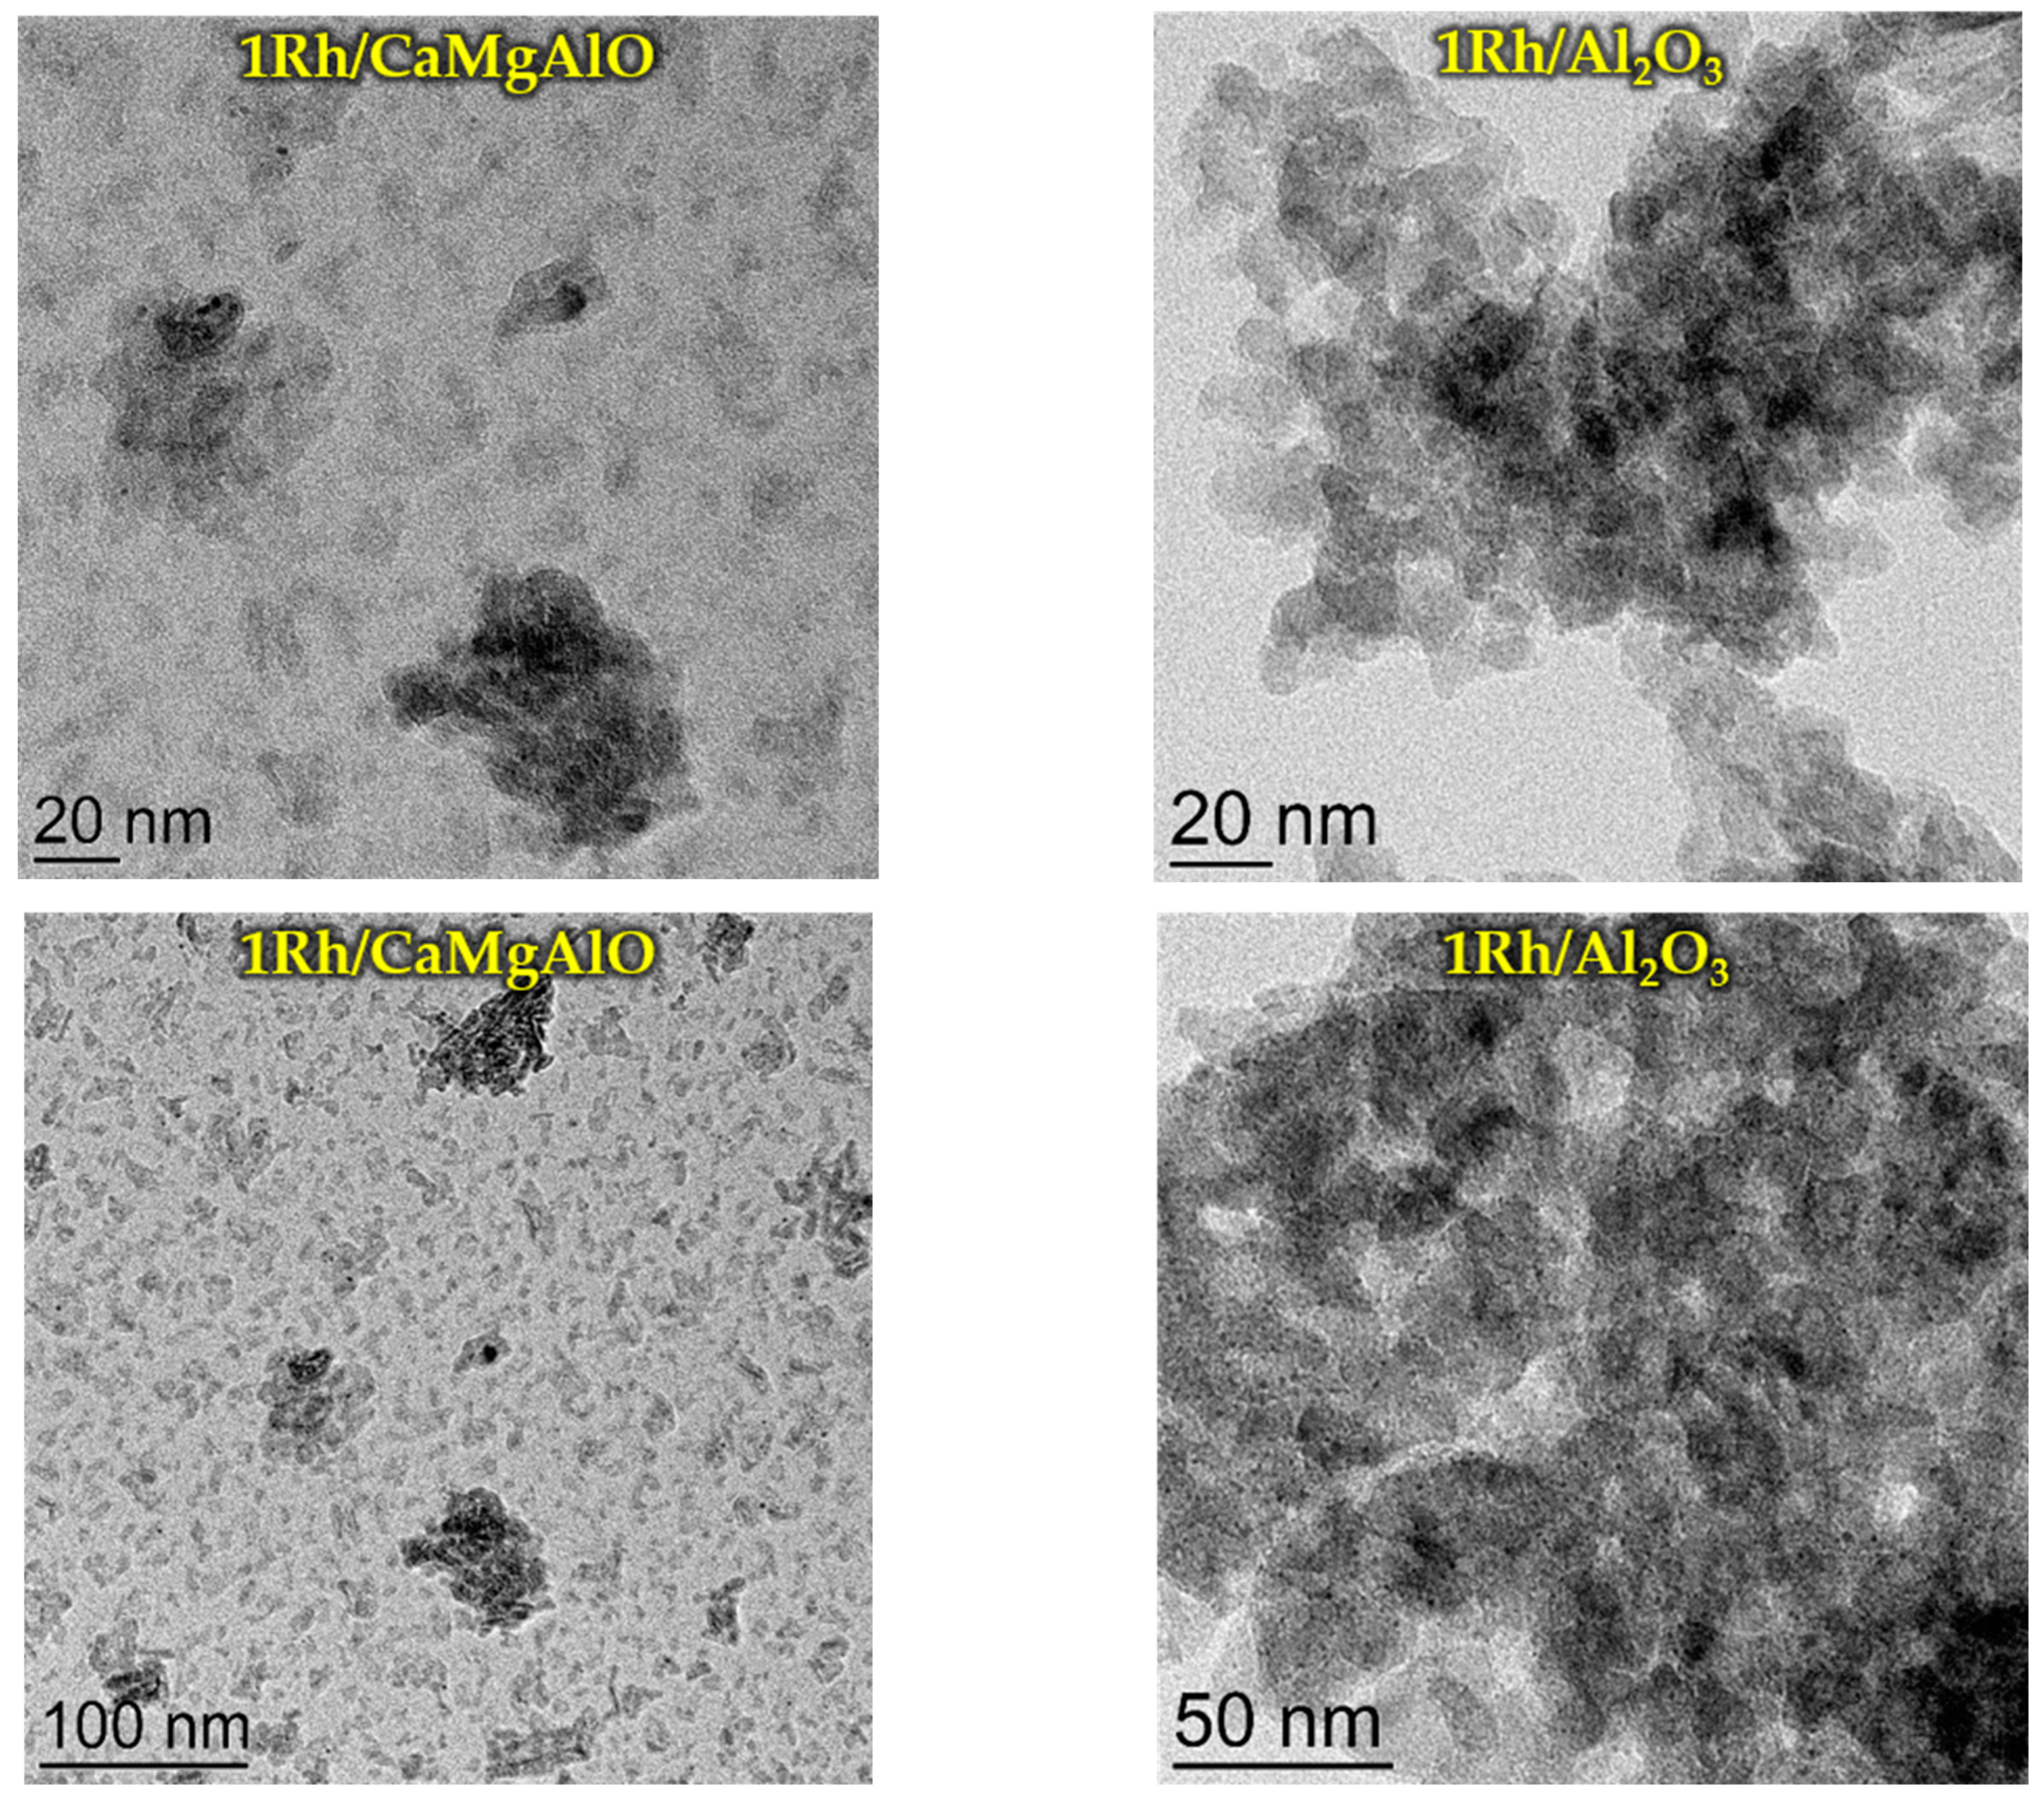
3.4. TEM
3.5. UV-Vis Diffuse Reflectance Spectroscopy
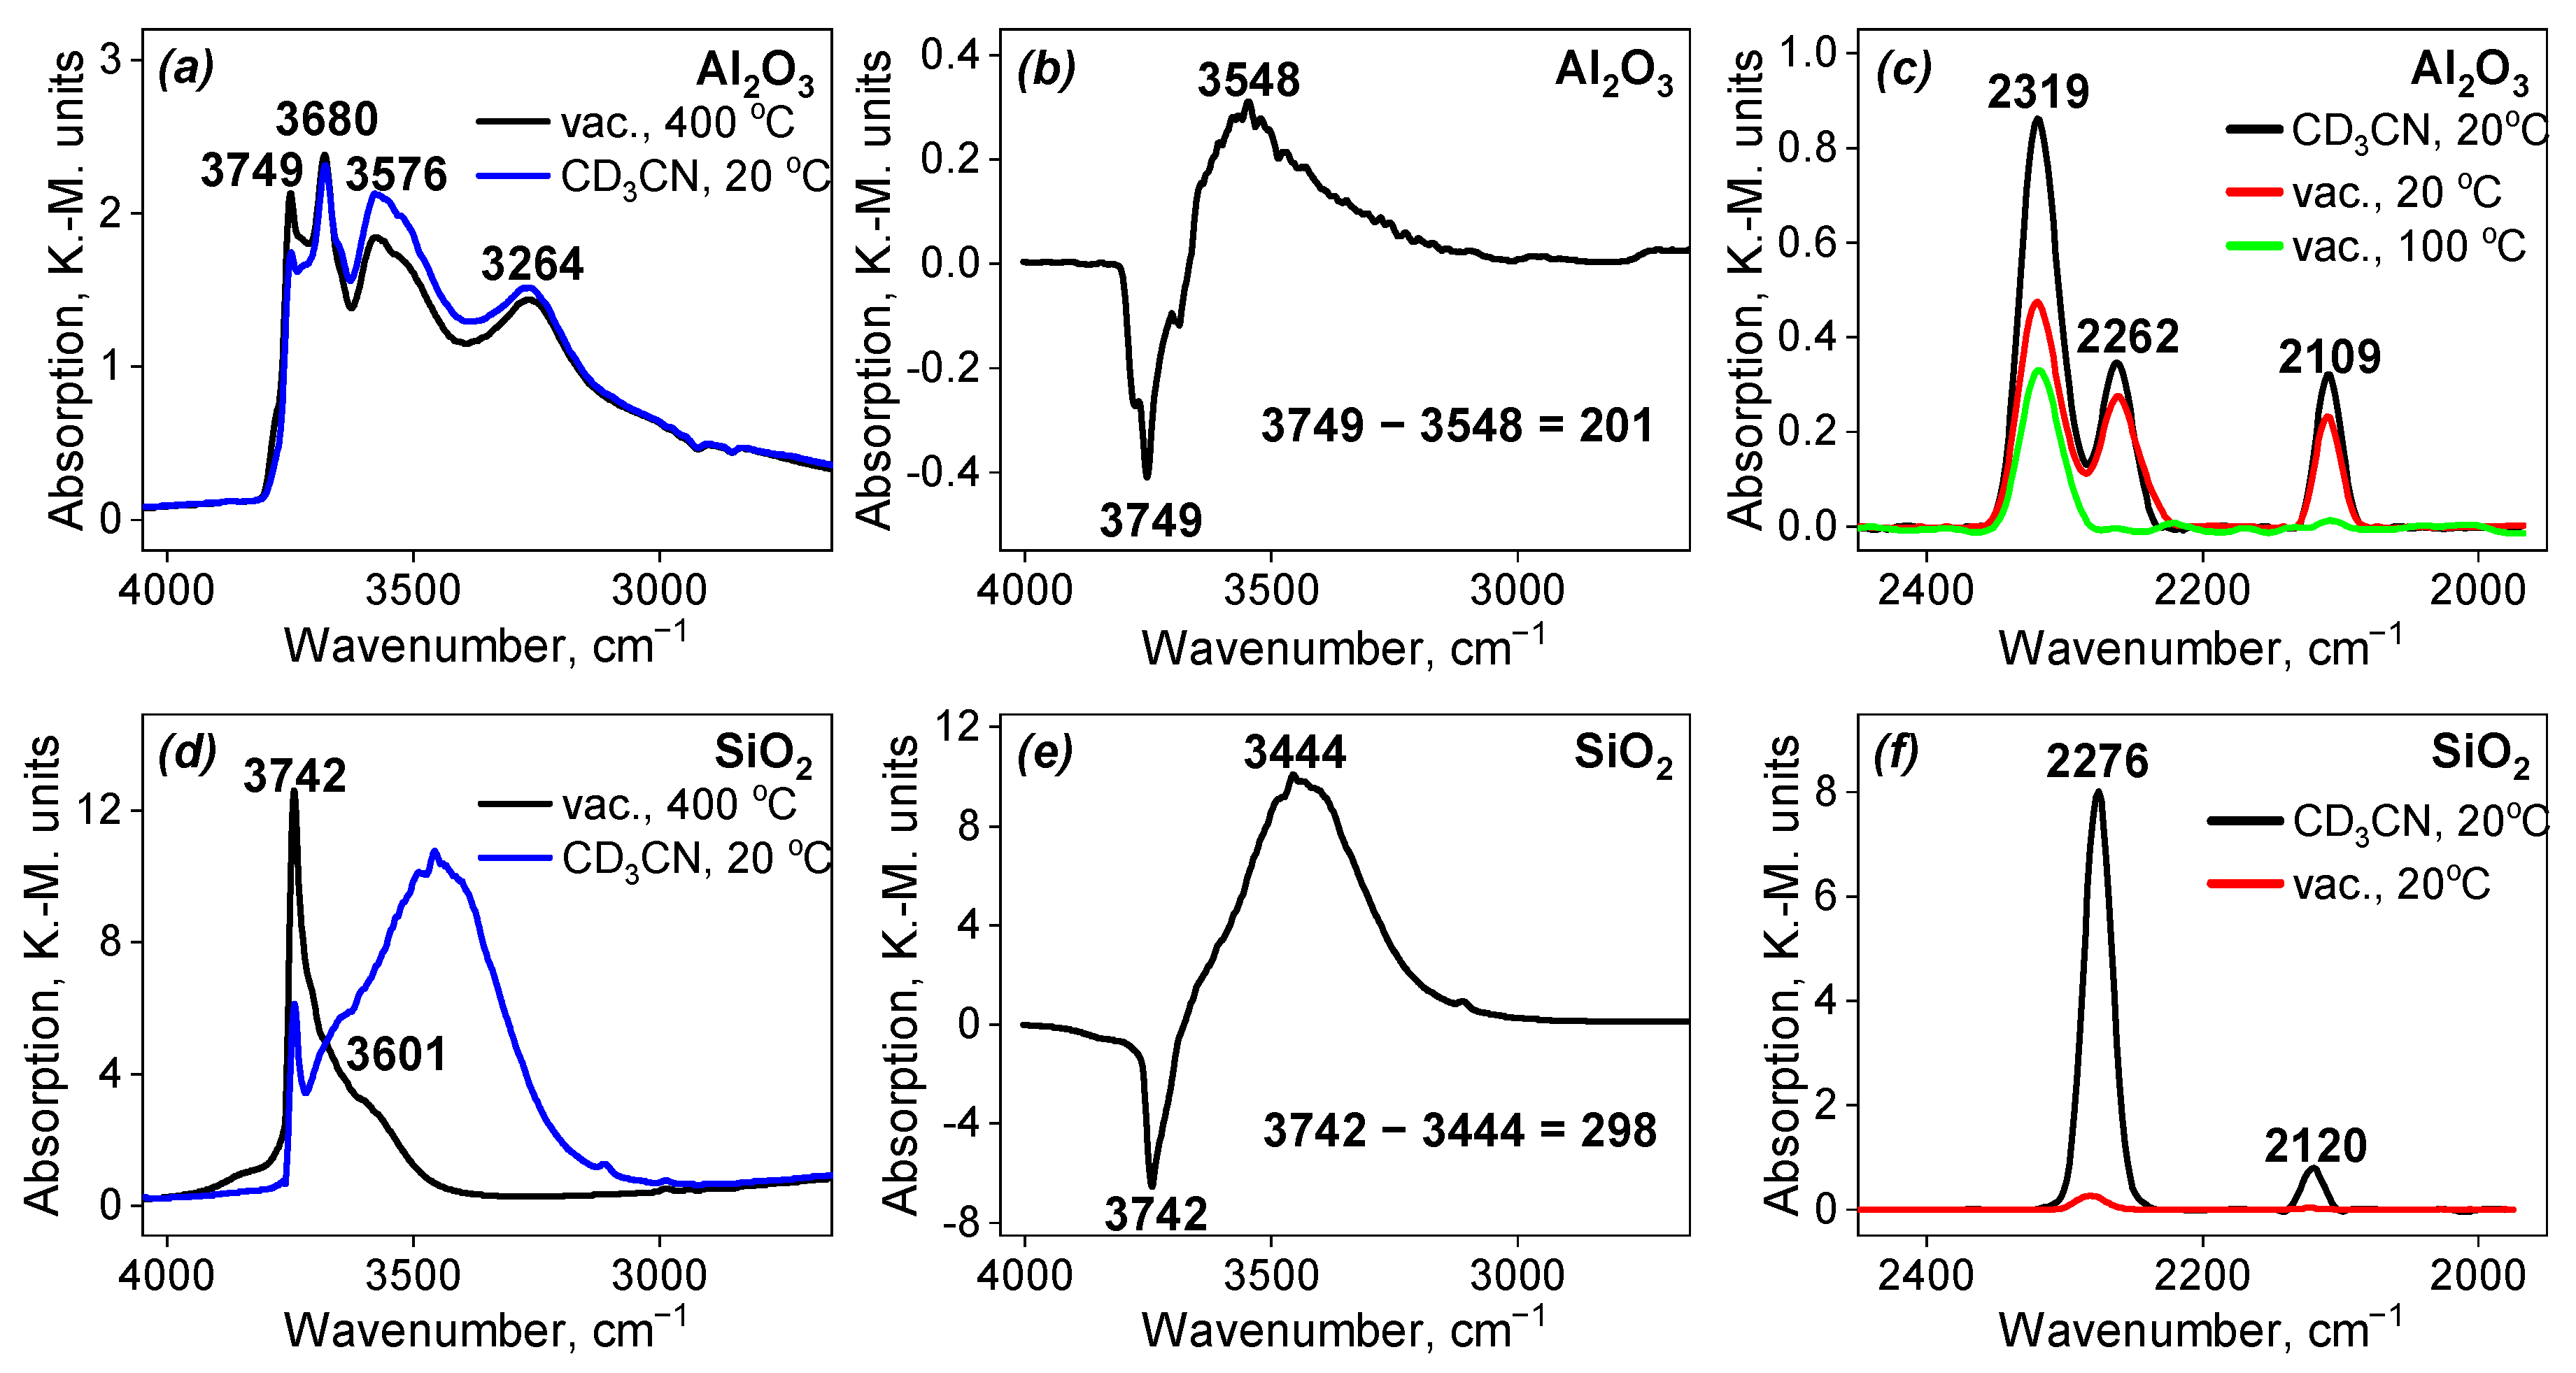
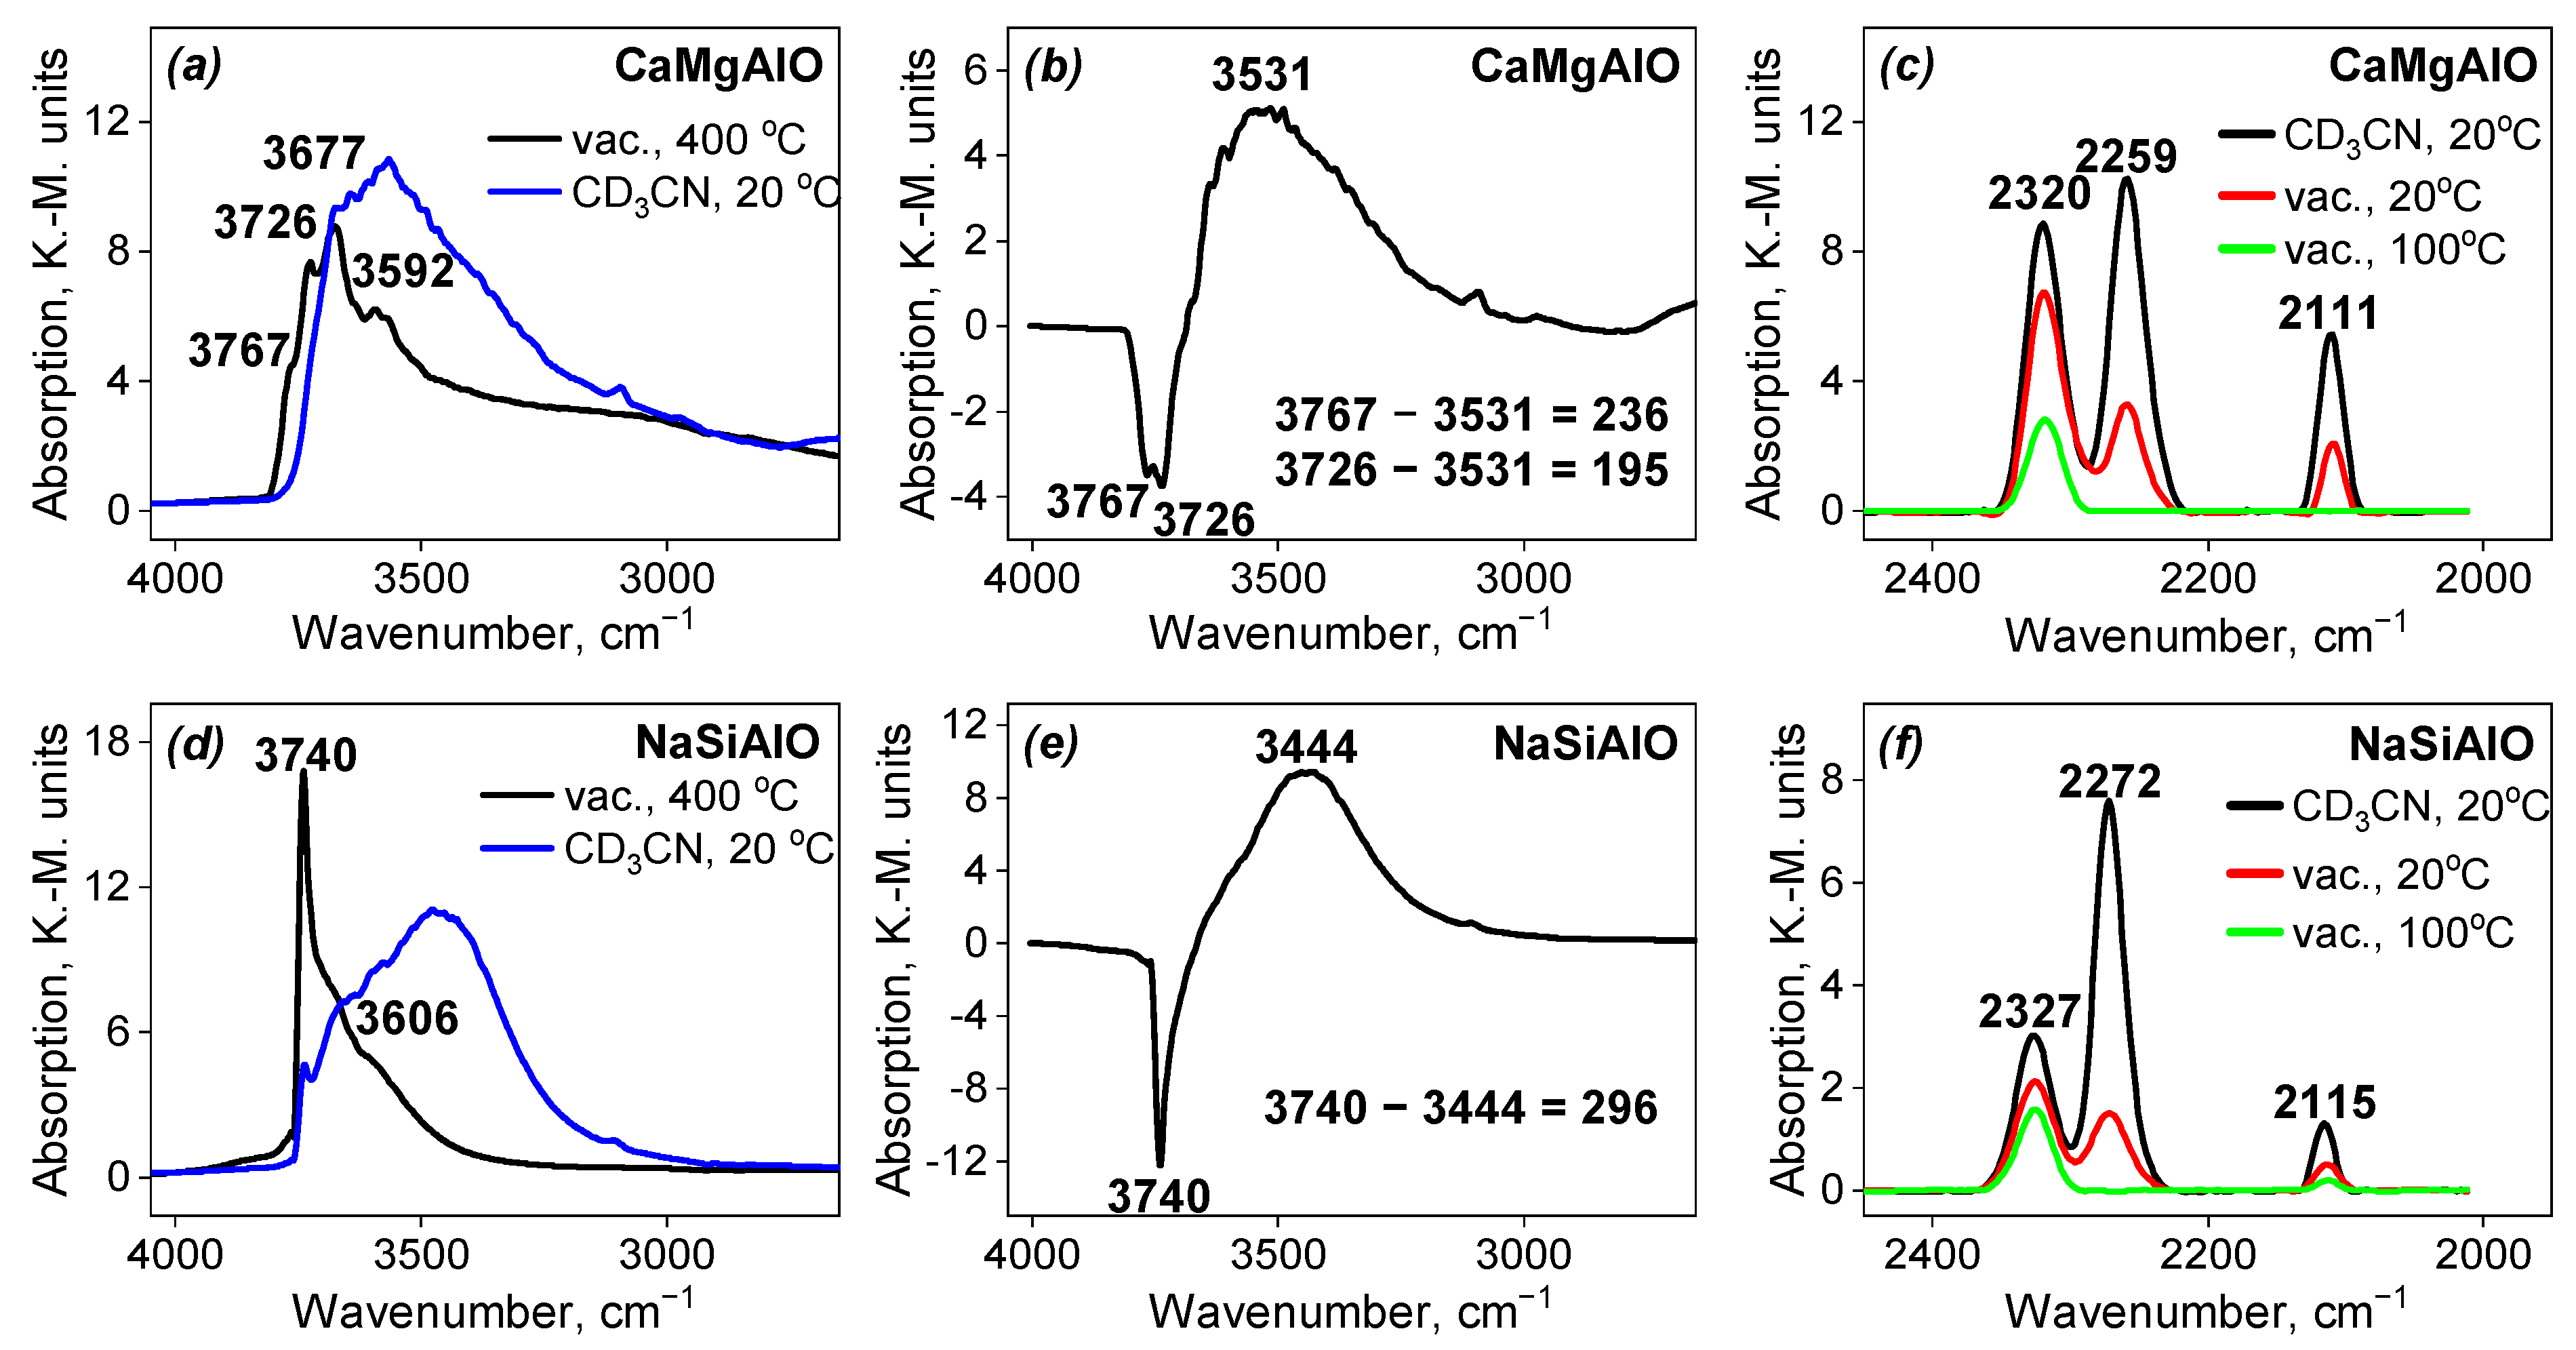
3.6. DRIFT Spectroscopy
3.7. XPS
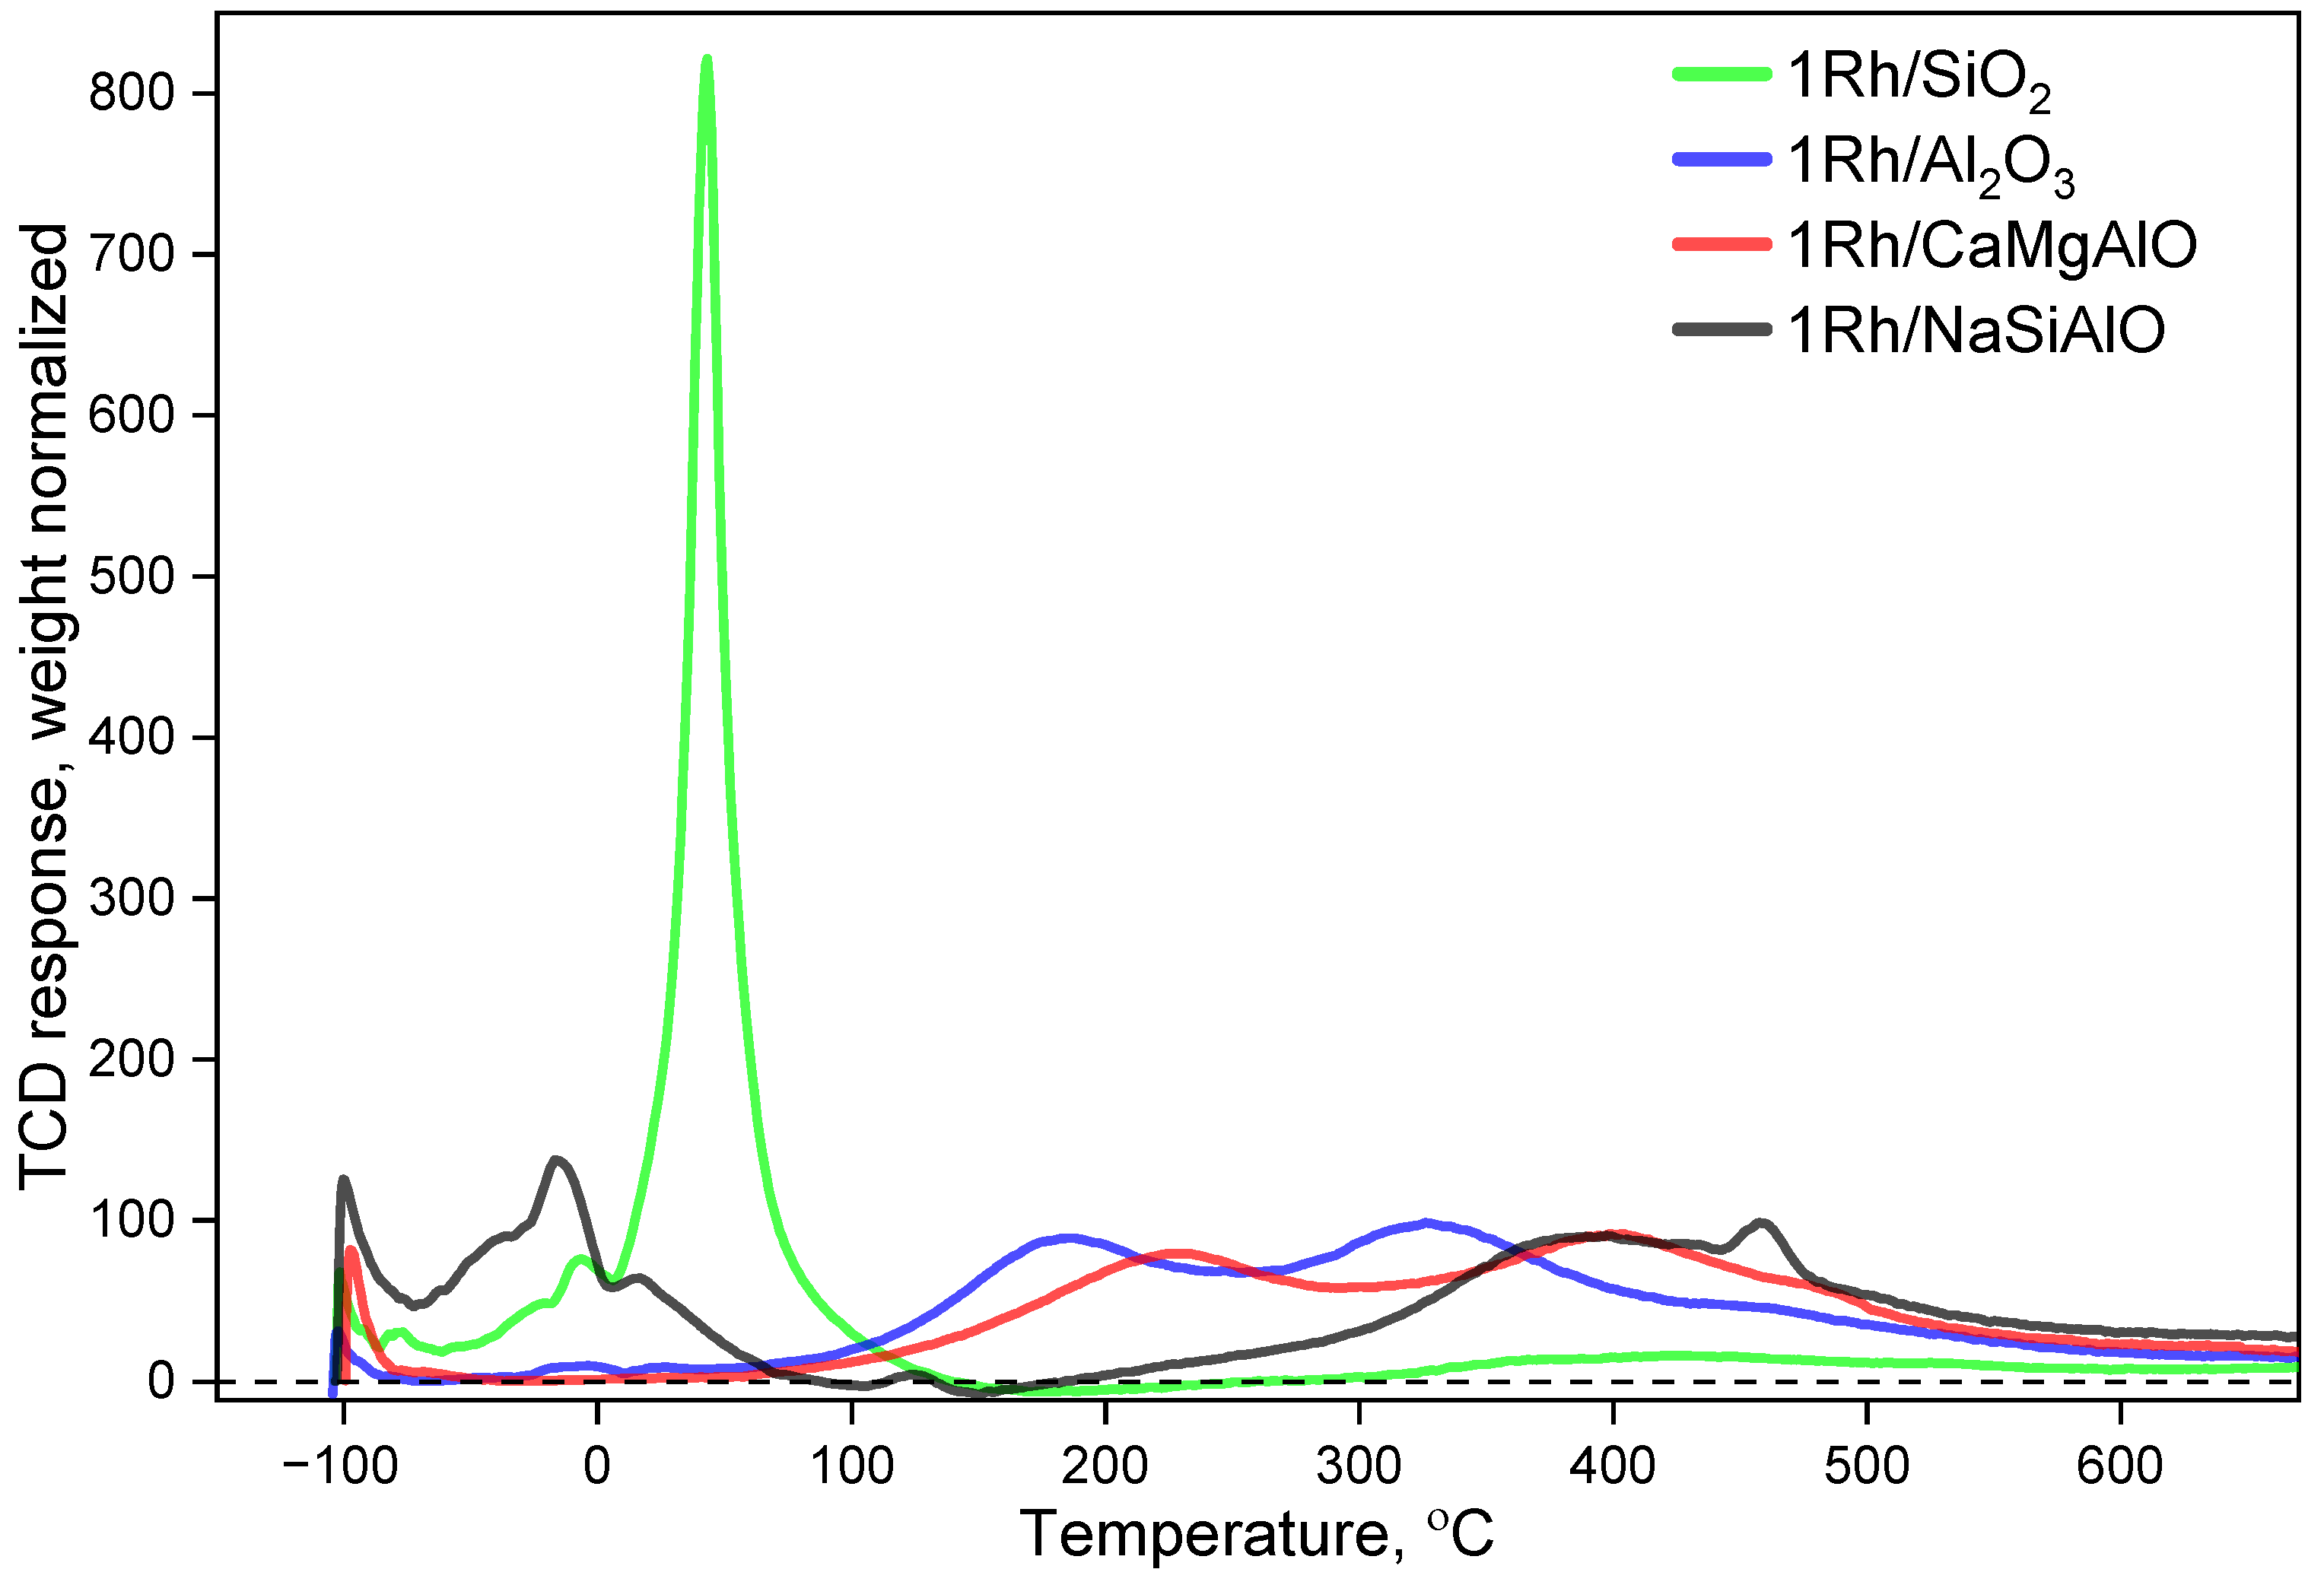
3.8. TPR-H2
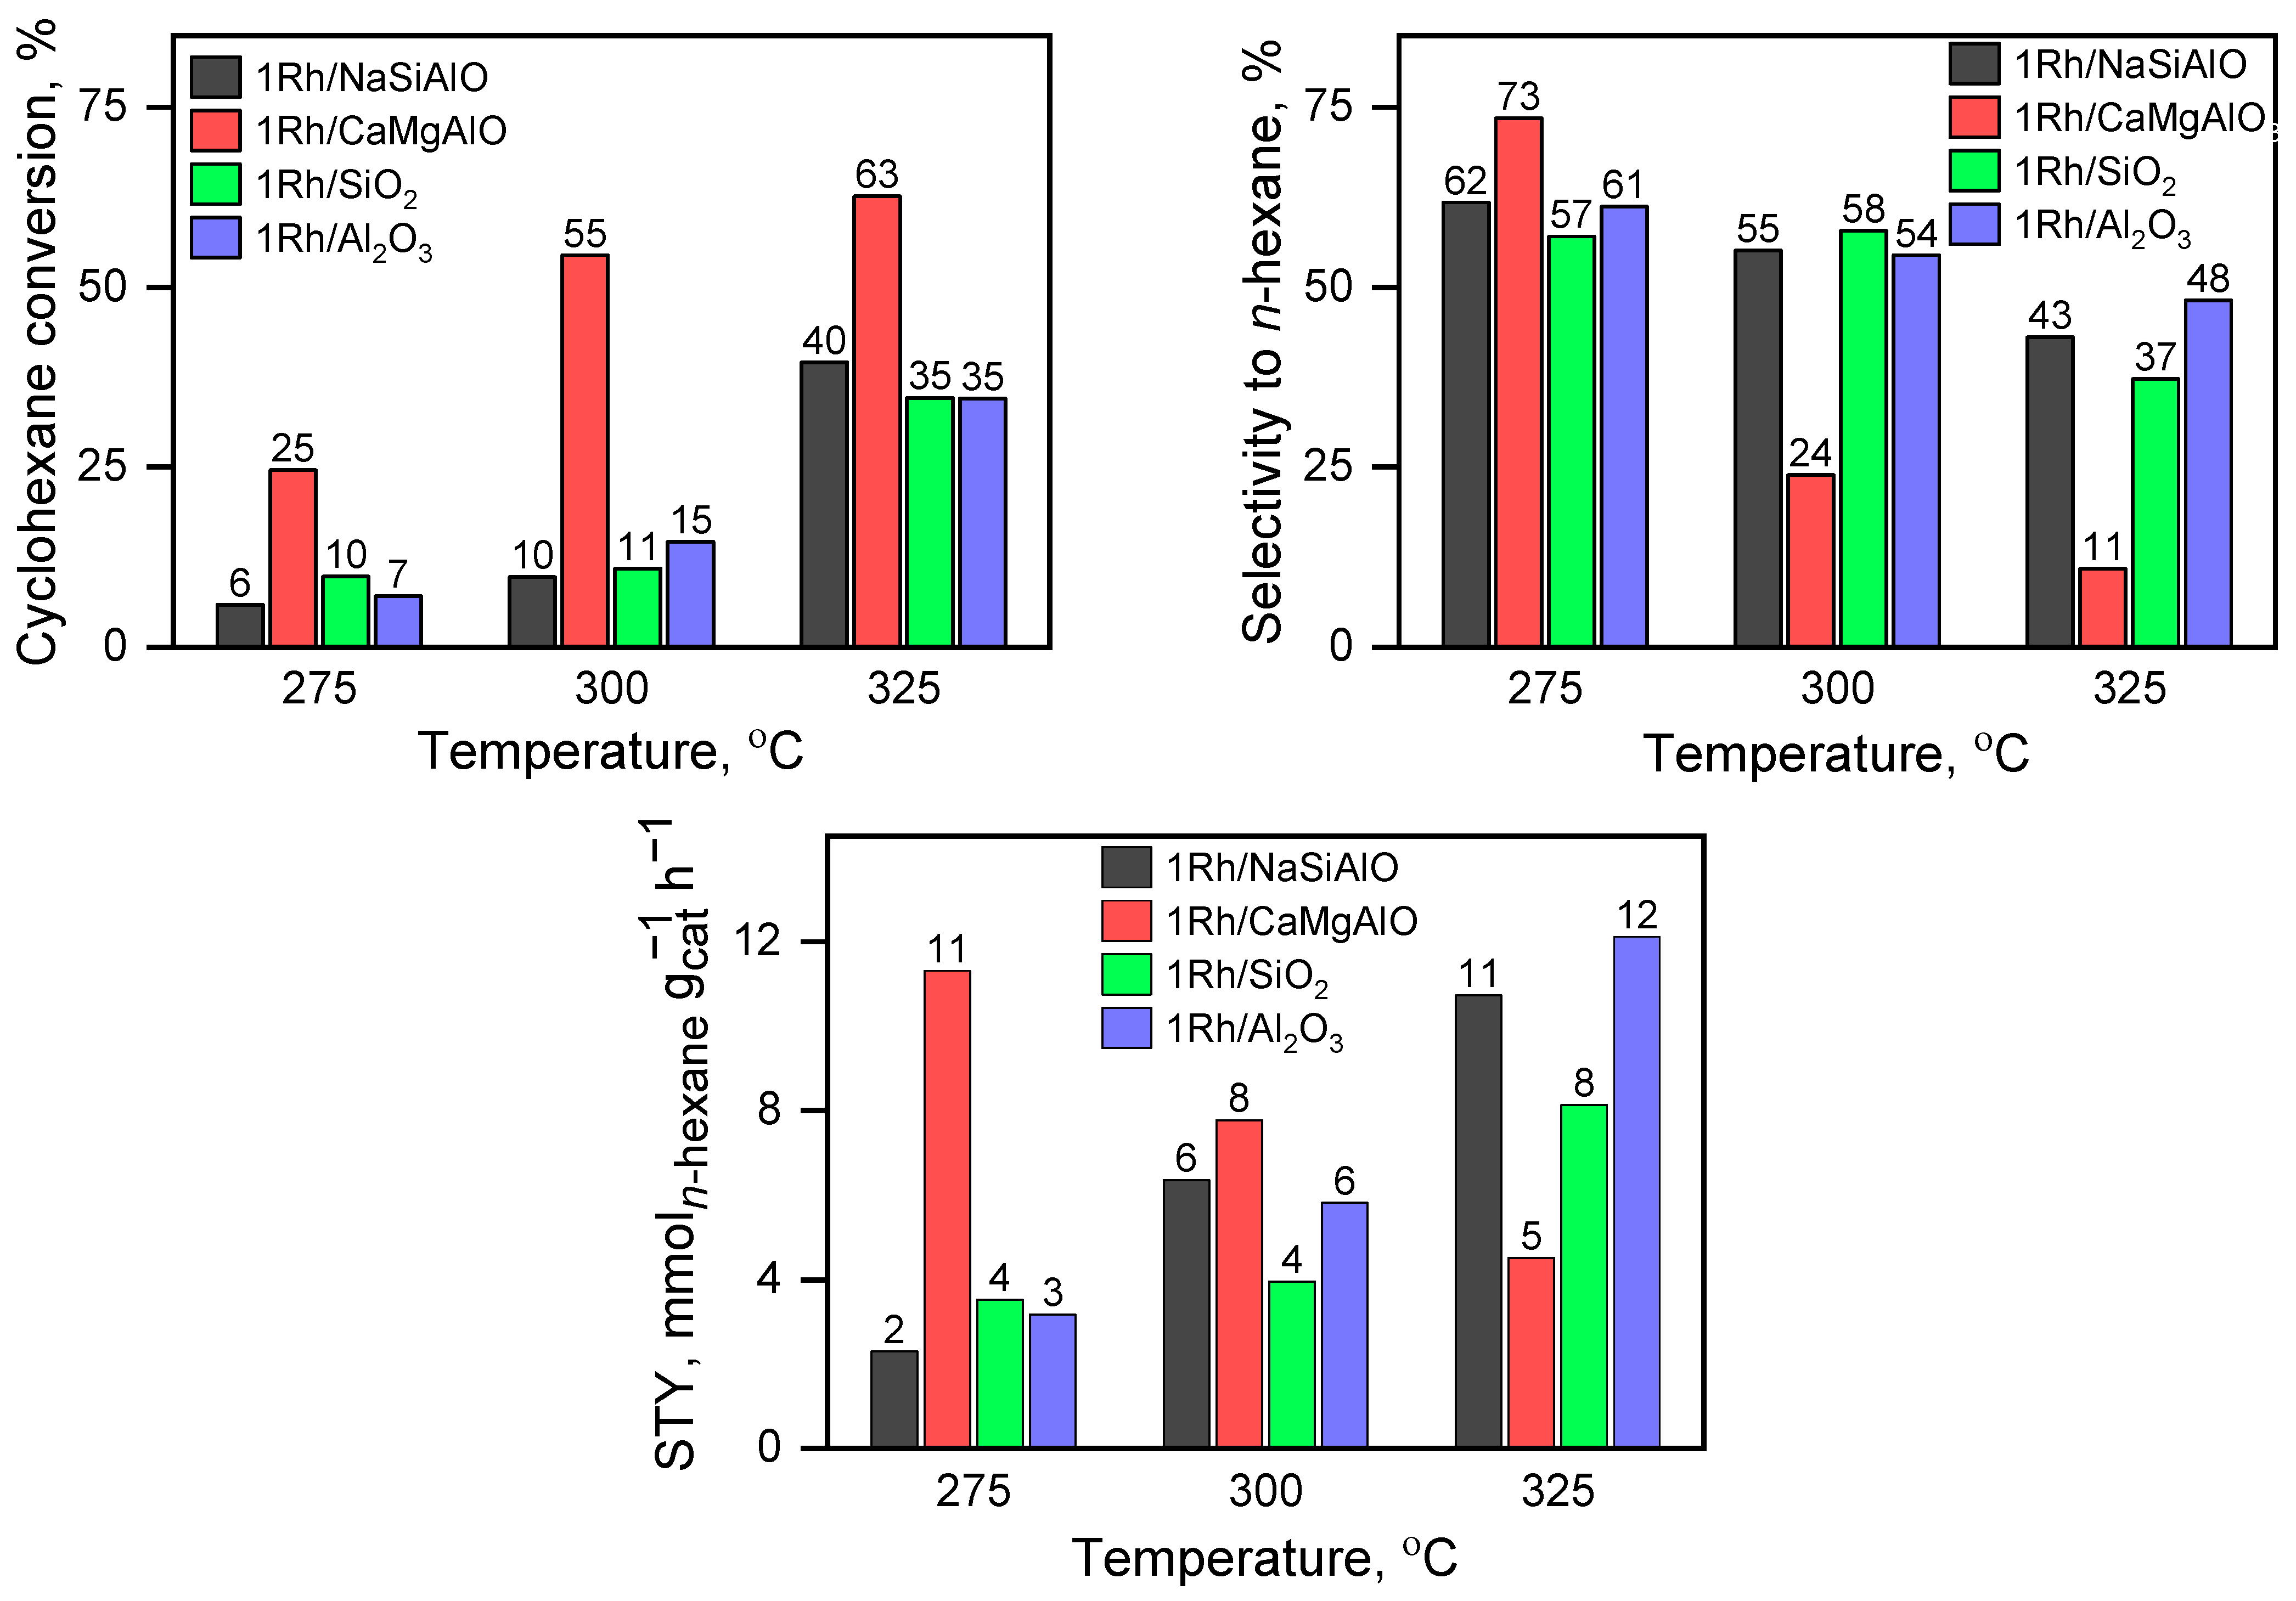
3.9. The Catalytic Tests
4. Discussion and Conclusions
Supplementary Materials
Author Contributions
Funding
Data Availability Statement
Conflicts of Interest
References
- Moraes, R.; Thomas, K.; Thomas, S.; Van Donk, S.; Grasso, G.; Gilson, J.P.; Houalla, M. Ring Opening of Decalin and Methylcyclohexane over Alumina-Based Monofunctional WO3/Al2O3 and Ir/Al2O3 Catalysts. J. Catal. 2012, 286, 62–77. [Google Scholar] [CrossRef]
- Guan, C.; Zhai, J.; Han, D. Cetane Number Prediction for Hydrocarbons from Molecular Structural Descriptors Based on Active Subspace Methodology. Fuel 2019, 249, 1–7. [Google Scholar] [CrossRef]
- Wei, Y.J.; Zhang, Y.J.; Zhu, X.D.; Gu, H.M.; Zhu, Z.Q.; Liu, S.H.; Sun, X.Y.; Jiang, X.L. Effects of Diesel Hydrocarbon Components on Cetane Number and Engine Combustion and Emission Characteristics. Appl. Sci. 2022, 12, 3549. [Google Scholar] [CrossRef]
- McVicker, G.B.; Daage, M.; Touvelle, M.S.; Hudson, C.W.; Klein, D.P.; Baird, W.C.; Cook, B.R.; Chen, J.G.; Hantzer, S.; Vaughan, D.E.W.; et al. Selective Ring Opening of Naphthenic Molecules. J. Catal. 2002, 210, 137–148. [Google Scholar] [CrossRef]
- Masloboishchikova, O.V.; Vasina, T.V.; Khelkovskaya-Sergeeva, E.G.; Kustov, L.M.; Zeuthen, P. Cyclohexane Transformations over Metal Oxide Catalysts 1. Effect of the Nature of Metal and Support on the Catalytic Activity in Cyclohexane Ring Opening. Russ. Chem. Bull. 2002, 51, 237–241. [Google Scholar] [CrossRef]
- Vasina, T.V.; Masloboishchikova, O.V.; Khelkovskaya-Sergeeva, E.G.; Kustov, L.M.; Zeuthen, P. Cyclohexane Transformations over Metal Oxide Catalysts 2. Selective Cyclohexane Ring Opening to Form n-Hexane over Mono- and Bimetallic Rhodium Catalysts. Russ. Chem. Bull. 2002, 51, 242–245. [Google Scholar] [CrossRef]
- Kustov, L.M.; Vasina, T.V.; Masloboishchikova, O.V.; Khelkovskaya-Sergeeva, E.G.; Zeuthen, P. Cyclohexane Ring Opening on Metal-Oxide Catalysts. Stud. Surf. Sci. Catal. 2000, 130 A, 227–232. [Google Scholar] [CrossRef]
- Calemma, V.; Ferrari, M.; Rabl, S.; Weitkamp, J. Selective Ring Opening of Naphthenes: From Mechanistic Studies with a Model Feed to the Upgrading of a Hydrotreated Light Cycle Oil. Fuel 2013, 111, 763–770. [Google Scholar] [CrossRef]
- Liu, Y.J.; Liang, Z.H.; Liu, X.; Yuan, L.J. Progress of Selective Ring-Opening Reaction of Decalin. Ranliao Huaxue Xuebao/J. Fuel Chem. Technol. 2022, 50, 576–582. [Google Scholar] [CrossRef]
- Chandra Mouli, K.; Dalai, A.K. Ring Opening and Kinetics Study of Hydrotreated LGO on Ni-Mo Carbide Supported on HY and H-Beta Catalysts. Appl. Catal. A Gen. 2009, 364, 80–86. [Google Scholar] [CrossRef]
- Blanco, E.; Piccolo, L.; Laurenti, D.; di Felice, L.; Catherin, N.; Lorentz, C.; Geantet, C.; Calemma, V. Effect of H2S on the Mechanisms of Naphthene Ring Opening and Isomerization over Ir/NaY: A Comparative Study of Decalin, Perhydroindan and Butylcyclohexane Hydroconversions. Appl. Catal. A Gen. 2018, 550, 274–283. [Google Scholar] [CrossRef]
- Vicerich, M.A.; Benitez, V.M.; Sánchez, M.A.; Especel, C.; Epron, F.; Pieck, C.L. Ru-Pt Catalysts Supported on Al2O3 and SiO2-Al2O3 for the Selective Ring Opening of Naphthenes. Can. J. Chem. Eng. 2020, 98, 749–756. [Google Scholar] [CrossRef]
- Vicerich, M.A.; Sánchez, M.A.; Pieck, C.L.; Benitez, V.M. Pt–Ir/Al2O3 Catalysts for the Ring Opening of Naphthenes. Performance as a Function of Time. React. Kinet. Mech. Catal. 2019, 127, 875–886. [Google Scholar] [CrossRef]
- D’Ippolito, S.A.; Pirault-Roy, L.; Especel, C.; Epron, F.; Pieck, C.L. Influence of Rhodium Content on the Behavior of Rh/SiO2-Al2O3 Catalysts for Selective Ring Opening of Decalin. RSC Adv. 2017, 7, 46803–46811. [Google Scholar] [CrossRef] [Green Version]
- Govindhakannan, J.; Chandra Mouli, K.; Phoenix, A.; Fairbridge, C.F.; Dalai, A.K. Thermodynamic Equilibrium Analysis of Ring Opening of Decalin. Fuel 2012, 97, 400–410. [Google Scholar] [CrossRef]
- Vicerich, M.A.; Benitez, V.M.; Especel, C.; Epron, F.; Pieck, C.L. Influence of Iridium Content on the Behavior of Pt-Ir/Al2O3 and Pt-Ir/TiO2 Catalysts for Selective Ring Opening of Naphthenes. Appl. Catal. A Gen. 2013, 453, 167–174. [Google Scholar] [CrossRef]
- Zhu, X.; Zhou, Q.; Xia, Y.; Wang, J.; Chen, H.; Xu, Q.; Liu, J.; Feng, W.; Chen, S. Preparation and Characterization of Cu-Doped TiO2 Nanomaterials with Anatase/Rutile/Brookite Triphasic Structure and Their Photocatalytic Activity. J. Mater. Sci. Mater. Electron. 2021, 32, 21511–21524. [Google Scholar] [CrossRef]
- Zhu, X.; Wang, J.; Yang, D.; Liu, J.; He, L.; Tang, M.; Feng, W.; Wu, X. Fabrication, Characterization and High Photocatalytic Activity of Ag-ZnO Heterojunctions under UV-Visible Light. RSC Adv. 2021, 11, 27257–27266. [Google Scholar] [CrossRef] [PubMed]
- Mouli, K.C.; Choudhary, O.; Soni, K.; Dalai, A.K. Improvement of Cetane Number of LGO by Ring Opening of Naphthenes on Pt/Al-SBA-15 Catalysts. Catal. Today 2012, 198, 69–76. [Google Scholar] [CrossRef]
- Kustov, L.M.; Stakheev, A.Y.; Vasina, T.V.; Masloboishchikova, O.V.; Khelkovskaya-Sergeeva, E.G.; Zeuthen, P. Dual-Function Catalysts for Ring Opening of Cyclic Compounds; Elsevier Masson SAS: Issy Les Moulineaux, France, 2001; Volume 138. [Google Scholar] [CrossRef]
- Kustov, L.M.; Kustov, A.L. Ring Opening of Naphthenic Hydrocarbons on Zeolite Catalysts. Russ. J. Phys. Chem. A 2020, 94, 317–322. [Google Scholar] [CrossRef]
- Samoila, P.; Epron, F.; Marécot, P.; Especel, C. Influence of Chlorine on the Catalytic Properties of Supported Rhodium, Iridium and Platinum in Ring Opening of Naphthenes. Appl. Catal. A Gen. 2013, 462–463, 207–219. [Google Scholar] [CrossRef]
- Piegsa, A.; Korth, W.; Demir, F.; Jess, A. Hydrogenation and Ring Opening of Aromatic and Naphthenic Hydrocarbons over Noble Metal (Ir, Pt, Rh)/Al2O3 Catalysts. Catal. Letters 2012, 142, 531–540. [Google Scholar] [CrossRef]
- Naranov, E.R.; Maximov, A.L. Selective Conversion of Aromatics into Cis-Isomers of Naphthenes Using Ru Catalysts Based on the Supports of Different Nature. Catal. Today 2019, 329, 94–101. [Google Scholar] [CrossRef]
- Kustov, L.M. New Trends in IR-Spectroscopic Characterization of Acid and Basic Sites in Zeolites and Oxide Catalysts. Top. Catal. 1997, 4, 131–144. [Google Scholar] [CrossRef]
- Thommes, M.; Kaneko, K.; Neimark, A.V.; Olivier, J.P.; Rodriguez-Reinoso, F.; Rouquerol, J.; Sing, K.S.W. Physisorption of Gases, with Special Reference to the Evaluation of Surface Area and Pore Size Distribution (IUPAC Technical Report). Pure Appl. Chem. 2015, 87, 1051–1069. [Google Scholar] [CrossRef] [Green Version]
- Lin, Q.; Shimizu, K.; Satsuma, A. Kinetic Analysis of Reduction Process of Supported Rh/Al2O3 Catalysts by Time Resolved in-Situ UV–Vis Spectroscopy. Appl. Catal. A Gen. 2012, 419–420, 142–147. [Google Scholar] [CrossRef]
- Stoyanovskii, V.O.; Vedyagin, A.A.; Aleshina, G.I.; Volodin, A.M.; Noskov, A.S. Characterization of Rh/Al2O3 Catalysts after Calcination at High Temperatures under Oxidizing Conditions by Luminescence Spectroscopy and Catalytic Hydrogenolysis. Appl. Catal. B Environ. 2009, 90, 141–146. [Google Scholar] [CrossRef]
- Blasse, G.; Bril, A. Fluorescence of Rhodium-Activated Aluminum Oxide. J. Electrochem. Soc. 1967, 114, 1306. [Google Scholar] [CrossRef]
- Tsyganenko, A.A.; Filimonov, V.N. Infrared Spectra of Surface Hydroxyl Groups and Crystalline Structure of Oxides. Spectrosc. Lett. 1972, 5, 477–487. [Google Scholar] [CrossRef]
- Lavalley, J.C.; Bensitel, M.; Gallas, J.P.; Lamotte, J.; Busca, G.; Lorenzelli, V. FT-IR Study of the δ(OH) Mode of Surface Hydroxy Groups on Metal Oxides. J. Mol. Struct. 1988, 175, 453–458. [Google Scholar] [CrossRef]
- Busca, G. The Surface of Transitional Aluminas: A Critical Review. Catal. Today 2014, 226, 2–13. [Google Scholar] [CrossRef]
- Tsyganenko, A.A.; Mardilovich, P.P. Structure of Alumina Surfaces. J. Chem. Soc. Faraday Trans. 1996, 92, 4843–4852. [Google Scholar] [CrossRef]
- Lambert, J.-F.; Che, M. The Molecular Approach to Supported Catalysts Synthesis: State of the Art and Future Challenges. J. Mol. Catal. A Chem. 2000, 162, 5–18. [Google Scholar] [CrossRef]
- Hadjiivanov, K. Identification and Characterization of Surface Hydroxyl Groups by Infrared Spectroscopy. Adv. Catal. 2014, 57, 99–318. [Google Scholar] [CrossRef]
- Davydov, A. Molecular Spectroscopy of Oxide Catalyst Surfaces; Wiley: Hoboken, NJ, USA, 2003. [Google Scholar] [CrossRef]
- Haney, M.A.; Franklin, J.L. Mass Spectrometric Determination of the Proton Affinities of Various Molecules. J. Phys. Chem. 1969, 73, 4328–4331. [Google Scholar] [CrossRef]
- Medin, A.S.; Borovkov, V.Y.; Kazansky, V.B.; Pelmentschikov, A.G.; Zhidomirov, G.M. On the Unusual Mechanism of Lewis Acidity Manifestation in HZSM-5 Zeolites. Zeolites 1990, 10, 668–673. [Google Scholar] [CrossRef]
- Dessau, R. On the Presence of Internal Silanol Groups in ZSM-5 and the Annealing of These Sites by Steaming. J. Catal. 1987, 104, 484–489. [Google Scholar] [CrossRef]
- Knözinger, H.; Huber, S. IR Spectroscopy of Small and Weakly Interacting Molecular Probes for Acidic and Basic Zeolites. J. Chem. Soc. Faraday Trans. 1998, 94, 2047–2059. [Google Scholar] [CrossRef]
- Pelmenschikov, A.G.; van Santen, R.A.; Janchen, J.; Meijer, E. Acetonitrile-D3 as a Probe of Lewis and Broensted Acidity of Zeolites. J. Phys. Chem. 1993, 97, 11071–11074. [Google Scholar] [CrossRef] [Green Version]
- Bräuer, P.; Ng, P.L.; Situmorang, O.; Hitchcock, I.; D’Agostino, C. Effect of Al Content on Number and Location of Hydroxyl Acid Species in Zeolites: A DRIFTS Quantitative Protocol without the Need for Molar Extinction Coefficients. RSC Adv. 2017, 7, 52604–52613. [Google Scholar] [CrossRef] [Green Version]
- Bailly, M.; Chizallet, C.; Costentin, G.; Krafft, J.; Lauron-Pernot, H.; Che, M. A Spectroscopy and Catalysis Study of the Nature of Active Sites of MgO Catalysts: Thermodynamic Brønsted Basicity versus Reactivity of Basic Sites. J. Catal. 2005, 235, 413–422. [Google Scholar] [CrossRef]
- Knözinger, E.; Jacob, K.-H.; Singh, S.; Hofmann, P. Hydroxyl Groups as IR Active Surface Probes on MgO Crystallites. Surf. Sci. 1993, 290, 388–402. [Google Scholar] [CrossRef]
- Koubowetz, F.; Latzel, J.; Noller, H. Adsorption of Acetonitrile on Magnesia, an IR and TPD Study. J. Colloid Interface Sci. 1980, 74, 322–330. [Google Scholar] [CrossRef]
- Atoguchi, T.; Kanougi, T. Phenol Oxidation over Alkaline Earth Metal Ion Exchange Beta Zeolite in the Presence of Ketone. J. Mol. Catal. A Chem. 2004, 222, 253–257. [Google Scholar] [CrossRef]
- Angell, C.L.; Howell, M.V. Infrared Spectroscopic Investigation of Zeolites and Adsorbed Molecules. IV. Acetonitrile. J. Phys. Chem. 1969, 73, 2551–2554. [Google Scholar] [CrossRef]
- Purcell, K.F.; Drago, R.S. Studies of the Bonding in Acetonitrile Adducts1. J. Am. Chem. Soc. 1966, 88, 919–924. [Google Scholar] [CrossRef]
- Heitnes Hofstad, K.; Hoebink, J.H.B.J.; Holmen, A.; Marin, G.B. Partial Oxidation of Methane to Synthesis Gas over Rhodium Catalysts. Catal. Today 1998, 40, 157–170. [Google Scholar] [CrossRef]
- Ruckenstein, E.; Wang, H.Y. Temperature-Programmed Reduction and XRD Studies of the Interactions in Supported Rhodium Catalysts and Their Effect on Partial Oxidation of Methane to Synthesis Gas. J. Catal. 2000, 190, 32–38. [Google Scholar] [CrossRef]
- Ruckenstein, E.; Wang, H.Y. Partial Oxidation of Methane to Synthesis Gas over MgO-Supported Rh Catalysts: The Effect of Precursor of MgO. Appl. Catal. A Gen. 2000, 198, 33–41. [Google Scholar] [CrossRef]
- Tanaka, H.; Kaino, R.; Okumura, K.; Kizuka, T.; Nakagawa, Y.; Tomishige, K. Comparative Study of Rh/MgO Modified with Fe, Co or Ni for the Catalytic Partial Oxidation of Methane at Short Contact Time. Part I: Characterization of Catalysts. Appl. Catal. A Gen. 2010, 378, 175–186. [Google Scholar] [CrossRef]
- Cuauhtémoc, I.; Del Angel, G.; Torres, G.; Angeles-Chavez, C.; Navarrete, J.; Padilla, J.M. Enhancement of Catalytic Wet Air Oxidation of Tert-Amyl Methyl Ether by the Addition of Sn and CeO2 to Rh/Al2O3 Catalysts. Catal. Today 2011, 166, 180–187. [Google Scholar] [CrossRef]
- Ferrandon, M.; Krause, T. Role of the Oxide Support on the Performance of Rh Catalysts for the Autothermal Reforming of Gasoline and Gasoline Surrogates to Hydrogen. Appl. Catal. A Gen. 2006, 311, 135–145. [Google Scholar] [CrossRef]
- Weng, W.; Pei, X.; Li, J.; Luo, C.; Liu, Y.; Lin, H.; Huang, C.; Wan, H. Effects of Calcination Temperatures on the Catalytic Performance of Rh/Al2O3 for Methane Partial Oxidation to Synthesis Gas. Catal. Today 2006, 117, 53–61. [Google Scholar] [CrossRef]
- Cimino, S.; Landi, G.; Lisi, L.; Russo, G. Rh–La(Mn,Co)O3 Monolithic Catalysts for the Combustion of Methane under Fuel-Rich Conditions. Catal. Today 2006, 117, 454–461. [Google Scholar] [CrossRef]
- Can, F.; Le Valant, A.; Bion, N.; Epron, F.; Duprez, D. New Active and Selective Rh−REOx−Al2O3 Catalysts for Ethanol Steam Reforming. J. Phys. Chem. C 2008, 112, 14145–14153. [Google Scholar] [CrossRef]


| Sample | SBET, m2g−1 | Vtotal, cm3g−1 | Vmeso, cm3g−1 | Vmicro, cm3g−1 | Dmax, nm |
|---|---|---|---|---|---|
| SiO2 | 239 | 0.92 | 0.92 | 0.005 | 12.9 |
| Al2O3 | 96 | 0.27 | 0.27 | 0.016 | 9.8 |
| CaMgAlO | 245 | 0.58 | 0.57 | 0.011 | 7.7 |
| NaSiAlO | 410 | 0.58 | 0.57 | 0.015 | 1.6, 6.4 |
| Sample | Frequency, cm−1 | Bond Type | Literature |
|---|---|---|---|
| Al2O3 | 3749 | linear isolated Al-OH | [30,31,32,33,34,35,36,37] |
| 3680 | bridged OH | ||
| 3576 | H-bonded OH | ||
| 3264 | contaminants | ||
| SiO2 | 3742 | isolated Si-OH | [25,35,36,38,39,40,41,42] |
| 3601 (shoulder) | bridged OH (or SiOH nests) | ||
| CaMgAlO | 3726 | linear isolated Al-OH | [35,37,43,44,45] |
| 3767 (shoulder) | linear isolated Mg-OH | ||
| 3677 | bridged OH * | [46] | |
| 3592 | H-bonded OH | [30,31,32,33,34,35,36,37] | |
| NaSiAlO | 3740 | isolated Si-OH | [25,35,36,38,39,40,41,42] |
| 3660 | bridged OH |
| Sample | Frequency, cm−1 | Blue Shift of CN Stretching Vibration, cm−1 | Corresponding Sites * |
|---|---|---|---|
| Al2O3 | 2319 | 66 | LAS |
| 2262 | 9 | bridged hydroxyl groups | |
| SiO2 | 2276 | 23 | moderate BAS |
| CaMgAlO | 2320 | 67 | LAS |
| 2259 | 6 | bridged hydroxyl groups | |
| NaSiAlO | 2327 | 64 | LAS |
| 2272 | 19 | moderate BAS |
| Sample | O, (±1.0) at.% | Al, (±0.3) at.% | Si, (±0.3) at.% | Rh, (±0.1) at.% | Rh, wt% |
|---|---|---|---|---|---|
| SiO2 | 65.8 | — | 30.9 | 0.1 | 0.5 |
| NaSiAlO | 63.8 | 17.6 | 13.2 | 0.1 | 0.5 |
| CaMgAlO | 60.0 | 32.2 | — | 0.3 | 1.7 |
| Al2O3 | 58.1 | 33.5 | — | 0.2 | 1.1 |
| Sample | Tmax for Main Peaks, °C | H2/Rh Ratio (mol.) |
|---|---|---|
| 1Rh/SiO2 | −7, +43, +425 | 1.62 |
| 1Rh/Al2O3 | +185, +330 | 1.96 |
| 1Rh/CaMgAlO | +230, +400 | 2.03 |
| 1Rh/NaSiAlO | −15, +390, +460 | 2.38 |
Disclaimer/Publisher’s Note: The statements, opinions and data contained in all publications are solely those of the individual author(s) and contributor(s) and not of MDPI and/or the editor(s). MDPI and/or the editor(s) disclaim responsibility for any injury to people or property resulting from any ideas, methods, instructions or products referred to in the content. |
© 2023 by the authors. Licensee MDPI, Basel, Switzerland. This article is an open access article distributed under the terms and conditions of the Creative Commons Attribution (CC BY) license (https://creativecommons.org/licenses/by/4.0/).
Share and Cite
Kartavova, K.E.; Mashkin, M.Y.; Kostin, M.Y.; Finashina, E.D.; Kalmykov, K.B.; Kapustin, G.I.; Pribytkov, P.V.; Tkachenko, O.P.; Mishin, I.V.; Kustov, L.M.; et al. Rhodium-Based Catalysts: An Impact of the Support Nature on the Catalytic Cyclohexane Ring Opening. Nanomaterials 2023, 13, 936. https://doi.org/10.3390/nano13050936
Kartavova KE, Mashkin MY, Kostin MY, Finashina ED, Kalmykov KB, Kapustin GI, Pribytkov PV, Tkachenko OP, Mishin IV, Kustov LM, et al. Rhodium-Based Catalysts: An Impact of the Support Nature on the Catalytic Cyclohexane Ring Opening. Nanomaterials. 2023; 13(5):936. https://doi.org/10.3390/nano13050936
Chicago/Turabian StyleKartavova, Kristina E., Mikhail Yu. Mashkin, Mikhail Yu. Kostin, Elena D. Finashina, Konstantin B. Kalmykov, Gennady I. Kapustin, Petr V. Pribytkov, Olga P. Tkachenko, Igor V. Mishin, Leonid M. Kustov, and et al. 2023. "Rhodium-Based Catalysts: An Impact of the Support Nature on the Catalytic Cyclohexane Ring Opening" Nanomaterials 13, no. 5: 936. https://doi.org/10.3390/nano13050936