
Comparative Study of α- and β-MnO2 on Methyl Mercaptan Decomposition: The Role of Oxygen Vacancies
Abstract
:
1. Introduction
2. Materials and Methods
2.1. Chemical Reagents
2.2. Catalyst Characterization
2.3. Catalyst Activity Evaluation
3. Results and Discussion
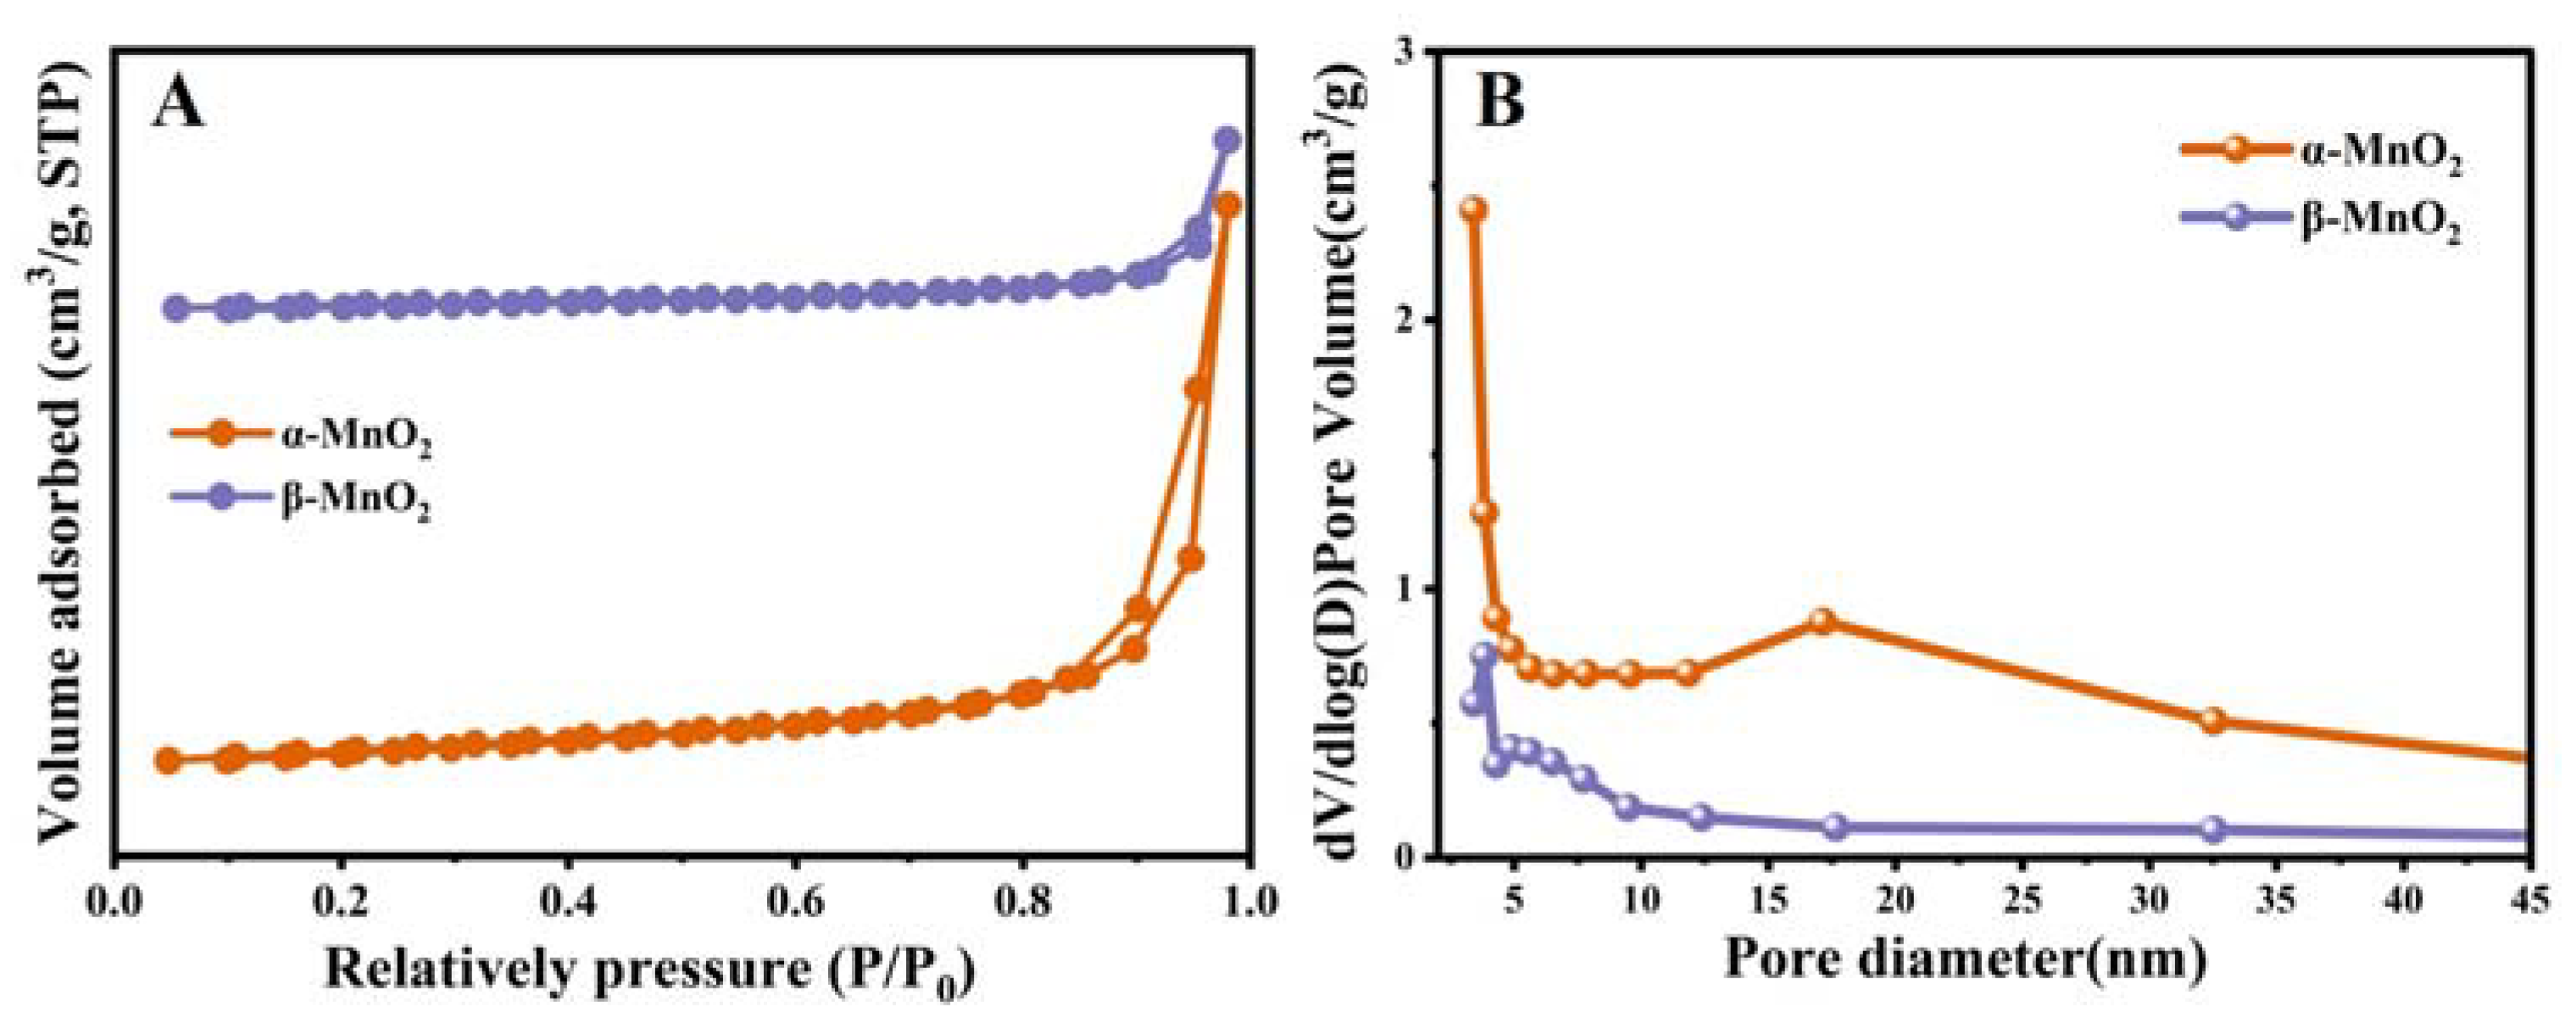
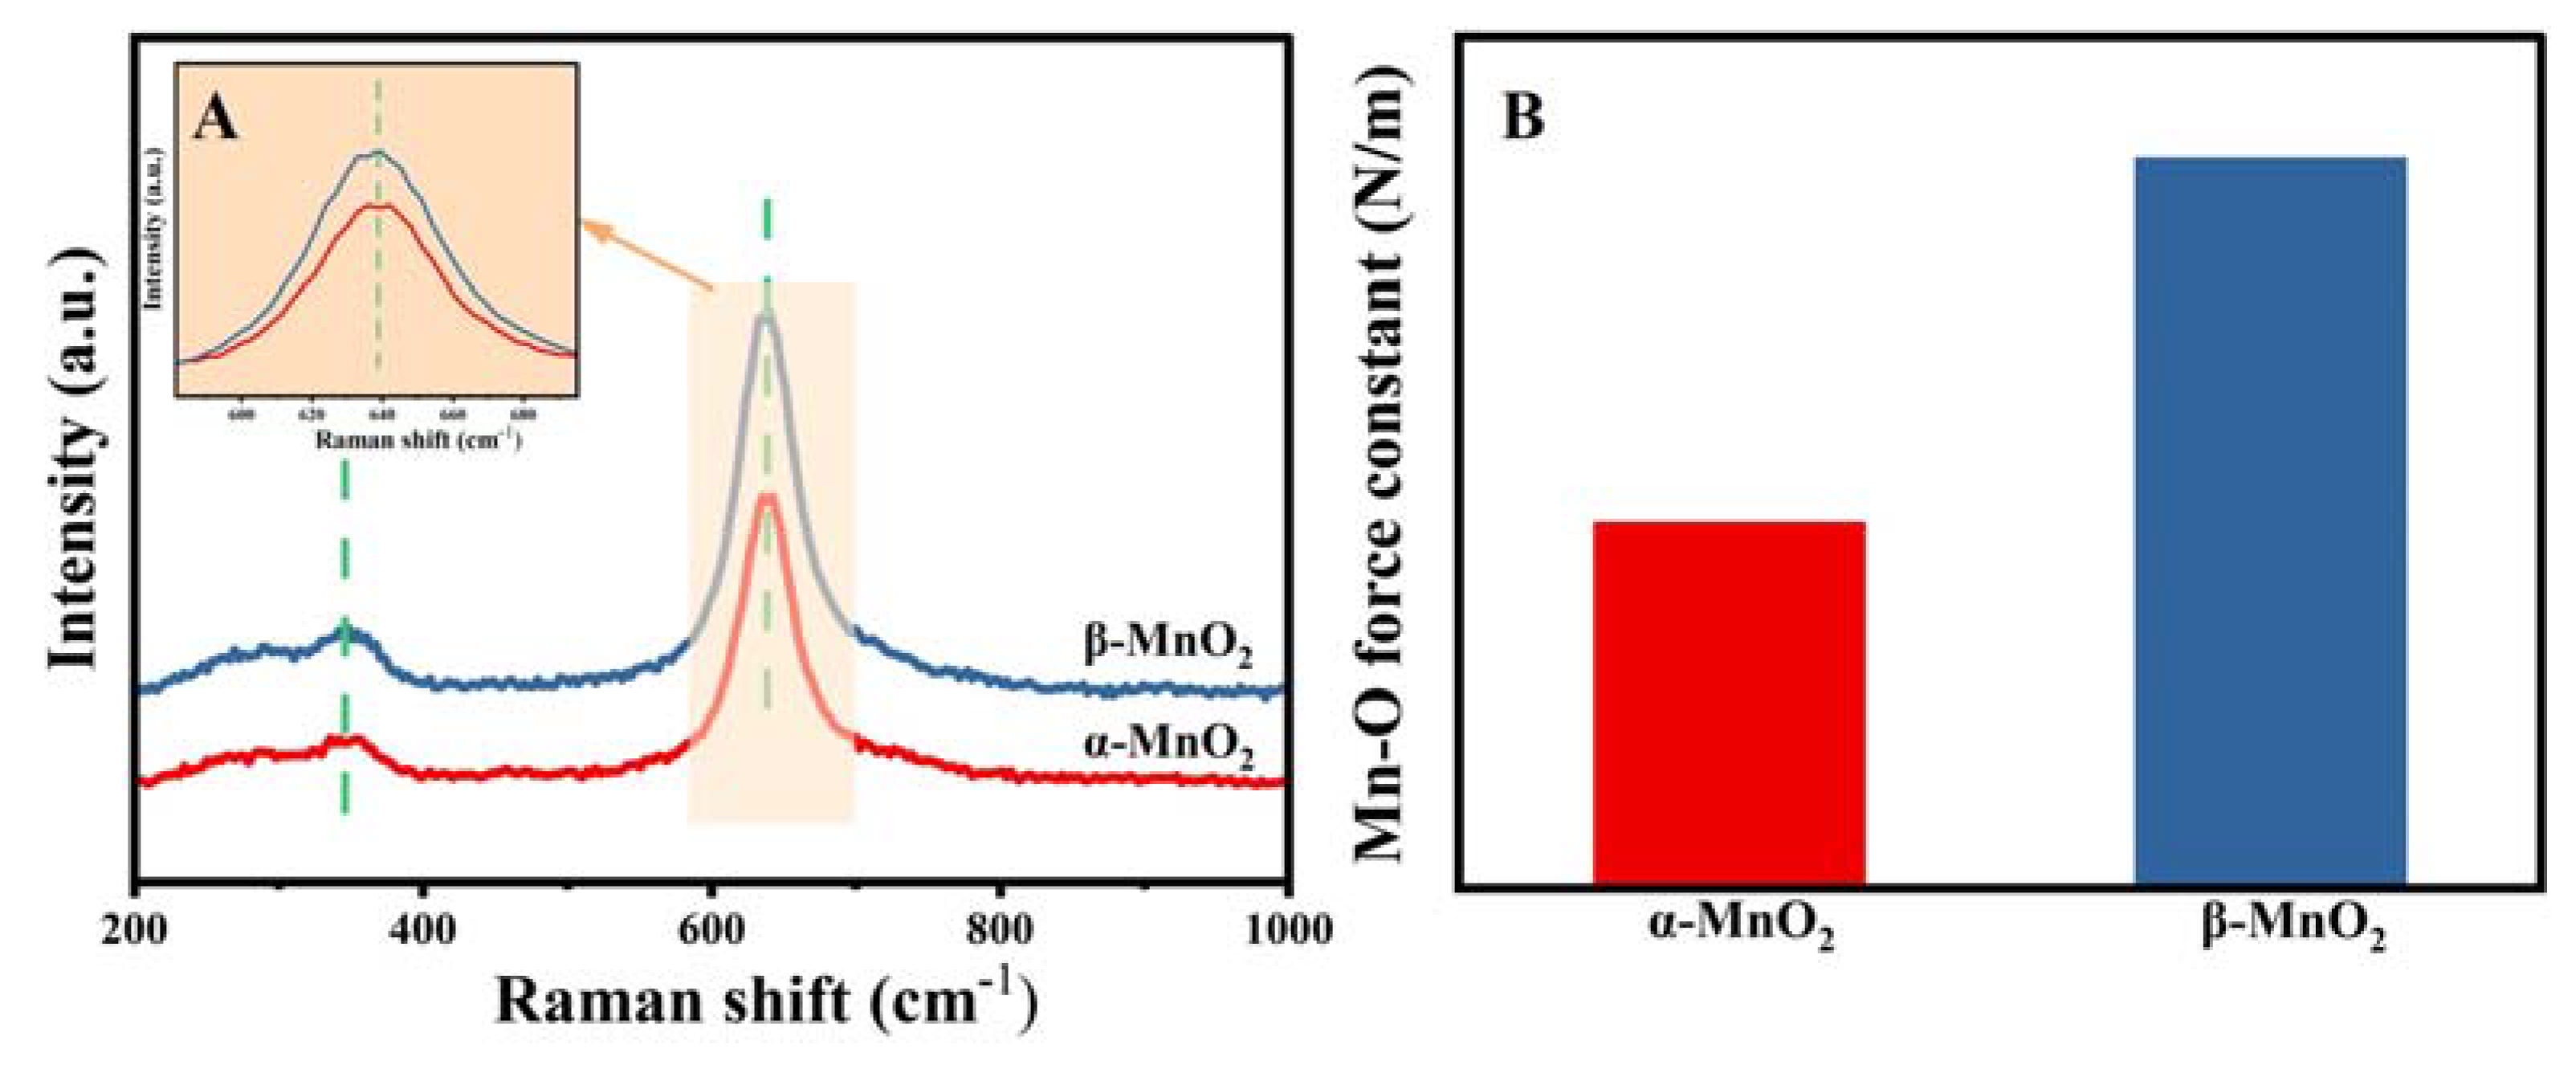
3.1. Structure and Morphology
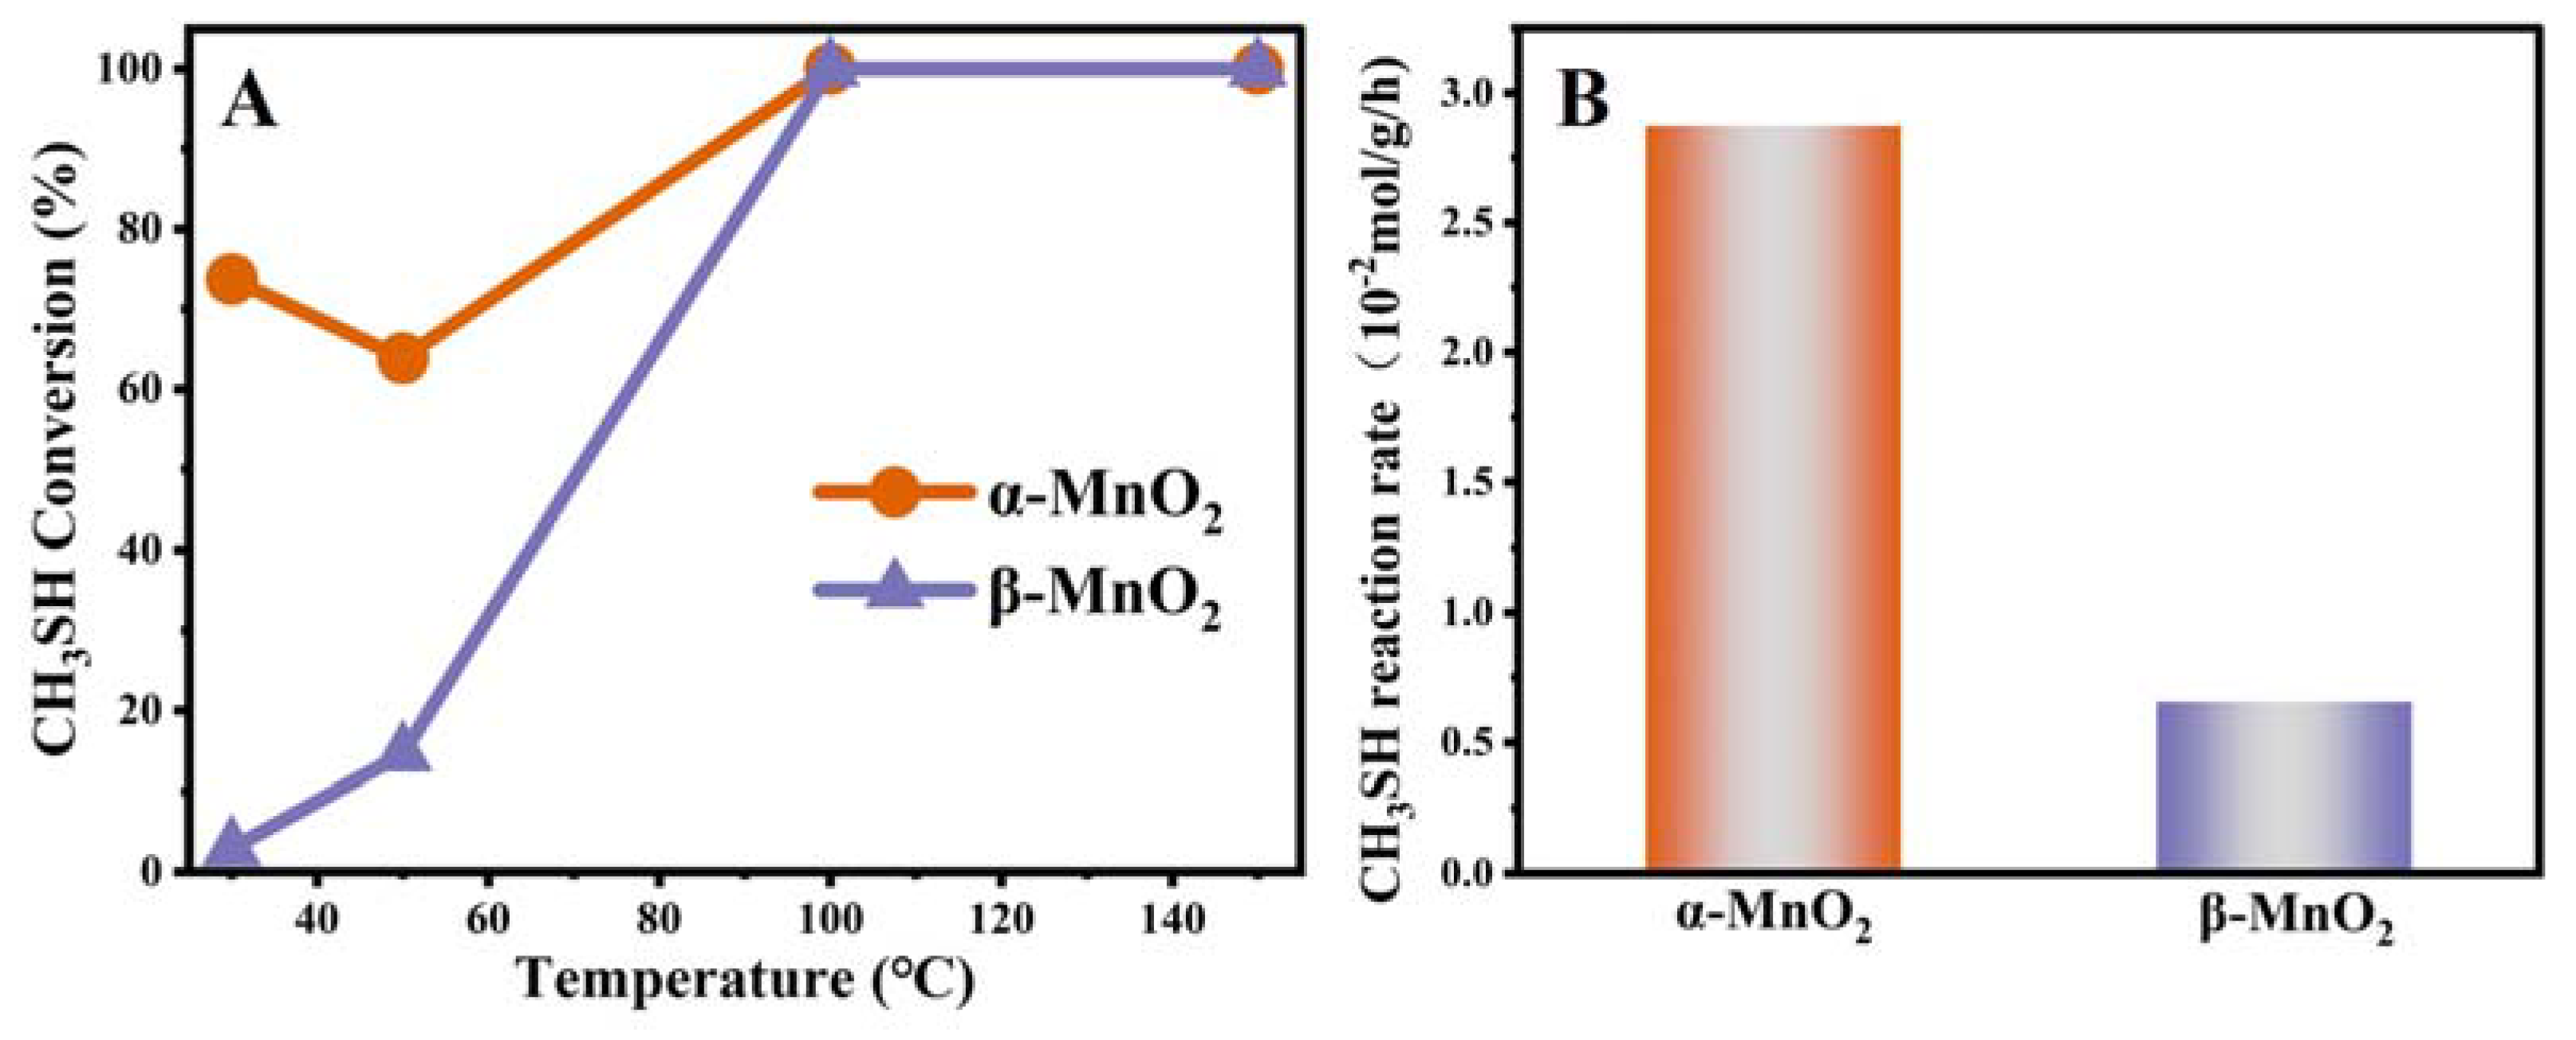
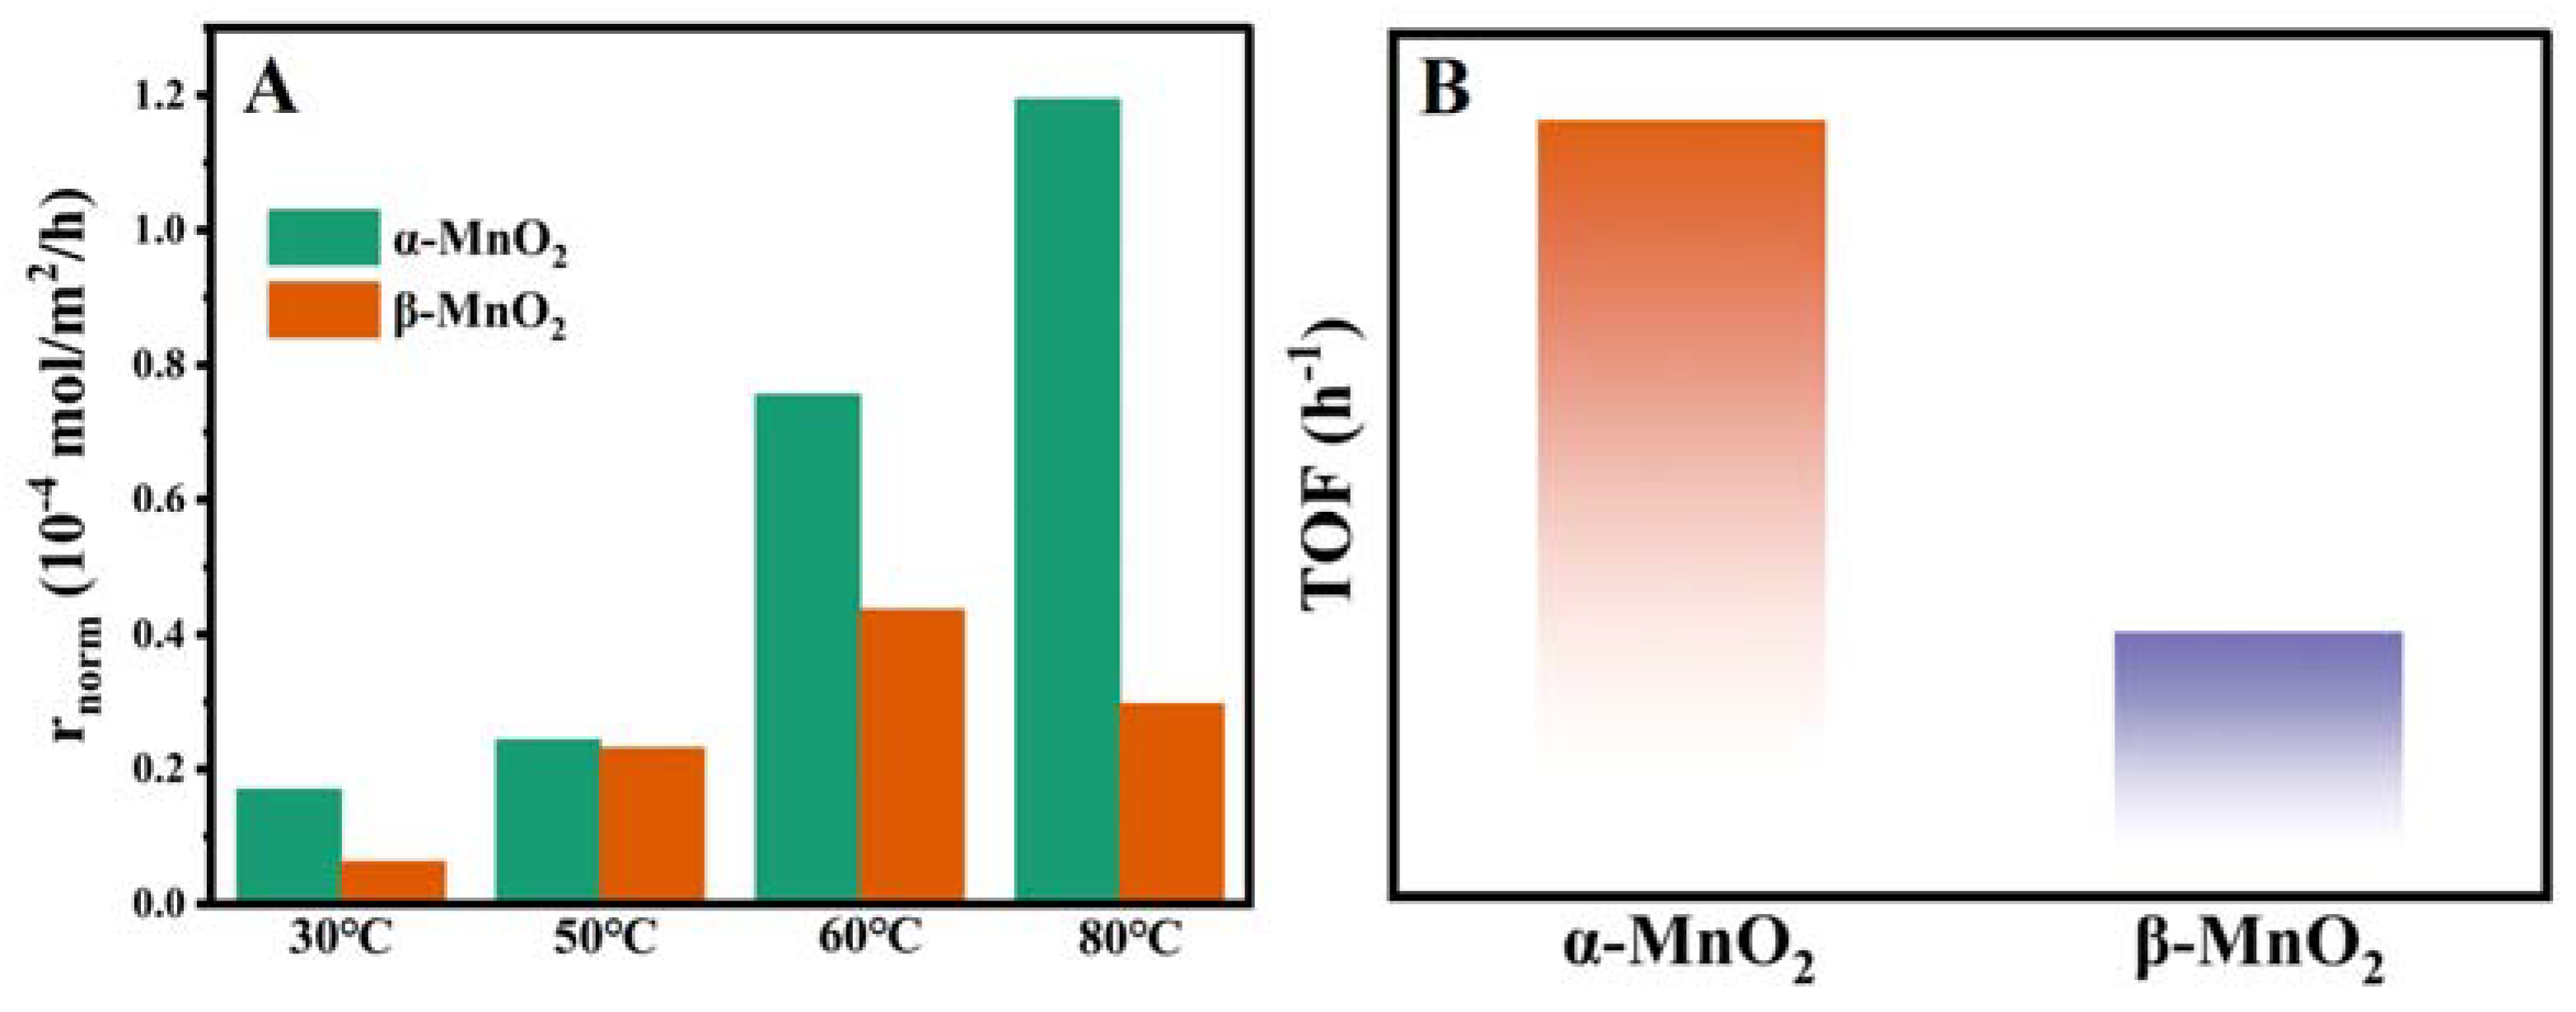
3.2. Catalytic Performance
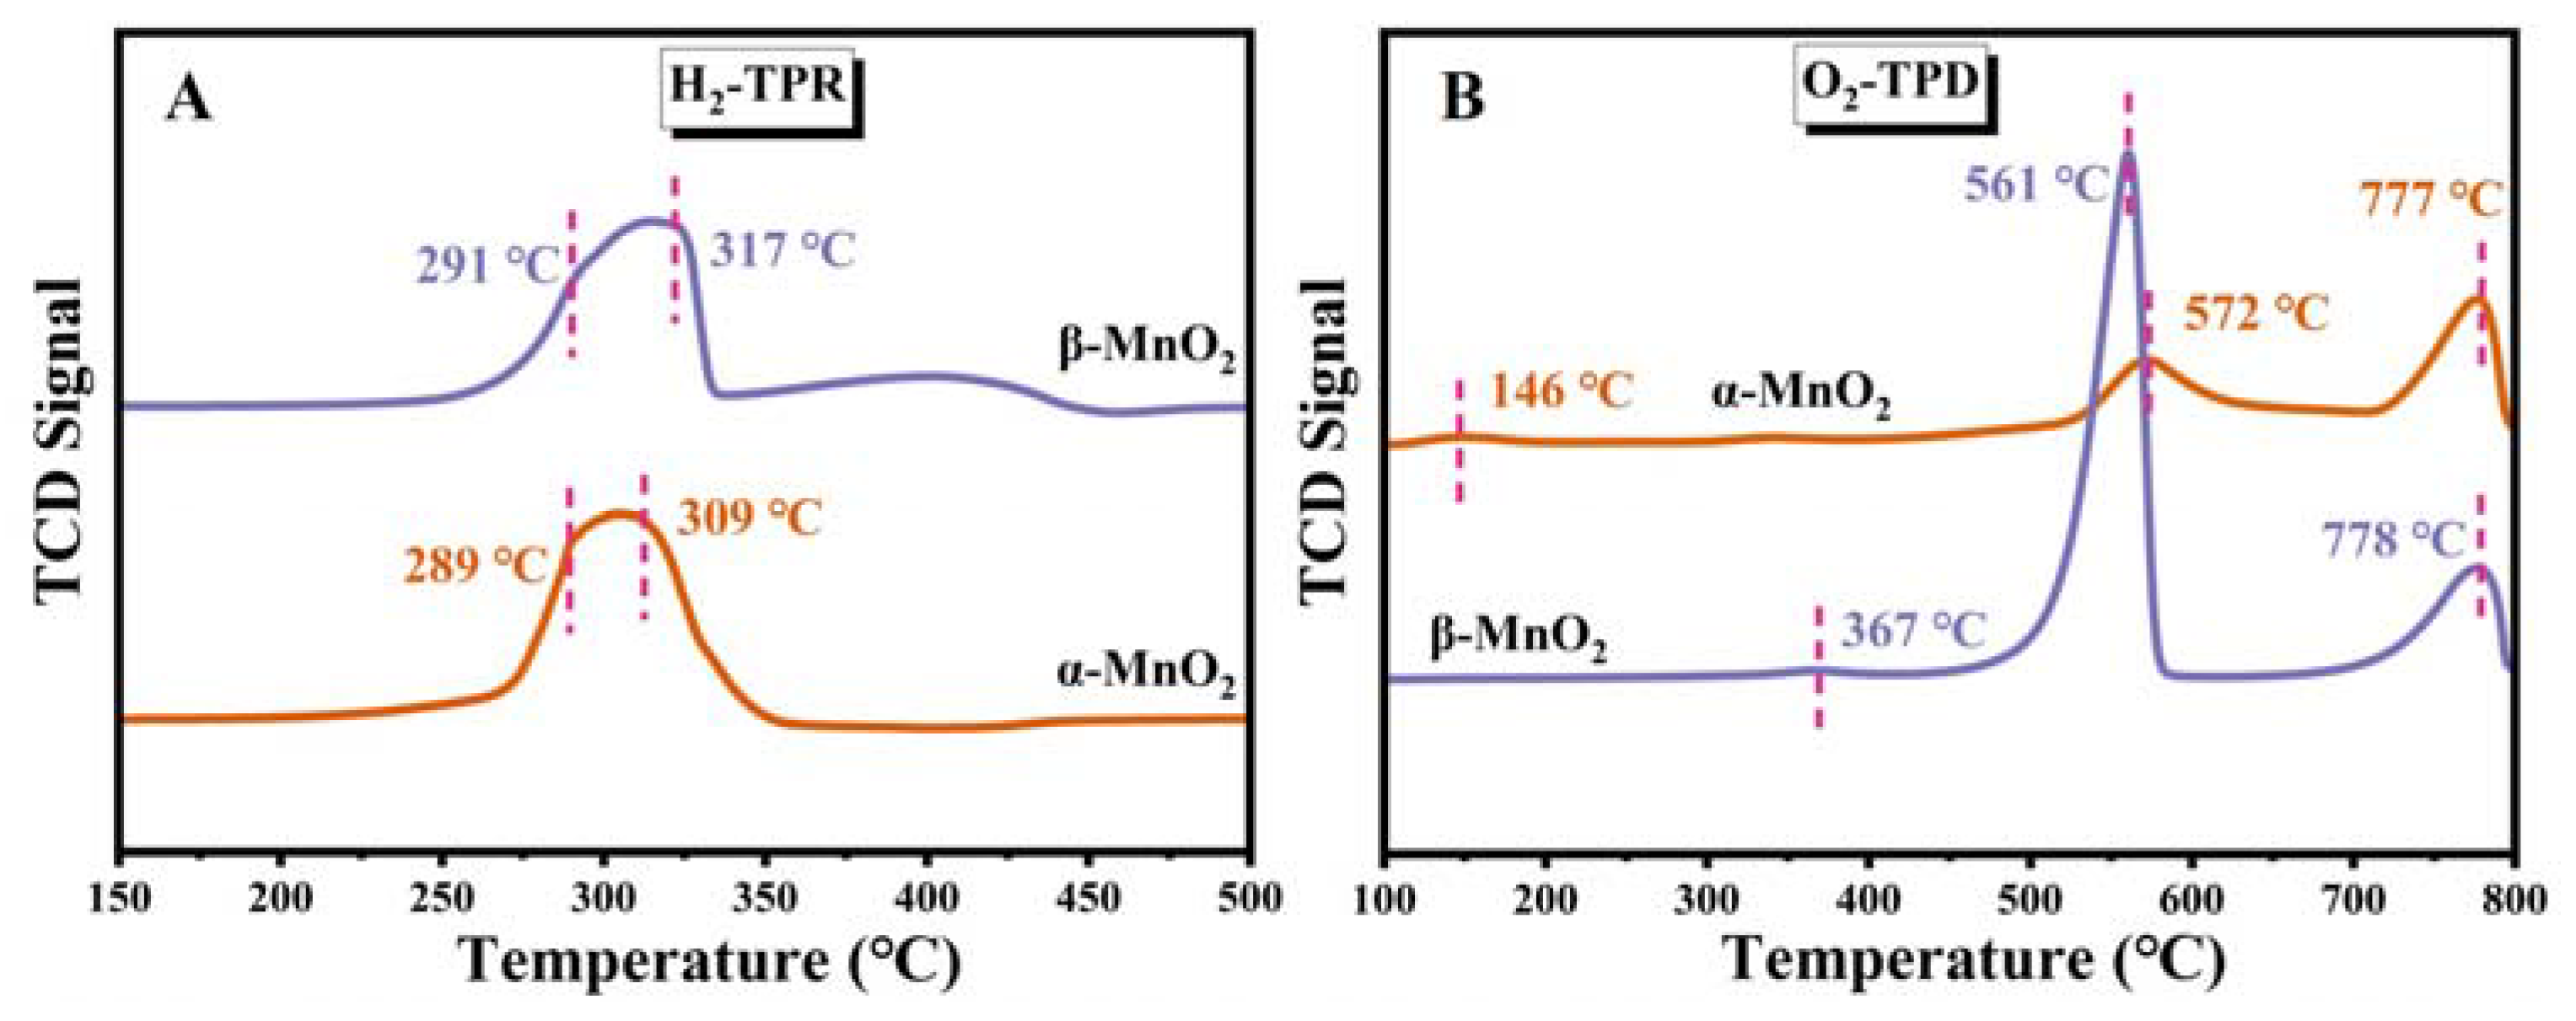
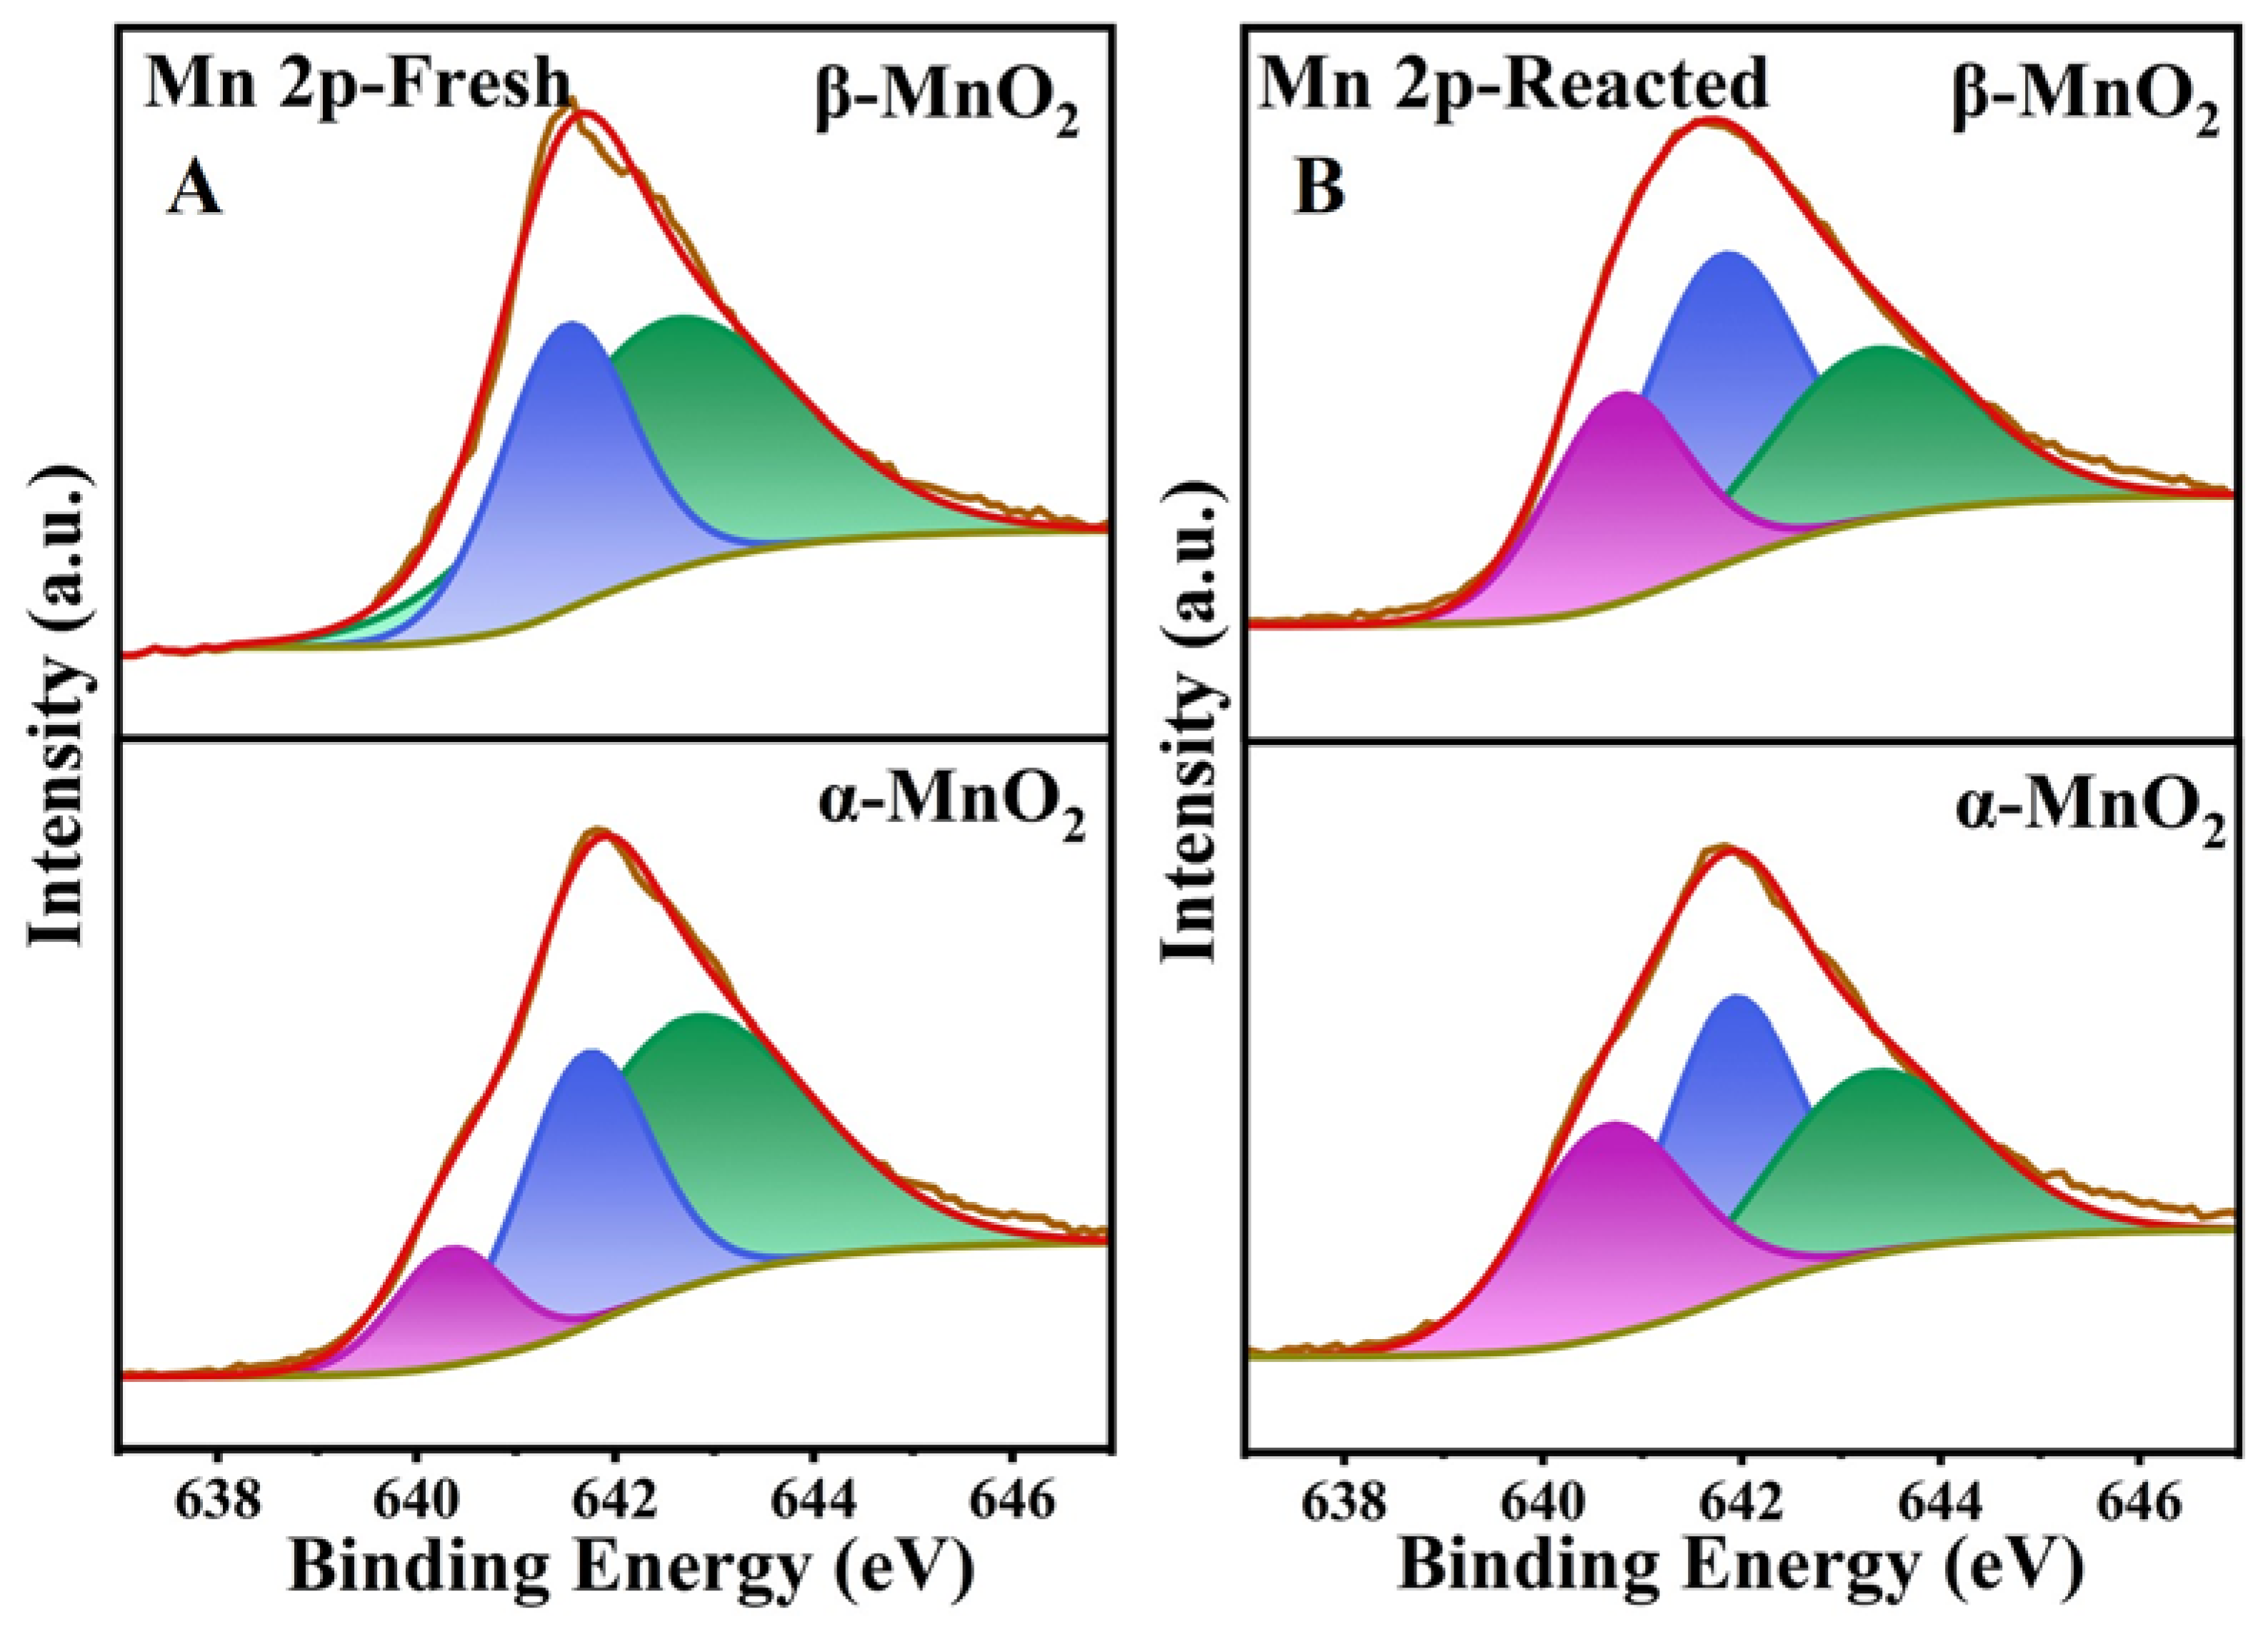
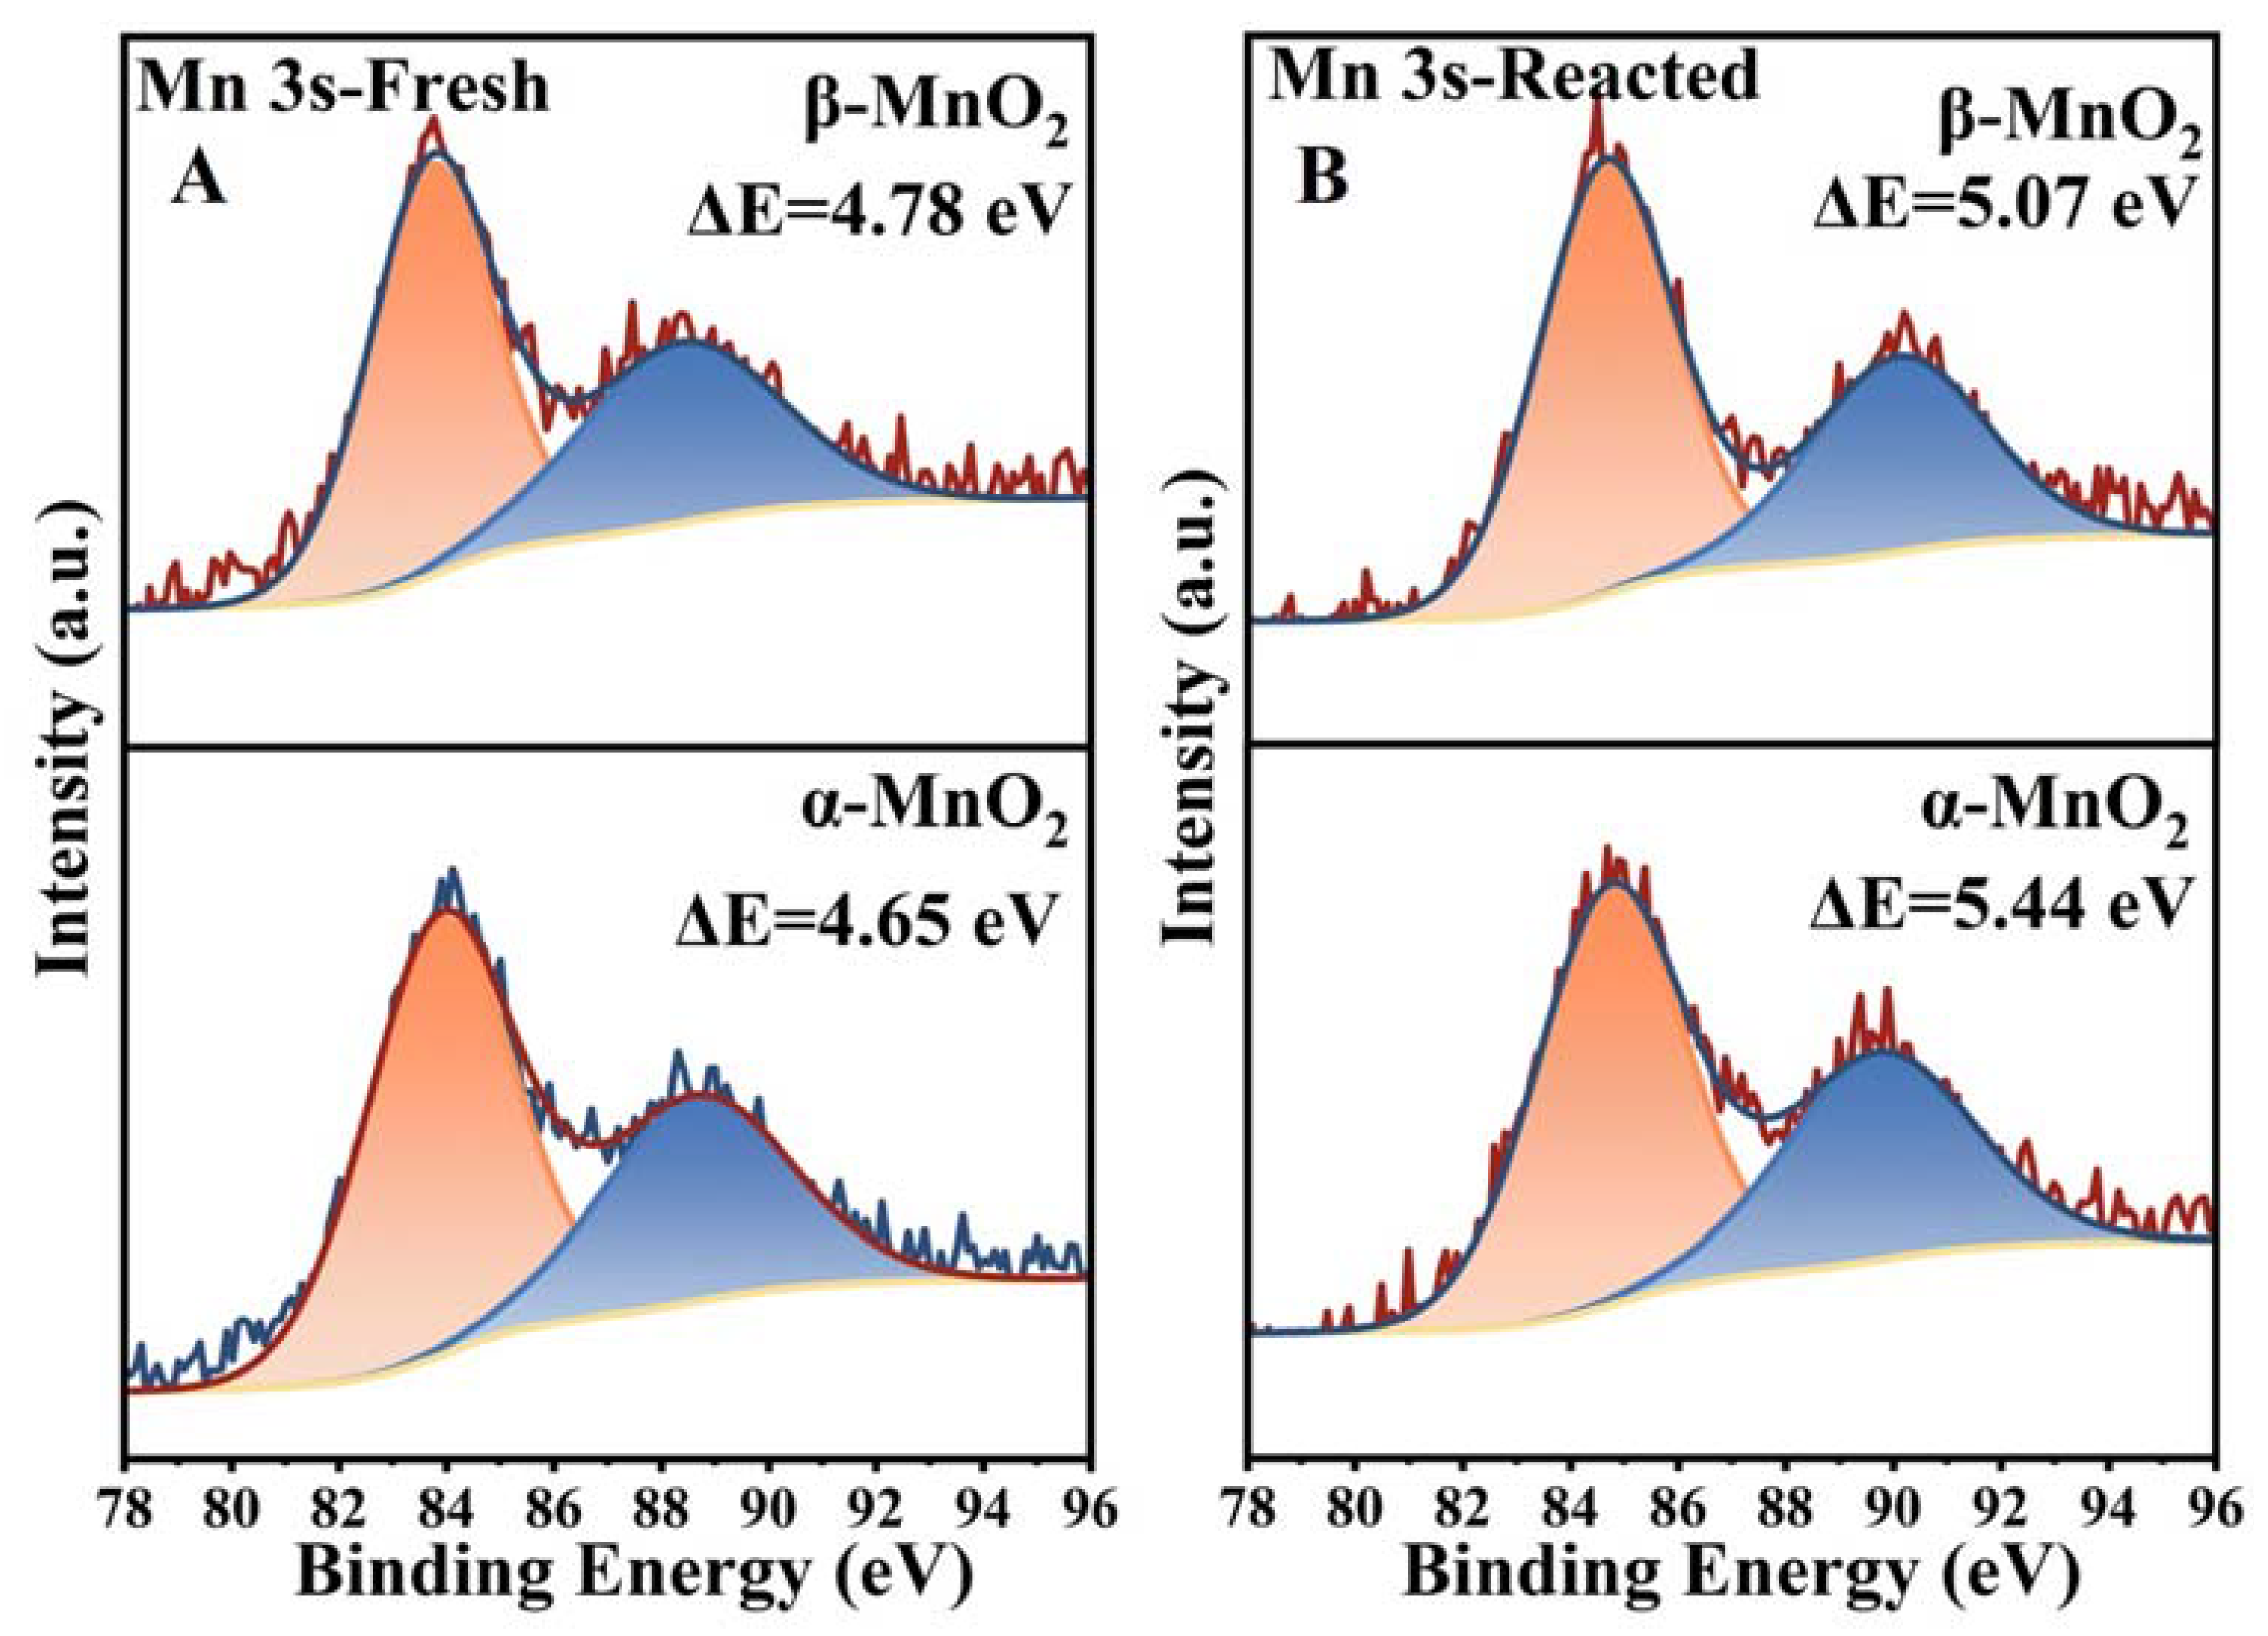
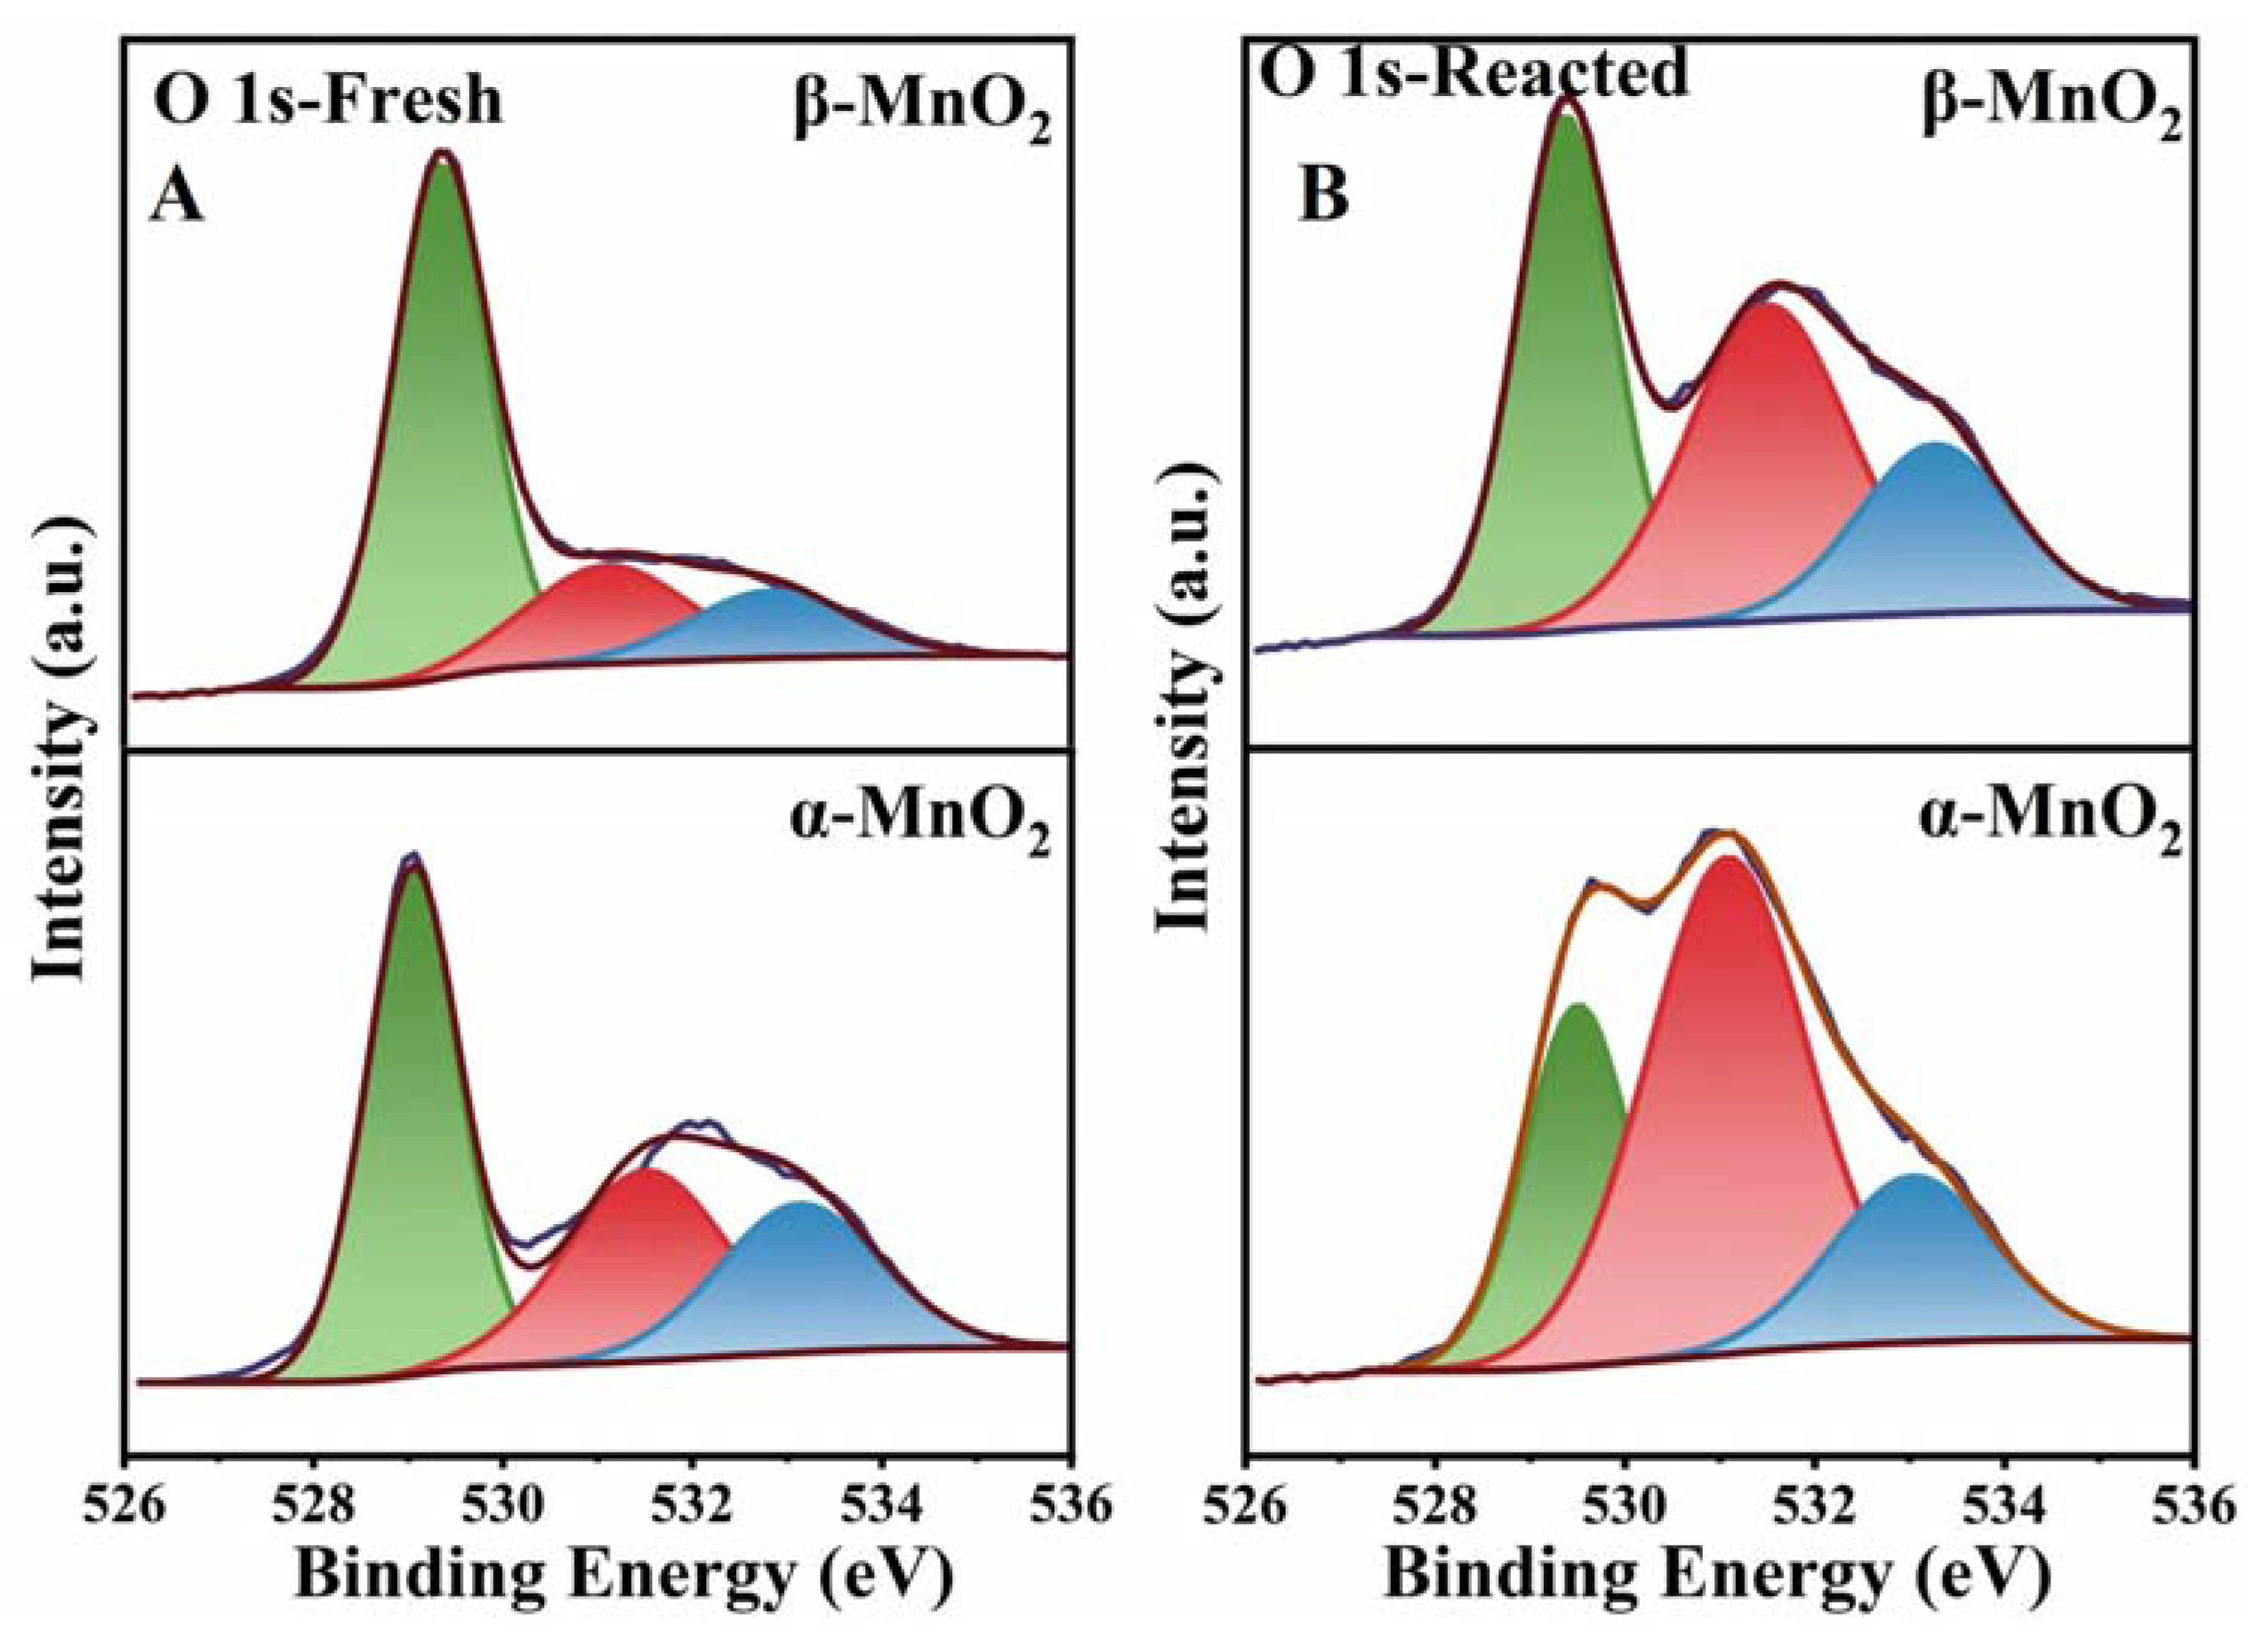
3.3. Redox Capacity and Oxygen Species
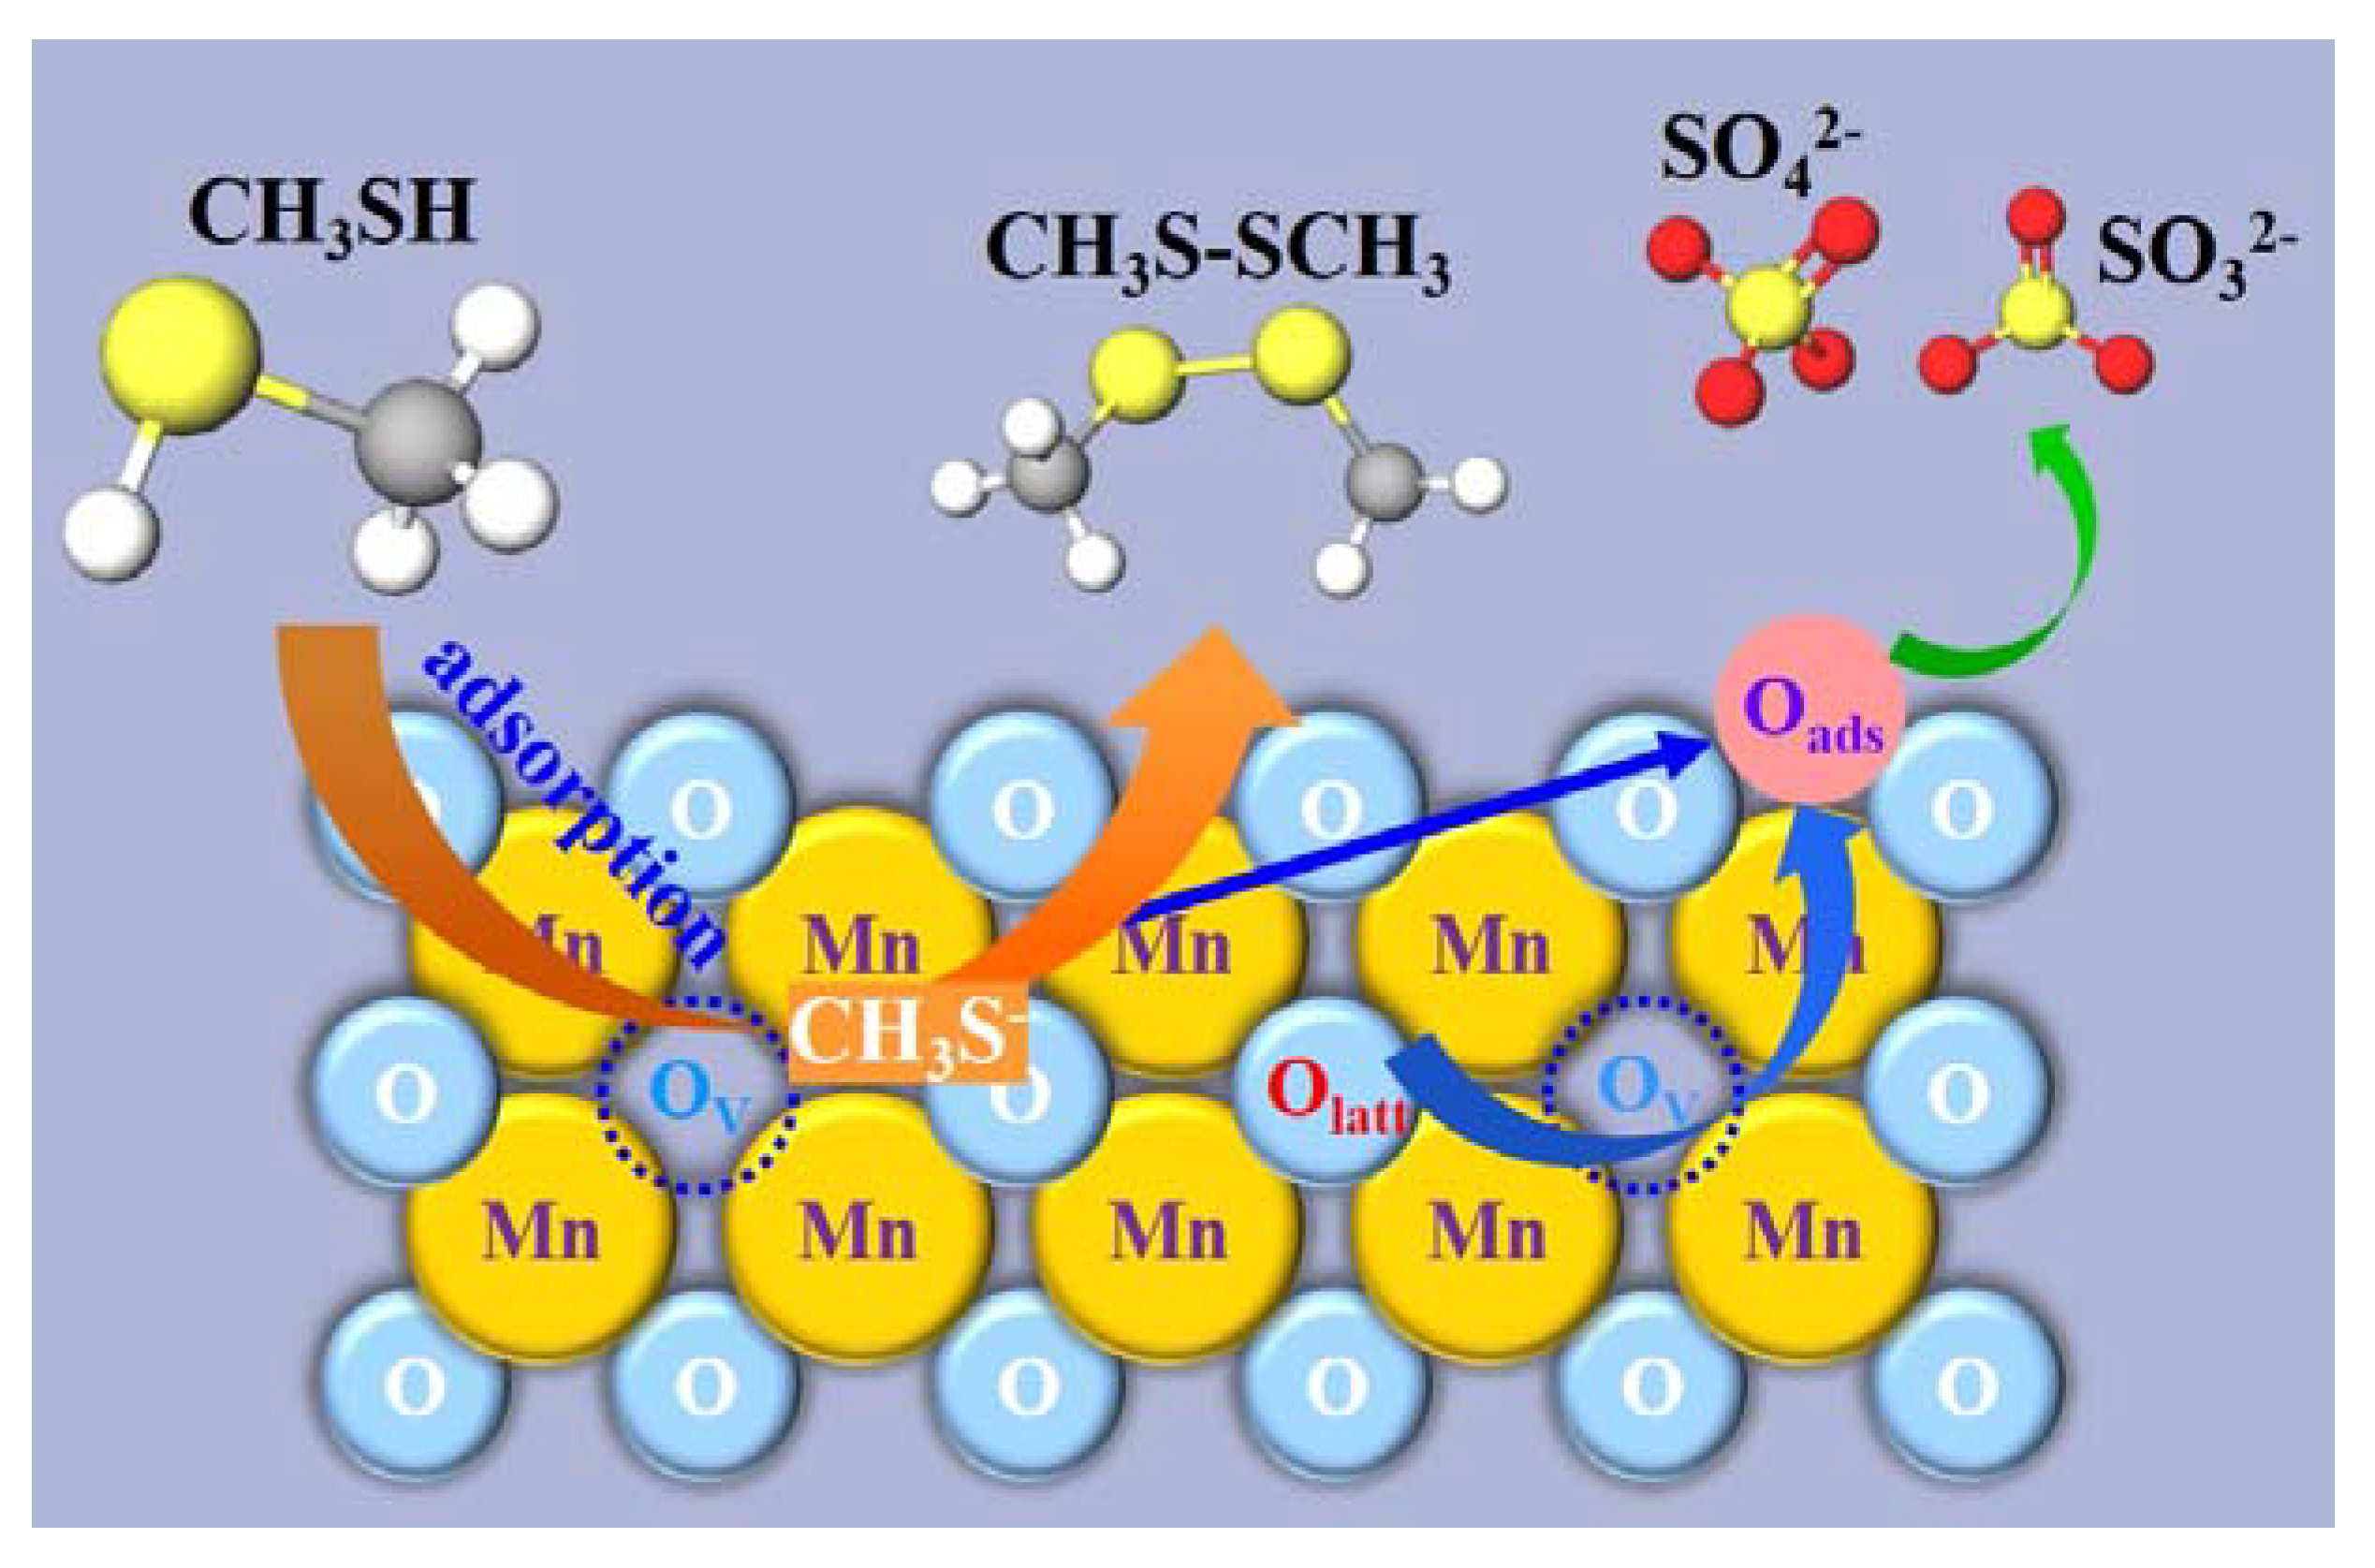
3.4. Identification of the Role of Oxygen Vacancies in CH3SH Degradation
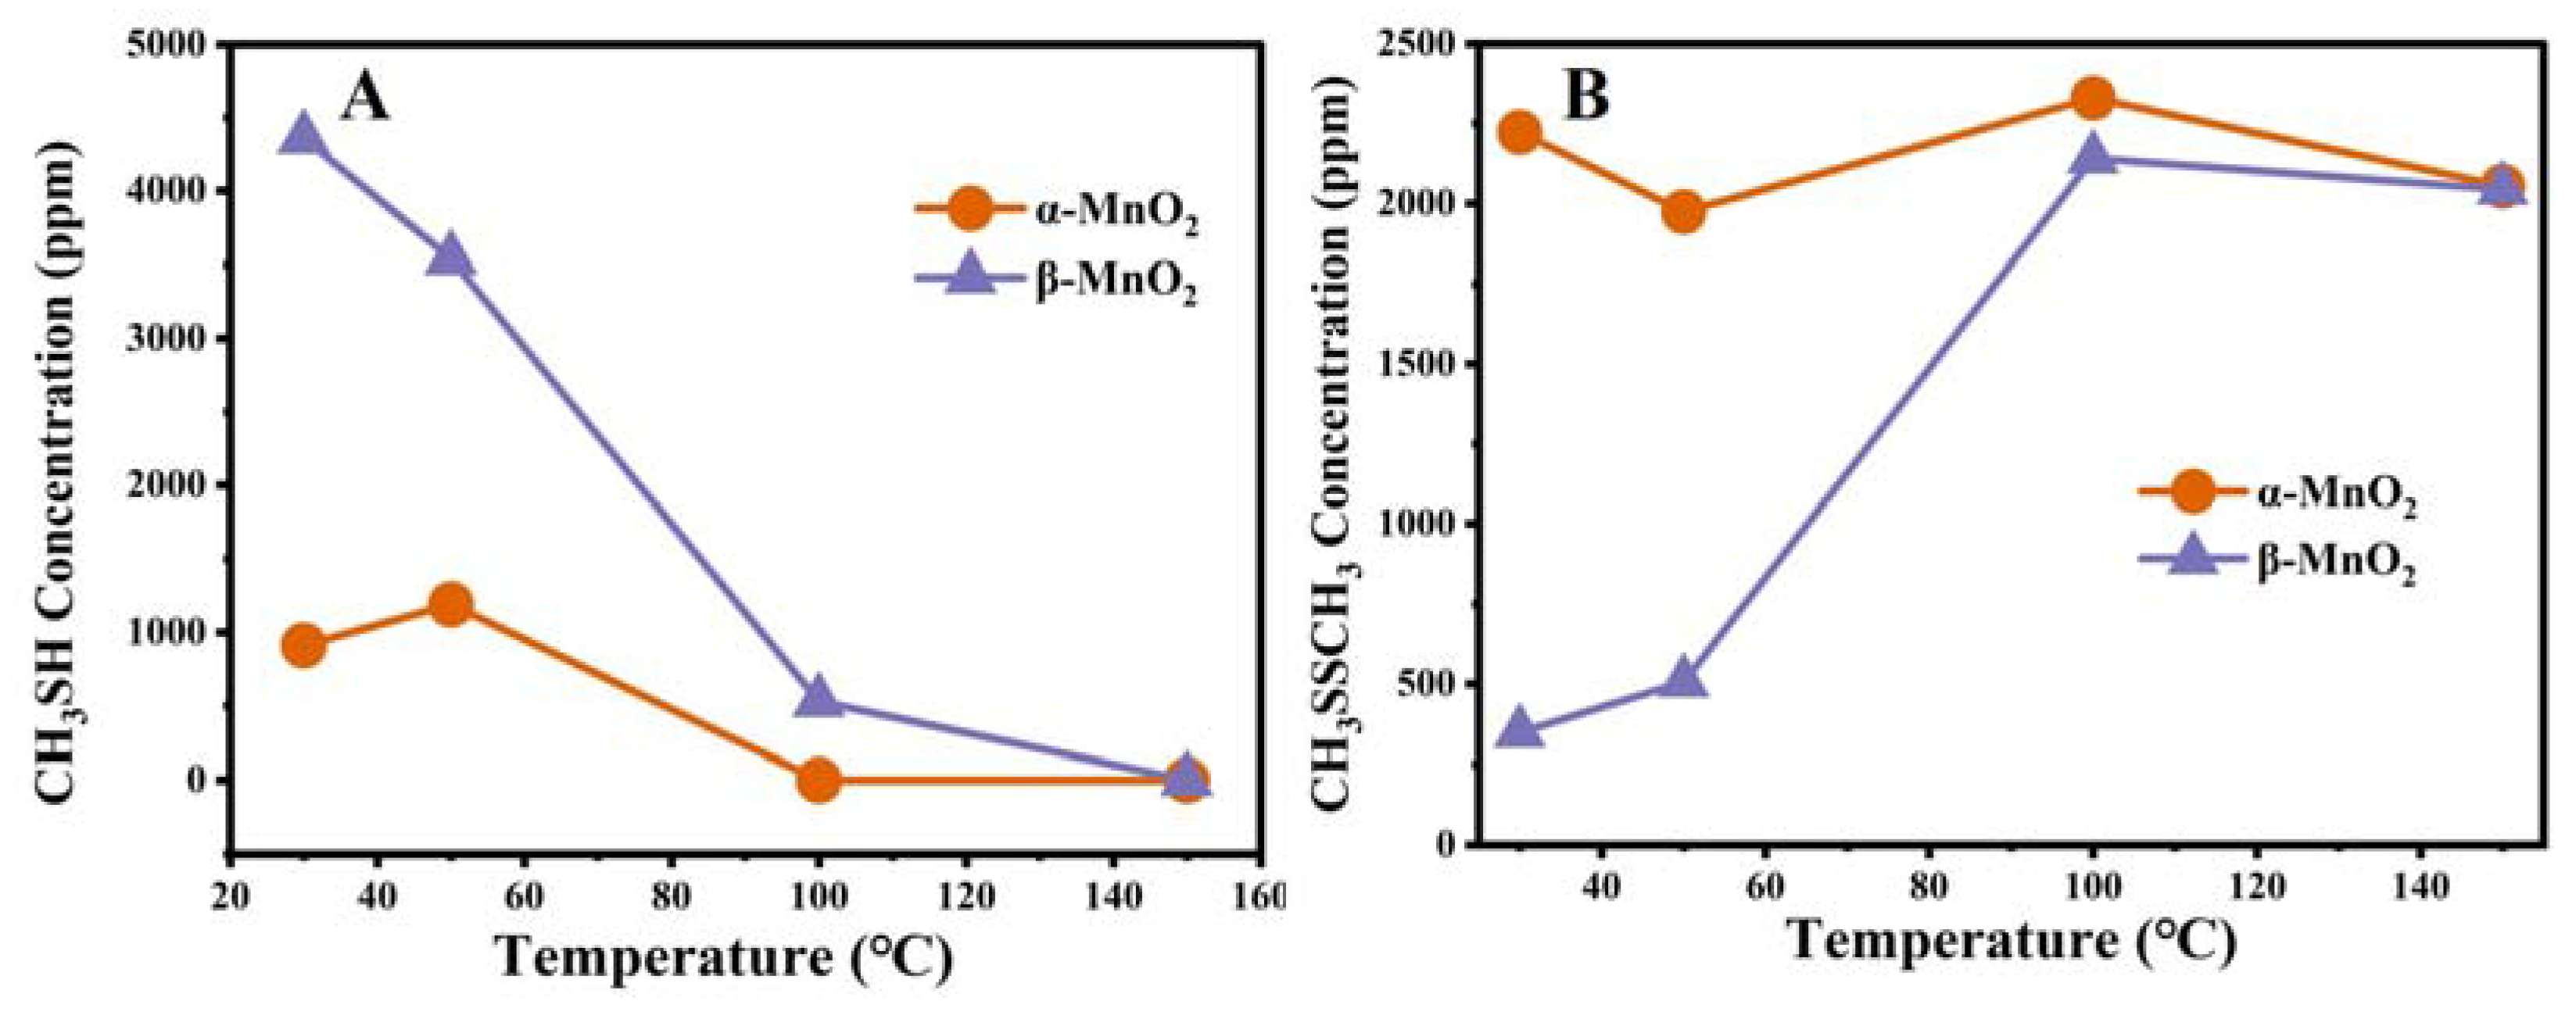
3.5. Product Detection during the Reaction
4. Conclusions
Author Contributions
Funding
Data Availability Statement
Conflicts of Interest
References
- Guo, C.; Zhu, J.; He, J.; Hu, L.; Li, D. Catalytic oxidation/photocatalytic degradation of ethyl mercaptan on α-MnO2@H4Nb6O17-NS nanocomposite. Vacuum 2020, 182, 109718. [Google Scholar] [CrossRef]
- Pétron, G.; Frost, G.; Miller, B.R.; Hirsch, A.I. Hydrocarbon emissions characterization in the Colorado Front Range: A pilot study. J. Geophys. Res. 2012, 117, D04304. [Google Scholar] [CrossRef]
- He, D.; Zhao, Y.; Yang, S.; Mei, Y.; Yu, J.; Liu, J.; Chen, D.; He, S.; Luo, Y. Enhancement of catalytic performance and resistance to carbonaceous deposit of lanthanum (La) doped HZSM-5 catalysts for decomposition of methyl mercaptan. Chem. Eng. J. 2018, 336, 579–586. [Google Scholar] [CrossRef]
- Lu, J.; Hao, H.; Zhang, L.; Xu, Z.; Zhong, L.; Zhao, Y.; He, D.; Liu, J.; Chen, D.; Pu, H.; et al. The investigation of the role of basic lanthanum (La) species on the improvement of catalytic activity and stability of HZSM-5 material for eliminating methanethiol-(CH3SH). Appl. Catal. B 2018, 237, 185–197. [Google Scholar] [CrossRef]
- Zhao, S.; Yi, H.; Tang, X.; Kang, D.; Gao, F.; Wang, J.; Huang, Y.; Yang, Z. Removal of volatile odorous organic compounds over NiAl mixed oxides at low temperature. J. Hazard. Mater. 2018, 344, 797. [Google Scholar] [CrossRef]
- Yi, H.; Tao, T.; Zhao, S.; Yu, Q.; Gao, F.; Zhou, Y.; Tang, X. Promoted adsorption of methyl mercaptan by γ-Al2O3 catalyst loaded with Cu/Mn. Environ. Technol. Inno. 2021, 21, 101349. [Google Scholar] [CrossRef]
- Roman, P.; Veltman, R.; Bijmans, F.M.M.; Keesman, K.J.; Janssen, A.J.H. Effect of methanethiol concentration on sulfur production in biological desulfurization systems under haloalkaline conditions. Environ. Sci. Technol. 2015, 49, 9212. [Google Scholar] [CrossRef]
- Hu, L.; He, H.; Xia, D.; Huang, Y.; Xu, J.; Li, H.; He, C.; Yang, W.; Shu, D.; Wong, P.K. Highly Efficient Performance and Conversion Pathway of Photocatalytic CH3SH Oxidation on Self-Stabilized Indirect Z-Scheme g-C3N4/I3-BiOI. ACS Appl. Mater. Inter. 2018, 10, 18693–18708. [Google Scholar] [CrossRef]
- He, C.; Liao, Y.; Chen, C.; Xia, D.; Wang, Y.; Tian, S.; Yang, J.; Shu, D. Realizing a redox-robust Ag/MnO2 catalyst for efficient wet catalytic ozonation of S-VOCs: Promotional role of Ag(0)/Ag(I)-Mn based redox shuttle. Appl. Cataly. B 2022, 303, 120881. [Google Scholar] [CrossRef]
- Lian, Q.; Hu, L.; Ma, D.; Jiao, Y.; Xia, D.; Huang, Y.; Tang, Z.; Qu, W.; Zhao, H.; He, C.; et al. Interstitial Atomic Bi Charge-Alternating Processor Boosts Twofold Molecular Oxygen Activation Enabling Rapid Catalytic Oxidation Reactions at Room Temperature. Advan. Func. Mater. 2022, 32, 2205054. [Google Scholar] [CrossRef]
- Liu, J.; He, D.; Chen, D.; Hao, H.; Yu, J.; Lu, J.; Liu, F.; Liu, P.; Zhao, Y.; Luo, Y. Promotional effects of rare-earth (La, Ce and Pr) modification over HZSM-5 for methyl mercaptan catalytic decomposition. J. Taiwan Ins.Chem. Eng. 2017, 80, 262–268. [Google Scholar] [CrossRef]
- Zhao, Y.; Chen, D.; Liu, J.; He, D.; Cao, X.; Han, C.; Lu, J.; Luo, Y. Tuning the metal-support interaction on chromium-based catalysts for catalytically eliminate methyl mercaptan: Anchored active chromium species through surface hydroxyl groups. Chem. Eng. J. 2020, 389, 124384. [Google Scholar] [CrossRef]
- Tian, F.-X.; Li, H.; Zhu, M.; Tu, W.; Lin, D.; Han, Y.-F. Effect of MnO2 Polymorphs’ Structure on Low-Temperature Catalytic Oxidation: Crystalline Controlled Oxygen Vacancy Formation. ACS Appl. Mater. Inter. 2022, 14, 18525–18538. [Google Scholar] [CrossRef]
- Huang, J.; Zhong, S.; Dai, Y.; Liu, C.-C.; Zhang, H. Effect of MnO2 Phase Structure on the Oxidative Reactivity toward Bisphenol A Degradation. Environ. Sci. Technol. 2018, 52, 11309–11318. [Google Scholar] [CrossRef]
- Zhang, K.; Han, X.; Hu, Z.; Zhang, X.; Tao, Z.; Chen, J. Nanostructured Mn-based oxides for electrochemical energy storage and conversion. Chem. Soc. Rev. 2015, 44, 699–728. [Google Scholar] [CrossRef]
- Yang, R.; Fan, Y.; Ye, R.; Tang, Y.; Cao, X.; Yin, Z.; Zeng, Z. MnO2-Based Materials for Environmental Applications. Advan. Mater. 2021, 33, 2004862. [Google Scholar] [CrossRef]
- Wang, Y.; Liu, K.; Wu, J.; Hu, Z.; Huang, L.; Zhou, J.; Ishihara, T.; Guo, L. Unveiling the Effects of Alkali Metal Ions Intercalated in Layered MnO2 for Formaldehyde Catalytic Oxidation. ACS Catal. 2020, 10, 10021–10031. [Google Scholar] [CrossRef]
- Sun, W.; Kitchaev, D.A.; Kramer, D.; Ceder, G. Non-equilibrium crystallization pathways of manganese oxides in aqueous solution. Nat. Commun. 2019, 10, 573. [Google Scholar] [CrossRef] [Green Version]
- Hayashi, E.; Yamaguchi, Y.; Kamata, K.; Tsunoda, N.; Kumagai, Y.; Oba, F.; Hara, M. Effect of MnO2 Crystal Structure on Aerobic Oxidation of 5-Hydroxymethylfurfural to 2,5-Furandicarboxylic Acid. Jo. Amer. Chem. Soc. 2019, 141, 890–900. [Google Scholar] [CrossRef]
- Chen, B.; Wu, B.; Yu, L.; Crocker, M.; Shi, C. Investigation into the Catalytic Roles of Various Oxygen Species over Different Crystal Phases of MnO2 for C6H6 and HCHO Oxidation. ACS Catal. 2020, 10, 6176–6187. [Google Scholar] [CrossRef]
- Shi, J.; Qi, T.; Sun, B.C.; Chu, G.W.; Chen, J.F. Catalytic oxidation of benzyl alcohol over MnO2: Structure-activity description and reaction mechanism. Chem. Eng. J. 2022, 440, 135802. [Google Scholar] [CrossRef]
- Jiao, F.; Bruce, P.G. Mesoporous Crystalline β-MnO2-a Reversible Positive Electrode for Rechargeable Lithium Batteries. Advan. Mater. 2007, 19, 657–660. [Google Scholar] [CrossRef]
- Hayashi, E.; Yamaguchi, Y.; Kita, Y.; Kamata, K.; Hara, M. One-pot aerobic oxidative sulfonamidation of aromatic thiols with ammonia by a dual-functional β-MnO2 nanocatalyst. Chem. Commun. 2020, 56, 2095–2098. [Google Scholar] [CrossRef] [PubMed]
- Li, H.; Shang, H.; Li, Y.; Cao, X.; Yang, Z.; Ai, Z.; Zhang, L. Interfacial Charging–Decharging Strategy for Efficient and Selective Aerobic NO Oxidation on Oxygen Vacancy. Environ. Sci. Technol. 2019, 53, 6964–6971. [Google Scholar] [CrossRef]
- Rong, S.; Zhang, P.; Liu, F.; Yang, Y. Engineering Crystal Facet of α-MnO2 Nanowire for Highly Efficient Catalytic Oxidation of Carcinogenic Airborne Formaldehyde. ACS Catal. 2018, 8, 3435–3446. [Google Scholar] [CrossRef]
- Wang, Y.; Liu, M.; Hu, C.; Xin, Y.; Ma, D.; Gao, M.; Xie, H. Enhanced MnO2/peroxymonosulfate activation for phthalic acid esters degradation: Regulation of oxygen vacancy. Chem. Eng. J. 2022, 433, 134048. [Google Scholar] [CrossRef]
- Yang, R.; Guo, Z.; Cai, L.; Zhu, R.; Fan, Y.; Zhang, Y.; Han, P.; Zhang, W.; Zhu, X.; Zhao, Q.; et al. Investigation into the Phase-Activity Relationship of MnO2 Nanomaterials toward Ozone-Assisted Catalytic Oxidation of Toluene. Small 2021, 17, 2103052. [Google Scholar] [CrossRef]
- Yang, W.; Su, Z.A.; Xu, Z.; Yang, W.; Peng, Y.; Li, J. Comparative study of α-, β-, γ- and δ-MnO2 on toluene oxidation: Oxygen vacancies and reaction intermediates. Appl. Catal. B 2020, 260, 118150. [Google Scholar] [CrossRef]
- Zhao, Z.; Li, G.; Sun, Y.; Li, N.; Zhang, Z.; Cheng, J.; Ma, C.; Hao, Z. The positive effect of water on acetaldehyde oxidation depended on the reaction temperature and MnO2 structure. Appl. Catal. B 2022, 303, 120886. [Google Scholar] [CrossRef]
- Zheng, X.; Zhang, G.; Yao, Z.; Zheng, Y.; Shen, L.; Liu, F.; Cao, Y.; Liang, S.; Xiao, Y.; Jiang, L. Engineering of crystal phase over porous MnO2 with 3D morphology for highly efficient elimination of H2S. J. Hazard. Mater. 2021, 411, 125180. [Google Scholar] [CrossRef]
- Zhu, G.; Zhu, J.; Jiang, W.; Zhang, Z.; Wang, J.; Zhu, Y.; Zhang, Q. Surface oxygen vacancy induced α-MnO2 nanofiber for highly efficient ozone elimination. Appl. Catal. B 2017, 209, 729–737. [Google Scholar] [CrossRef]
- Huang, N.; Qu, Z.; Dong, C.; Qin, Y.; Duan, X. Superior performance of α@β-MnO2 for the toluene oxidation: Active interface and oxygen vacancy. Appl. Catal. A 2018, 560, 195–205. [Google Scholar] [CrossRef]
- Yu, D.; Wang, L.; Zhang, C.; Peng, C.; Yu, X.; Fan, X.; Liu, B.; Li, K.; Li, Z.; Wei, Y.; et al. Alkali Metals and Cerium-Modified La-Co-Based Perovskite Catalysts: Facile Synthesis, Excellent Catalytic Performance, and Reaction Mechanisms for Soot Combustion. ACS Catal. 2022, 12, 15056–15075. [Google Scholar] [CrossRef]
- Guan, S.; Huang, Q.; Ma, J.; Li, W.; Ogunbiyi, A.T.; Zhou, Z.; Chen, K.; Zhang, Q. HCHO Removal by MnO2(x)-CeO2: Influence of the Synergistic Effect on the Catalytic Activity. Ind. Eng. Chem. R. 2020, 59, 596–608. [Google Scholar] [CrossRef]
- Chen, L.; Zhang, C.; Li, Y.; Chang, C.-R.; He, C.; Lu, Q.; Yu, Y.; Duan, P.; Zhang, Z.; Luque, R. Hierarchically Hollow MnO2@CeO2 Heterostructures for NO Oxidation: Remarkably Promoted Activity and SO2 Tolerance. ACS Catal. 2021, 11, 10988–10996. [Google Scholar] [CrossRef]
- Zheng, C.; Bao, S.; Mao, D.; Xu, Z.; Zheng, S. Insight into phase structure-dependent soot oxidation activity of K/MnO2 catalyst. J. Environ. Sci. 2023, 126, 668–682. [Google Scholar] [CrossRef]
- Wu, S.; Liu, H.; Huang, Z.; Xu, H.; Shen, W. O-vacancy-rich porous MnO2 nanosheets as highly efficient catalysts for propane catalytic oxidation. Appl. Catal. B 2022, 312, 121387. [Google Scholar] [CrossRef]
- Wan, J.; Zhou, L.; Deng, H.; Zhan, F.; Zhang, R. Oxidative degradation of sulfamethoxazole by different MnO2 nanocrystals in aqueous solution. J. Molecular Catal. A 2015, 407, 67–74. [Google Scholar] [CrossRef]
- Cheng, S.; Yang, L.; Chen, D.; Ji, X.; Jiang, Z.; Ding, D.; Liu, M. Phase evolution of an alpha MnO2-based electrode for pseudo-capacitors probed by in operando Raman spectroscopy. Nano Energy 2014, 9, 161–167. [Google Scholar] [CrossRef]
- Shan, C.; Zhang, Y.; Zhao, Q.; Fu, K.; Zheng, Y.; Han, R.; Liu, C.; Ji, N.; Wang, W.; Liu, Q. Acid Etching-Induced In Situ Growth of λ-MnO2 over CoMn Spinel for Low-Temperature Volatile Organic Compound Oxidation. Environ. Sci. Technol. 2022, 56, 10381–10390. [Google Scholar] [CrossRef]
- Chen, G.; Hong, D.; Xia, H.; Sun, W.; Shao, S.; Gong, B.; Wang, S.; Wu, J.; Wang, X.; Dai, Q. Amorphous and homogeneously Zr-doped MnOx with enhanced acid and redox properties for catalytic oxidation of 1,2-Dichloroethane. Chem. Eng. J. 2022, 428, 131067. [Google Scholar] [CrossRef]
- Wei, Y.J.; Yan, L.Y.; Wang, C.Z.; Xu, X.G.; Wu, F.; Chen, G. Effects of Ni Doping on [MnO6] Octahedron in LiMn2O4. J. Phy. Chem. B 2004, 108, 18547–18551. [Google Scholar] [CrossRef]
- Zhang, S.; Wang, H.; Si, H.; Jia, X.; Wang, Z.; Li, Q.; Kong, J.; Zhang, J. Novel Core–Shell (ε-MnO2/CeO2)@CeO2 Composite Catalyst with a Synergistic Effect for Efficient Formaldehyde Oxidation. ACS Appl. Mater. Inter. 2020, 12, 40285–40295. [Google Scholar] [CrossRef] [PubMed]
- Wu, P.; Dai, S.; Chen, G.; Zhao, S.; Xu, Z.; Fu, M.; Chen, P.; Chen, Q.; Jin, X.; Qiu, Y.; et al. Interfacial effects in hierarchically porous α-MnO2/Mn3O4 heterostructures promote photocatalytic oxidation activity. Appl. Catal. B 2020, 268, 118418. [Google Scholar] [CrossRef]
- Nawaz, F.; Cao, H.; Xie, Y.; Xiao, J.; Chen, Y.; Ghazi, Z.A. Selection of active phase of MnO2 for catalytic ozonation of 4-nitrophenol. Chemosphere 2017, 168, 1457–1466. [Google Scholar] [CrossRef] [PubMed]
- Ding, D.; Zhou, Y.; He, T.; Rong, S. Facet selectively exposed α-MnO2 for complete photocatalytic oxidation of carcinogenic HCHO at ambient temperature. Chem. Eng. J. 2022, 431, 133737. [Google Scholar] [CrossRef]
- Jia, J.; Zhang, P.; Chen, L. Catalytic decomposition of gaseous ozone over manganese dioxides with different crystal structures. Appl. Catal. B 2016, 189, 210–218. [Google Scholar] [CrossRef]
- Zhang, Y. Electronegativities of elements in valence states and their applications. 1. Electronegativities of elements in valence states. Inorg. Chem. 1982, 21, 3886–3889. [Google Scholar] [CrossRef]
- Liu, J.; Wang, H.; Wang, L.; Jian, P.; Yan, X. Phase-dependent catalytic performance of MnO2 for solvent-free oxidation of ethybenzene with molecular oxygen. Appl. Catal. B 2022, 305, 121050. [Google Scholar] [CrossRef]
- Wang, J.; Cheng, L.; An, W.; Xu, J.; Men, Y. Boosting soot combustion efficiencies over CuO-CeO2 catalysts with a 3DOM structure. Catal. Sci. Technol. 2016, 6, 7342–7350. [Google Scholar] [CrossRef]
- Liu, J.; Meng, R.; Li, J.; Jian, P.; Wang, L.; Jian, R. Achieving high-performance for catalytic epoxidation of styrene with uniform magnetically separable CoFe2O4 nanoparticles. Appl. Catal. B 2019, 254, 214–222. [Google Scholar] [CrossRef]
- He, T.; Shao, D.; Zeng, X.; Rong, S. Harvesting the vibration energy of α-MnO2 nanostructures for complete catalytic oxidation of carcinogenic airborne formaldehyde at ambient temperature. Chemosphere 2020, 261, 127778. [Google Scholar] [CrossRef] [PubMed]
- Setvín, M.; Aschauer, U.; Scheiber, P.; Li, Y.F.; Hou, W.; Schmid, M.; Selloni, A.; Diebold, U. Reaction of O2 with Subsurface Oxygen Vacancies on TiO2 Anatase (101). Science 2013, 341, 988–991. [Google Scholar] [CrossRef] [PubMed] [Green Version]
- Cao, X.; Lu, J.; Zheng, X.; He, D.; Zhu, W.; Zhao, Y.; Zhang, W.; Tian, R.; Luo, Y. Regulation of the reaction pathway to design the high sulfur/coke-tolerant Ce-based catalysts for decomposing sulfur-containing VOCs. Chem. Eng. J. 2022, 429, 132473. [Google Scholar] [CrossRef]


| Catalysts | Mn2+ (%) | Mn3+ (%) | Mn4+ (%) | Mn2+ + Mn3+/ Mn4+ (%) | AOS 1 |
|---|---|---|---|---|---|
| α-MnO2-Fresh | 11.31 | 30.31 | 58.38 | 0.71 | 3.57 |
| β-MnO2-Fresh | 2.71 | 35.04 | 62.26 | 0.6 | 3.75 |
| α-MnO2-Spent | 25.19 | 43.77 | 31.04 | 2.22 | 2.83 |
| β-MnO2-Spent | 16.39 | 46.99 | 36.62 | 1.99 | 3.25 |
| Catalysts | Oads | OH2O | Olatt | Oads/Olatt |
|---|---|---|---|---|
| α-MnO2-Fresh | 30.22 | 23.53 | 46.25 | 0.65 |
| β-MnO2-Fresh | 20.68 | 14.10 | 65.22 | 0.32 |
| α-MnO2-Spent | 55.20 | 18.39 | 26.41 | 2.09 |
| β-MnO2-Spent | 39.78 | 20.34 | 39.87 | 1.00 |
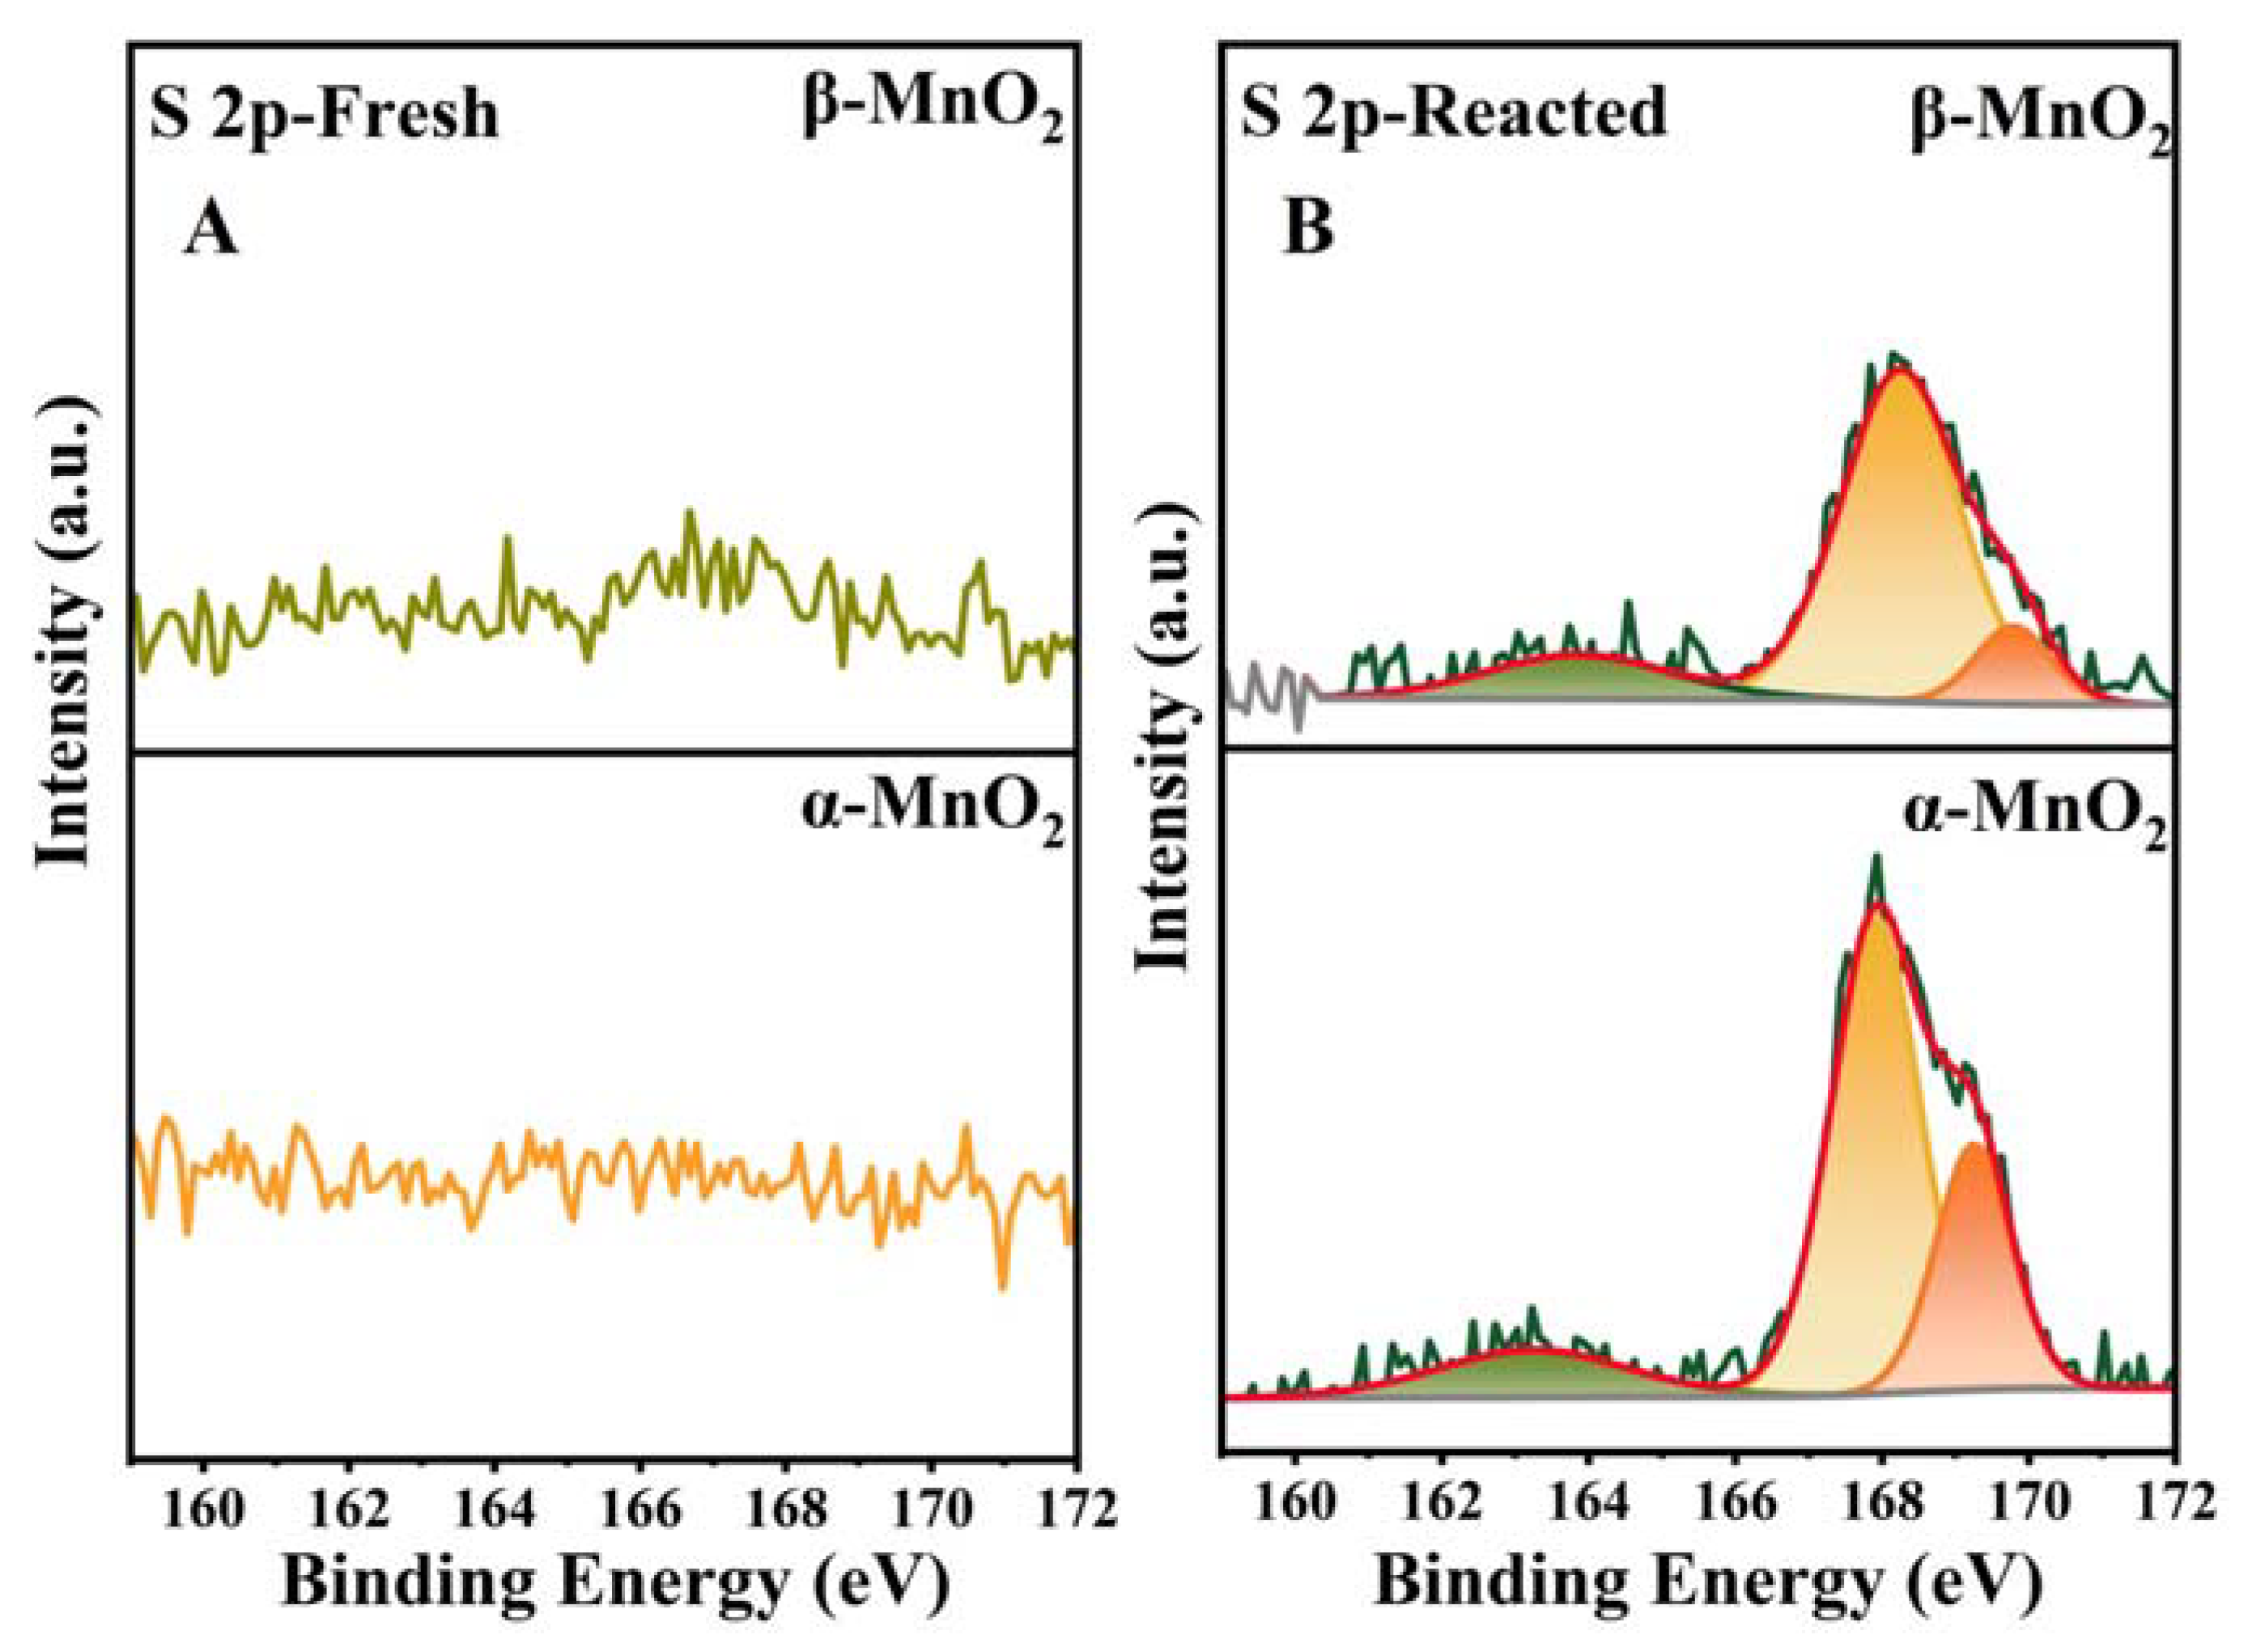
| Catalysts | S0 | S4+ | S6+ |
|---|---|---|---|
| α-MnO2-Fresh | 0 | 0 | 0 |
| β-MnO2-Fresh | 0 | 0 | 0 |
| α-MnO2-Spent | 12.96 | 60.73 | 26.31 |
| β-MnO2-Spent | 13.38 | 74.06 | 12,56 |
Disclaimer/Publisher’s Note: The statements, opinions and data contained in all publications are solely those of the individual author(s) and contributor(s) and not of MDPI and/or the editor(s). MDPI and/or the editor(s) disclaim responsibility for any injury to people or property resulting from any ideas, methods, instructions or products referred to in the content. |
© 2023 by the authors. Licensee MDPI, Basel, Switzerland. This article is an open access article distributed under the terms and conditions of the Creative Commons Attribution (CC BY) license (https://creativecommons.org/licenses/by/4.0/).
Share and Cite
Su, H.; Liu, J.; Hu, Y.; Ai, T.; Gong, C.; Lu, J.; Luo, Y. Comparative Study of α- and β-MnO2 on Methyl Mercaptan Decomposition: The Role of Oxygen Vacancies. Nanomaterials 2023, 13, 775. https://doi.org/10.3390/nano13040775
Su H, Liu J, Hu Y, Ai T, Gong C, Lu J, Luo Y. Comparative Study of α- and β-MnO2 on Methyl Mercaptan Decomposition: The Role of Oxygen Vacancies. Nanomaterials. 2023; 13(4):775. https://doi.org/10.3390/nano13040775
Chicago/Turabian StyleSu, Hong, Jiangping Liu, Yanan Hu, Tianhao Ai, Chenhao Gong, Jichang Lu, and Yongming Luo. 2023. "Comparative Study of α- and β-MnO2 on Methyl Mercaptan Decomposition: The Role of Oxygen Vacancies" Nanomaterials 13, no. 4: 775. https://doi.org/10.3390/nano13040775