

Effect of Measurement System Configuration and Operating Conditions on 2D Material-Based Gas Sensor Sensitivity
 , , , and
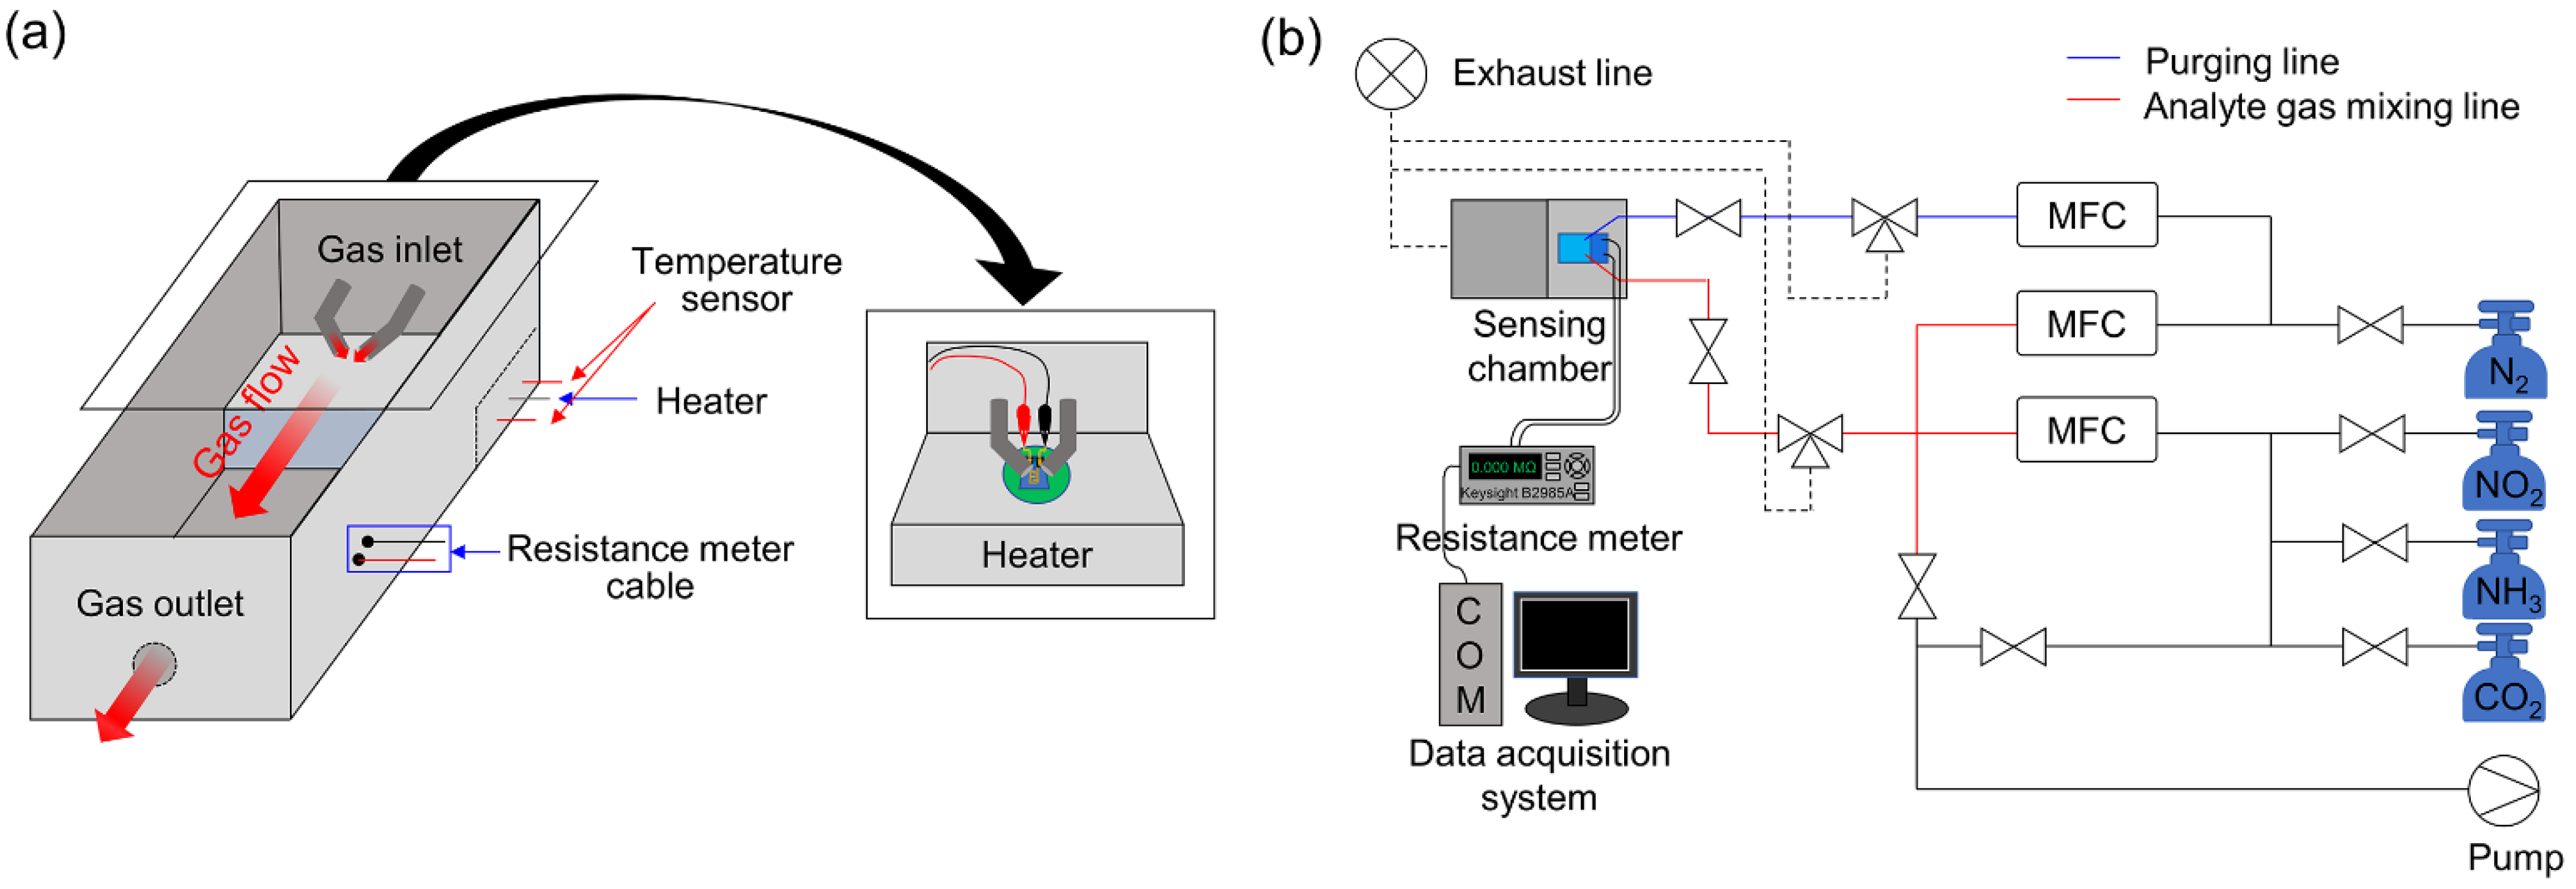
Abstract
:1. Introduction
2. Materials and Methods
2.1. Sensor Preparation
2.2. Materials Characterization
2.3. Experimental Setup
3. Results and Discussion
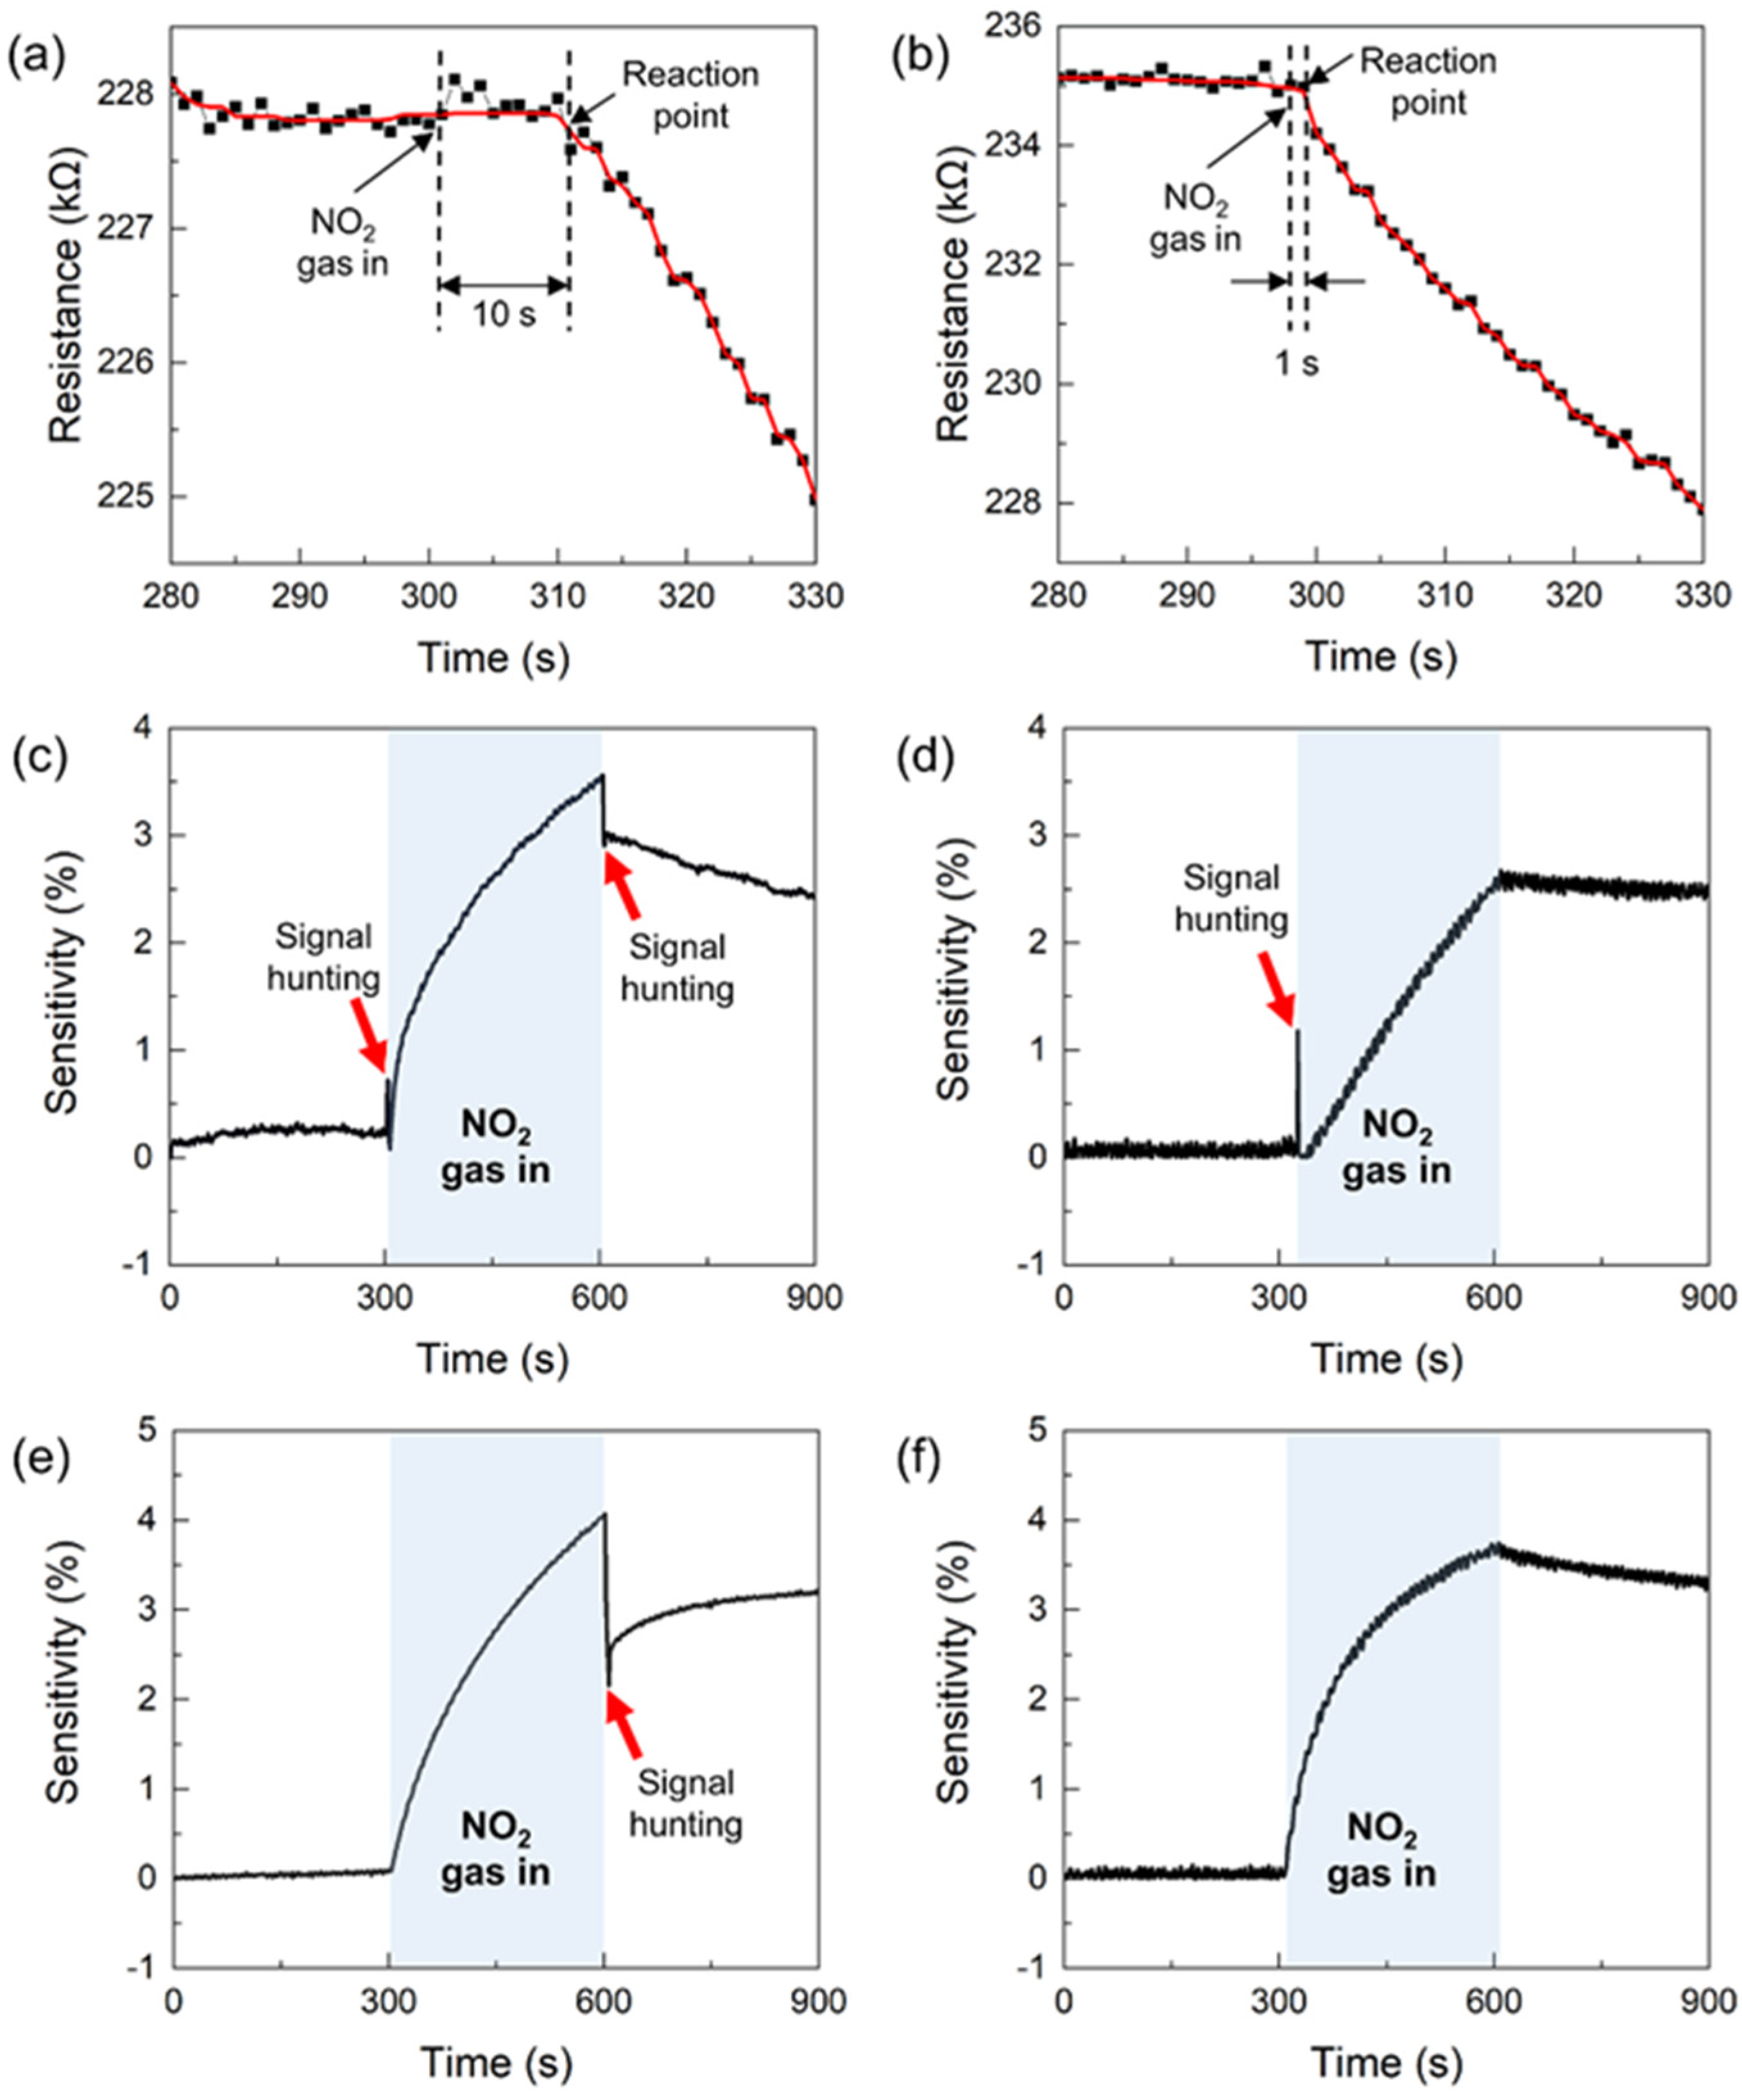
3.1. Effect of the System Configuration and Operating Sequence on Sensor Signal
3.2. Effect of the Gas Inlet Orientation and Distance to Sensor Surface on Sensitivity
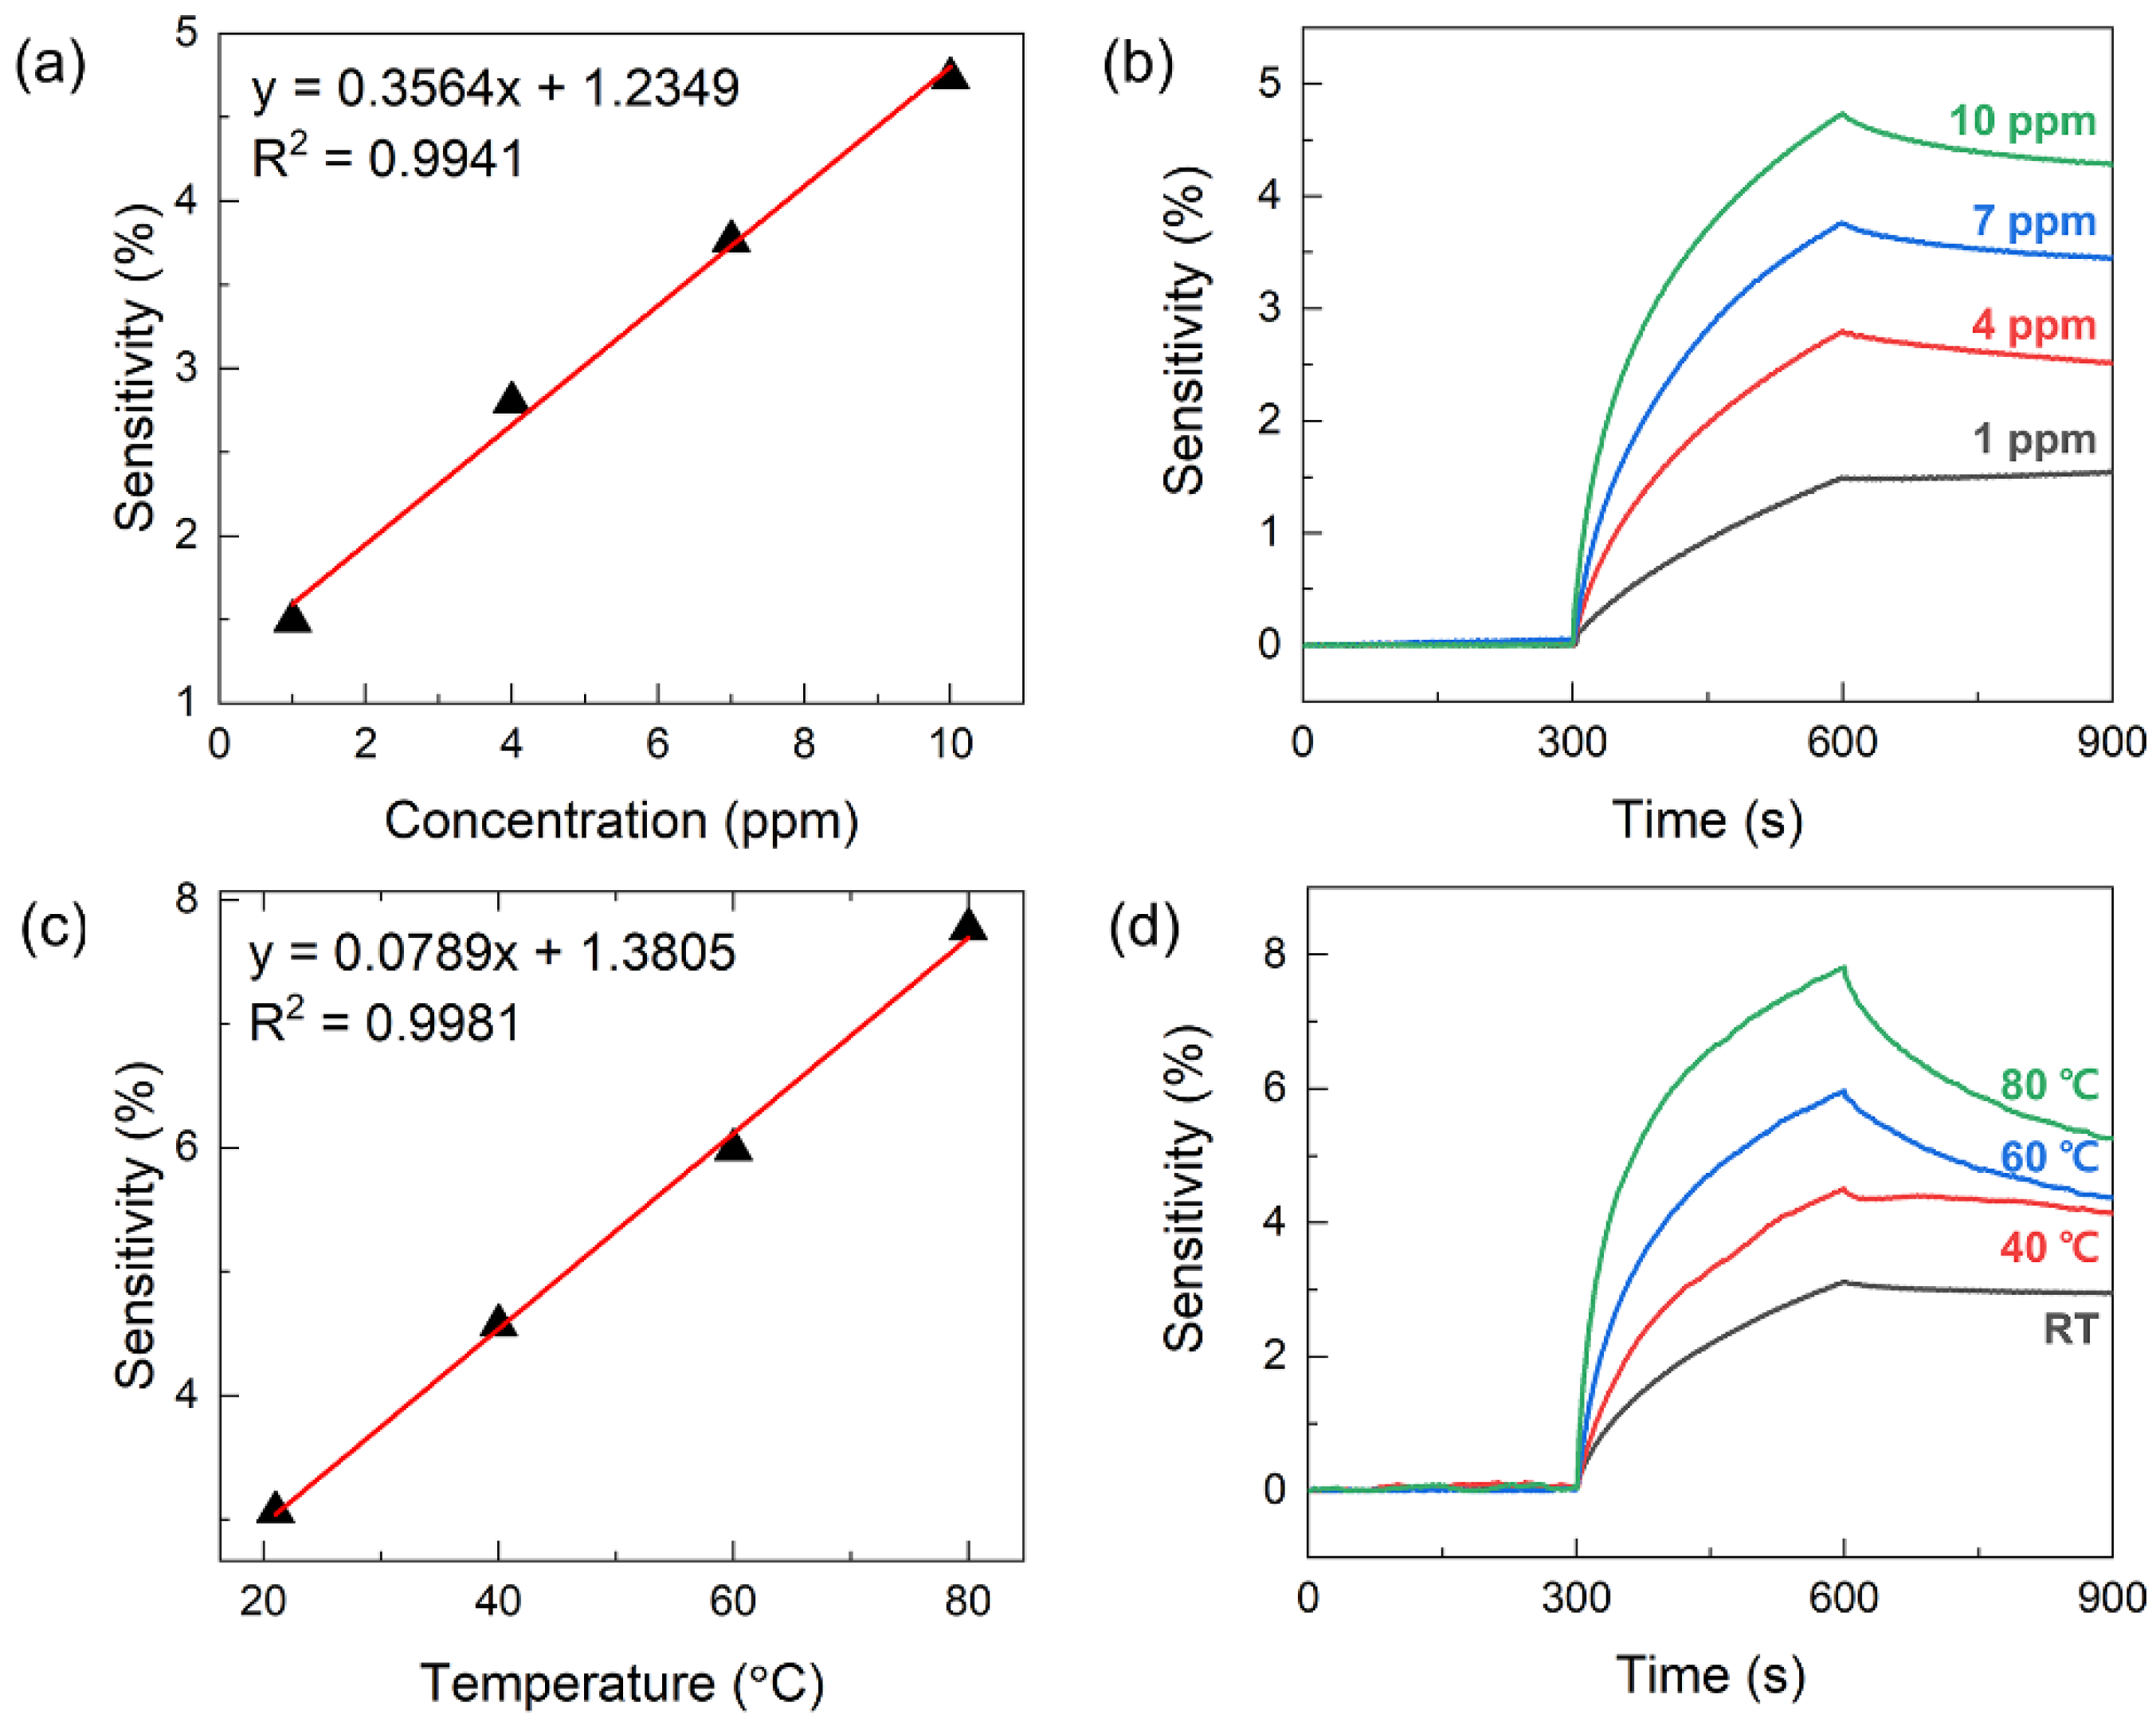
3.3. Effect of Gas Concentration and Temperature on Sensitivity
4. Conclusions
Supplementary Materials
Author Contributions
Funding
Institutional Review Board Statement
Data Availability Statement
Conflicts of Interest
References
- Ravikumar, A.P.; Wang, J.; Brandt, A.R. Are optical gas imaging technologies effective for methane leak detection? Environ. Sci. Technol. 2017, 1, 718–724. [Google Scholar] [CrossRef] [PubMed]
- Li, J.; Li, Y.; Huang, X.; Ren, J.; Feng, H.; Zhang, Y.; Yang, X. High-sensitivity gas leak detection sensor based on a compact microphone array. Measurement 2021, 174, 109017. [Google Scholar] [CrossRef]
- Morrison, S.R. Semiconductor gas sensors. Sens. Actuators 1981, 2, 329–341. [Google Scholar] [CrossRef]
- Kim, C.H.; Cho, I.T.; Shin, J.M.; Choi, K.B.; Lee, J.K.; Lee, J.H. A new gas sensor based on MOSFET having a horizontal floating-gate. IEEE Electron Device Lett. 2013, 35, 265–267. [Google Scholar]
- Fahad, H.M.; Shiraki, H.; Amani, M.; Zhang, C.; Hebbar, V.S.; Gao, W.; Ota, H.; Hettick, M.; Kiriya, D.; Chen, Y.Z.; et al. Room temperature multiplexed gas sensing using chemical-sensitive 3.5-nm-thin silicon transistors. Sci. Adv. 2017, 3, e1602557. [Google Scholar] [CrossRef] [Green Version]
- Ko, G.-J.; Han, S.D.; Kim, J.-K.; Zhu, J.; Han, W.B.; Chung, J.; Yang, S.M.; Cheng, H.; Kim, D.-H.; Kang, C.-Y.; et al. Biodegradable, flexible silicon nanomembrane-based NOx gas sensor system with record-high performance for transient environmental monitors and medical implants. NPG Asia Mater. 2020, 12, 71. [Google Scholar] [CrossRef]
- Liu, S.; Wang, Z.; Zhang, Y.; Zhang, C.; Zhang, T. High performance room temperature NO2 sensors based on reduced graphene oxide-multiwalled carbon nanotubes-tin oxide nanoparticles hybrids. Sens. Actuators B Chem. 2015, 211, 318–324. [Google Scholar] [CrossRef]
- Hong, Y.; Kim, C.H.; Shin, J.M.; Kim, K.Y.; Kim, J.S.; Hwang, C.S.; Lee, J.H. Highly selective ZnO gas sensor based on MOSFET having a horizontal floating-gate. Sens. Actuators B Chem. 2016, 232, 653–659. [Google Scholar] [CrossRef]
- Mirzaei, A.; Kim, S.S.; Kim, H.W. Resistance-based H2S gas sensors using metal oxide nanostructures: A review of recent advances. J. Hazard. Mater. 2018, 357, 314–331. [Google Scholar] [CrossRef]
- Kumar, S.; Pavelyev, V.; Mishra, P.; Tripathi, N.; Sharma, P.; Calle, F. A review on 2D transition metal di-chalcogenides and metal oxide nanostructures based NO2 gas sensors. Mater. Sci. Semicond. Process. 2020, 107, 104865. [Google Scholar] [CrossRef]
- Sui, X.; Hong, C.; Pang, W.; Chen, C. Unsymmetrical α-diimine palladium catalysts and their properties in olefin (co)polymerization. Mater. Chem. Front. 2017, 1, 967–972. [Google Scholar] [CrossRef]
- Karmakar, N.S.; Fernandes, R.P.; Jain, S.; Patil, U.V.; Shimpi, N.G.; Bhat, N.V.; Kothari, D.C. Room temperature NO2 gas sensing properties of p-toluenesulfonic acid doped silver-polypyrrole nanocomposite. Sens. Actuator B Chem. 2017, 242, 118–126. [Google Scholar] [CrossRef]
- Wang, Z.; Huang, L.; Zhu, X.; Zhou, X.; Chi, L. An ultra-sensitive organic semiconductor NO2 sensor based on crystalline TIPS-pentacene films. Adv. Mater. 2017, 29, 1703192. [Google Scholar] [CrossRef]
- Drewniak, S.; Drewniak, Ł.; Pustelny, T. Mechanisms of NO2 detection in hybrid structures containing reduced graphene oxide: A review. Sensors 2022, 22, 5316. [Google Scholar] [CrossRef] [PubMed]
- Fei, H.; Wu, G.; Cheng, W.Y.; Yan, W.; Xu, H.; Zhang, D.; Zhao, Y.; Lv, Y.; Chen, Y.; Zhang, L.; et al. Enhanced NO2 sensing at room temperature with graphene via monodisperse polystyrene bead decoration. ACS Omega 2019, 4, 3812–3819. [Google Scholar] [CrossRef] [PubMed] [Green Version]
- Kumar, S.; Meng, G.; Mishra, P.; Tripathi, N.; Bannov, A.G. A systematic review on 2D MoS2 for nitrogen dioxide (NO2) sensing at room temperature. Mater. Today Commun. 2022, 34, 105045. [Google Scholar] [CrossRef]
- Medina, H.; Li, J.-G.; Su, T.-Y.; Lan, Y.-W.; Lee, S.-H.; Chen, C.-W.; Chen, Y.-Z.; Manikandan, A.; Tsai, S.-H.; Navabi, A.; et al. Wafer-scale growth of WSe2 monolayers toward phase-engineered hybrid WOx/WSe2 films with sub-ppb NOx gas sensing by a low-temperature plasma-assisted selenization process. Chem. Mater. 2017, 29, 1587–1598. [Google Scholar] [CrossRef]
- Shim, Y.-S.; Kwon, K.C.; Suh, J.M.; Choi, K.S.; Song, Y.G.; Sohn, W.; Choi, S.; Hong, K.; Jeon, J.-M.; Hong, S.-P.; et al. Synthesis of numerous edge sites in MoS2 via SiO2 nanorods platform for highly sensitive gas sensor. ACS Appl. Mater. Interfaces 2018, 10, 31594–31602. [Google Scholar] [CrossRef]
- Lee, E.; Yoon, Y.S.; Kim, D.J. Two-dimensional transition metal dichalcogenides and metal oxide hybrids for gas sensing. ACS Sens. 2018, 3, 2045–2060. [Google Scholar] [CrossRef]
- Li, W.; Zhang, Y.; Long, X.; Cao, J.; Xin, X.; Guan, X.; Peng, J.; Zheng, X. Gas sensors based on mechanically exfoliated MoS2 nanosheets for room-temperature NO2 detection. Sensors 2019, 19, 2123. [Google Scholar] [CrossRef] [Green Version]
- Mirzaei, A.; Lee, J.-H.; Majhi, S.M.; Weber, M.; Bechelany, M.; Kim, H.W.; Kim, S.S. Resistive gas sensors based on metal-oxide nanowires. J. Appl. Phys. 2019, 126, 241102. [Google Scholar] [CrossRef]
- Shewale, P.S.; Yu, Y.S.; Kim, J.H.; Bobaded, C.R.; Uplane, M.D. H2S gas sensitive Sn-doped ZnO thin films: Synthesis and characterization. J. Anal. Appl. Pyrol. 2015, 112, 348–356. [Google Scholar] [CrossRef]
- Wang, Y.; Qu, F.; Liu, J.; Wang, Y.; Zhou, J.; Ruan, S. Enhanced H2S sensing characteristics of CuO-NiO core-shell microspheres sensors. Sens. Actuators B Chem. 2015, 209, 515–523. [Google Scholar] [CrossRef]
- Diao, K.; Zhou, M.; Zhang, J.; Tang, Y.; Wang, S.; Cui, X. High response to H2S gas with facile synthesized hierarchical ZnO microstructures. Sens. Actuators B Chem. 2015, 219, 30–37. [Google Scholar] [CrossRef]
- Guo, J.; Zhang, J.; Gong, H.; Ju, D.; Cao, B. Au nanoparticle-functionalized 3D SnO2 microstructures for high performance gas sensor. Sens. Actuators B Chem. 2016, 226, 266–272. [Google Scholar] [CrossRef]
- Moon, S.; Vuong, N.M.; Lee, D.; Kim, D.; Lee, H.; Kim, D.; Hong, S.K.; Yoon, S.G. Co3O4–SWCNT composites for H2S gas sensor application. Sens. Actuators B Chem. 2016, 222, 166–172. [Google Scholar] [CrossRef]
- Kim, J.H.; Zheng, Y.; Mirzaei, A.; Kim, H.W.; Kim, S.S. Synthesis and selective sensing properties of rGO/metal-coloaded SnO2 nanofibers. J. Electr. Mater. 2017, 46, 3531–3541. [Google Scholar] [CrossRef]
- Choi, M.S.; Bang, J.H.; Mirzaei, A.; Na, H.G.; Kwon, Y.J.; Kang, S.Y.; Choi, S.W.; Kim, S.S.; Kim, H.W. Dual sensitization of MWCNTs by co-decoration with p-and n-type metal oxide nanoparticles. Sens. Actuators B Chem. 2018, 264, 150–163. [Google Scholar] [CrossRef]
- Sedlák, P.; Kuberský, P.; Skarvada, P.; Hamacek, A.; Sedlakova, V.; Majzner, J.; Nespurek, S.; Sikula, J. Current fluctuation measurements of amperometric gas sensors constructed with three different technology procedures. Metrol. Meas. Syst. 2016, 23, 531–543. [Google Scholar] [CrossRef]
- Annanouch, F.-E.; Bouchet, G.; Perrier, P.; Morati, N.; Reynard-Carette, C.; Aguir, K.; Bendahan, M. How the chamber design can affect gas sensor responses. Proceedings 2018, 2, 820. [Google Scholar]
- Sedlák, P.; Kuberský, P.; Mívalt, F. Effect of various flow rate on current fluctuations of amperometric gas sensors. Sens. Actuators B Chem. 2019, 283, 321–328. [Google Scholar] [CrossRef]
- Lopez, L., Jr.; Copa, V.C.; Hayasaka, T.; Faustino-Lopez, M.A.; Wu, Y.; Liu, H.; Liu, Y.; Estacio, E.; Somintac, A.; Lin, L.; et al. Influence of chamber design on the gas sensing performance of graphene field-effect-transistor. SN Appl. Sci. 2020, 2, 1185. [Google Scholar] [CrossRef]
- Sedlák, P.; Kuberský, P. The effect of the orientation towards analyte flow on electrochemical sensor performance and current fluctuations. Sensors 2020, 20, 1038. [Google Scholar] [CrossRef] [PubMed] [Green Version]
- Endres, H.-E.; Jander, H.D.; Göttler, W. A test system for gas sensors. Sens. Actuators B Chem. 1995, 23, 163–172. [Google Scholar] [CrossRef]
- Park, J.; Park, H.; Park, S.; Thuy, N.T.; Mun, J.; Kim, J.O.; Lee, S.J.; Ku, Z.; Kang, S.W. S/Mo ratio and petal size controlled MoS2 nanoflowers with low temperature metal organic chemical vapor deposition and their application in solar cells. Nanotechnology 2021, 32, 195206. [Google Scholar] [CrossRef]
- Park, J.; Mun, J.; Shin, J.S.; Kang, S.W. Highly sensitive two-dimensional MoS2 gas sensor decorated with Pt nanoparticles. R. Soc. Open Sci. 2018, 5, 181462. [Google Scholar] [CrossRef] [Green Version]
- Oluwasanya, P.W.; Carey, T.; Samad, Y.A.; Occhipinti, L.G. Unencapsulated and washable two-dimensional material electronic-textile for NO2 sensing in ambient air. Sci. Rep. 2022, 12, 12288. [Google Scholar] [CrossRef]
- Kim, Y.; Kim, T.; Lee, J.; Choi, Y.S.; Moon, J.; Park, S.Y.; Lee, T.H.; Park, H.K.; Lee, S.A.; Kwon, M.S.; et al. Tailored Graphene Micropatterns by Wafer-Scale Direct Transfer for Flexible Chemical Sensor Platform. Adv. Mater. 2021, 33, 2004827. [Google Scholar] [CrossRef] [PubMed]
- Li, Z.; Liu, Y.; Hossain, O.; Paul, R.; Yao, S.; Wu, S.; Ristaino, J.B.; Zhu, Y.; Wei, Q. Real-time monitoring of plant stresses via chemiresistive profiling of leaf volatiles by a wearable sensor. Matter 2021, 4, 2553–2570. [Google Scholar] [CrossRef]
- Xie, T.; Xie, G.; Su, Y.; Hongfei, D.; Ye, Z.; Jiang, Y. Ammonia gas sensors based on poly (3-hexylthiophene)-molybdenum disulfide film transistors. Nanotechnology 2016, 27, 065502. [Google Scholar] [CrossRef]
- Boontum, A.; Phokharatkul, D.; Hodak, J.H.; Wisitsoraat, A.; Hodak, S.K. H2S sensing characteristics of Ni-doped CaCu3Ti4O12 films synthesized by a sol-gel method. Sens. Actuators B Chem. 2018, 260, 877–887. [Google Scholar] [CrossRef]
- Nakate, U.T.; Lee, G.H.; Ahmad, R.; Patil, P.; Bhopate, D.P.; Hahn, Y.B.; Yu, Y.T.; Suh, E.-K. Hydrothermal synthesis of p-type nanocrystalline NiO nanoplates for high response and low concentration hydrogen gas sensor application. Ceram. Int. 2018, 44, 15721–15729. [Google Scholar] [CrossRef]
- Habib, I.Y.; Tajuddin, A.A.; Noor, H.A.; Lim, C.M.; Mahadi, A.H.; Kumara, N.T.R.N. Enhanced carbon monoxide-sensing properties of chromium-doped ZnO nanostructures. Sci. Rep. 2019, 9, 9207. [Google Scholar] [CrossRef] [PubMed] [Green Version]
- Ashkavand, Z.; Sadeghi, E.; Parvizi, R.; Zare, M. Developed low-temperature anionic 2H-MoS2/Au sensing layer coated optical fiber gas sensor. ACS Appl. Mater. Interfaces 2020, 12, 34283–34296. [Google Scholar] [CrossRef] [PubMed]
- Cho, B.; Hahm, M.G.; Choi, M.; Yoon, J.; Kim, A.R.; Lee, Y.-J.; Park, S.-G.; Kwon, J.-D.; Kim, C.S.; Song, M.; et al. Charge-transfer-based gas sensing using atomic-layer MoS2. Sci. Rep. 2015, 5, 8052. [Google Scholar] [CrossRef] [PubMed] [Green Version]
- Yu, L.; Guo, F.; Liu, S.; Qi, J.; Yin, M.; Yang, B.; Liu, Z.; Fan, X.H. Hierarchical 3D flower-like MoS2 spheres: Post-thermal treatment in vacuum and their NO2 sensing properties. Mater. Lett. 2016, 183, 122–126. [Google Scholar] [CrossRef]


Disclaimer/Publisher’s Note: The statements, opinions and data contained in all publications are solely those of the individual author(s) and contributor(s) and not of MDPI and/or the editor(s). MDPI and/or the editor(s) disclaim responsibility for any injury to people or property resulting from any ideas, methods, instructions or products referred to in the content. |
© 2023 by the authors. Licensee MDPI, Basel, Switzerland. This article is an open access article distributed under the terms and conditions of the Creative Commons Attribution (CC BY) license (https://creativecommons.org/licenses/by/4.0/).
Share and Cite
Ryu, J.; Shim, S.; Song, J.; Park, J.; Kim, H.S.; Lee, S.-K.; Shin, J.C.; Mun, J.; Kang, S.-W. Effect of Measurement System Configuration and Operating Conditions on 2D Material-Based Gas Sensor Sensitivity. Nanomaterials 2023, 13, 573. https://doi.org/10.3390/nano13030573
Ryu J, Shim S, Song J, Park J, Kim HS, Lee S-K, Shin JC, Mun J, Kang S-W. Effect of Measurement System Configuration and Operating Conditions on 2D Material-Based Gas Sensor Sensitivity. Nanomaterials. 2023; 13(3):573. https://doi.org/10.3390/nano13030573
Chicago/Turabian StyleRyu, Jongwon, Seob Shim, Jeongin Song, Jaeseo Park, Ha Sul Kim, Seoung-Ki Lee, Jae Cheol Shin, Jihun Mun, and Sang-Woo Kang. 2023. "Effect of Measurement System Configuration and Operating Conditions on 2D Material-Based Gas Sensor Sensitivity" Nanomaterials 13, no. 3: 573. https://doi.org/10.3390/nano13030573