3.1. The Morphology of Supported ZnO Nanosheet Arrays
To demonstrate the morphologic features of as-fabricated arrays and evaluate hydrothermal temperature effects, the surface morphology analysis of supported ZnO nanosheet arrays grown at various hydrothermal temperatures was carried out through the FE-SEM technique, and the results are represented in
Figure 1.
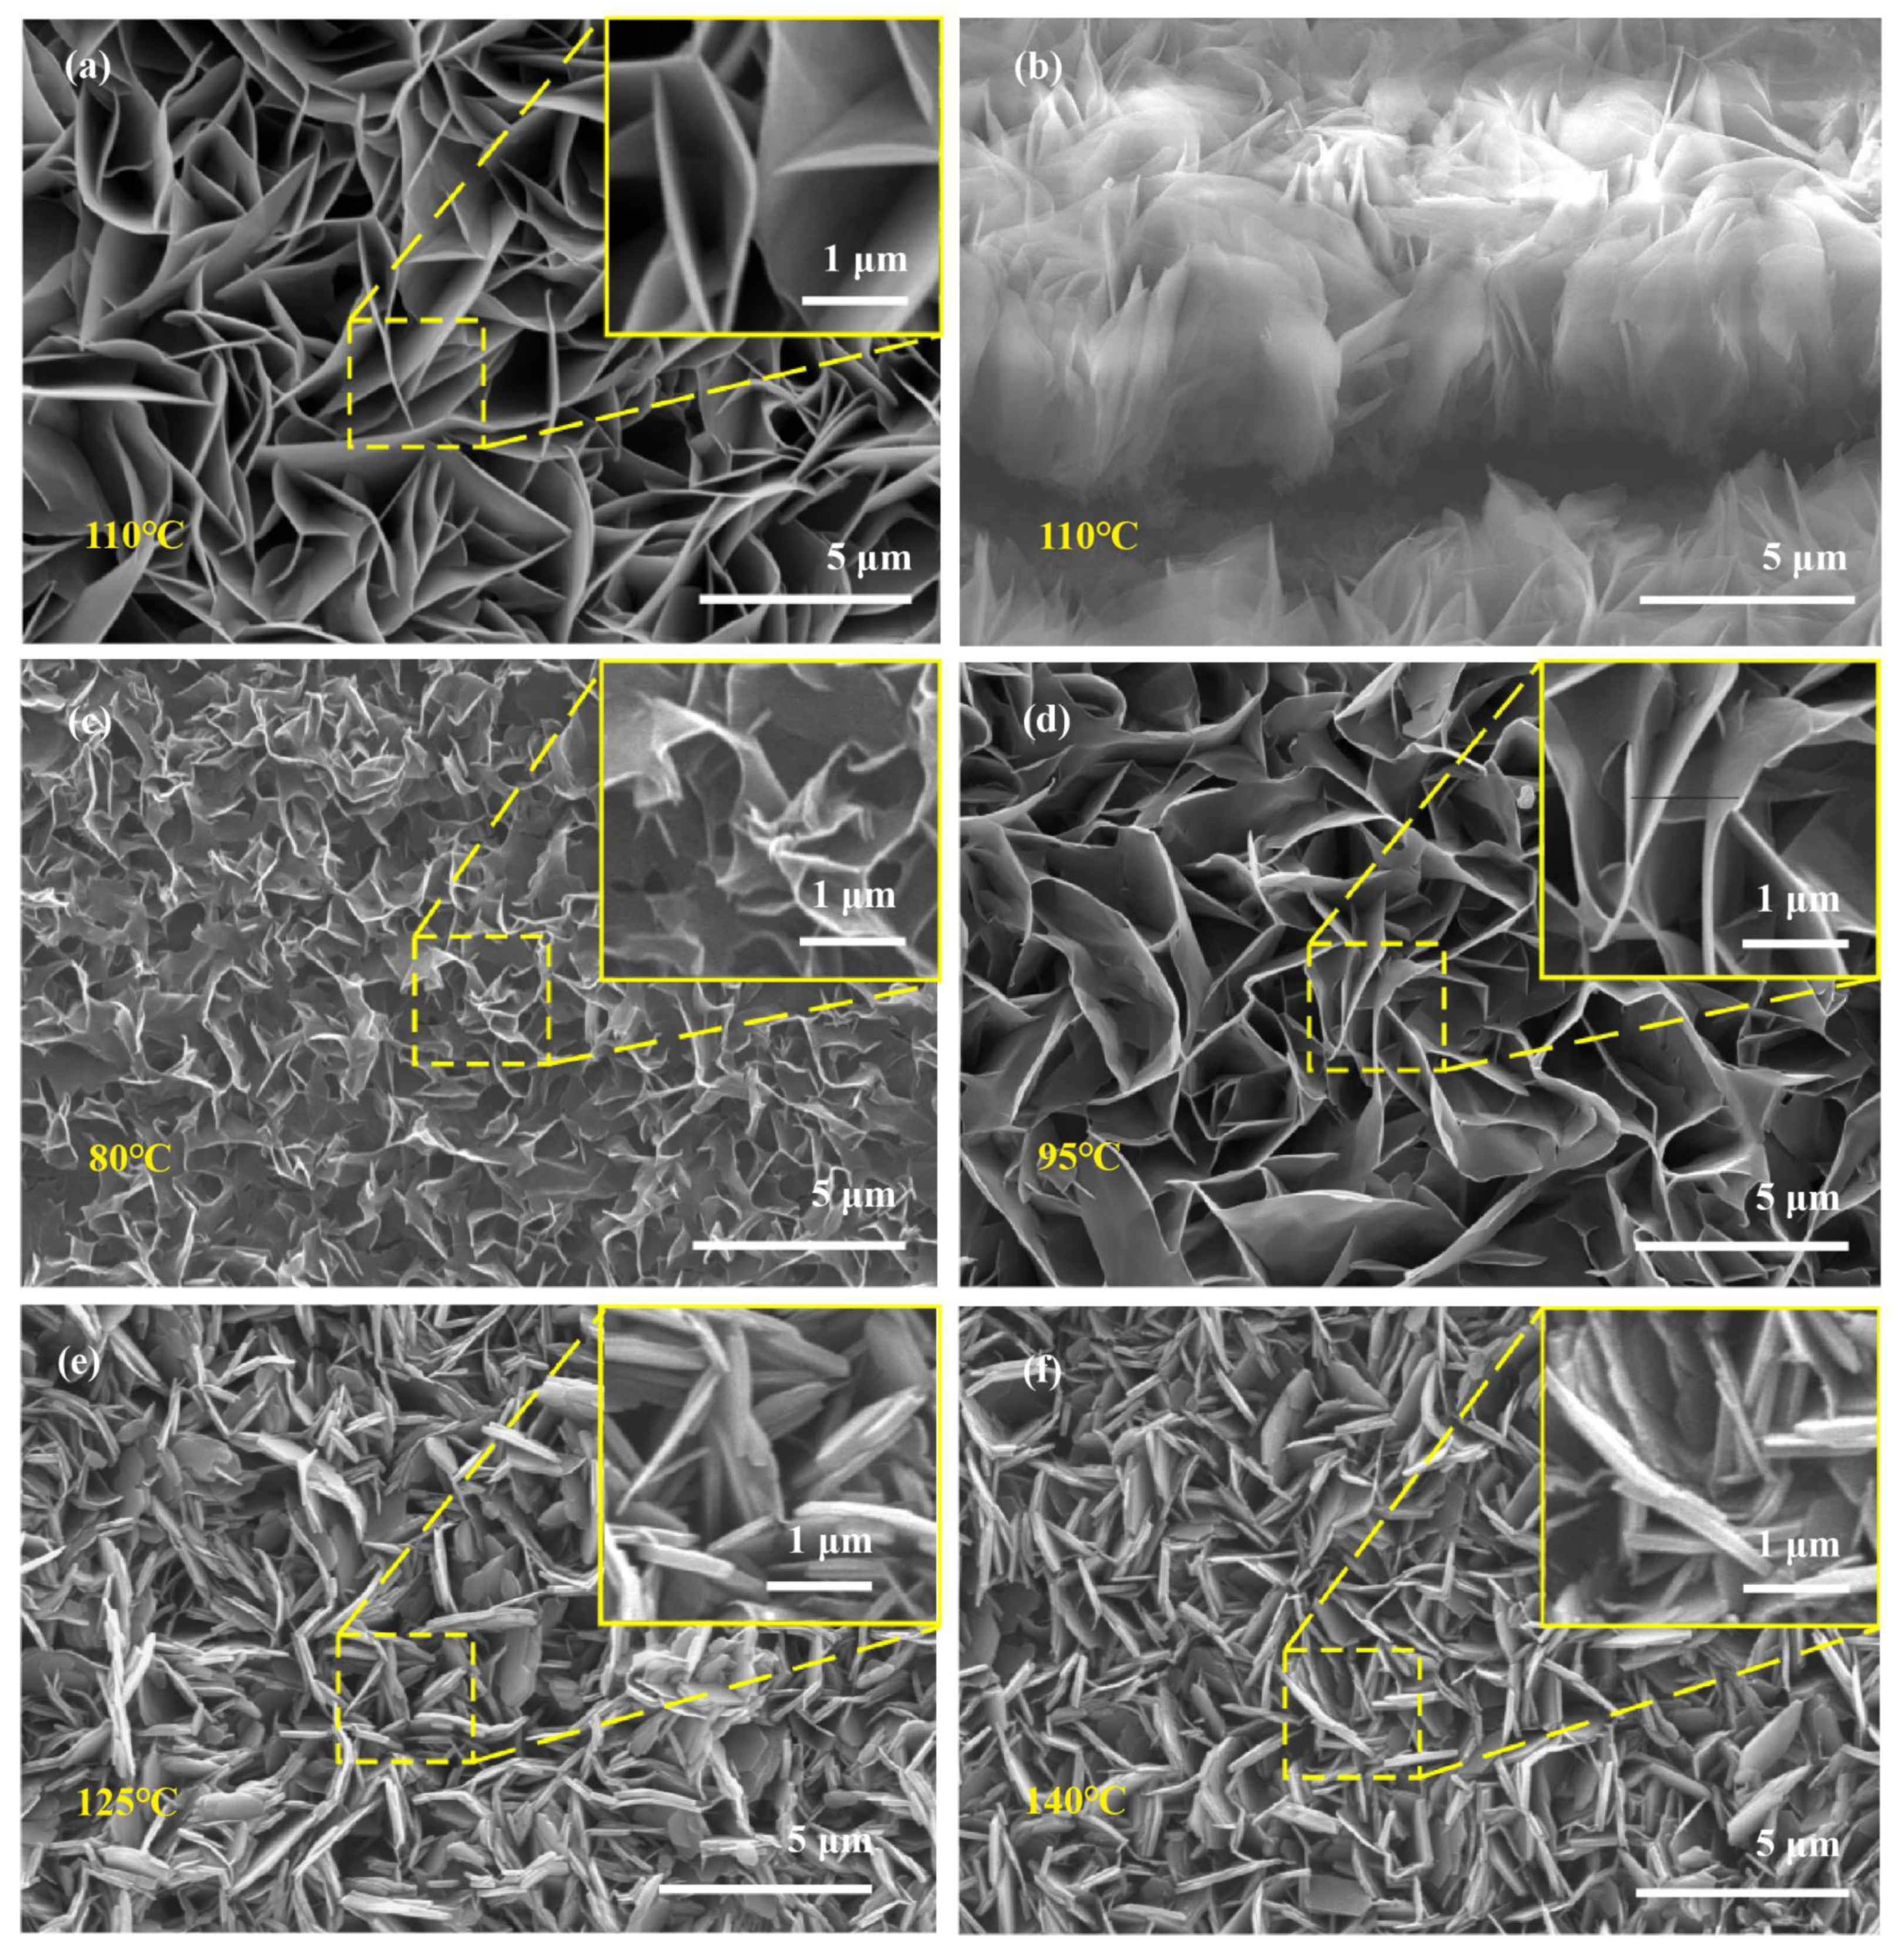
Figure 1a,b show the top-view and oblique-view SEM diagrams of the supported nanosheet arrays grown at 110 °C, respectively. The inset figures show the enlarged FE-SEM images of the corresponding supported ZnO nanosheet arrays. As illustrated in
Figure 1a, as-prepared and supported nanosheet arrays are covered with dense and uniform sheet-like nanostructures. From the inset of
Figure 1a, these sheet-like nanostructures are on a micron-scale, and the thickness is at the nanoscale. These nanosheets are widespread over the whole substrate, as shown in the large-scale SEM images (
Figure S1) at low magnifications. As pointed out in the literature [
16], these two-dimensional planar nanosheets can provide more catalytically active sites at the edge and plane of nanosheets along with the facile separation and transport of photogenerated electron–hole pairs, leading to the improvement of photocatalytic reaction kinetics. It was further found that these sheet-like nanostructures are vertically grown on the substrate, as shown in
Figure 1b. Compared to the horizontally aligned nanosheet arrays, the vertically aligned nanosheet array could avoid the overlap between the nanosheets and have more potential to enhance the catalytically active redox reactions.
Figure 1c–f shows the hydrothermal temperature effects on the morphology of supported ZnO nanosheet arrays grown at 80 °C, 95 °C, 125 °C, and 140 °C, respectively. As illustrated in
Figure 1c–f, the fabricated arrays were grown at various hydrothermal temperatures and show similar nanosheet array morphological characteristics. However, the influences of the hydrothermal temperature on the size and thickness of the supported nanosheet are also clearly observed from the inset of
Figure 1c–f. At 80 °C, the supported nanosheet begins to form but is not complete (
Figure 1c). At 95 °C, the fabricated array exhibits significant sheet-like characteristics, and the size of the nanosheet is remarkably larger than 80 °C (
Figure 1d). At 125 °C and 140 °C, the supported nanosheet arrays become further thickened and even stacked together (
Figure 1e,f).
In order to quantitatively reveal the morphological changes of fabricated ZnO nanosheet arrays with different hydrothermal temperatures, the specific surface areas of ZnO nanosheet arrays and the nanosheets’ thickness variation analysis were carried out, and the results are listed in
Table 1. The specific surface areas of the ZnO nanosheet arrays were evaluated by a multipoint BET method, and the corresponding N
2 adsorption/desorption isotherm at 77 K of the samples grown at different hydrothermal temperatures are shown in
Figure S2. From
Figure S2 and the subsequent description, the specific surface areas are shown to simultaneously increase alongside the increase in hydrothermal temperatures. These results indicate that the overall adsorption abilities of the ZnO nanosheet array for pollutants photodegradation is enhanced and may improve photodegradation activity. On the other hand, the thicknesses of the supported nanosheet arrays grown at various hydrothermal temperatures were comprehensively measured with imageJ software, and the thicknesses data were fitted with the Gaussian model. The statistical fitting curves and methodology details are shown in
Figure S3 and the subsequent description. From
Figure S3 and the subsequent description, the average thicknesses of the nanosheets are shown as gradually becoming larger with the increase in hydrothermal temperature. The average thickness of ZnO nanosheet arrays grown at 140 °C was four times thicker than that of ZnO nanosheet arrays grown at 80 °C. It can be predicted that these variations of the zno nanosheet arrays’ specific surface area and nanosheets’ thickness with the increase in hydrothermal temperature may greatly affect the photodegradation performance of ZnO nanosheet arrays.
3.2. Structural Characteristics of Supported ZnO Nanosheet Arrays
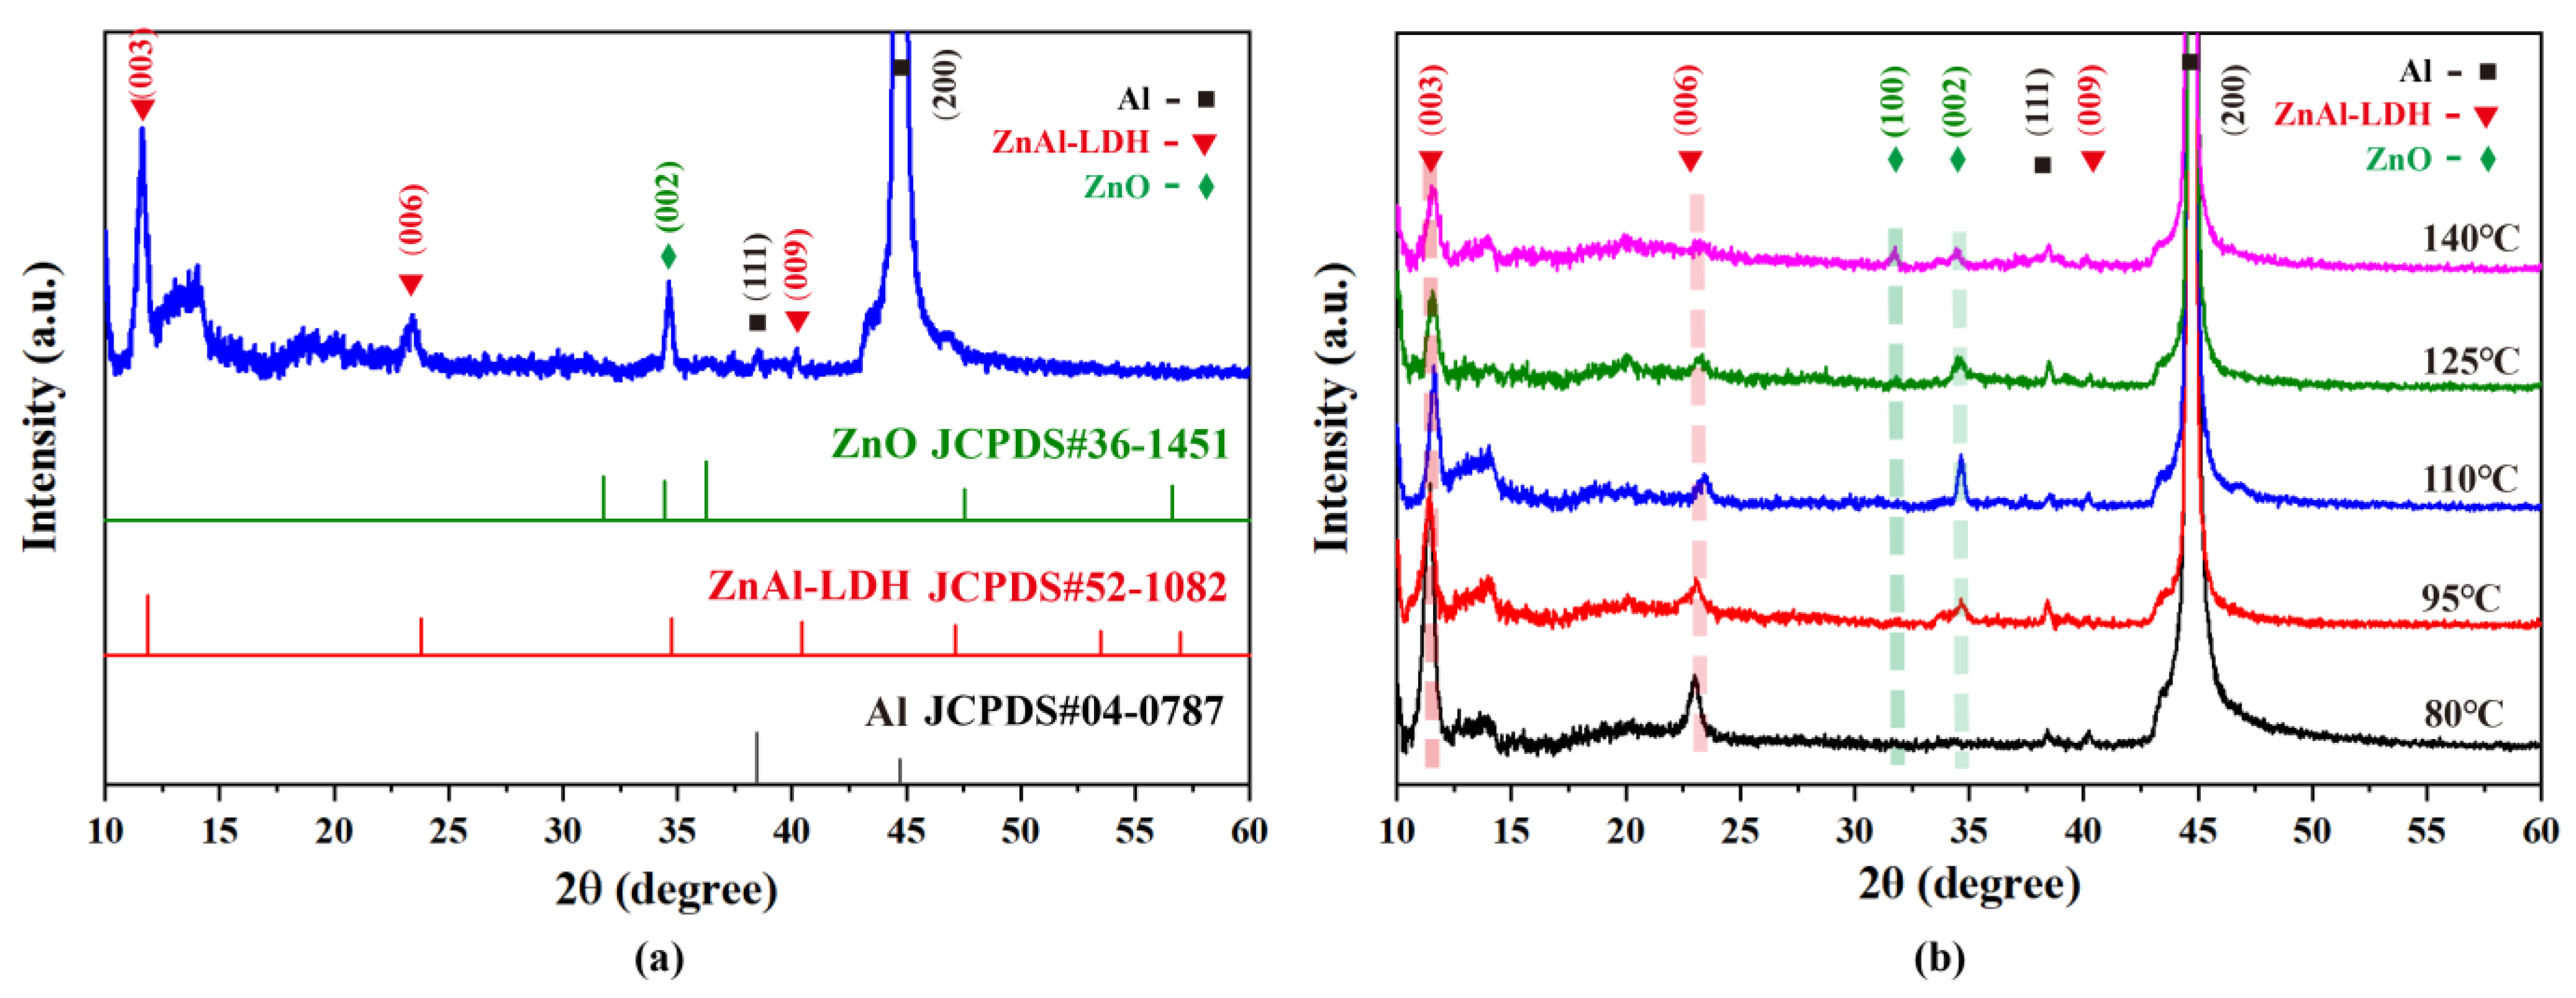
Figure 2 shows the XRD patterns of fabricated nanosheet arrays grown at 110 °C and other hydrothermal temperatures. As depicted in
Figure 3a, the intense diffraction peaks represented by black square at 38.4° and 44.7°correspond to the (111) and (200) planes of the Aluminum substrate (JCPDS 04-0877). The diffraction peak represented by the olive diamond at 34.5°corresponds to the (002) plane of ZnO (JCPDS 36-1451), confirming the formation of ZnO. Meanwhile, no other orientated peak corresponding to the crystallographic plane of ZnO was observed, suggesting that ZnO grew preferentially along the C axis and was perpendicular to the substrate. The additional diffraction peak represented by the red inverted triangle at 11.6°, 23.6°, and 39.4° corresponds to the (003), (006), and (009) planes of ZnAl-LDH (JCPDS 52-1082), confirming the formation ZnAl-LDH at the interface of the ZnO nanosheet arrays and Aluminum substrate, as generally reported in the literature [
17]. Comparative XRD studies of supported nanosheet arrays grown at various hydrothermal temperatures in
Figure 3b reveal the hydrothermal temperature effects on the structural characteristics of supported ZnO nanosheet arrays. It is clear that with increasing hydrothermal temperature, the intensities of the diffraction peaks corresponding to ZnAl-LDH continuously decrease while the intensities of diffraction peaks corresponding to ZnO increase, indicating that a higher hydrothermal temperature is conducive to the fast formation of ZnO nanosheet arrays. Moreover, the intensity variations of diffraction peaks corresponding to (002) and (100) for ZnO suggest the growth process of ZnO nanosheet arrays. When the hydrothermal temperatures increase from 80 °C to 110 °C, the (002) peak’ intensity gradually increases, suggesting the nanosheet radial growth that is perpendicular to the substrate and resulting in the increment of the nanosheet area. When the hydrothermal temperatures increase from 110 °C to 140 °C, the (100) peak’ intensity becomes obvious, suggesting that the nanosheet axial growth was parallel to the substrate and resulting in the increment of nanosheet thickness. These results from XRD analysis are in agreement with the aforementioned morphological analysis.
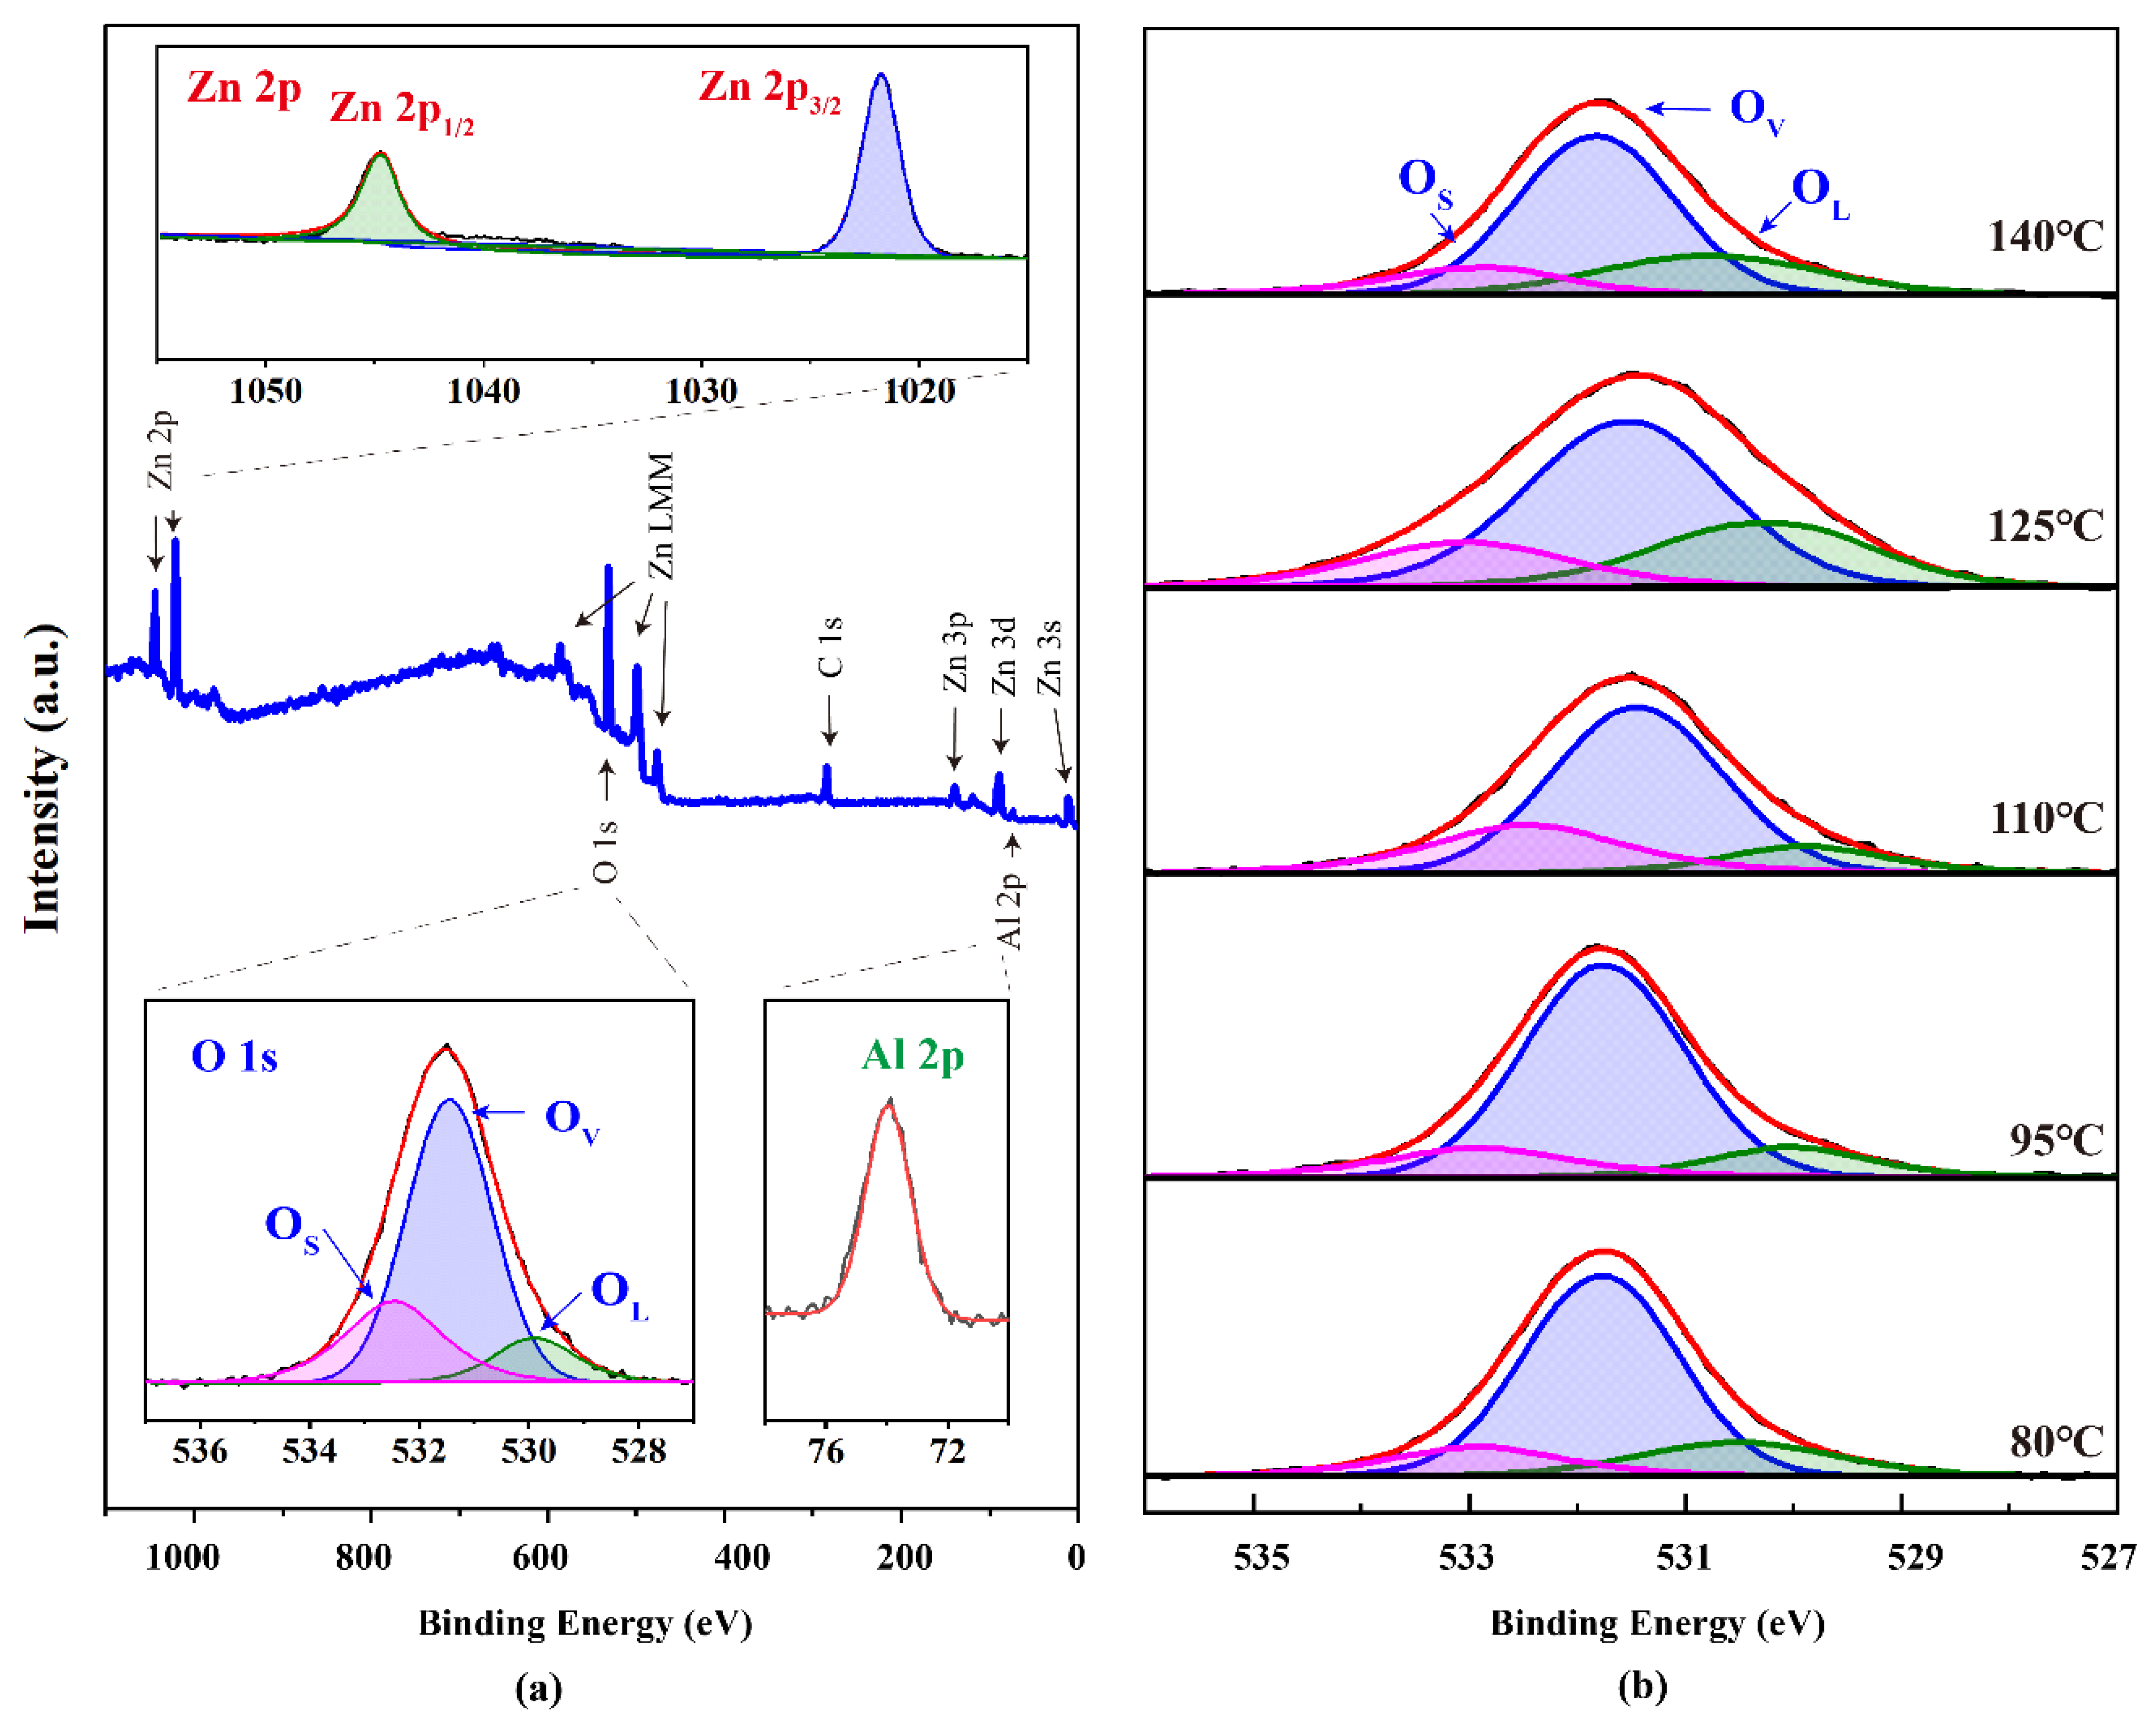
The composition and elemental states of various ions present in as-fabricated supported ZnO nanosheet arrays were identified by XPS analysis.
Figure 3a demonstrates the XPS spectrum of supported ZnO nanosheet arrays grown at 110 °C. Major spectral lines and auger lines in the survey XPS spectrum (
Figure 3a) are labeled [
18,
19], which indicates that the sample was composed of Zn, O, and Al. A weak C 1s emission peak can be observed in the spectrum, which results from the sample holder and adventitious carbon present on the essential sample surfaces exposed to the environmental air. No peaks of other elements can be observed. From the wide scan of the XPS spectrum in
Figure 3a, it can be seen that the XPS spectrum exhibits two apparent peaks related to Zn 2p, and O 1s, indicating that the main components of the nanosheet array are Zn and O elements. Meanwhile, the delicate peak appearing at the 74 eV related to Al 2p suggests the presence of trace Al elements. To provide more details of the composition and elemental states, the narrow scans of these characteristic peaks were analyzed by peak fitting and separation. For the narrow scan of Zn 2p, Zn 2p
1/2 and Zn 2p
3/2 peaks are located at 1044.7 and 1021.5 eV. The spin-orbit splitting between the two peaks is 23.2 eV, indicating a Zn
2+ oxidation state in the ZnO wurzite lattice [
20]. For the narrow scan of Al 2p, the symmetrical peak of Al 2p is located around 74.0 eV, suggesting that Al
3+ ions formed Al–O bonds. Furthermore, as shown in the narrow scan of O 1s, three fitted peaks at 532.3 eV (O
S), 531.3 eV (O
V), and 529.7 eV (O
L) are found and relate to oxygen adsorption and loosely bound oxygen (OH), oxygen vacancies in ZnO and Al–O bonds, and the lattice oxygen in the ZnO wurzite, respectively [
21].
Figure 3b represents variations of the O 1s narrow scan with different hydrothermal temperatures. An increment in the proportion of O
L-fitted peaks can be clearly seen with increasing hydrothermal temperatures and indicates the formation of ZnO wurzite. In addition, the proportion of the O
L-fitted peak grown at 110 °C achieved a maximum value, suggesting the strongest adsorption of oxygen and OH (H
2O) on the surface. In addition, as can be seen from
Figure S4, the binding energy of Al 2p and Zn 2p is almost unchanged with increasing hydrothermal temperature. However, the ratio of them becomes smaller, which indicates that the proportion of zinc element gradually increased, while the proportion of the aluminum element gradually decreased.
3.3. Growth and Hydrothermal Temperature Effect Mechanism of Supported ZnO Nanosheet Array
It is well known that ZnO often crystallizes as a wurzite structure with two polar charged surface planes: the chemically active
terminated (0001) plane and the inert O
2− terminated (000-1) surface. In the literature, the growth mechanism of the ZnO nanorod array [
20] is reported; the
ion provided by the HMTA is attracted to the terminated (0001) plane and combines with
to form the
ion. It eventually grows into ZnO and H
2O and results in the growth of ZnO nanorods. However, the growth mechanism of ZnO nanosheet arrays becomes different in the presence of the Al substrate. As known, HMTA produces
ions and creates a hydrolysis process. Under alkaline conditions, Al can be oxidized and dissolved into the solution to form
. In the vicinity of the substrate, due to the high concentration of
and
, the proportion of zinc and aluminum are met, and thus, the nucleation and growth of ZnAL LDH are generated on the Al substrate. For a certain distance from the substrate, the certain proportion of zinc and aluminum is no longer met due to the decrease in the concentration of aluminum ions and ZnAl LDH, which is no longer formed. Instead, ZnO starts to nucleate. Because
could presumably bind to the positively charged
terminated (0001) surface and inhibit the growth along the [0001] direction, 2D radial growth is achieved to form vertically aligned ZnO nanosheet arrays.
Considering the effect of hydrothermal temperature on the reaction kinetics and
ions released from HMTA, the possible roles that hydrothermal temperature play on the morphology of the supported nanosheet array are discussed in two aspects. As the hydrothermal temperature increases, the supersaturation level in the growth solution is higher, resulting in the increase of nucleation and growth rates and, thus, ZnO nanosheet rapid growth. On the other hand, the increase in hydrothermal temperature benefits the
ions released from HMTA. When the hydrothermal temperature is low,
ion release from HMTA is slow, and not enough
ions are released for the nucleation of ZnO. In this case, the growth of ZnO is restrained and incomplete, as shown in
Figure 1c. As the hydrothermal temperature increases, the release rates of
ions from HMTA are speeded up, and the concentration of
ions produced by HMTA rise, and more ZnO nucleation begins to form. Owing to the Al substrate hydrolysis under alkaline conditions
combines with
to generate
bonds that are stronger to the ZnO (0001) surface, resulting in the growth of a thinner nanosheet, as shown in
Figure 1d. When the hydrothermal temperature further increases, HMTA dissolves rapidly and generates sufficient
. Due to the
rich solution, the formations of
become faster. In contrast, limited by the rate of Al dissolution, aluminum hydroxide formation becomes inadequate. As the coverage rate of the
ions on the (0001) surface decreases, more and more
are attracted to the (0001) plane and grow along the [0001] direction, resulting in the increment of nanosheet thickness, as shown in
Figure 1e–f. The growth processes and hydrothermal temperature effects of the ZnO nanosheet arrays are consistent with the XRD analysis in
Figure 3b.
3.4. Optical Properties of Supported Nanosheet Arrays
Figure 4 demonstrates how the UV-Vis reflection and PL spectrum of bare Al substrate and fabricated nanosheet arrays are grown at various hydrothermal temperatures. From
Figure 4a, it can be seen that compared with the bare Al substrate, as-fabricated ZnO nanosheet arrays have almost lower reflectance over the spectral range of 300–900 nm, indicating better absorptions of ZnO nanosheet arrays. In particular, the reflection spectrum of the ZnO nanosheet array grown at 110 °C exhibits two deep reflection valleys near 325 nm and 850 nm. These two reflection valleys are located in different spectral regions, and the physical mechanism of their generation is also different. The reflection valleys at 850 nm in the near-infrared region are mainly due to the inter-band transition of Al [
22], which can also be obviously observed in other ZnO nanosheet arrays and bare Al substrates. As a comparison, the reflection valleys at 325 nm in the ultraviolet region only appear in the reflection spectrum of the nanosheet array grown at 110 °C, which is attributed to the high ultraviolet light absorptions of the ZnO and ZnAl LDH interlayer.
In order to investigate the photo-induced charge carrier separation and recombination processes and other important information, such as surface defects and oxygen vacancies, room temperature PL measurements of fabricated nanosheet arrays grown at various hydrothermal temperatures with 325 nm excitation were carried out in our experiment. As demonstrated in
Figure 4b, the bare Al substrate has almost no photoluminescence effect. On the contrary, the fabricated nanosheet arrays grown at various hydrothermal temperatures almost exhibit a strong UV emission band of around 390 nm and two weak visible light emission bands at about 460 nm and 560 nm, which are described as near-band-edge (NBE), E1 and E2 in
Figure 4b, respectively. As demonstrated in the literature [
23], the observed UV emission band can be attributed to the direct recombination of the conductance band electrons to the valence band holes, while the visible light emission bands are associated with the electron transfer from different defect states of ZnO such as oxygen vacancies and Zn interstitials. It can further be seen in
Figure 5b that the intensity of the emission peak of the supported nanosheet array decreases first and then increases with the increasing hydrothermal temperature. The inset of
Figure 4b shows that the NBE’s integral area of nanosheet arrays grown at 110 °C is the smallest. As is well known, in general, the lower the PL intensity, the lower the recombination rate of photo-induced electron–hole pairs, and the higher the photocatalytic activity of photocatalysts [
23]. Therefore, ZnO nanosheet arrays grown at 110 °C are expected to achieve excellent photocatalytic performance for water pollution photodegradation applications.
3.5. Photocatalytic Properties of Supported ZnO Nanosheet Array Grown at 110 °C
Figure 5 shows the photodegradation of RhB dye pollution with supported nanosheet arrays grown at 110 °C. As shown in
Figure 5a, the characteristic absorption peak of the RhB dye molecule became significantly weaker as photodegradation time went on, indicating the efficient photodegradation of RhB dye pollutions with supported nanosheet arrays.
Figure 6b depicts a comparison of the photodegradation of the RhB dye molecule with the bare Al substrate and the supported nanosheet arrays grown at 110 °C. By using the bare Al substrate, the dye molecules slightly degraded (8.6%) under 180 min UV light irradiation due to light-induced self-degradation [
24]. In contrast, using supported nanosheet arrays grown at 110 °C, the dye molecules degraded to 81.2% of their original concentration. It can be further found from the inset of
Figure 5b that the photodegradation of RhB using supported nanosheet arrays grown at 110 °C follows the pseudo-first-order of kinetics. The pseudo-first-order rate constants k of the supported nanosheet arrays grown at 110 °C reach 0.00935 min
−1, which is 10 times higher than that of RhB’s self-degradation. According to the photocatalytic results, the mechanism for the degradation of the RhB solution by ZnO nanosheet arrays could be explained. Upon the UV light irradiation, the conduction-band electrons and valence-band holes were generated on the surfaces of the ZnO nanosheet. The electrons can activate molecular oxygen to form superoxide radical anion
, and the holes react with water to form highly reactive hydroxyl radicals
. Both
and
have strong oxidative abilities, which are able to degrade RhB into CO
2, H
2O, and other intermediates.
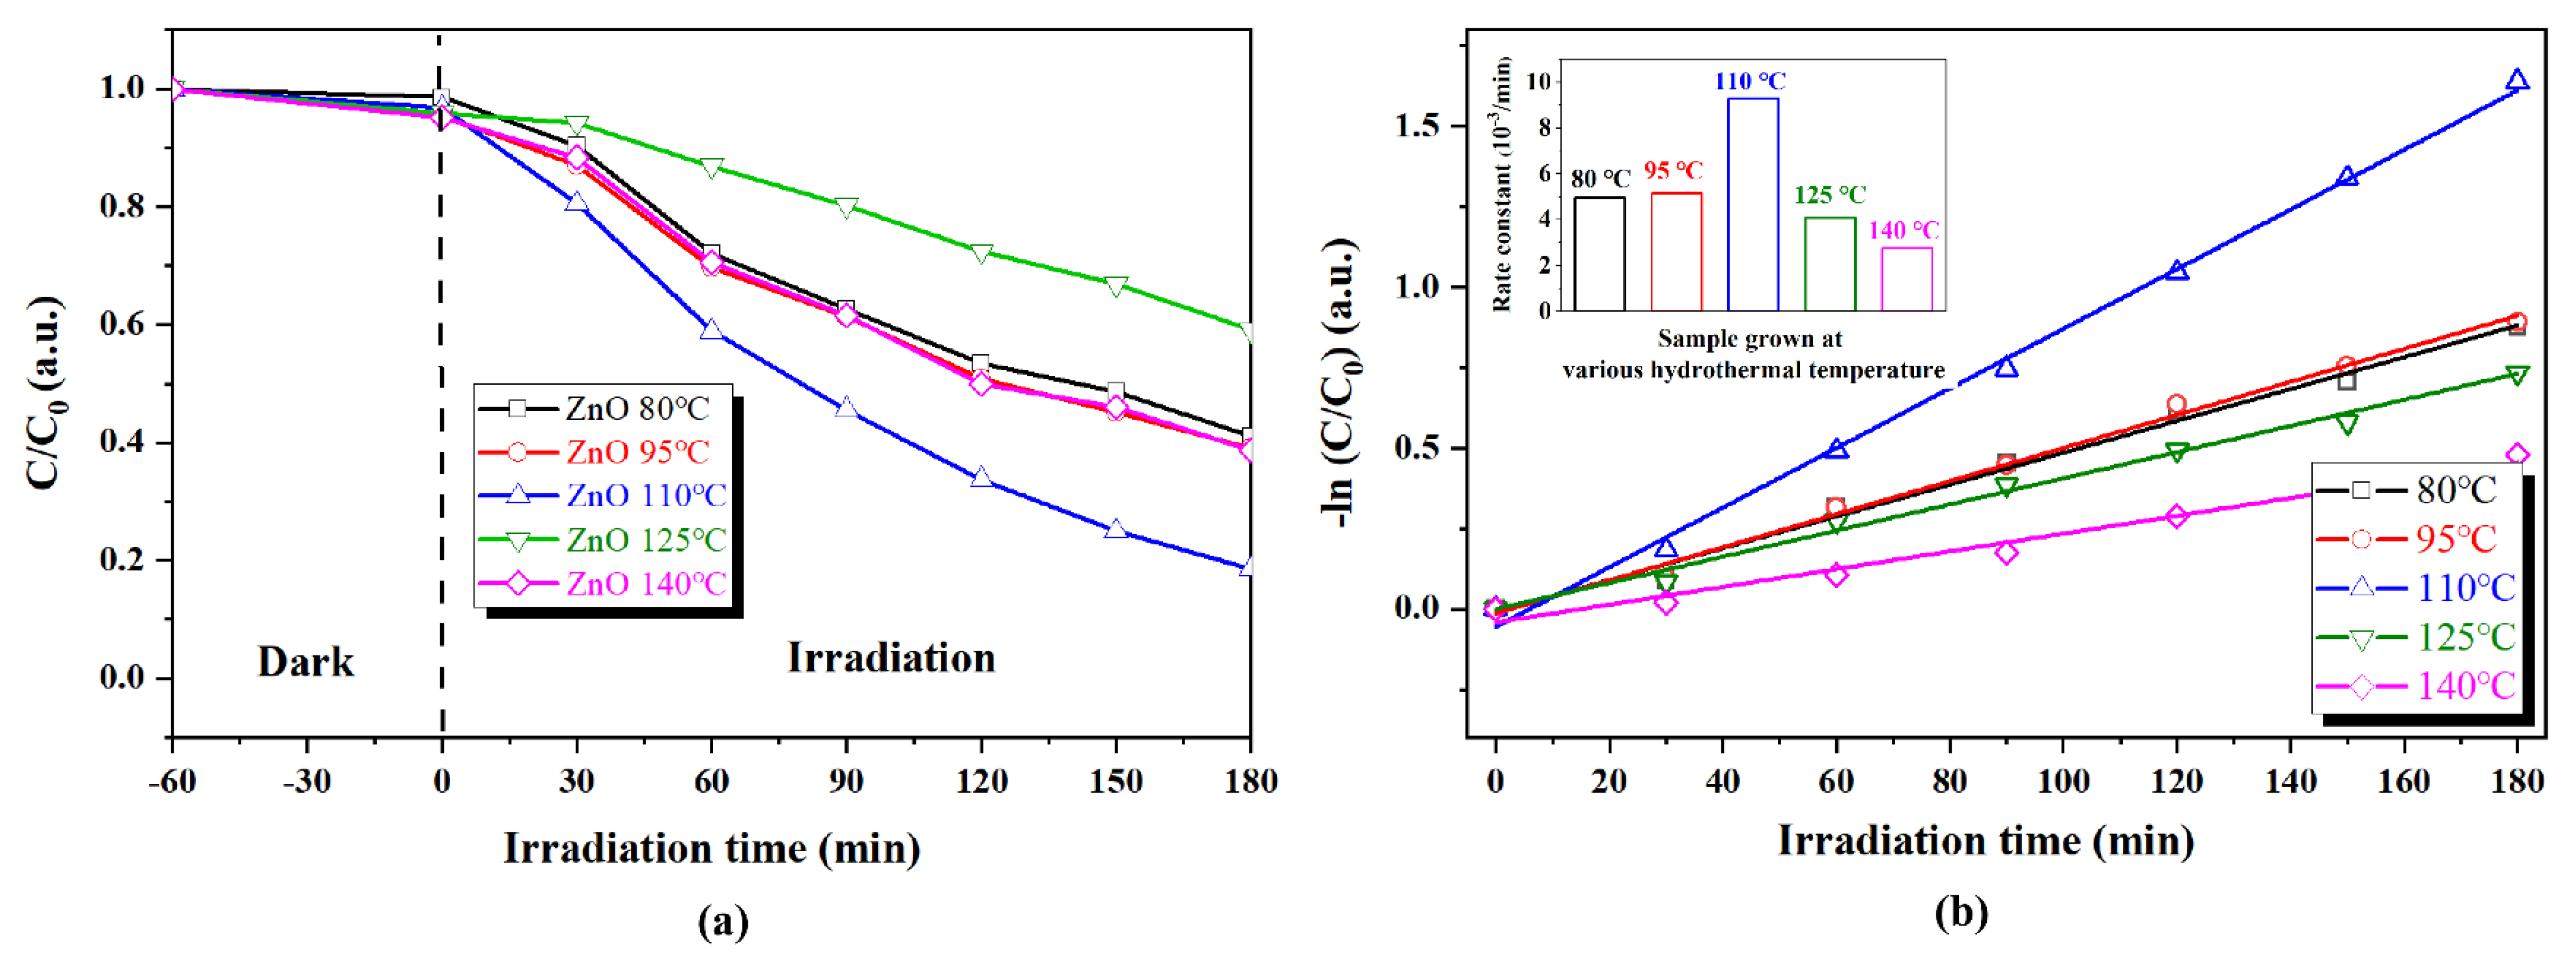
In order to evaluate the hydrothermal temperature effect on the photodegradation activity of fabricated supported nanosheet arrays, the photodegradation experiment of RhB dye pollutions with supported ZnO nanosheet arrays grown at other hydrothermal temperatures were carried out, and the results are shown in
Figure 6. The changes in the UV–Vis absorption spectrum of the photodegraded RhB solution as a function of irradiation time with supported nanosheet arrays grown at 80 °C, 95 °C, 125 °C, and 140 °C are shown in
Figure S5. It can be clearly observed from
Figure 6a that the photodegradation activities of ZnO nanosheet arrays depended strongly upon hydrothermal temperature. The photocatalytic activity increased first with the increasing hydrothermal temperature from 80 °C to 110 °C and then decreased with the further increasing hydrothermal temperature from 110 °C to 140 °C, indicating the presence of an optimal hydrothermal temperature. This nonlinear dependence between photocatalytic activity and hydrothermal temperature can be attributed to the influence of competition between the area and thickness of ZnO nanosheets at different hydrothermal temperatures. It is well known that the excellent photodegradation performance of nanosheet arrays is mainly due to their large specific area and atomic thickness [
16]. The larger the area, the more active sites can be provided. The thinner the thickness, the faster the charge transfer and the lower the recombination rate. As mentioned above, the area and thickness of the nanosheet gradually increased with the increasing hydrothermal temperature. When the hydrothermal temperature increased from 80 °C to 110 °C, the positive influence brought by the increase in the area was a major factor and led to the enhancement of photocatalytic performance. When the hydrothermal temperature was further increased from 110 °C to 140 °C, the negative effect of the increasing thickness greatly reduced the charge transfer and, thus, ultimately decreased the photocatalytic activity of ZnO nanosheet arrays.
To quantitatively understand the hydrothermal temperature effect on the reaction kinetics of the RhB degradation, the pseudo-first-order kinetic fitting plots of as-fabricated supported nanosheet arrays grown at various hydrothermal temperatures are shown in
Figure 6b and the corresponding photocatalytic rate constants, are illustrated in the inset of
Figure 6b. It was clearly observed that with the increasing hydrothermal temperature, the photodegradation rates of the fabricated supported nanosheet arrays grown at various temperatures first increased and then decreased, and the sample at 110 °C exhibited the highest photodegradation activity with the rate constant k = 0.00935 min
−1, which is almost four times more efficient than that of ZnO nanosheet arrays grown at 140 °C (0.00276 min
−1).
In order to verify that fabricated nanosheet arrays can be used in the degradation of various water pollutants, the photodegradation experiments of four different pollutant solutions (10 mg/L) were performed, including MO dye, MB dye, OFL antibiotics, and NOR antibiotics. As is known to all, MO and MB are widely utilized as coloring agents in plastics, painting, cosmetics, paper, leather, and food industries. OFL and NOR are fluoroquinolones antibiotics and are extensively used in agricultural and veterinary treatments. Moreover, as the typical anionic and cationic organic dye, MO and MB differ in their superficial charge. Therefore, testing the photodegradation efficiency of four of these pollutants is helpful to comprehensively understand the degradation ability of as-fabricated ZnO nanosheet arrays for different types of pollutants in water pollution.
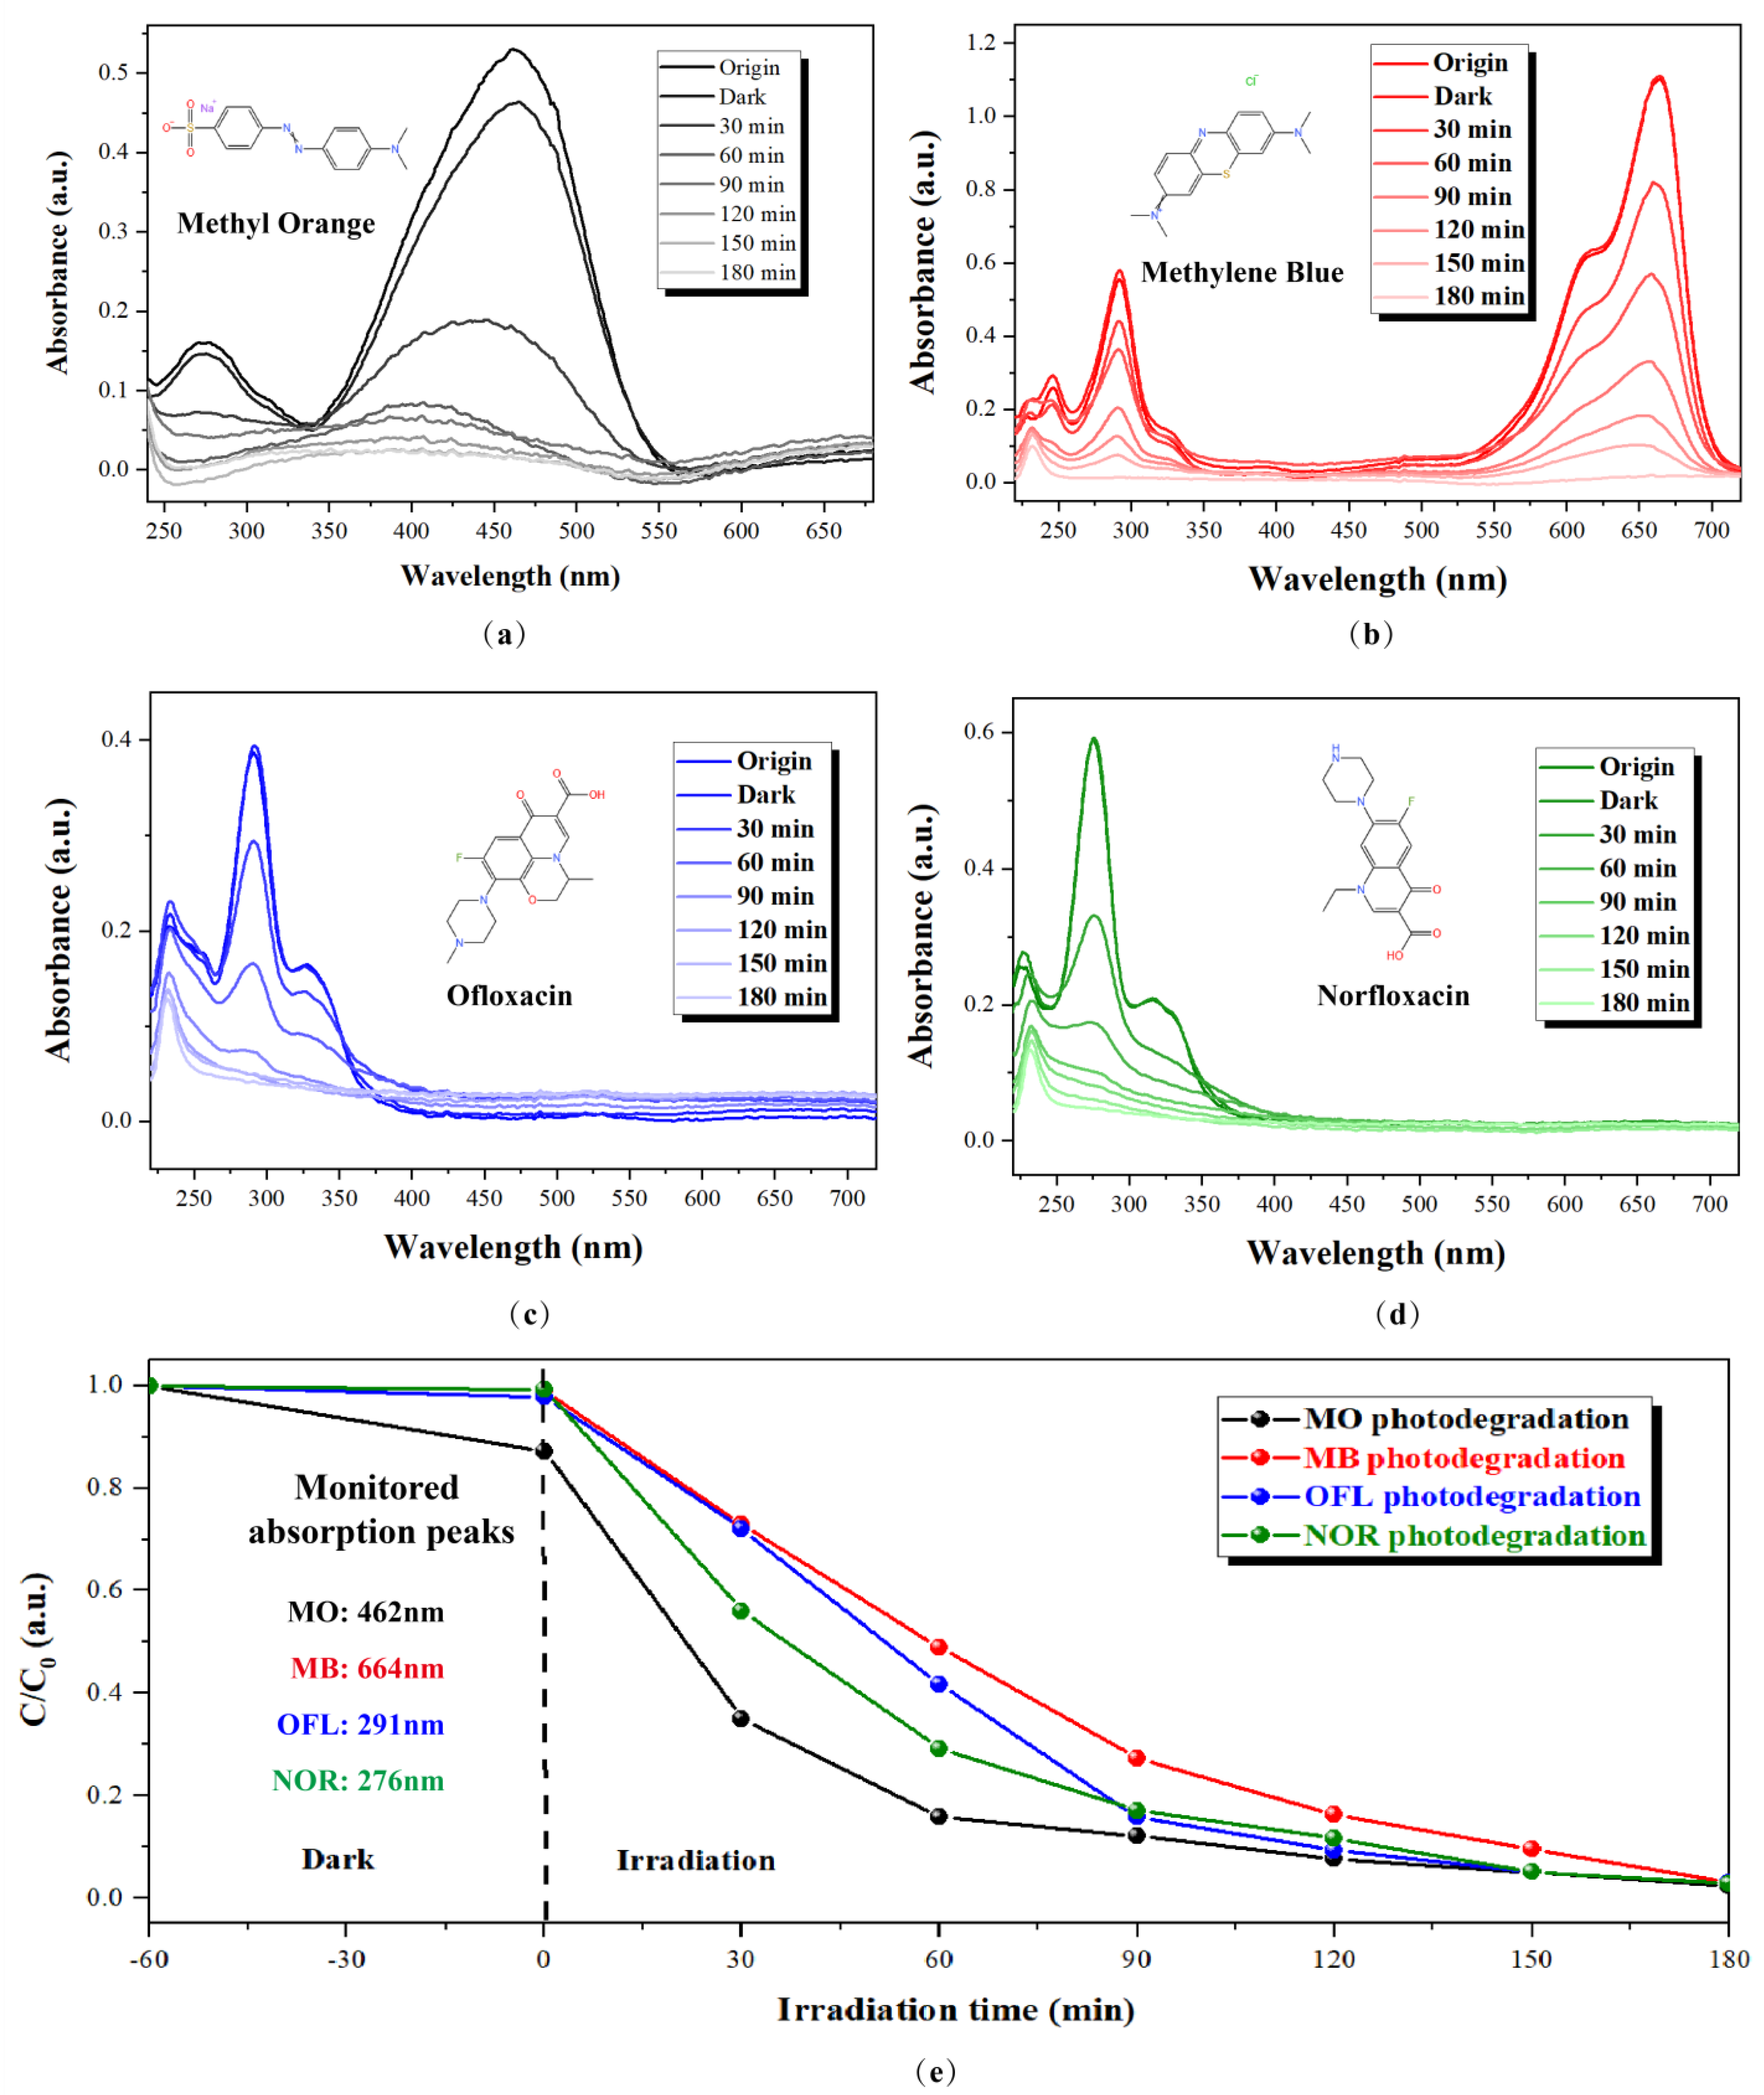
Figure 7a–d demonstrates the changes in the UV–Vis absorption spectrum of the photodegraded MO, MB, OFL, and NOR solution as a function of irradiation time with supported nanosheet arrays grown at 110 °C. As can be seen from
Figure 8, the concentrations of four these solutions were also significantly reduced, and the pollutant solutions were almost completely degraded in 180 min. However, the process of photodegradation is not the same for different pollutants. The degradation of MO was rapid in the first 60 min and then gradually slowed down. As a comparison, the degradation rate of MB was consistent within 180 min. The degradation rates of OFL and NOR antibiotics were in the middle. For instance, after 60 min, 85% MO, 51% MB, 58% OFL, and 71% NOR were degraded. The degradation rates in 60 min followed the order of MO > NOR > OFL > MB. The high degradation efficiency of MO could be attributed to the high photocatalytic activity of the ZnO nanosheet arrays but also to the electrical properties of the dyes. As a typical anionic dye, MO exhibits a negative superficial charge, and the electrostatic attraction between the positive surface charge of the ZnO (0001) surface and anionic dye allowed more MO adsorption onto the surface of the ZnO nanosheet arrays. As a comparison, MB is a typical anionic dye, and its superficial charge is positive. Therefore, MB exhibits less photodegradation activity than MO due to its lack of electrostatic attraction between the dye and ZnO nanosheet arrays. These results indicate that supported nanosheet arrays have great potential for practical and composite water pollution treatment.
In order to clarify the photocatalytic activity of ZnO nanosheet arrays prepared in this work, the degradation of various pollutants was compared with the previous work in
Table 2, including cationic, anionic dyes, and fluoroquinolones antibiotics. As indicated in
Table 2, compared with the previous work, the improvement of the degradation ability of cationic dyes with the zinc oxide nanosheet structure prepared in this paper is limited, but the degradation abilities of anionic dyes and antibiotics are significantly improved.
As known, photocatalytic cyclical stability and durability are very significant in practical applications besides the photocatalytic performance, especially for supported nanostructured photocatalysts. The cyclical stabilities of as-fabricated ZnO nanosheet arrays for RhB dye photodegradation were investigated by recycling the ZnO nanosheet arrays five times, and the results are shown in
Figure 8a. To quantitatively demonstrate the repeatability and stability of the performance of the sample, the average value and standard variance of C/C0 under different irradiation times at five cycles were calculated and listed in
Table S1. From
Figure 8a and
Table S1, it can be seen that no significant loss of activity indicates how supported nanostructured photocatalysts can retain stable recyclability in the process of RhB dye photodegradation. It is worth mentioning that in our experiment, the reused samples only need to be simply washed and dried rather than collected and separated. This further demonstrates the advantages of the ZnO nanosheet arrays prepared in this work for the reuse of photocatalysts.
To investigate the robustness and durability of as-fabricated ZnO nanosheet arrays, destructive simulation experiments were performed using high-energy ultrasonic cleaning (100 W, 30 min). The robustness and durability of fabricated ZnO nanosheet arrays, investigated by the one-step hydrothermal method proposed in this paper and the two-step seed crystal growth method proposed in the literature [
29], were compared.
Figure 8b shows the photocatalytic activities of two types of ZnO nanosheet arrays before and after 30 mins of ultrasound destructive treatment. As illustrated in
Figure 8b, the photocatalytic activity of ZnO nanosheet arrays prepared by the one-step hydrothermal method is slightly higher than that of ZnO nanosheet arrays prepared by the two-step method regardless of ultrasonic destructive treatment prior to or after processing. This may be due to the additional adsorption and photocatalysis of ZnAl LDH. It can further be observed from the inset of
Figure 8b that the photocatalytic activity of ZnO nanosheet arrays prepared by the one-step hydrothermal method decreased by 17.7% after ultrasound destructive treatment. As a comparison, the photocatalytic activity of the two-step seed crystal growth hydrothermal fabricated ZnO nanosheet arrays decreased by 30.2% after ultrasound destructive treatment. This result implies that the one-step hydrothermal method is superior to the two-step method in the aspect of photocatalyst robustness and durability. The excellent durability of ZnO nanosheet arrays can be attributed to the direct growth of ZnO nanosheet arrays on the Aluminum substrate without any additional seed layer deposition or surface treatment. Additionally, ZnAl LDH can be formed between the Al substrate and ZnO nanosheet arrays, and this provides good adhesion of the ZnO nanosheet arrays to the substrate [
17].

 ,
, 


