
Quantum Cutting in KGd(CO3)2:Tb3+ Green Phosphor
Abstract
:1. Introduction
2. Materials and Methods
3. Results and Discussion
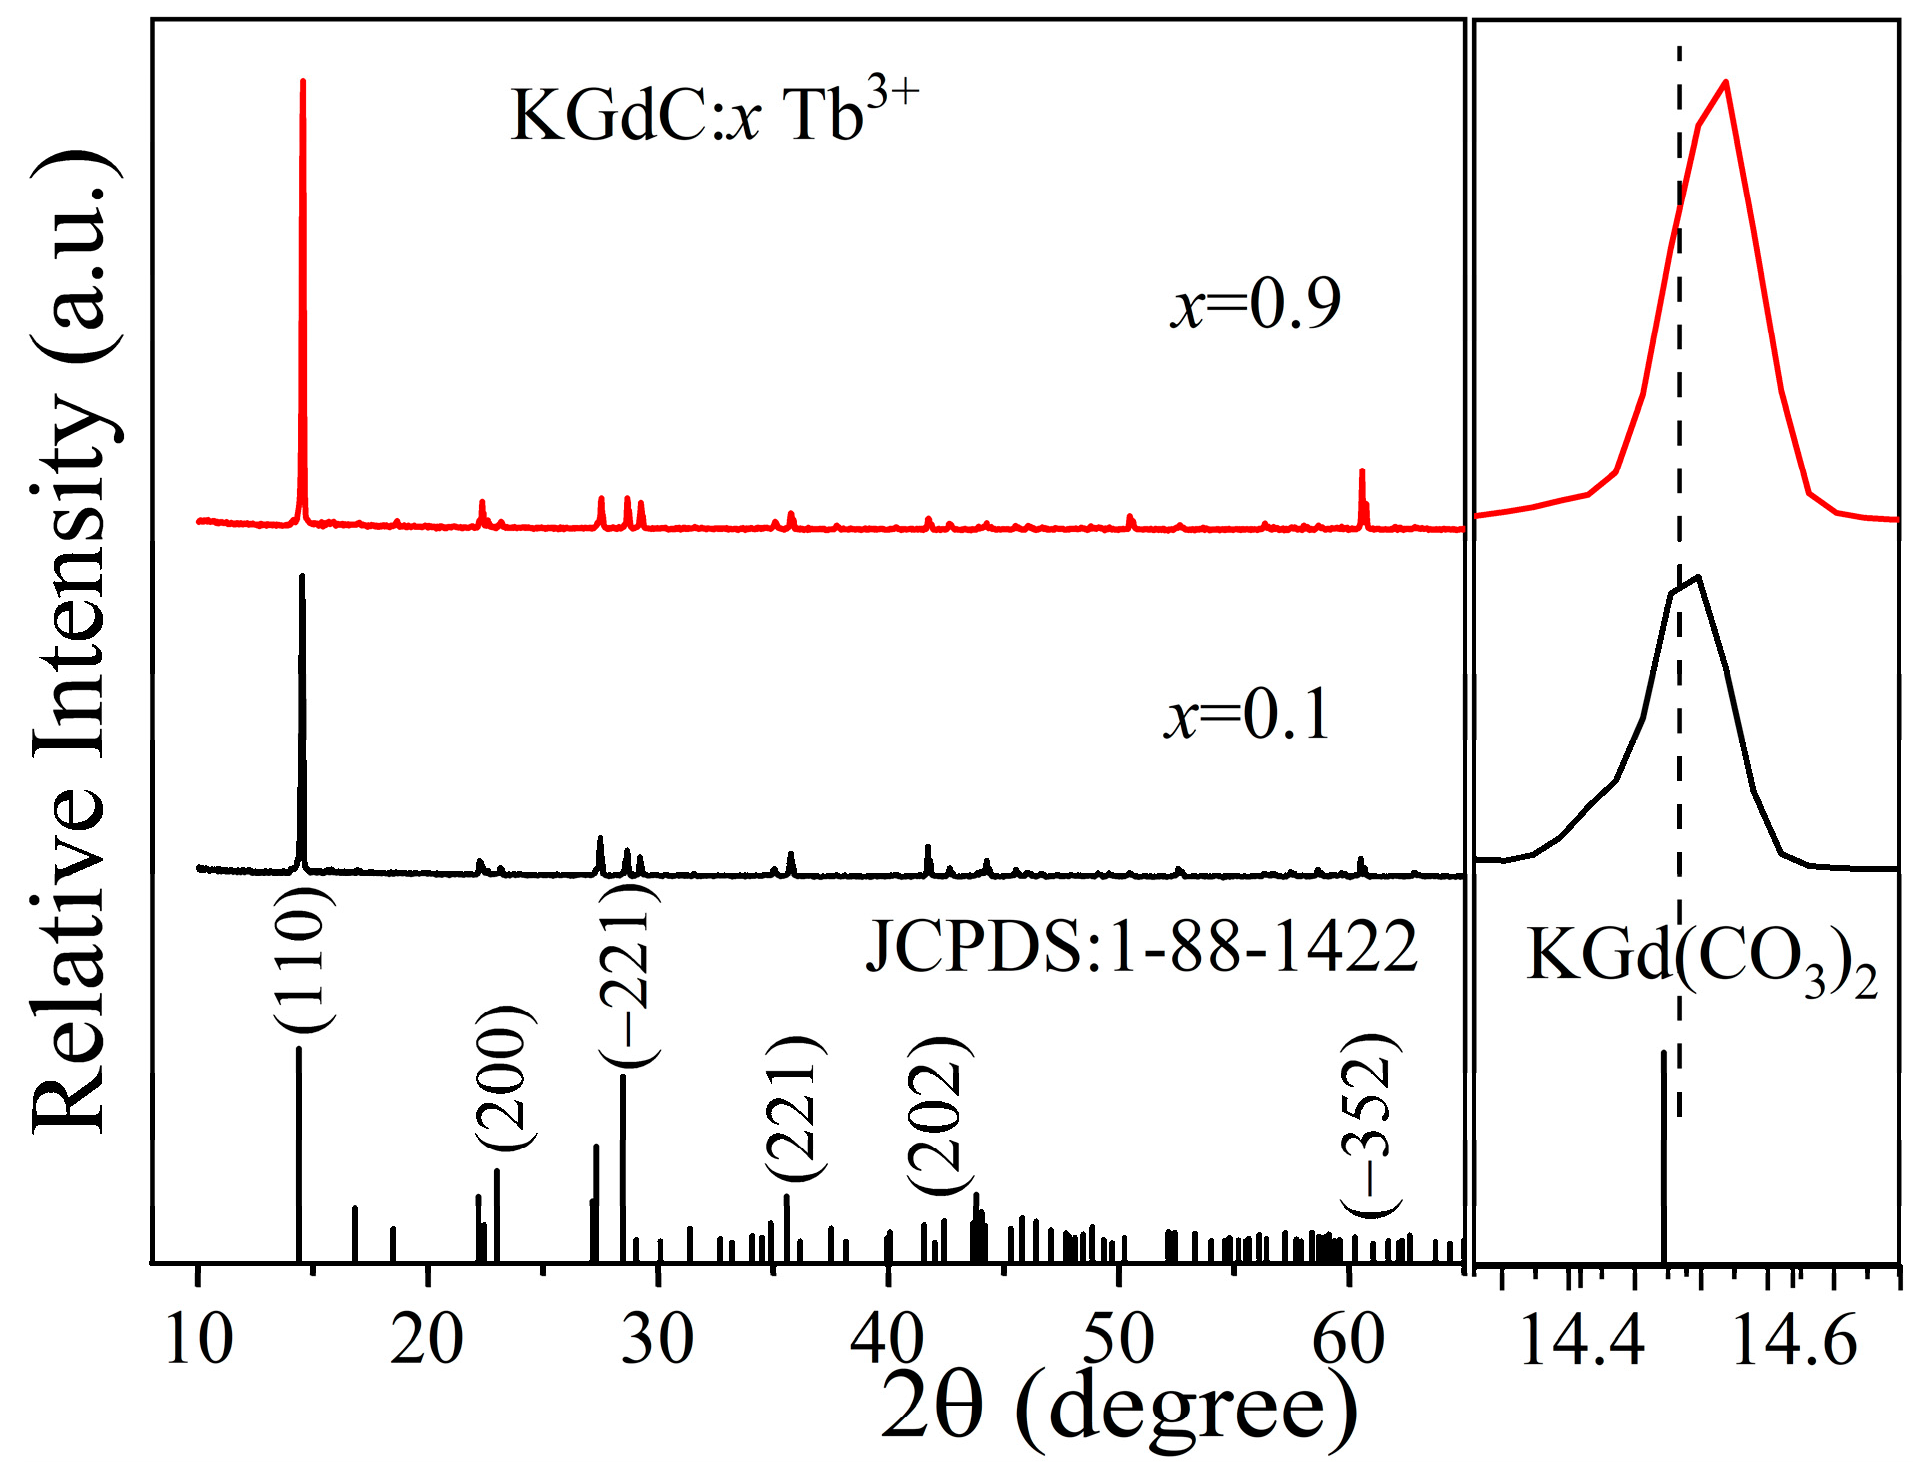
3.1. Crystal Structures
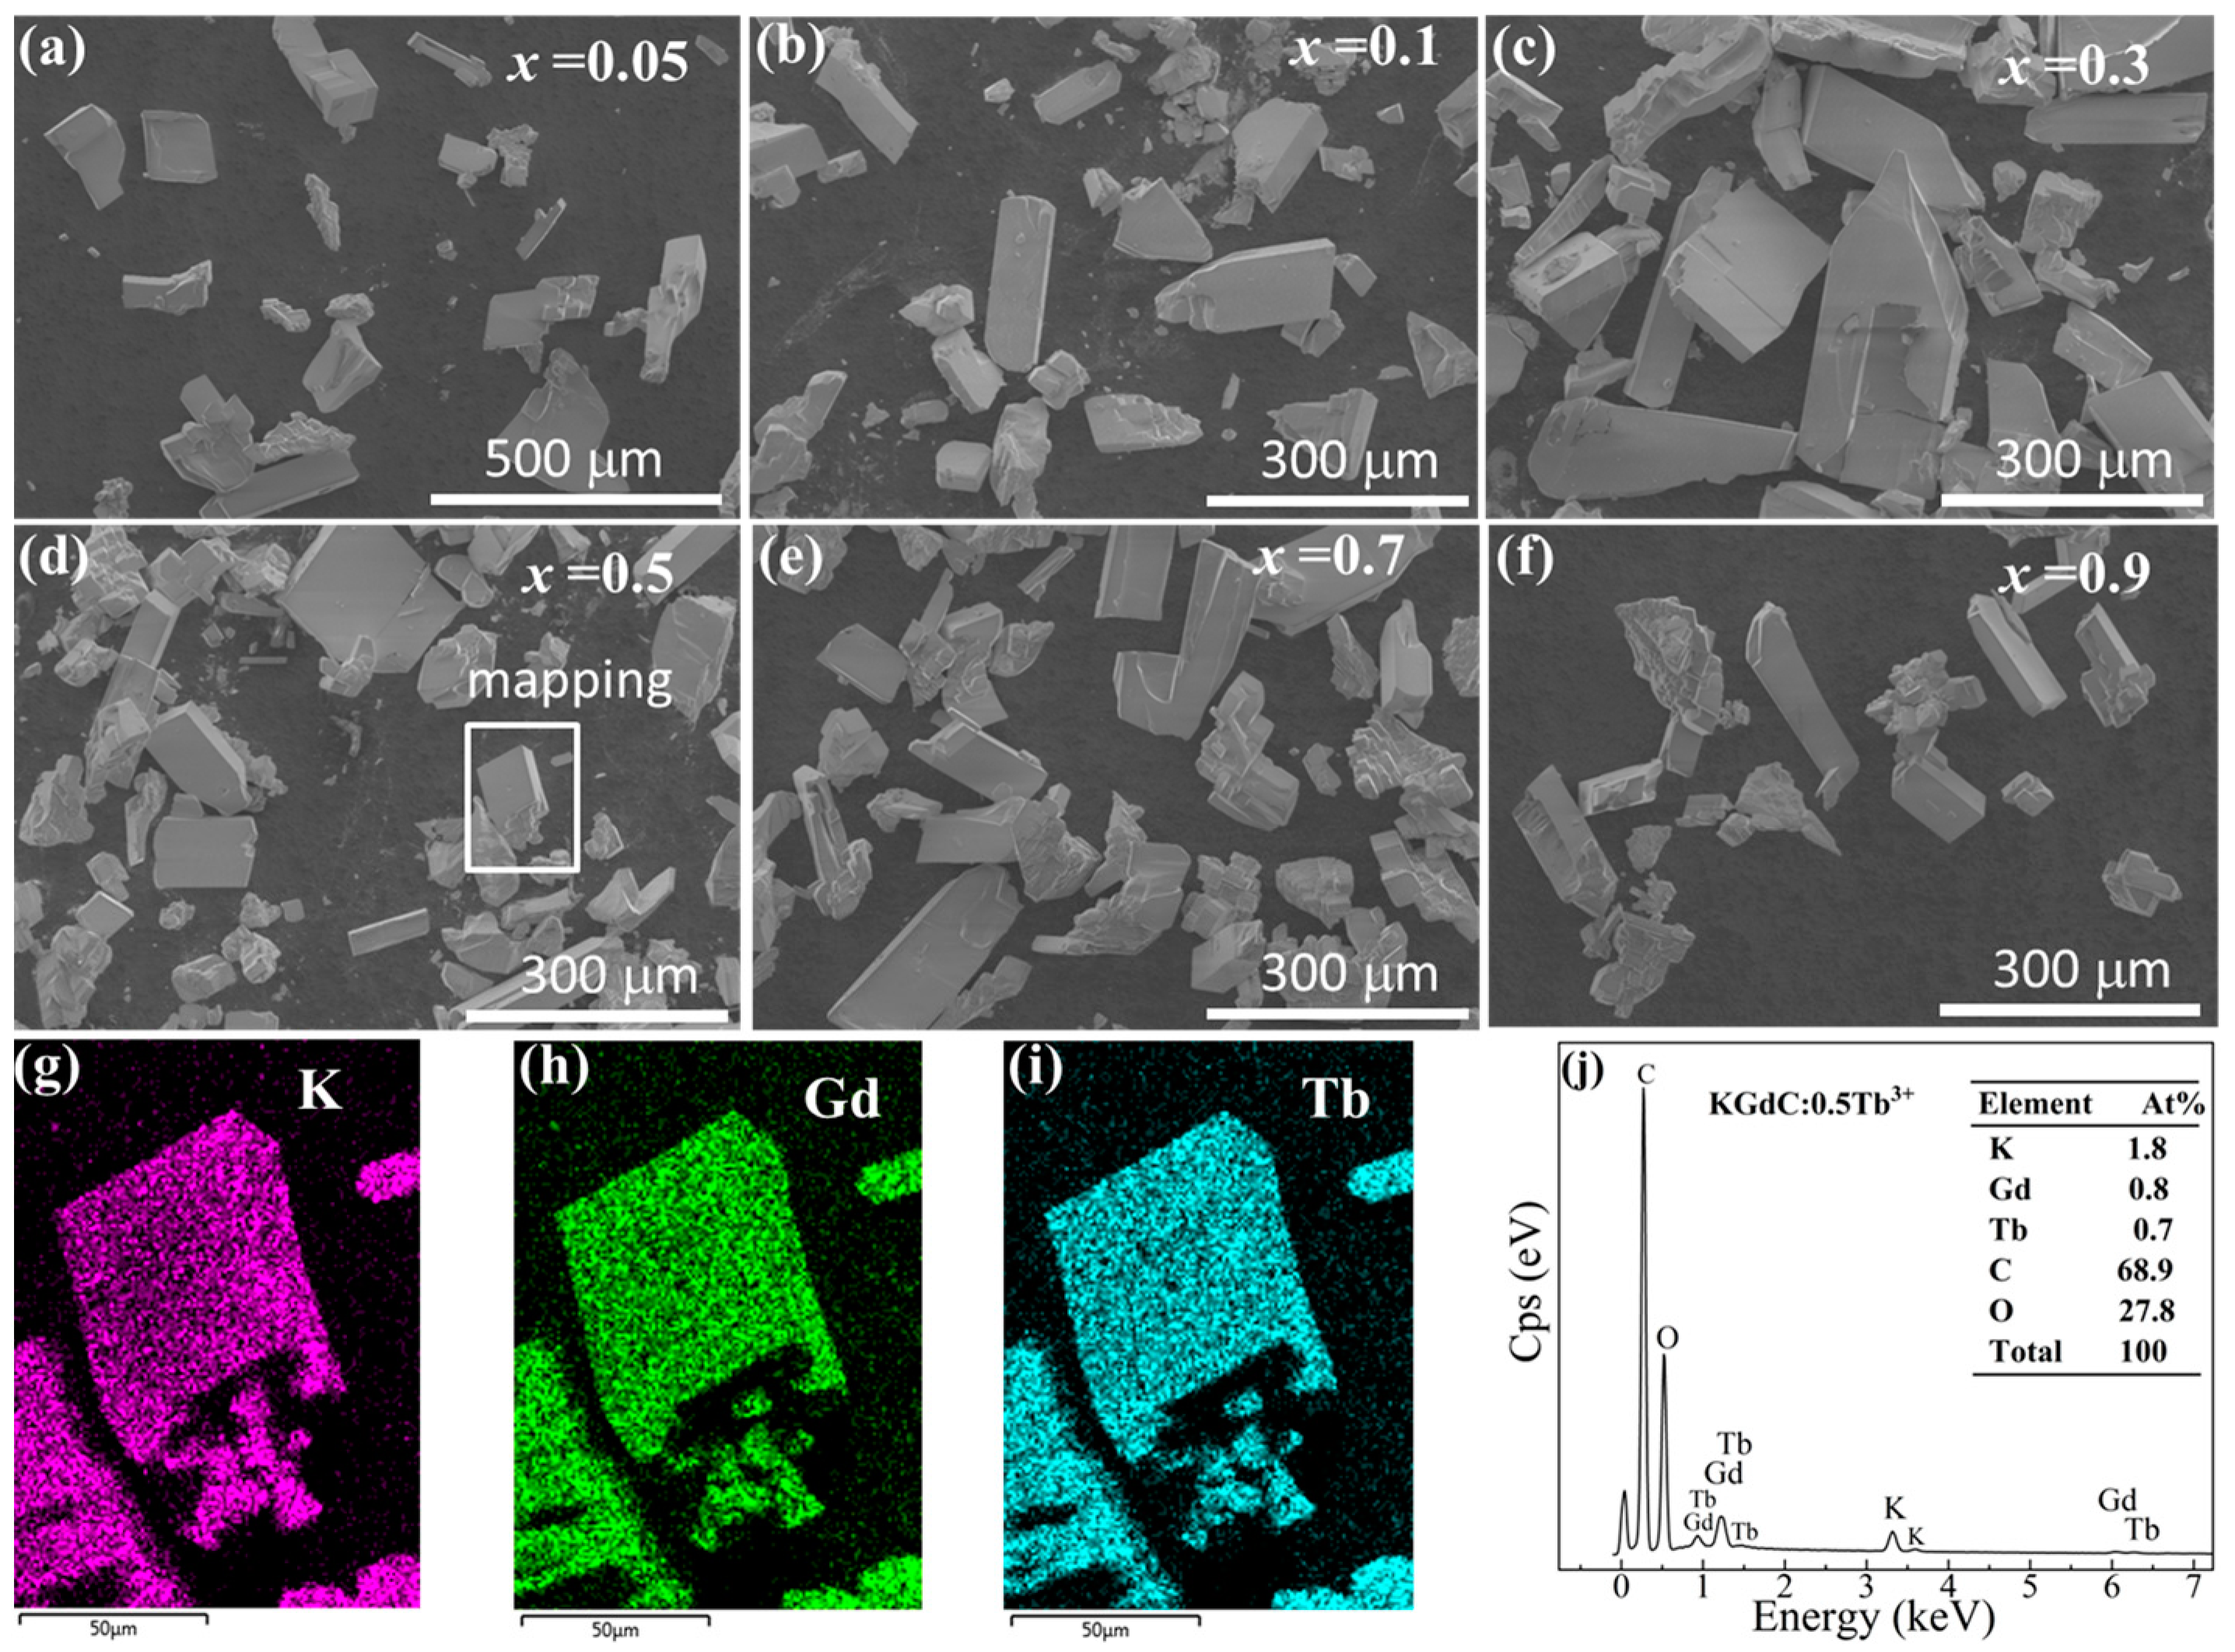
3.2. Morphology
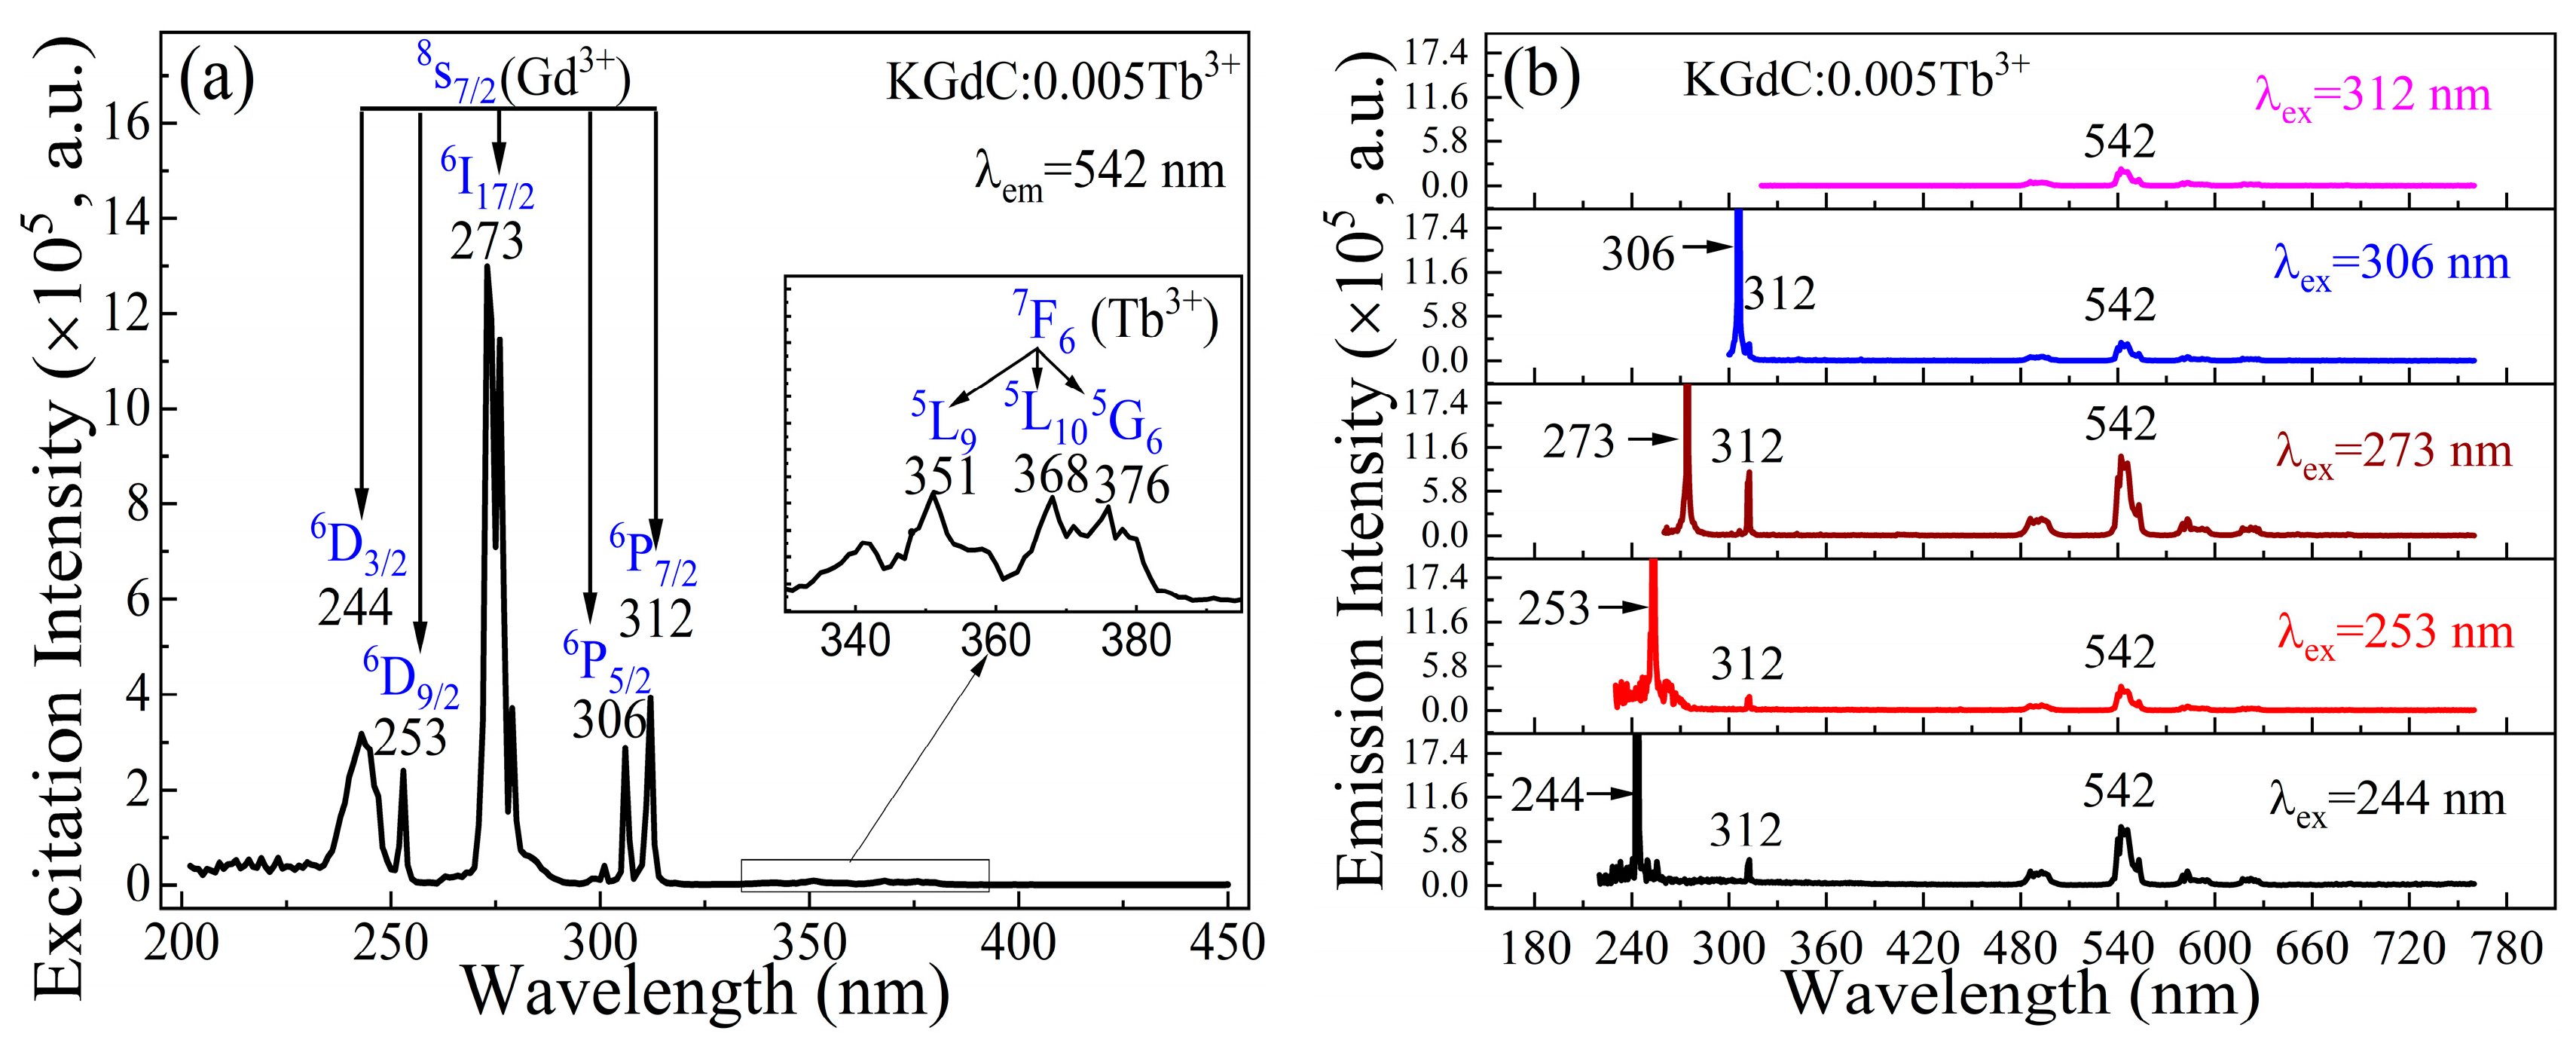
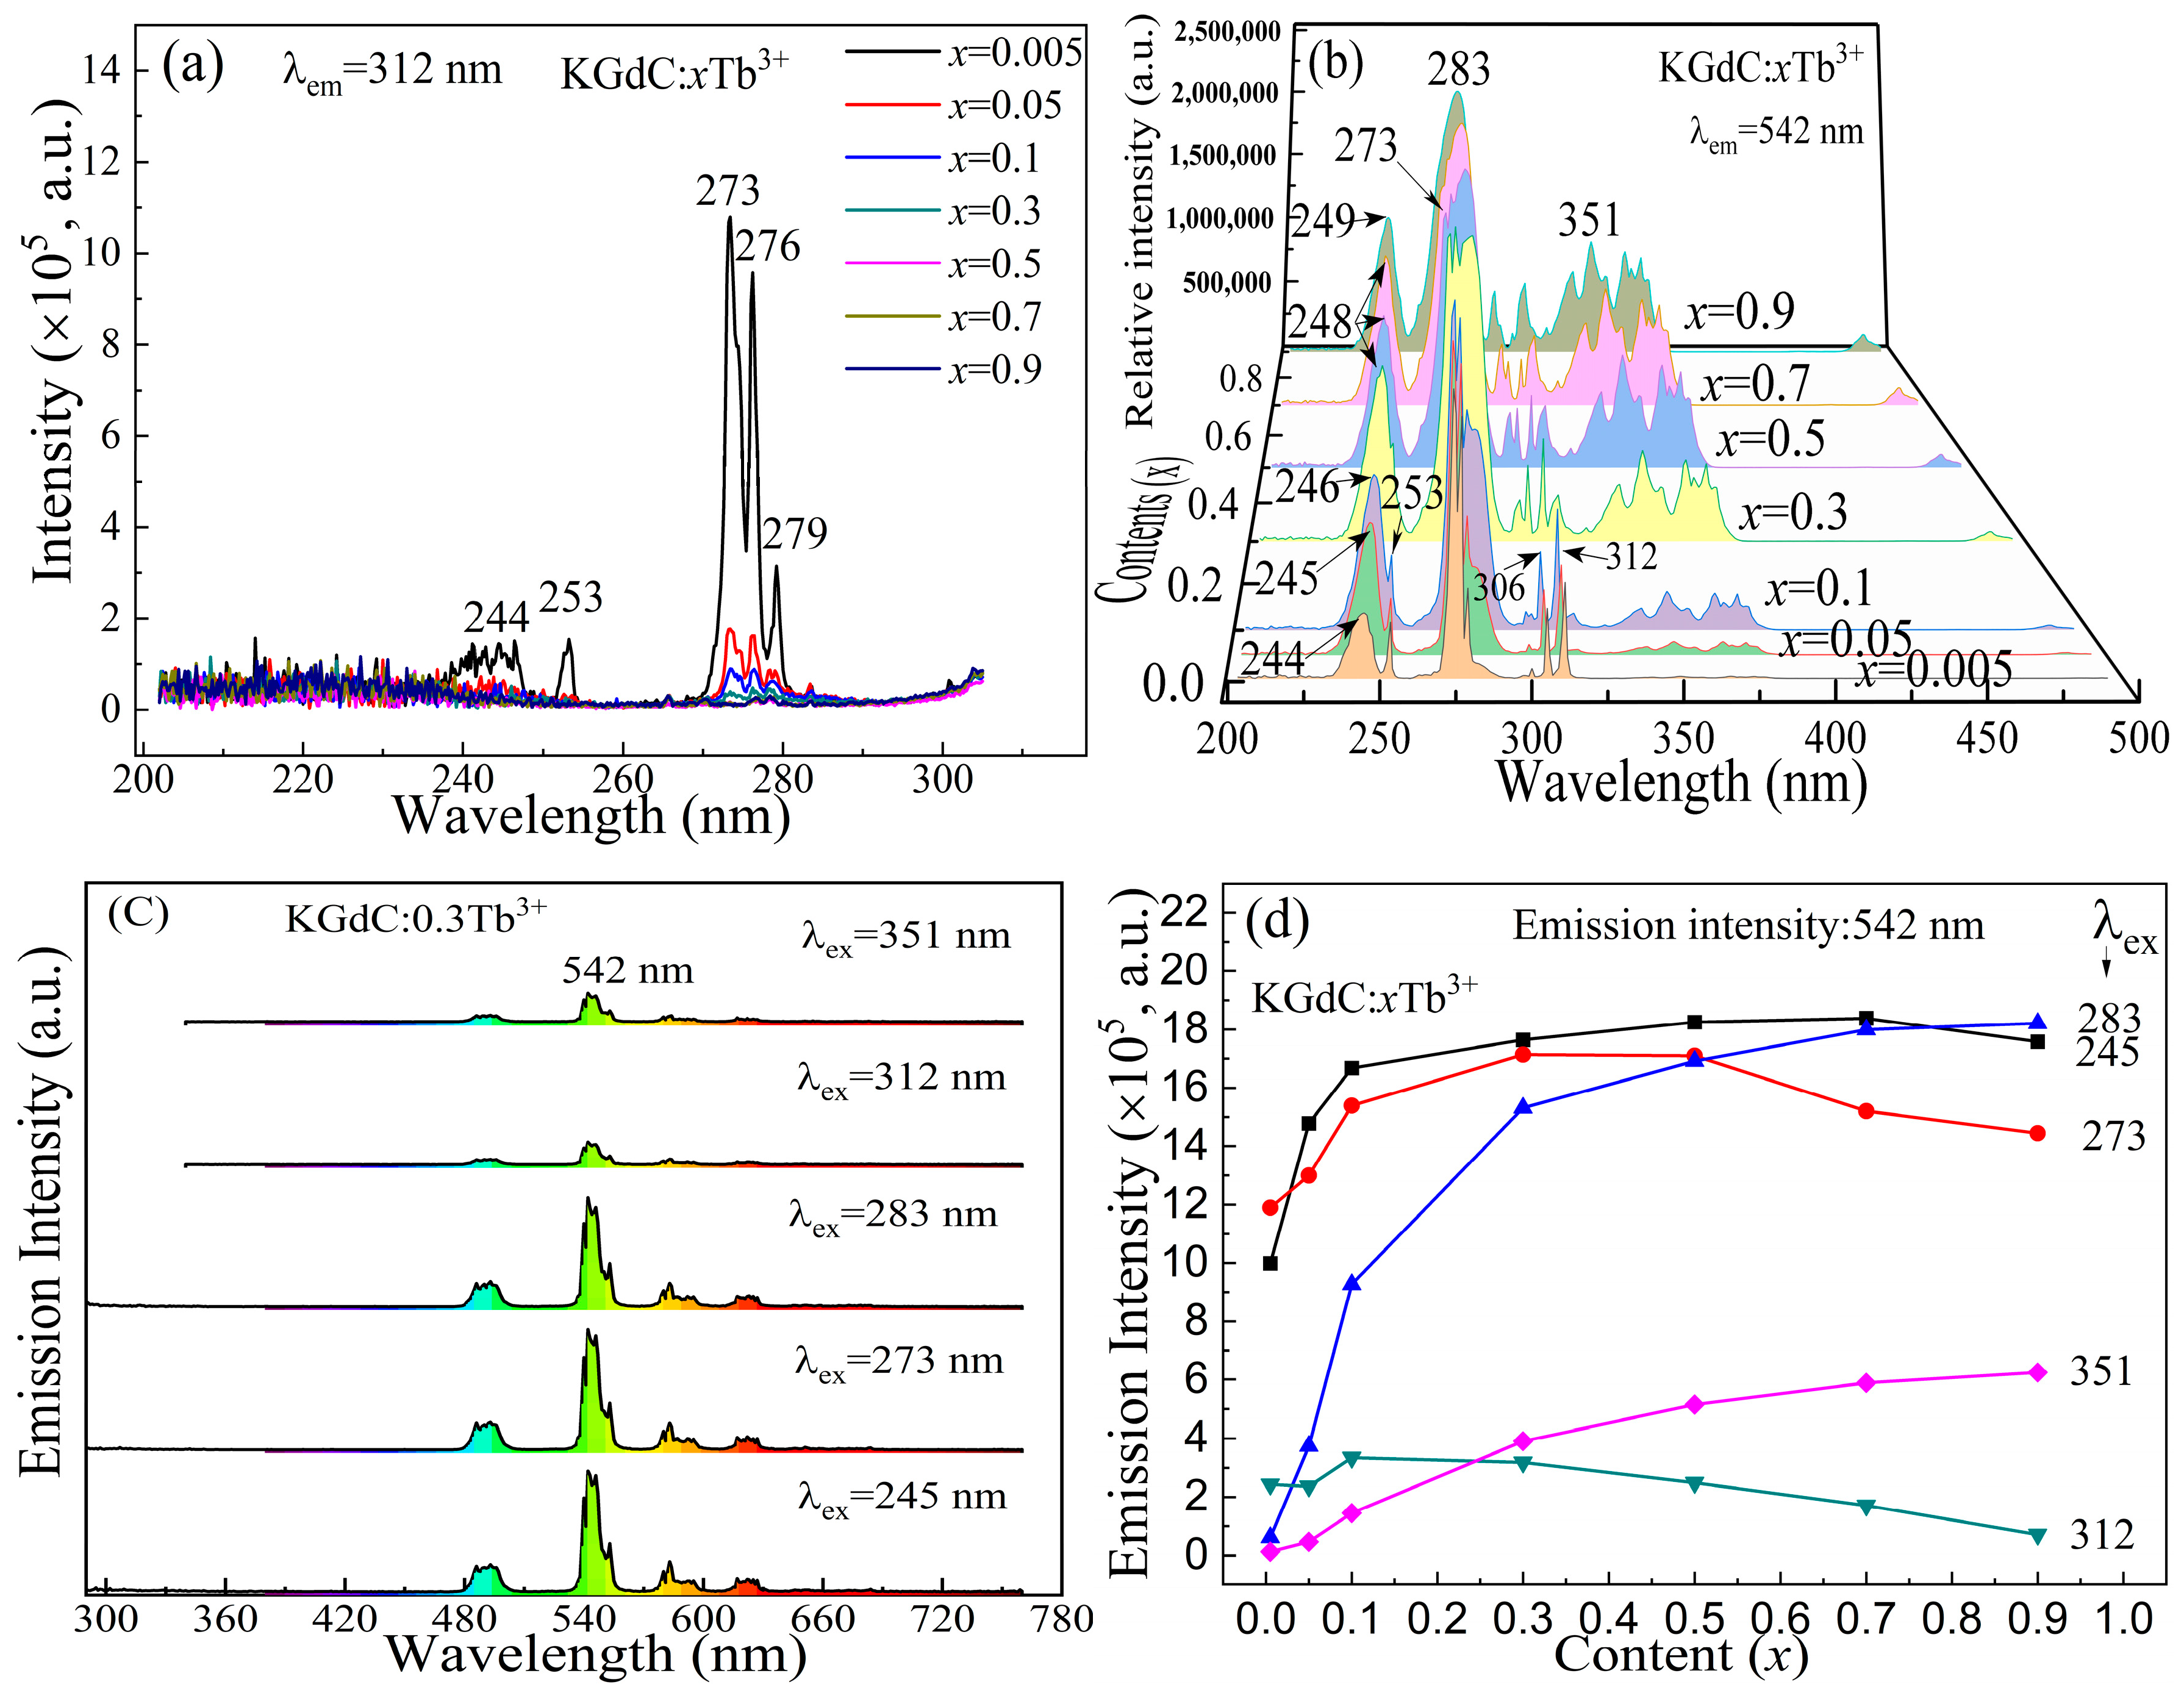
3.3. Luminescence Spectra
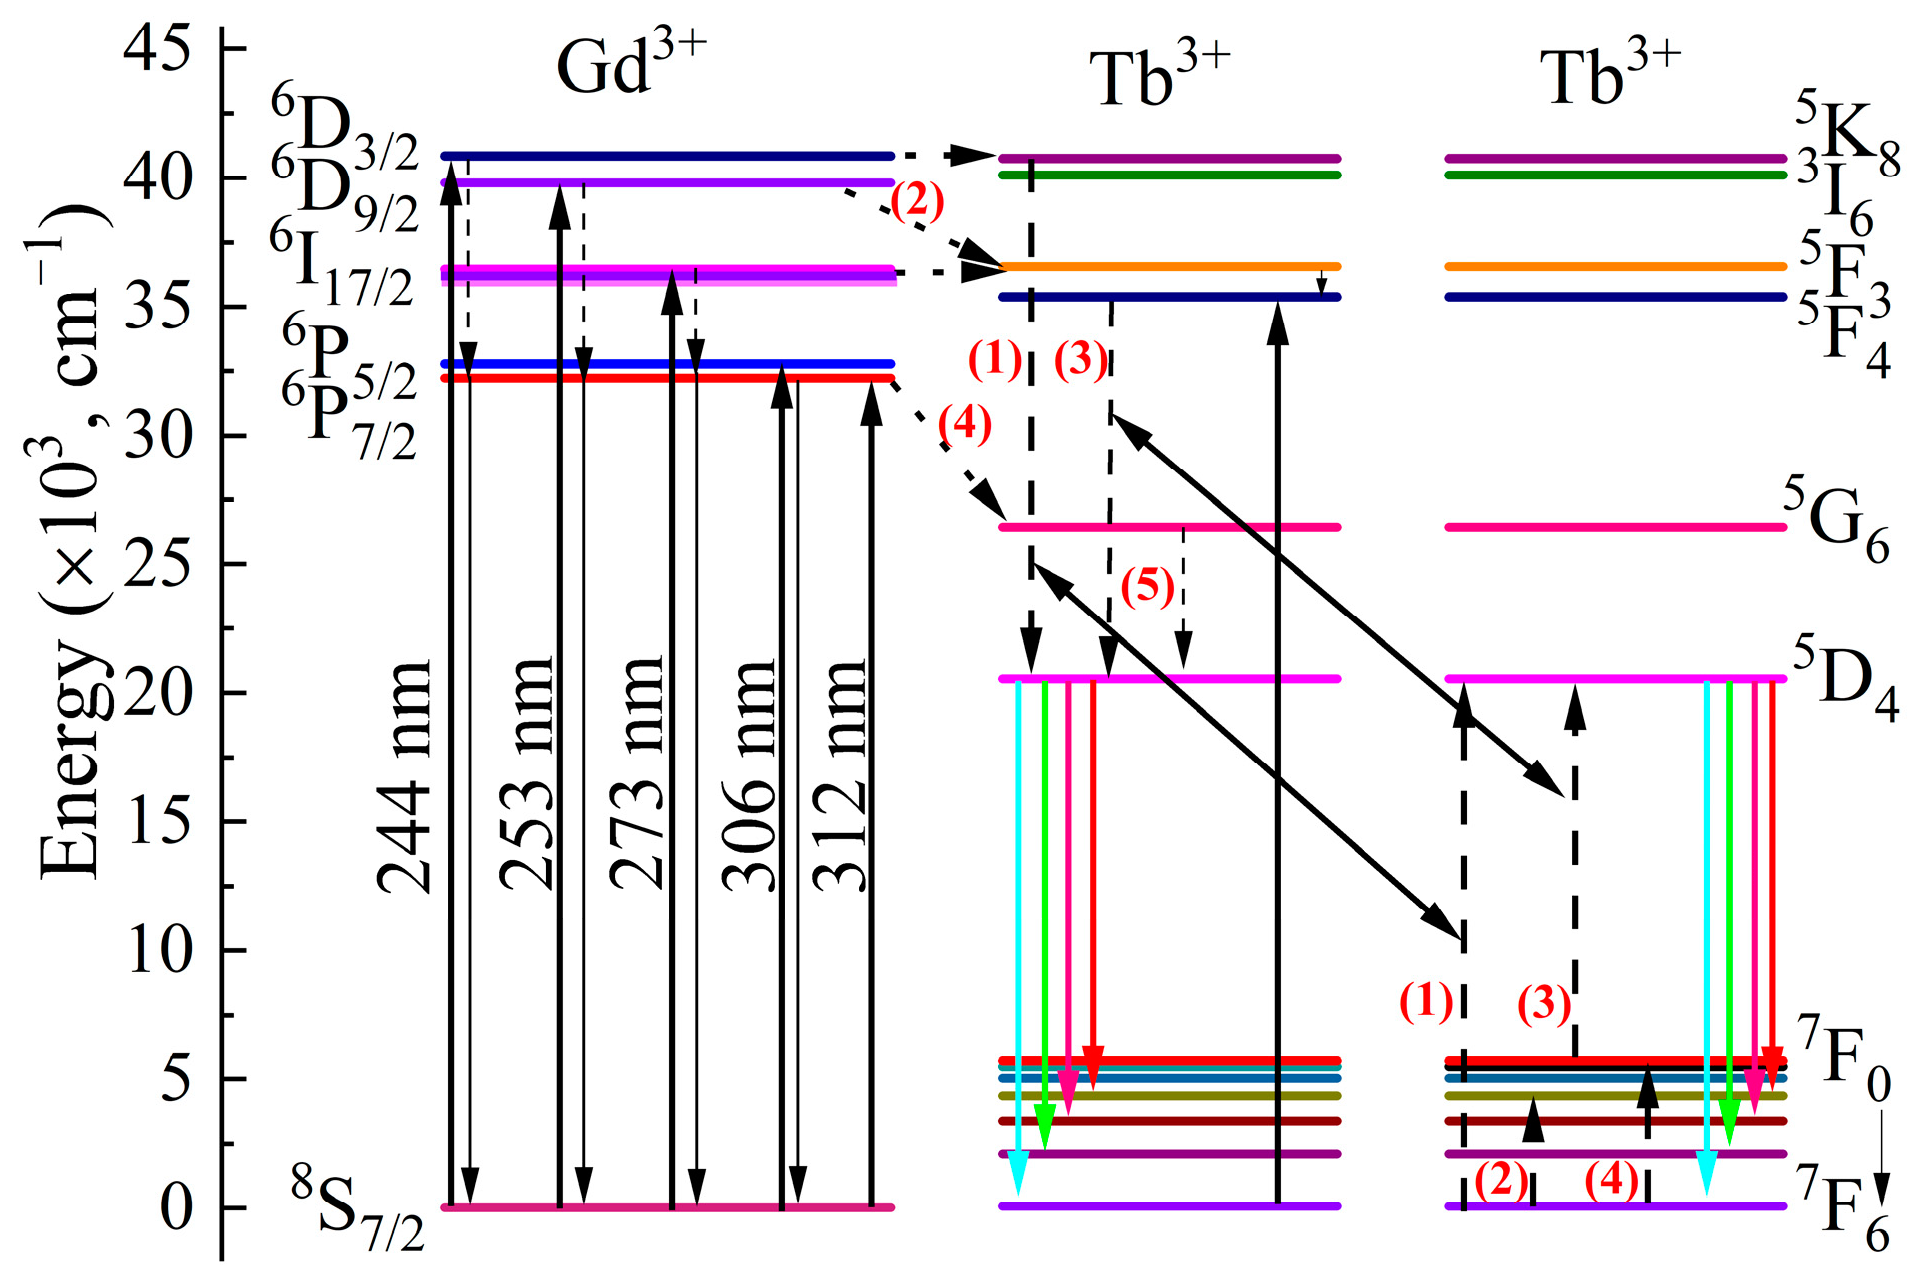
3.4. Energy Level Diagram
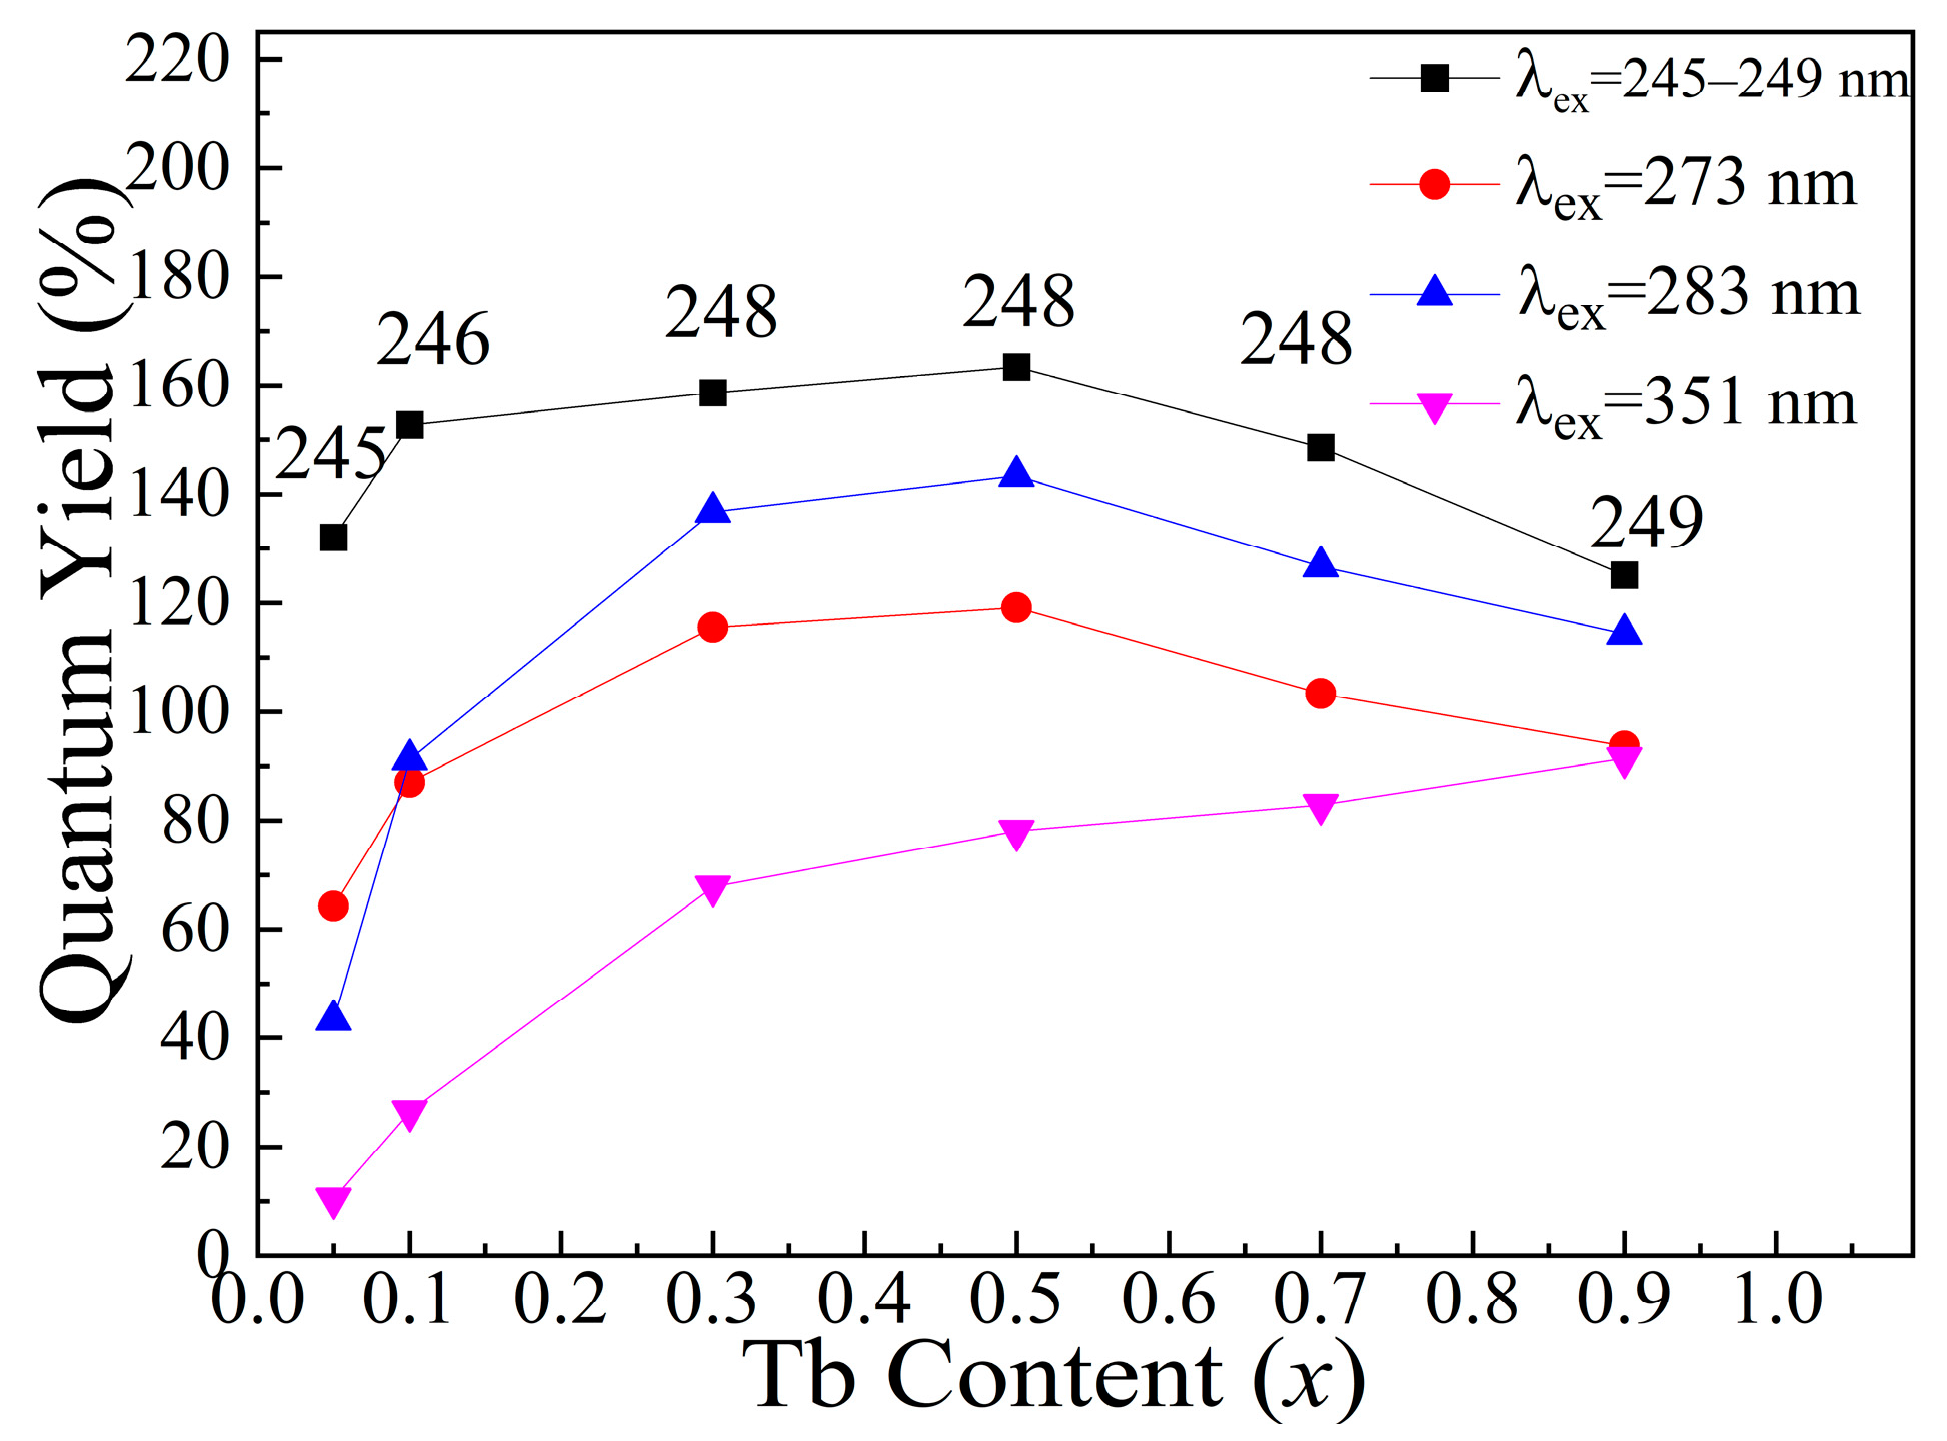
3.5. Quantum Yield
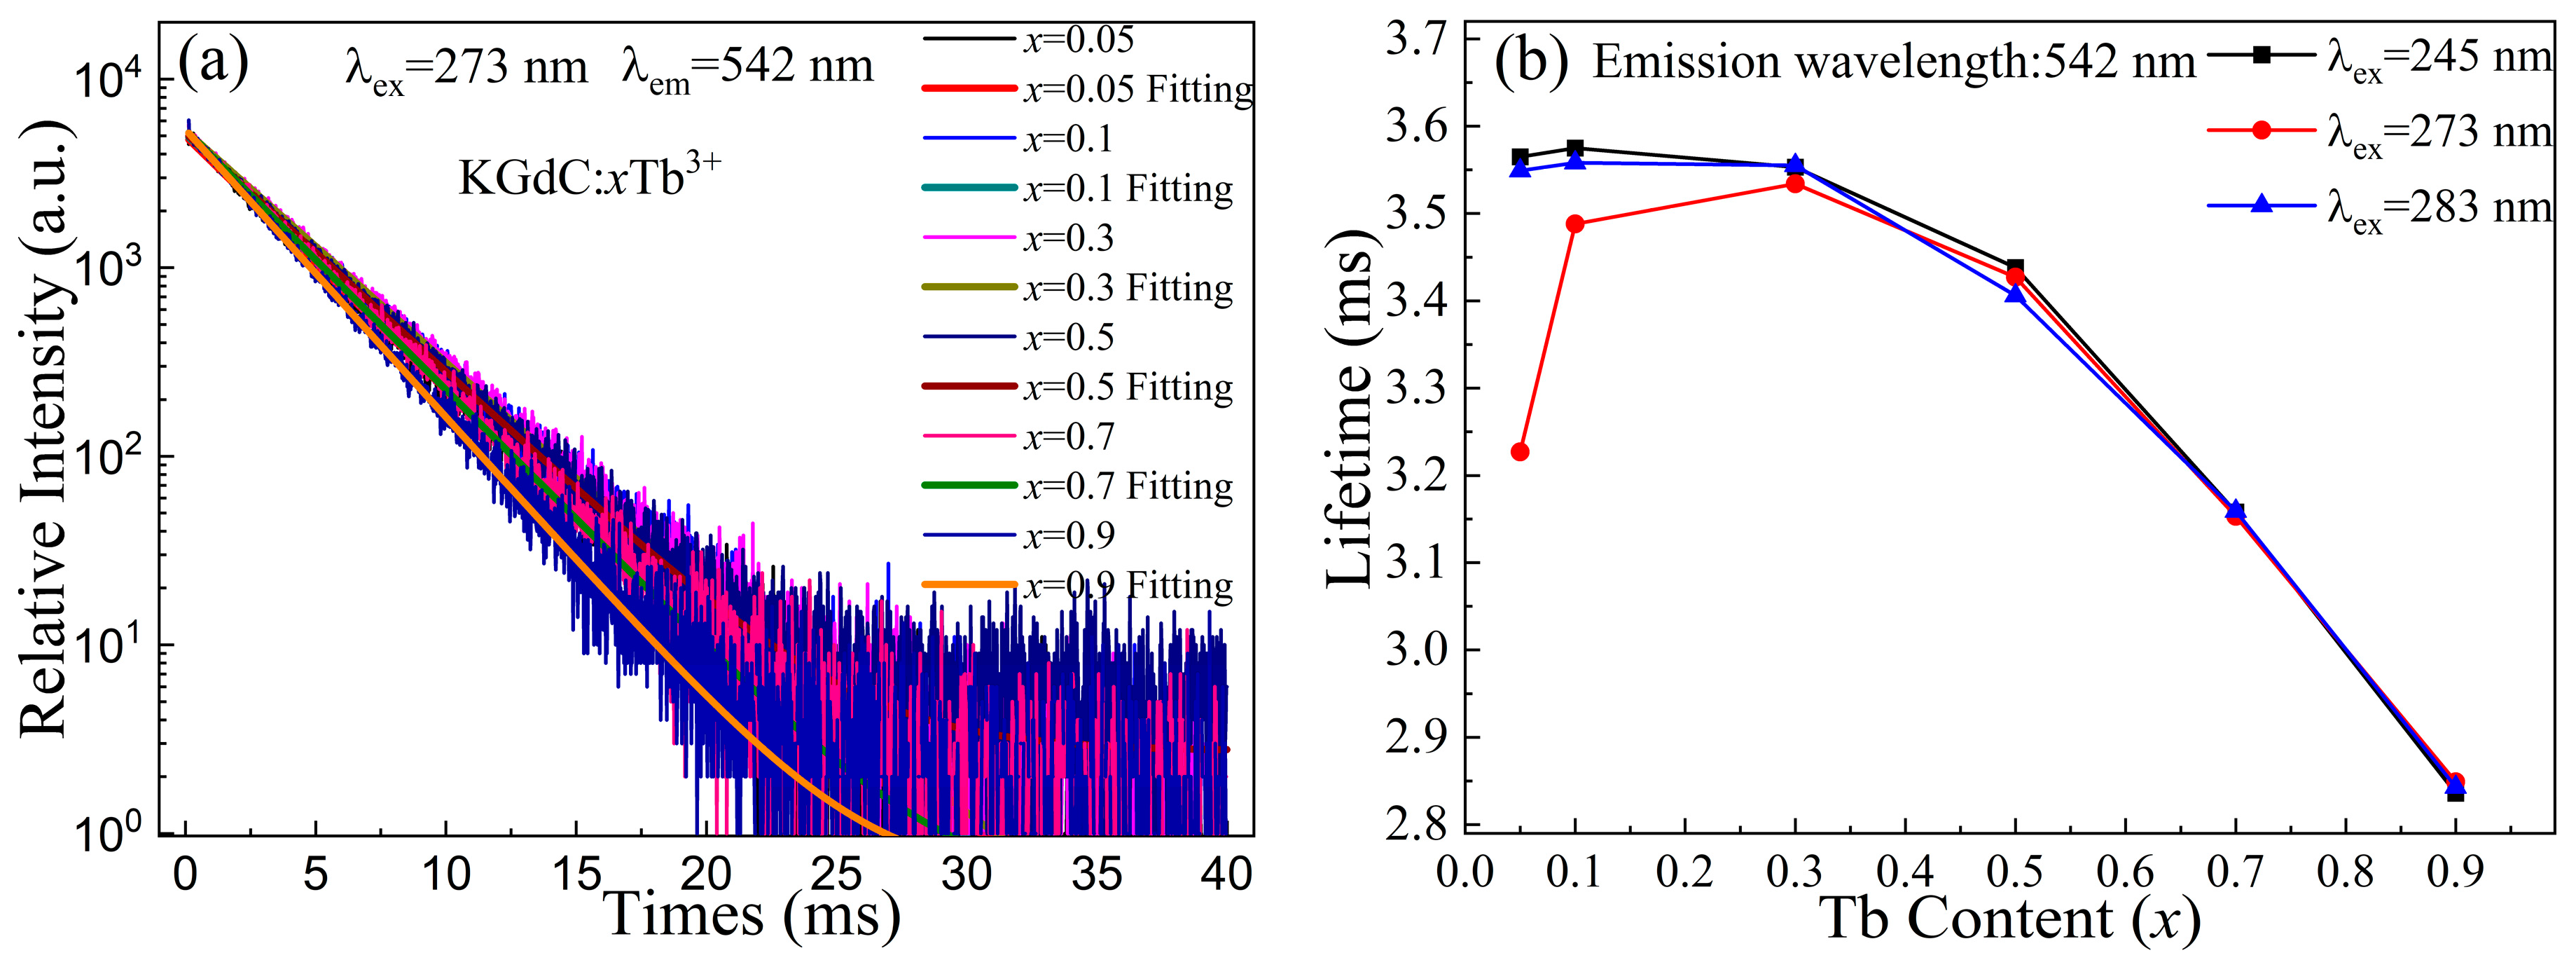
3.6. Decay Curve
4. Conclusions
Author Contributions
Funding
Data Availability Statement
Acknowledgments
Conflicts of Interest
References
- Bao, S.; Yu, H.; Gao, G.; Zhu, H.; Wang, D.; Zhu, P.; Wang, G. Rare-earth single atom based luminescent composite nanomaterials: Tunable full-color single phosphor and applications in WLEDs. Nano Res. 2022, 15, 3594–3605. [Google Scholar] [CrossRef]
- Van Do, P.; Quang, V.X.; Thanh, L.D.; Tuyen, V.P.; Ca, N.X.; Hoa, V.X.; Van Tuyen, H. Energy transfer and white light emission of KGdF4 polycrystalline co-doped with Tb3+/Sm3+ ions. Opt. Mater. 2019, 92, 174–180. [Google Scholar] [CrossRef]
- Jaiswal, S.R.; Nagpure, P.A.; Omanwar, S.K. Improvement of quantum efficiency through Gd3+ to Eu3+ energy transfer in YF3 phosphor. Luminescence 2021, 36, 1395–1401. [Google Scholar] [CrossRef] [PubMed]
- Zhang, F.; Xie, J.; Li, G.; Zhang, W.; Wang, Y.; Huang, Y.; Tao, Y. Cation composition sensitive visible quantum cutting behavior of high efficiency green phosphors Ca9Ln(PO4)7:Tb3+ (Ln = Y, La, Gd). J. Mater. Chem. C 2017, 5, 872–881. [Google Scholar] [CrossRef]
- Ramakrishna, P.; Padhi, R.K.; Mohapatra, D.K.; Jena, H.; Panigrahi, B.S. Structural characterization, Gd3+→Eu3+ energy transfer and radiative properties of Gd/Eu in codoped Li2O–ZnO–SrO–B2O3–P2O5 glass. Opt. Mater. 2022, 125, 112060. [Google Scholar] [CrossRef]
- Zhong, Y.; Wu, Q.; Zhu, J.; Cai, P.; Du, P. Room-Temperature Synthesis of Highly-Efficient Eu3+-Activated KGd2F7 Red-Emitting Nanoparticles for White Light-Emitting Diode. Nanomaterials 2022, 12, 4397. [Google Scholar] [CrossRef]
- Xu, Z.; Zhu, Q.; Li, X.; Sun, X.; Li, J.-G. White-light emitting (Y,Gd)PO4:Dy3+ microspheres: Gd3+ mediated morphology tailoring and selective energy transfer and correlation of photoluminescence behaviors. Mater. Res. Bull. 2019, 110, 149–158. [Google Scholar] [CrossRef]
- Ye, W.; Wang, Y.; Zhao, C.; Wen, Z.; Cao, Z.; Cao, Z.; Shen, X.; Li, Y.; Yuan, X.; Wang, C.; et al. Optical temperature sensing based on phonon-assisted population of Dy3+ sensitized by Gd3+ in Gd2Ge2O7 nanophosphors. J. Lumin. 2020, 227, 117567. [Google Scholar] [CrossRef]
- Gupta, P.; Bedyal, A.K.; Kumar, V.; Khajuria, Y.; Sharma, V.; Ntwaeaborwa, O.M.; Swart, H.C. Energy transfer mechanism from Gd3+ to Sm3+ in K3Gd(PO4)2:Sm3+ phosphor. Mater. Res. Express 2015, 2, 076202. [Google Scholar] [CrossRef]
- Wantana, N.; Kaewjaeng, S.; Kothan, S.; Kim, H.J.; Kaewkhao, J. Energy transfer from Gd3+ to Sm3+ and luminescence characteristics of CaO–Gd2O3–SiO2–B2O3 scintillating glasses. J. Lumin. 2017, 181, 382–386. [Google Scholar] [CrossRef]
- Carnall, W.; Fields, P.; Rajnak, K. Electronic Energy Levels of the Trivalent Lanthanide Aquo Ions. II. Gd3+. J. Chem. Phys. 1968, 49, 4443–4446. [Google Scholar] [CrossRef]
- Selvalakshmi, T.; Bose, A.C.; Velmathi, S. Effect of Eu3+ and Al3+ Concentrations on Photoluminescence of Gd2O3:Eu3+. J. Nanosci. Nanotechnol. 2015, 15, 5760–5767. [Google Scholar] [CrossRef] [PubMed]
- Jaiswal, S.; Nagpure, P.; Omanwar, S. Energy Transfer Process in MgF2:Gd3+,Eu3+ Phosphor: Application to Visible Quantum Cutting. Int. J. Sci. Res. Sci. Technol. 2021, 8, 272–276. [Google Scholar]
- Liang, W.; Wang, Y. Visible quantum cutting through downconversion in Eu3+-doped K2GdZr(PO4)3 phosphor. Mater. Chem. Phys. 2010, 119, 214–217. [Google Scholar] [CrossRef]
- Hua, R.; Niu, J.; Chen, B.; Li, M.; Yu, T.; Li, W. Visible quantum cutting in GdF3:Eu3+ nanocrystals via downconversion. Nanotechnology 2006, 17, 1642–1645. [Google Scholar] [CrossRef] [Green Version]
- Chen, Y.; Liu, B.; Shi, C.; Kirm, M.; True, M.; Vielhauer, S.; Zimmerer, G. Luminescent properties of Gd2SiO5 powder doped with Eu3+ under VUV–UV excitation. J. Phys. Condens. Matter 2005, 17, 1217–1224. [Google Scholar] [CrossRef]
- Wegh, R.T.; Donker, H.; Oskam, K.D.; Meijerink, A. Visible Quantum Cutting in LiGdF4:Eu3+ Through Downconversion. Science 1999, 283, 663–666. [Google Scholar] [CrossRef]
- Van der Kolk, E.; Dorenbos, P.; Krämer, K.; Biner, D.; Guedel, H. High-resolution luminescence spectroscopy study of down-conversion routes in NaGdF4:Nd3+ and NaGdF4:Tm3+ using synchrotron radiation. Phys. Rev. B 2008, 77, 125110. [Google Scholar] [CrossRef] [Green Version]
- You, F.; Zhang, X.; Peng, H.; Huang, S.; Huang, Y.; Tao, Y. Energy transfer and luminescent properties of Pr3+ and/or Dy3+ doped NaYF4 and NaGdF4. J. Rare Earths 2013, 31, 1125–1129. [Google Scholar] [CrossRef]
- Hachani, S.; Guerbous, L. Synthesis, Luminescence, and Energy Transfer Properties of YPO4:Gd3+, Eu3+ and YP3O9:Sm3+, Eu3+ Phosphors. J Fluoresc. 2019, 29, 665–672. [Google Scholar] [CrossRef]
- Li, D.; Zhu, G.; Zhao, X. High efficiently color-tunable emission in KTb(CO3)2:Eu3+ phosphors. Opt. Mater. 2021, 119, 111310. [Google Scholar] [CrossRef]
- Li, D.; Zhu, G. Quantum Cutting in Ultraviolet B-Excited KY(CO3)2:Tb3+ Phosphors. Materials 2022, 15, 6160. [Google Scholar] [CrossRef] [PubMed]
- Lin, Y.; Hu, C.-L.; Fang, Z.; Chen, J.; Xie, W.-J.; Chen, Y.; Wang, J.-P.; Mao, J.-G. KRE(CO3)2 (RE = Eu, Gd, Tb): New mixed metal carbonates with strong photoluminescence and large birefringence. Inorg. Chem. Front. 2022, 9, 5645–5652. [Google Scholar] [CrossRef]
- Cao, L.; Peng, G.; Yan, T.; Luo, M.; Lin, C.; Ye, N. Three alkaline-rare earth cations carbonates with large birefringence in the deep UV range. J. Alloys Compd. 2018, 742, 587–593. [Google Scholar] [CrossRef]
- Kutlu, I.; Kalz, H.-J.; Wartchow, R.; Ehrhardt, H.; Seidel, H.; Meyer, G. Kalium-Lanthanoid-Carbonate, KM(CO3)2 (M = Nd, Gd, Dy, Ho, Yb). Z. Anorg. Allg. Chem. 1997, 623, 1753–1758. [Google Scholar] [CrossRef]
- Shannon, R. Revised effective ionic radii and systematic studies of interatomic distances in halides and chalcogenides. Acta Crystallogr. A 1976, 32, 751–767. [Google Scholar] [CrossRef]
- Carnall, W.T.; Fields, P.R.; Rajnak, K. Electronic Energy Levels of the Trivalent Lanthanide Aquo Ions. III. Tb3+. J. Chem. Phys. 1968, 49, 4447–4449. [Google Scholar] [CrossRef]
- Gómez-Morales, J.; Fernández-Penas, R.; Acebedo-Martínez, F.J.; Romero-Castillo, I.; Verdugo-Escamilla, C.; Choquesillo-Lazarte, D.; Esposti, L.D.; Jiménez-Martínez, Y.; Fernández-Sánchez, J.F.; Iafisco, M.; et al. Luminescent Citrate-Functionalized Terbium-Substituted Carbonated Apatite Nanomaterials: Structural Aspects, Sensitized Luminescence, Cytocompatibility, and Cell Uptake Imaging. Nanomaterials 2022, 12, 1257. [Google Scholar] [CrossRef]
- Yang, Z.; Hu, Y.; Chen, L.; Wang, X. Color tuning of Ba2ZnSi2O7:Ce3+,Tb3+ phosphor via energy transfer. J. Lumin. 2014, 153, 412–416. [Google Scholar] [CrossRef]
- Halmurat, D.; Yusufu, T.; Wang, Q.-l.; He, J.; Sidike, A. Rare earth ion Tb3+ doped natural sodium feldspar (NaAlSi3O8) Luminescent properties and energy transfer. Sci. Rep. 2019, 9, 14637. [Google Scholar] [CrossRef] [Green Version]
- Zhou, W.; Zhang, W.; Yin, M. Study on spectroscopic properties of GdOBr: RE3+ (RE = Eu, Tb, Ce). J. Rare Earths 2008, 26, 459–462. [Google Scholar] [CrossRef]
- Omanwar, S.K.; Jaiswal, S.R.; Sawala, N.S.; Koparkar, K.A.; Bhatkar, V.B. Ultra-violet to visible quantum cutting in YPO4:Gd3+,Tb3+ phosphor via down conversion. Mater. Discov. 2017, 7, 15–20. [Google Scholar] [CrossRef]
- Jaiswal, S.R.; Sawala, N.S.; Nagpure, P.A.; Bhatkar, V.B.; Omanwar, S.K. Visible quantum cutting in Tb3+ doped BaGdF5 phosphor for plasma display panel. J. Mater. Sci. Mater. Electron 2017, 28, 2407–2414. [Google Scholar] [CrossRef]
- Xiong, H.; Zhang, Y.; Liu, Y.; Gao, T.; Zhang, L.; Qiao, Z.; Zhang, L.; Gan, S.; Huo, Q. Self-template construction of honeycomb-like mesoporous YPO4:Ln3+ (Ln = Eu, Tb) phosphors with tuneable luminescent properties. J. Alloy. Compd. 2019, 782, 845–851. [Google Scholar] [CrossRef]
- Zhang, D.; Li, G.; Yang, W.; Huang, W.; Leng, Z.; Fang, S.; Li, L. Tunable photoluminescence properties and energy transfer of Ca5(BO3)3F: Tb3+/Eu3+ phosphors for solid state lighting. J. Lumin. 2019, 208, 155–163. [Google Scholar] [CrossRef]
- Li, M.; Wang, L.; Ran, W.; Deng, Z.; Shi, J.; Ren, C. Tunable Luminescence in Sr2MgSi2O7: Tb3+,Eu3+ Phosphors Based on Energy Transfer. Materials 2017, 10, 227. [Google Scholar] [CrossRef] [Green Version]
- Qiao, J.; Zhang, Z.; Zhao, J.; Xia, Z. Tuning of the Compositions and Multiple Activator Sites toward Single-Phased White Emission in (Ca9-xSrx)MgK(PO4)7: Eu2+ Phosphors for Solid-State Lighting. Inorg. Chem. 2019, 58, 5006–5012. [Google Scholar] [CrossRef] [PubMed]
- Yaiphaba, N.; Ningthoujam, R.S.; Singh, N.R.; Vatsa, R.K. Luminescence Properties of Redispersible Tb3+-Doped GdPO4 Nanoparticles Prepared by an Ethylene Glycol Route. Eur. J. Inorg. Chem. 2010, 18, 2682–2687. [Google Scholar] [CrossRef]
- Cao, J.; Chen, W.; Xu, D.; Li, X.; Wei, R.; Chen, L.; Sun, X.; Guo, H. Transparent glass ceramics containing Lu6O5F8: Tb3+ nano-crystals: Enhanced photoluminescence and X-ray excited luminescence. J. Am. Ceram. Soc. 2018, 101, 1585–1591. [Google Scholar] [CrossRef]


Disclaimer/Publisher’s Note: The statements, opinions and data contained in all publications are solely those of the individual author(s) and contributor(s) and not of MDPI and/or the editor(s). MDPI and/or the editor(s) disclaim responsibility for any injury to people or property resulting from any ideas, methods, instructions or products referred to in the content. |
© 2023 by the authors. Licensee MDPI, Basel, Switzerland. This article is an open access article distributed under the terms and conditions of the Creative Commons Attribution (CC BY) license (https://creativecommons.org/licenses/by/4.0/).
Share and Cite
Li, D.; Qian, J.; Huang, L.; Zhang, Y.; Zhu, G. Quantum Cutting in KGd(CO3)2:Tb3+ Green Phosphor. Nanomaterials 2023, 13, 351. https://doi.org/10.3390/nano13020351
Li D, Qian J, Huang L, Zhang Y, Zhu G. Quantum Cutting in KGd(CO3)2:Tb3+ Green Phosphor. Nanomaterials. 2023; 13(2):351. https://doi.org/10.3390/nano13020351
Chicago/Turabian StyleLi, Dechuan, Jian Qian, Lei Huang, Yumeng Zhang, and Guangping Zhu. 2023. "Quantum Cutting in KGd(CO3)2:Tb3+ Green Phosphor" Nanomaterials 13, no. 2: 351. https://doi.org/10.3390/nano13020351