Article

Exchange Bias Demonstrated in Bulk Nanocomposites Processed by High-Pressure Torsion

1
Erich Schmid Institute of Materials Science of the Austrian Academy of Sciences, 8700 Leoben, Austria
2
Institute of Physics, University of Graz, 8010 Graz, Austria
*
Authors to whom correspondence should be addressed.
Nanomaterials 2023, 13(2), 344; https://doi.org/10.3390/nano13020344
Submission received: 7 December 2022 / Revised: 5 January 2023 / Accepted: 11 January 2023 / Published: 14 January 2023

Abstract

:
Ferromagnetic (Fe or Fe20Ni80) and antiferromagnetic (NiO) phases were deformed by high-pressure torsion, a severe plastic deformation technique, to manufacture bulk-sized nanocomposites and demonstrate an exchange bias, which has been reported predominantly for bilayer thin films. High-pressure torsion deformation at elevated temperatures proved to be the key to obtaining homogeneous bulk nanocomposites. X-ray diffraction investigations detected nanocrystallinity of the ferromagnetic and antiferromagnetic phases. Furthermore, an additional phase was identified by X-ray diffraction, which formed during deformation at elevated temperatures through the reduction of NiO by Fe. Depending on the initial powder composition of Fe50NiO50 or Fe10Ni40NiO50 the new phase was magnetite or maghemite, respectively. Magnetometry measurements demonstrated an exchange bias in high-pressure torsion-processed bulk nanocomposites. Additionally, the tailoring of magnetic parameters was demonstrated by the application of different strains or post-process annealing. A correlation between the amount of applied strain and exchange bias was found. The increase of exchange bias through applied strain was related to the microstructural refinement of the nanocomposite. The nanocrystalline maghemite was considered to have a crucial impact on the observed changes of exchange bias through applied strain.

Graphical Abstract

1. Introduction

The introduction and application of nanomaterials are indispensable for progress in technological development. The use of nanomaterials is already well advanced and ranges from applications in medicine (targeted drug delivery for cancer treatment) [1], catalysis (optimisation of the nanostructure of the catalyst to improve the selectivity and efficiency of catalytic processes [2], such as the enhanced reduction of volatile organic compounds [3]), gas sensors [4], microelectronics [5] to engineering [6].
Metallic nanomaterials have outstanding physical properties, such as superior strength, superior hardness and enhanced wear resistance, and attracted the attention of engineers to reduce weight to improve efficiency for transportation vehicles [6,7].
The importance of magnetic materials for power efficiency is commonly known. Material scientist focus here on the improvement of the nanostructure of soft- or hard-magnetic materials to enhance the magnetic properties [8,9]. The important role of nanocrystalline microstructure can be demonstrated for hard magnetic materials. Here, highly textured nanocrystals are considered to be the key to pushing the energy product ( B H ) of a hard magnetic material to its theoretical maximum of B H m a x = 1 / 4 μ 0 M S 2 ( μ 0 ...vacuum permeability and MS...saturation magnetisation) [9,10]. An increase in B H of the hard magnetic material leads to a reduction of weight and size of permanent magnet motors/generators and this addresses directly the need for power efficiency [11]. Although synthesis of nanocrystalline material has been challenging, a variety of methods have been established to obtain the desired nanocrystalline state, (e.g., inert gas condensation, electrodeposition, mechanical alloying, crystallisation out of an amorphous state and severe plastic deformation (SPD)) [12]. Regarding synthesis, SPD methods, especially high-pressure torsion (HPT), offer unique advantages. For example, it is possible to process a bulk nanocrystalline sample based on powder blends, which allows for a large variety of phase combinations. With HPT it is possible to synthesise supersaturated solid solutions [13] or influence the magnetic properties of the nanocrystalline sample through the application of strain [14,15,16,17].
The focus of this study was on the use of rare-earth free phases due to their abundant availability. Therefore, the choices for a suitable ferromagnetic (FM) material were limited to Fe, Ni or FeNi-alloys. Fe was chosen, because of the vast base of experience available concerning HPT-deformation [18]. A suitable alternative FM-phase is the γ -Fe20Ni80-alloy, which possesses lower MS compared to Fe and far larger domain wall width than Fe or Ni. Those two properties of γ -Fe20Ni80 are regarded as beneficial to the enhancement of exchange bias (Heb).
The Heb was first observed by Meiklejohn and Bean on Co-CoO nanoparticles and introduced as ‘new unidirectional anisotropy’ [19]. Heb originates from an FM spin exchange coupling mechanism between the surface spins of adjacent antiferromagnetic (AFM) and FM phases and allows the preservation of an external magnetic field direction through the alignment of AFM surface spins during field cooling (FC) below the Neél temperature (TN). This phenomenon causes a biased shift of the hysteresis in the FC direction.
A further aim of this study was to use a material, which exhibits AFM properties at room temperature (RT). NiO has the benefit of possessing a face-centred cubic crystal structure with a smaller lattice parameter mismatch to Fe or γ -Fe20Ni80-alloy compared to other possible AFM materials (e.g., FeS or α -Fe2O3), and is also AFM far above RT; it was, therefore, the material of choice.
Until recently, such material combinations have mainly been realised by thin film deposition techniques to study the interfacial phenomenon of Heb [20], due to its technical application in magnetic read heads for hard-disc drives [21]. Consequently, previous investigations have been limited to 2D structures. A first successful synthesis by HPT of bulk composites, which possess an Heb, has been reported for the Co-NiO system [17].
The aim of this study was to obtain a bulk nanocomposite possessing enhanced magnetic properties, Heb and be able to demonstrate tailoring of magnetic parameters via applied strain. Furthermore, to investigate in an initial trial of the new bulk nanocomposite regarding their nanostructure and the influence of the nanostructure on the magnetic properties.
A material synthesis with a metallic and an oxide phase can be a challenging task, especially for HPT, if a homogeneous microstructure is desired. Although oxide ceramics (i.e., Al2O3, ZrO2, TiO2 and Y2O3) have been processed previously with HPT [22], the present study has investigated for the first time the deformation process in combination with nanostructural characterisation and magnetic characterisation systematically to provide a detailed description of the FM-AFM bulk nanocomposite.
A further aim was to attain deeper insight into the HPT-deformation process of NiO itself and its interaction with the mechanically softer FM phase. The importance of HPT processing at elevated temperatures was demonstrated to synthesise homogeneous bulk nanocomposites. In addition to the tailoring of magnetic properties, an unusually high Vickers microhardness was detected, when the NiO phase was preserved during deformation.

2. Materials and Methods

Commercially available powders (Fe-Mateck Fe-99.9% 100 + 200 mesh, Ni-Alfa Aesar Ni 99.9% 100 + 325 mesh, NiO-Alfa Aesar NiO 99.8% 325 mesh) were used. All powder compositions are labelled in –at%, if not otherwise noted. Powders were stored and prepared inside a glove box filled with Ar-atmosphere. For powder consolidation with HPT, an airtight capsule was used to prevent the powder from oxidation. The capsule itself enclosed the HPT anvils, which can move freely only in the axial direction for powder blend compaction. The obtained pellet was used later on in a second step for HPT-deformation Figure A1. The processed sample discs had dimensions of ( 8 × 0.6 ) mm [23]. The process parameters were the following: applied hydrostatic pressure of 6 GPa, rotation speed ω = 1.25 min 1 and deformation temperatures (Tdef) of 200–300 °C. The Tdef was provided by inductive heating of both anvils during the processing, and the temperature was controlled by a pyrometer [18]. Samples deformed at RT were cooled with pressurised air to ensure the temperature stability of the sample. Equivalent von Mises strain ( ϵ vM) was calculated with ϵ v M = ( 2 π N r ) / ( 3 t ) (N...applied rotations, r...radius and t...sample thickness) [23].
Scanning electron microscopy (SEM; LEO-1525 Carl Zeiss GmbH, Oberkochen, Germany) was used in backscattered electron mode (BSE; Model 7426, Oxford Instruments plc, Cambridge, England, United Kingdom) with an acceleration voltage of 20 kV. Energy dispersive X-ray spectroscopy (EDX; XFlash 6–60, Bruker Corporation, Berlin, Germany) analysis with SEM was performed at 5 kV to maximise lateral resolution. To assign the corresponding radial position to the SEM images, the ends of the examined HPT half discs were determined during the SEM examination. r∼0 mm was defined as the half distance between both ends, and r∼3 mm was determined by the relative distance to r∼0 mm. r∼3 mm was cross-checked by measuring the relative distance to the end of the disc, which should be 1 mm. Hardness measurements were performed with a Micromet 5104 from Buehler (Düsseldorf, Germany) with an indention load of 500 g along the radial direction every 250 μ m.
For X-ray diffraction (XRD), samples were polished on the top side and analysed with a D2 Phaser with a Co-K α source (Bruker Corporation, Billerica, MA, USA). XRD data from synchrotron measurements were collected in transmission mode at Deutsches Elektronen-Synchrotron (DESY, Hamburg, Germany) at the beamline P07B (high energy materials science) with a beam energy of 87.1 keV and a beam size of 0.5 × 0.5 mm 2 . All wide-angle X-ray scattering (WAXS) measurements were done in axial direction [16] and the data were gained with a Perkin Elmer XRD 1621 flat panel detector (Waltham, MA, United States). Peak analysis was done with a self-written script in Octave (version 6.2.0) based on the pseudo-Voigt method to determine the integral breadth and coherent scattering domain size (CSDS) [24] via Scherrer-relation for spherical crystallites. As an XRD-reference pattern the American Mineralogist Crystal Structure Database (AMCSD) is used (Fe: AMCSD 0012931, Ni: AMCSD 0012932, NiO: AMCSD 0017028, γ -Fe2O3: AMCSD 0020516, α -Fe2O3: AMCSD 0000143 and Fe3O4: AMCSD 0009109).
The annealing experiments were done within a vacuum furnace (XTube, type-1200, Xerion Advanced Heating, Berlin, Germany). For sample preparation, a deformed HPT disc was cut in quarters. One-quarter of the sample material was used to obtain probing material for magnetometry measurements from the same radial position, and the other quarters for microstructural characterisation. For the annealing experiment itself, one full quarter and one sample for magnetometry measurements were heated up to 450 °C or 550 °C in a vacuum of 10 6 mbar or better and kept at the specific temperature for one hour.
Magnetometry samples were prepared with a diamond wire saw and samples were cut out at desired radial position, having a volume of ∼2 mm3 or less [16]. Due to the sample dimensions, the applied strain, as mentioned for the magnetometry measurements, is an average value and related to the centre of mass of the measured sample.
Field cooling was performed with the applied magnetic field parallel to the radial direction from above the corresponding Néel-temperature from NiO of TN∼524 K [25] to RT inside a vacuum chamber at 10 4 mbar or better. An electromagnet provided a magnetic field of ∼10 kOe. The field cooling was subsequently continued below RT, realised by a superconducting quantum interference device (SQUID) from Quantum Design MPMS-XL-7 (San Diego, CA, USA) from RT to 8 K at 10 kOe, which was further used to determine magnetic hysteresis loops for the Fe10Ni40NiO50 composition. Measurements were executed at 8 K with a maximum magnetic field strength of ±70 kOe to ensure magnetic saturation. After determining HC1 and HC2, the Heb can be calculated with H e b = ( H C 1 + H C 2 ) / 2 . The coercivity of the symmetric hysteresis is determined by H C = ( ( ) H C 1 + H C 2 ) / 2 . MS was approximated with a linear fit from the saturated branches of hysteresis to obtain MS at the intercept with the ordinate.

3. Results

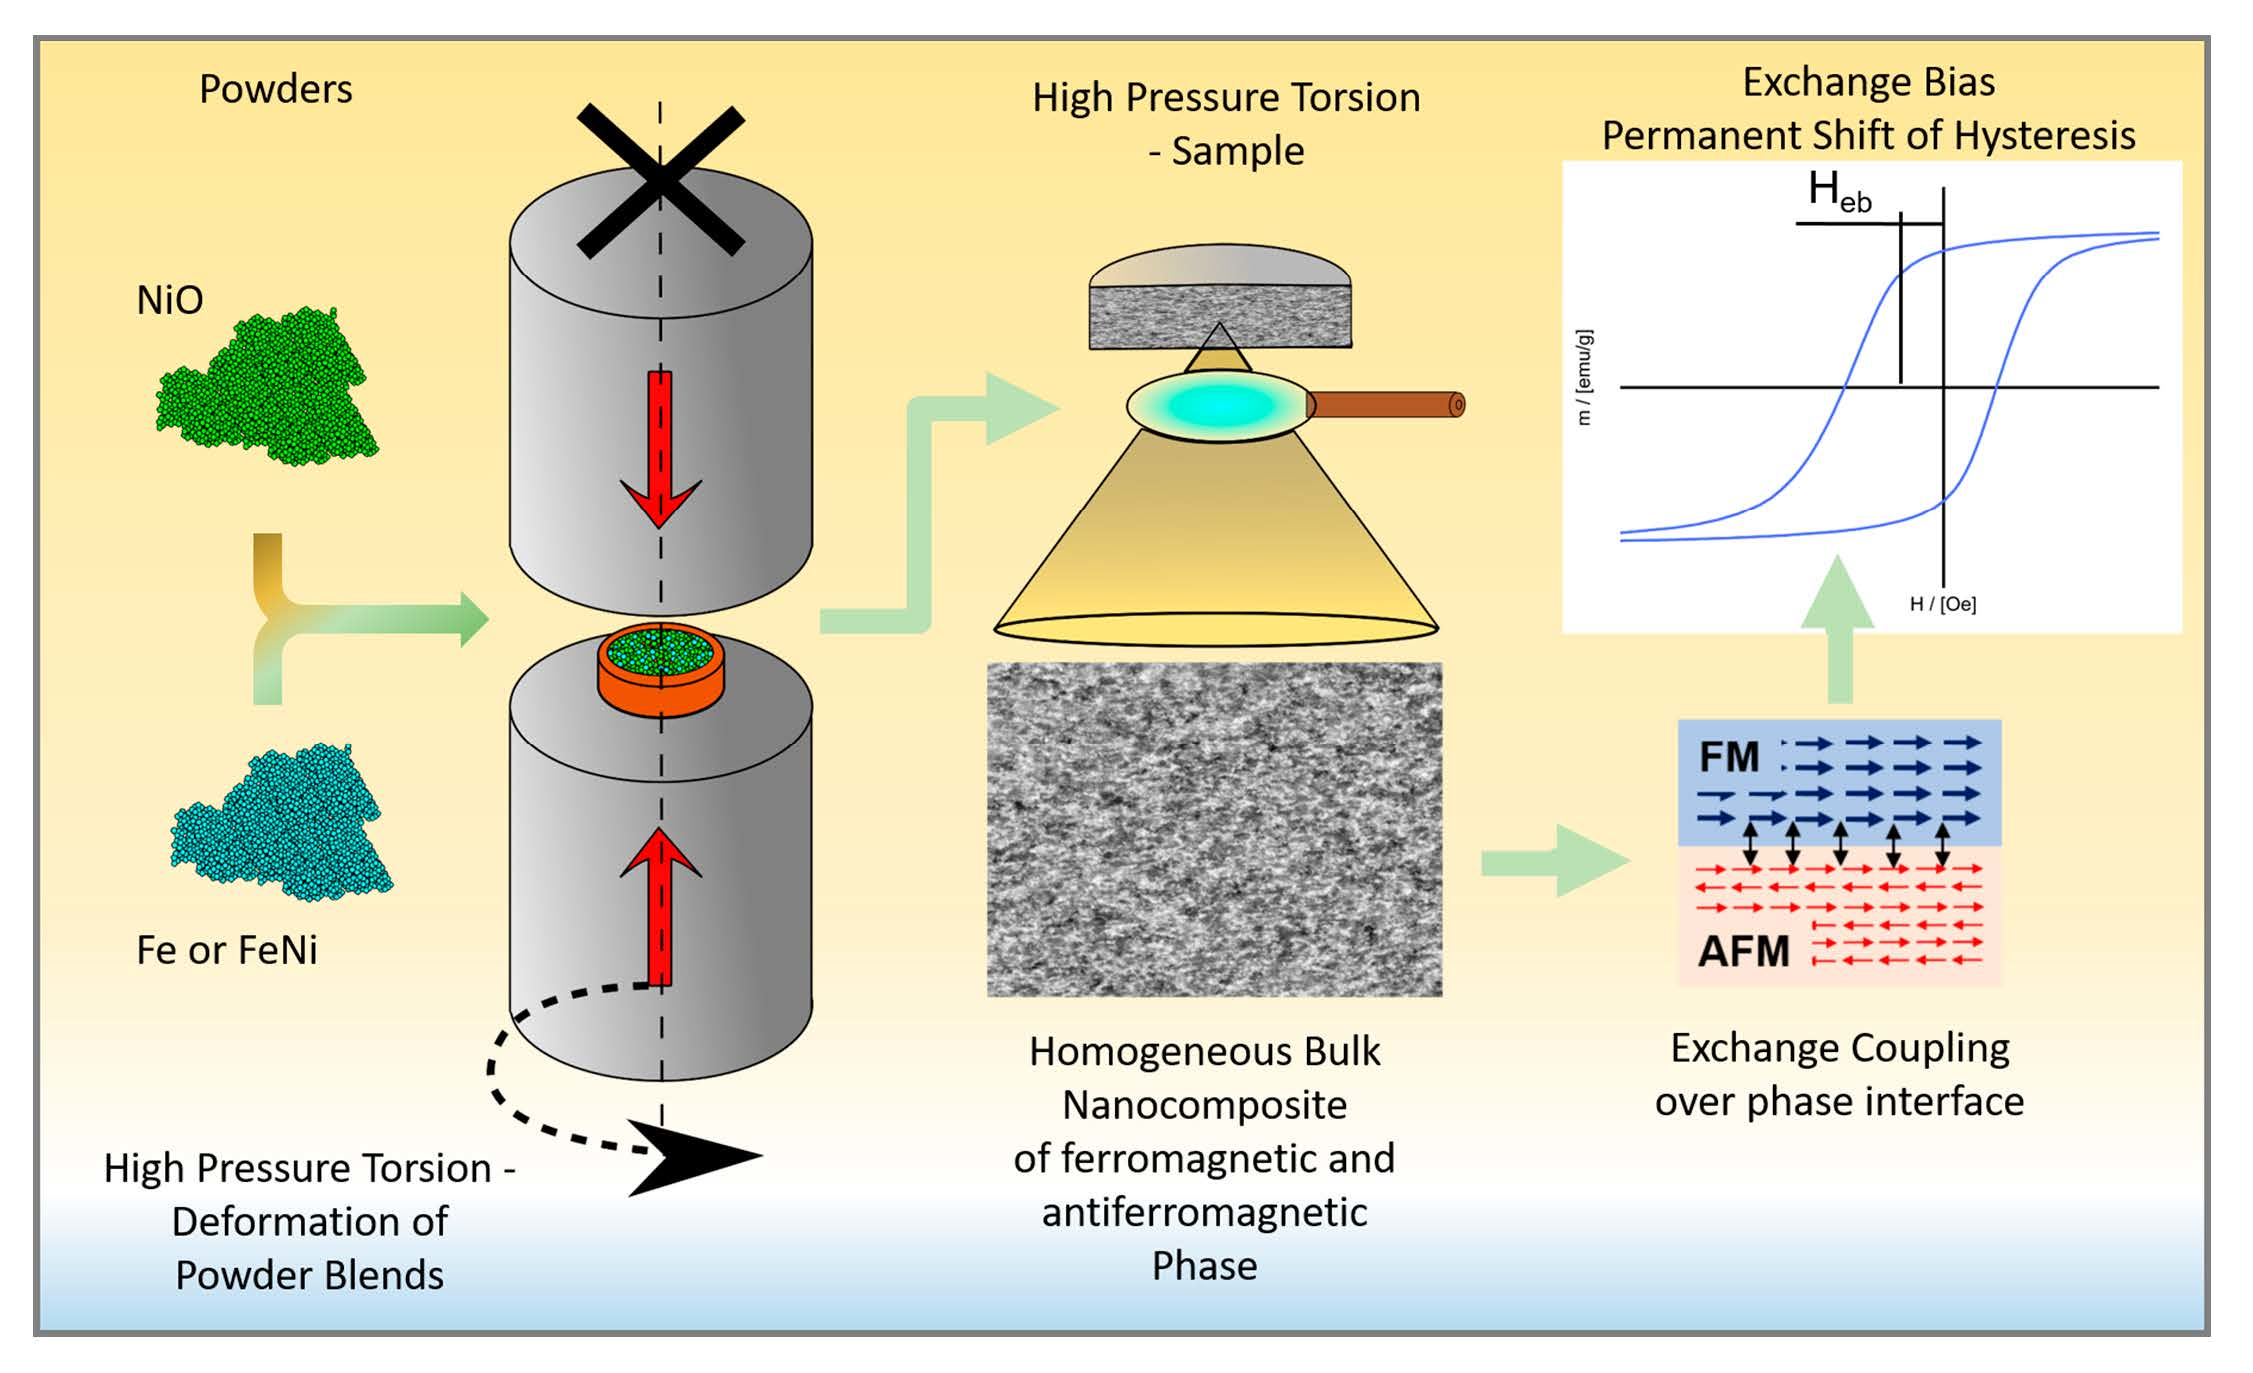
3.1. Hardness and Microstructural Evolution

3.1.1. Fe50NiO50 Composition

The first composition investigated was the binary Fe50NiO50 (Fe42.8NiO57.2 in -wt%) blend. Figure 1a,b present SEM micrographs at r∼0 mm and r∼3 mm. Both samples were processed with 100 rotations and the deformation temperature was increased from RT (Figure 1a) to 300 °C (Figure 1b). This yielded an applied strain for Tdef = RT of ϵ vM∼1760 and for Tdef = 300 °C a ϵ vM∼1490 at r∼3 mm, due to a slight height difference. For the sample processed at RT, EDX measurements confirmed that the dark phase seen in BSE contrast consisted of NiO, while the bright phase was identified as Fe-phase.
When processed at RT, both phases formed lamella structures (Figure 1a). Although the applied strain was high, the expected refinement of the two-phase microstructure was not observed. Within the phases, grain refinement was evident at r∼3 mm. Vickers microhardness measurements detected an increase of microhardness, (Figure 1c) and confirmed the ongoing refinement, which was seen in SEM within the phases. This observation indicated that the applied strain had acted in the composite to a certain degree. However, whether the total amount of applied strain had been absorbed by the composite through deformation was in question. The deformation at RT of samples with NiO of 50-at% (Figure 1a) or higher was considered to be unsuccessful because the samples had inhomogeneous microstructure and the FM-phase dimensions were too large for observing an Heb.
Deformation at elevated temperatures improved the deformation behaviour of the nanocomposites and led to a homogeneous microstructure (Figure 1b). SEM micrographs indicated that a homogeneous two-phase microstructure had been formed, having microstructural refinement from r∼0 mm to r∼3 mm. The large NiO structures, which were observed for Tdef = RT, were not observed for Tdef = 300 °C in the SEM micrographs along the sample radius. Here, the dark phase, which is shown in BSE-contrast, was determined by EDX measurements in combination with XRD-results (Figure 2) as Fe3O4 and the bright phase was identified as a FeNi-phase.
Vickers microhardness measurements detected a large difference in hardness between samples deformed at RT and 300 °C (Figure 1c). For the Tdef = 300 °C composite, hardness values were considerably higher than for the RT sample, varying from 6 GPa at r∼0 mm ( ϵ vM∼0) to 6.8 GPa at r∼3 mm ( ϵ vM∼1740). Above r∼1.5 mm the Tdef = 300 °C composite became microstructurally saturated according to Vickers microhardness measurements.
Further deformation experiments were conducted at deformation temperatures between RT and 300 °C (Tdef = 200 °C, 225 °C, 250 °C and 275 °C) to gain insight into the onset of the microstructural homogenisation. Figure 1e displays SEM micrographs at r∼3 mm. At Tdef = 200 °C, the microstructure was identical to that at RT; however, at Tdef = 225 °C, the large NiO structures had become more and more refined through the application of strain. This process continued for Tdef = 250 °C and Tdef = 275 °C, gradually extending from the outer radius to the inner radius. At Tdef = 275 °C, the microstructure is comparable to the Tdef = 300 °C samples at r∼3 mm, but still large NiO structures were observed for Tdef = 275 °C at r 2 mm (not shown).
The obtained Vicker microhardness values reflected the observations from SEM. In Figure 1d hardness results at the outer radius are summarised. The inhomogeneous microstructure of the sample deformed at Tdef = 200 °C had a lower microhardness (5 GPa) than those of samples deformed at temperatures Tdef ≥ 225 °C, which were approximately 6 to 7 GPa at r∼3 mm and similar to the hardness values of the sample deformed at Tdef = 300 °C. All samples processed at elevated temperatures exhibited significantly higher Vickers microhardness values than the sample processed at RT.
Phase analysis with XRD detected Fe and NiO phases for the samples deformed at RT and 200 °C with an onset of Fe3O4 formation at Tdef = 200 °C (Figure 2). An increase of deformation temperature from Tdef = 225 °C to Tdef = 300 °C yielded a continuously growing amount of Fe3O4, caused by the reduction of NiO through Fe. Ni became available to build the γ -FeNi phase, which was detected in the XRD scans. The content of Fe within the γ -FeNi phase could be approximated through the shift to lower q-values. This shift is caused by the substitution of Fe-atoms within the Ni lattice, resulting in an enlargement of the lattice parameter. This enlargement is caused by the higher atomic radius of Fe compared to Ni [26]. The shifted peaks of γ -FeNi phase for Tdef = 300 °C implied a composition of approximately γ -Fe39Ni61.
The quality of the XRD patterns and similarity of Fe3O4 and maghemite ( γ -Fe2O3) patterns allowed a determination of FexOy phase only at higher qz ≥ 3.5 Å 1 . The peaks at qz = 3.889 Å 1 and qz = 4.235 Å 1 , for example, are in accordance with the Fe3O4 pattern. Presence of γ -Fe2O3 could not be excluded, but apparently Fe3O4 dominated the XRD-pattern; γ -Fe2O3 was therefore omitted in the following consideration for the Fe50NiO50 nanocomposite.
The assumption that the α -Fe phase had been completely consumed by the formation of Fe3O4 or γ -FeNi, allowed estimation of the residual NiO. Using the known composition of γ -Fe39Ni61 phase for the sample deformed at Tdef = 300 °C, yielded a residual NiO-phase of maximum 16-wt%, which should have been left after synthesis inside the sample, but could not be resolved by the laboratory XRD-equipment due to overlapping XRD-peaks (Figure 2). Although the sample deformed at Tdef = 300 °C had a promising microstructure, this nanocomposite was considered unsuitable for observing a significant Heb in subsequent magnetometry measurements because it did not contain large amounts of NiO according to the XRD results.
The CSDS was calculated via Scherrer-relation of Fe50NiO50 sample at RT and Tdef = 300 °C displayed nanocrystallinity, whereby Fe3O4 had the largest CSDS. Considering residual strain with the Williamson-Hall (WH) method [24] and comparing results, strain in the Fe3O4-phase is almost half compared to γ -FeNi. Strain-free CSDS estimations yielded approximately 45 nm for both analysed phases at Tdef = 300 °C (Table 1).

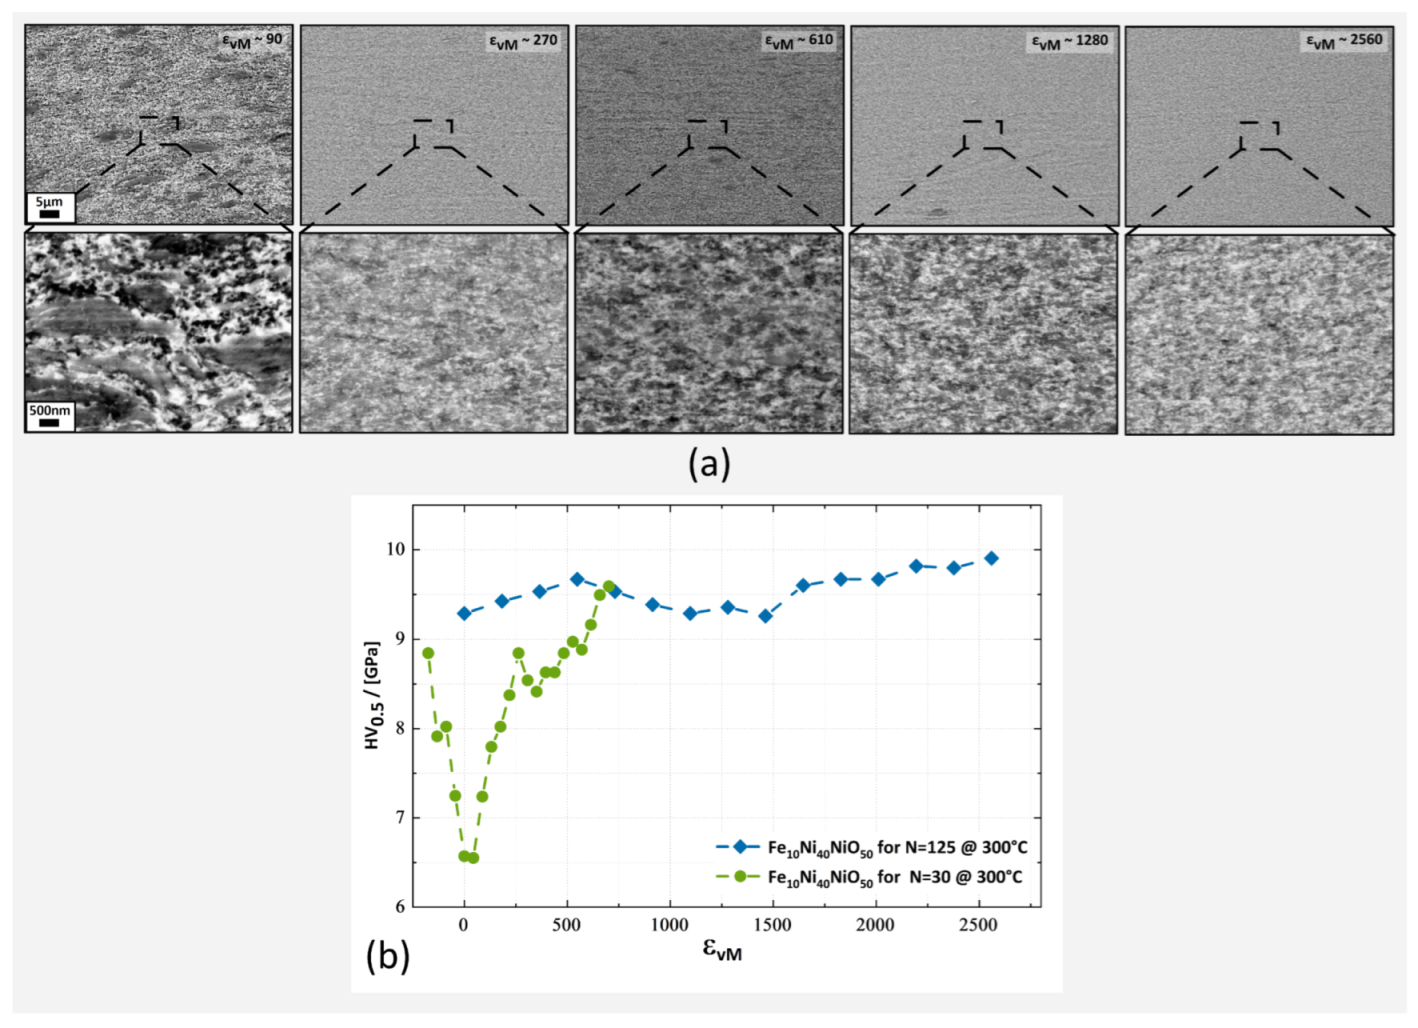
3.1.2. Fe10Ni40NiO50 Composition

To reduce the loss of NiO at 300 °C, another composition of Fe10Ni40NiO50 (Fe8.4Ni35.4NiO56.2 in wt%) was tested with the idea to conserve the NiO-phase by alloying Ni initially with Fe to prevent the reduction of NiO.
The microstructures depicted in Figure 3a were collected from two samples; one has been deformed with 30 rotations the other with 125 rotations; all other parameters were equal. For the micrographs shown, the applied strain was ϵ v M ∼90 (≜r∼0.5 mm) and ϵ v M ∼610 (≜r∼3.5 mm) for the sample with 30 rotations. For the sample with 125 rotations, the applied strain was equivalent to: ϵ v M ∼270 (≜r∼0.375 mm), ϵ v M ∼1280 (≜r∼1.75 mm) and ϵ v M ∼2560 (≜r∼3.5 mm). Due to the homogeneous microstructure, a uniform deformation of the sample material was assumed and applied strain was therefore used rather than the radius. The dark phase was identified as NiO and the bright phase as Ni. The microstructure was different from the Fe50NiO50 sample deformed at Tdef = 300 °C (for comparison Figure 1b). Through the preservation of NiO, a fragmentation process of NiO was realised, leading to a highly diverse Ni and NiO nanocomposite structure. Additionally, SEM micrographs demonstrated a refinement of the nanocomposite microstructure with an increase in applied strain.
Vickers microhardness measurements along the radial direction demonstrated a microstructural saturation at ϵ v M ∼700 of 9.3 GPa in microhardness for the Fe10Ni40NiO50 sample after 125 rotations, (Figure 3b). Beyond ϵ v M ∼700, further deformation caused only a small increase in microhardness of approximately 0.6 GPa to 9.9 GPa, which correlated with the minor refinement seen in SEM between ϵ v M ∼1280 to ϵ v M ∼2560. Vickers microhardness values of 9.3 to 9.9 GPa were significantly higher than previously reported results from similar nanocrystalline materials [27,28].
Synchrotron WAXS investigations were conducted along the axial direction for the following applied strains: ϵ v M ∼270, ϵ v M ∼1280, and ϵ v M ∼2560. Detected phases were NiO, Ni and γ -Fe2O3. However, the γ -Fe2O3 peaks could not be directly identified. The comparison of WAXS patterns of the as-deformed and post-process annealed samples (Section 3.1.3) showed a slight shift from the Fe3O4 to the γ -Fe2O3 reference pattern (Figure 4). This shift became more evident in the calculated peak centres.
According to the WAXS measurements, the FM phase consisted of solely Ni. An expected substitution of Fe was thus not detectable with WAXS and implied that the main part of Fe was consumed by the formation of γ -Fe2O3. The WAXS results allowed estimation of the residual amount of NiO within the sample and yielded the following composition: Ni48.6NiO39.4 and ( γ -Fe2O3)12, all in wt%.
Integral peak breadth analysation with the Scherrer-relation showed minor changes of CSDS for Ni and NiO, but the CSDS of γ -Fe2O3 reduced by 50% with applied strain (Table 2). The residual strain was approximated via the WH method and for NiO was approximately a factor of 10 higher than for Ni.

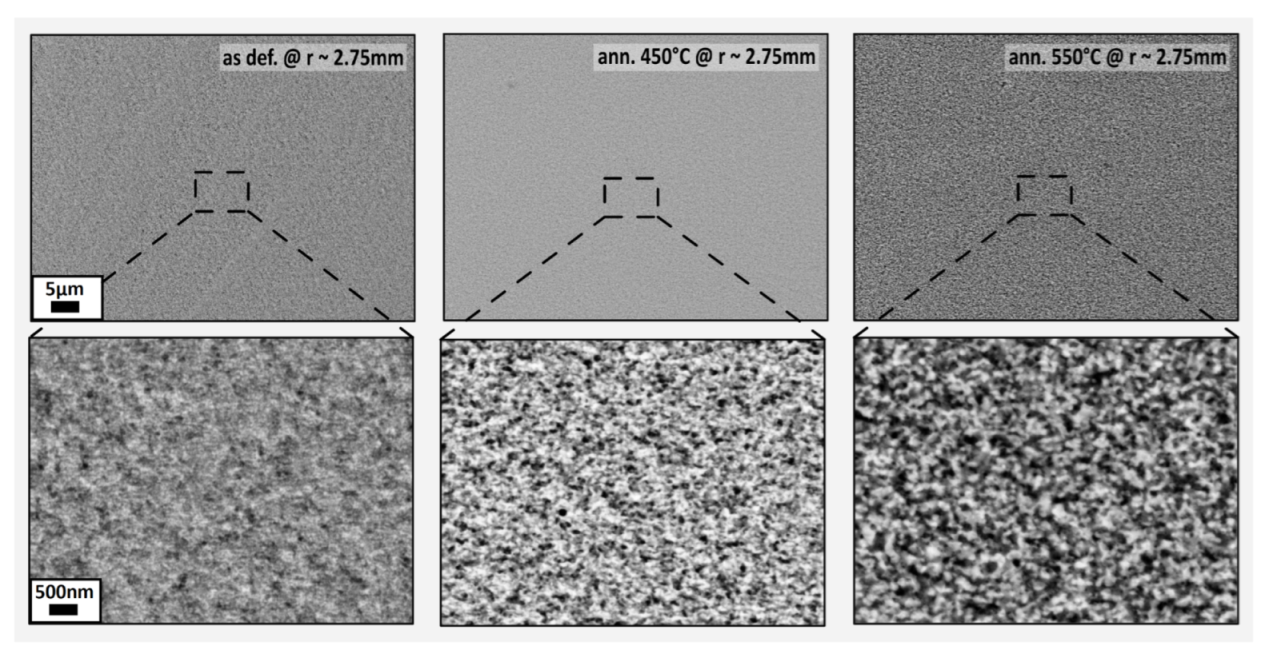
3.1.3. Annealing of Fe10Ni40NiO50 Composition

Because of the complex microstructure of the nanocomposite after deformation, the effects of post-process annealing were investigated to understand the influence of phase growth and phase interface morphology on the magnetic properties of the Fe10Ni40NiO50 sample better. Hence, sample material with a large amount of applied strain ϵ v M ∼1150 (r∼2.75 mm) was used to have.
The SEM micrographs are displayed in Figure 5 for the following states: as-deformed, annealed in vacuum at 450 °C and 550 °C. For the as-deformed state, the complex phase interface was assumed to have large variations in topography at a nanometre scale, which was expected to simplify through annealing. The contrast in BSE mode has been enhanced for the annealed samples. This enhancement indicated a phase growth of the bright and dark phases. The annealing led to a reduction of phase interface, which was expected to be predominantly driven by the optimization of Gibbs free energy.
XRD-peak analysation affirmed the rise of CSDS for all three detected phases (Table 2), whereby γ -Fe2O3 had the highest increase in relative crystallite size of approximately two times to its initial CSDS in the as-deformed state. The relative CSDS growth of Ni and NiO-phase during annealing was significantly smaller.

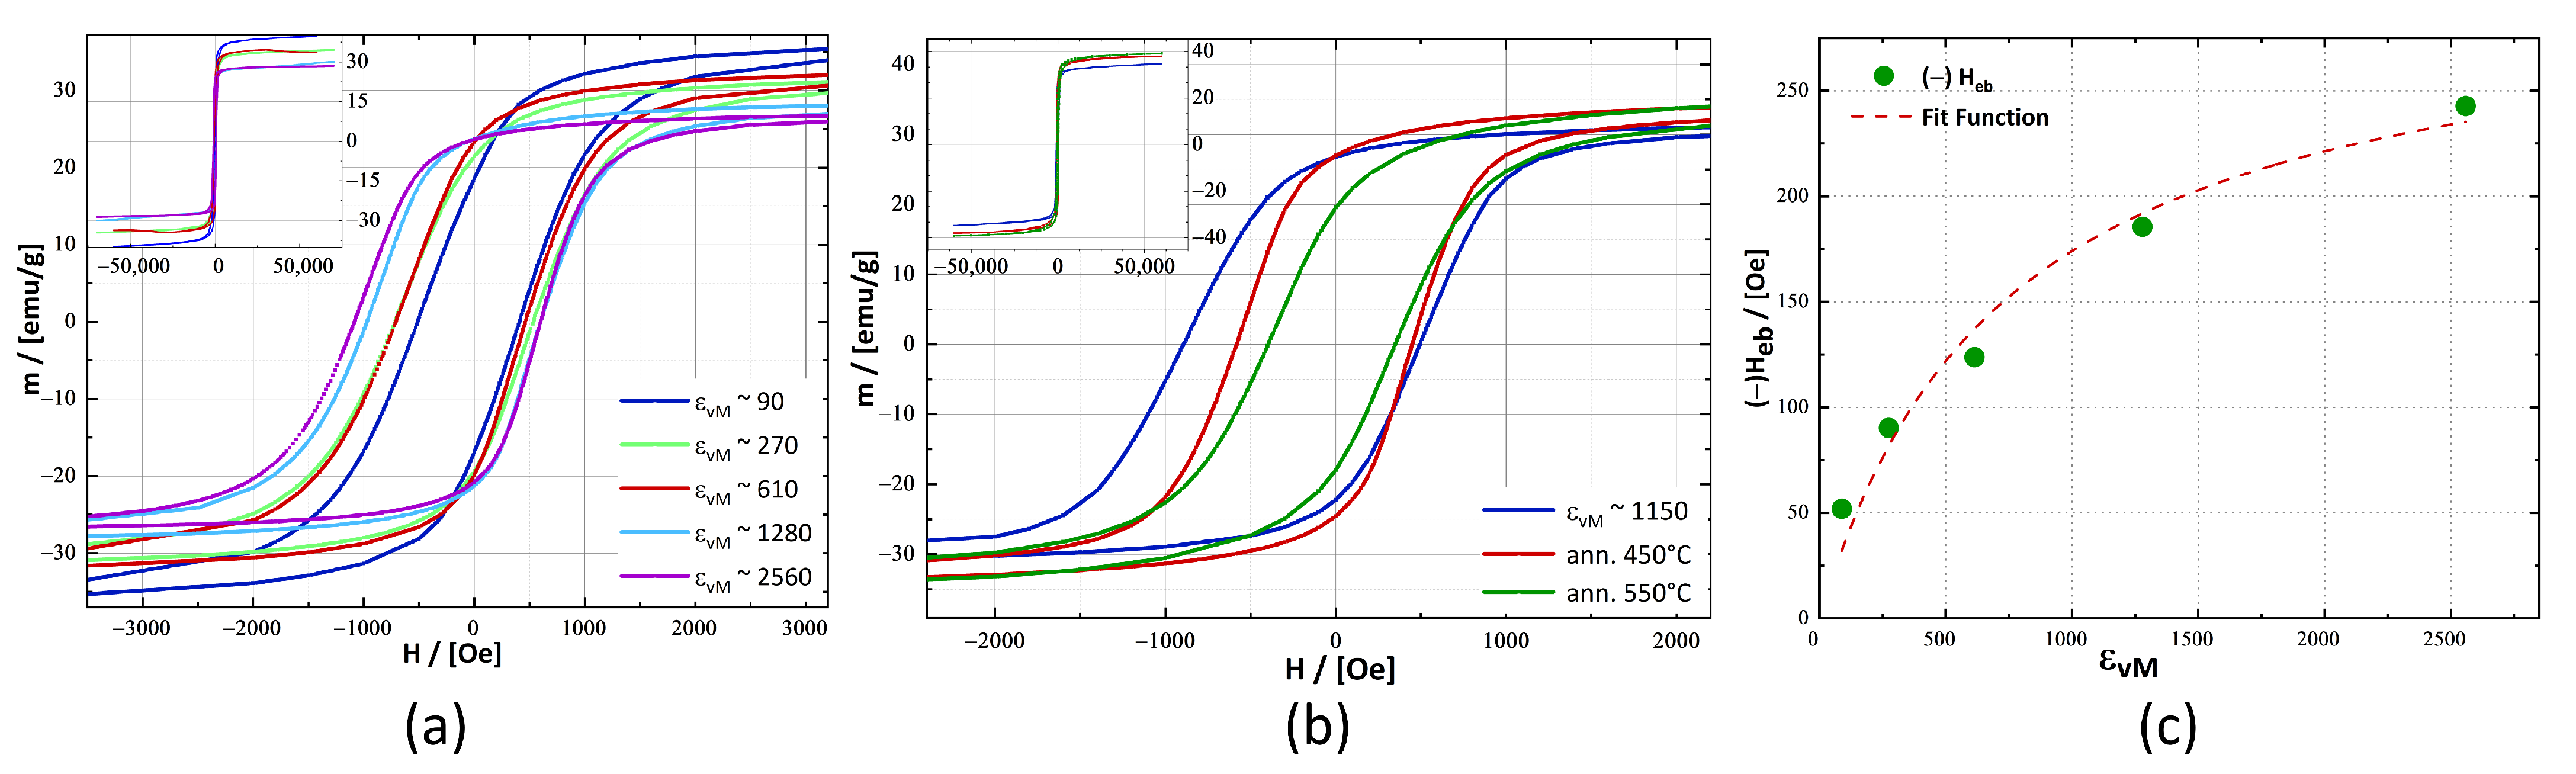
3.2. Magnetic Characterisation

For SQUID investigations, the promising microstructures of the Fe10Ni40NiO50 samples were chosen. The hysteresis loops are shown in Figure 6a have a continuously growing Heb, which could be correlated to the refinement of microstructure through the application of strain. The applied strain changed the hysteresis loop characteristic in general. As MS decreased, coercivity rose. The coercivity nearly doubled from ϵ v M ∼90 with HC = 460 Oe to ϵ v M ∼2560 having HC = 842 Oe. Magnetic remanence (MR) rose from MR = 18.5 emu/g to MR = 23.3 emu/g at ϵ v M ∼610 and became independent of the applied strain for further deformation. Heb started at ϵ v M ∼90 with Heb = −52 Oe and ended at ϵ v M ∼2560 with Heb = −243 Oe (Table 3). As mentioned previously, MS reduced from MS, ϵ v M ∼90 = 37.2 emu/g to MS, ϵ v M ∼2560 = 27.5 emu/g. These changes in MS and Heb appeared to be interrelated and might have had their origins in the detected changes in CSDS, enlargement of phase interfaces and the generation of γ -Fe2O3.
The slight increase in Vickers microhardness detected at r ≤ 1.25 mm (Figure 3b) was therefore confirmed through the continuously growing Heb for such high amounts of applied strain and was in accordance with the impression of an ongoing refinement gained by SEM and XRD investigations.
Figure 6b shows hysteresis loops of the annealed samples at 8 K. The annealing treatment caused a drastic reduction of Heb from Heb, ϵ v M ∼1150 = −200 Oe to Heb,ann. 550 °C = −23 Oe and MR (Table 3), whereas MS became larger, changing from MS, ϵ v M ∼1150 = 32.3 emu/g to MS,ann. 550°C = 36.6 emu/g. The rise of MS with annealing treatment correlated with the detected growth of CSDS for all involved phases (Table 2).
The annealing initiated topological changes in the phase interface morphology, leading to a reduction of interface roughness. This would be considered to affect the Heb as well [29,30], but its impact would be minor compared to the growth of phase size, especially in a polycrystalline sample [30]. The enlargement of FM-phase dimensions is qualitatively evident in the SEM micrographs shown in Figure 5 and is presumed to have been the main reason for the decline of Heb by facilitating magnetic nucleation within the FM-phase, after annealing had been applied.
The detected change in Heb versus applied strain for the Fe10Ni40NiO50 nanocomposite displayed a saturation behaviour similar to the microstructural saturation in single-phase systems previously reported for several phases deformed by HPT [18,31]. A simple fit model based on an asymptotic approximation yielded, for an asymptotic limit, an Heb,max of 300 Oe (Figure 6c) for the Fe10Ni40NiO50 composite. The fit model is not based on a physical theory and was only used here to approximate an assumed saturation of Heb through saturation of microstructural refinement.

4. Discussion

4.1. Deformation Behaviour

The deformation with HPT of composites containing ‘ductile-brittle’ phases has been reported for several phase systems including, Cu-Co and Cu-W [32,33]. For those systems, a fracturing of the ‘-brittle’ phase has been proposed to have a crucial influence on the refinement and homogenisation of the sample’s microstructure. Considering the Fe50NiO50 sample at RT, such fragmentation was not observed to an extensive degree. However, that does not imply that NiO cannot deform at RT. As shown in Figure 1a at RT the Fe and NiO deformed to lamella structures, but then reached a ’steady state’ without fragmentation of the NiO phase in reasonably large amounts. This effect is clear when the SEM micrographs at r∼0 mm and r∼3 mm are compared (Figure 1a). In contrast, Vickers microhardness increased with a radius for the sample deformed at RT, indicating an ongoing grain refinement within the phases (Figure 1c), which appeared to occur predominantly in the more ductile α -Fe phase.
With a body-centred cubic crystal structure, α -Fe has {110}<-111> as the primary slip system at RT. The {110}<-111> slip system family fulfils the von Mises criterion of five independent slip systems for the absorption of general strain via slip [34]. The mechanical properties of α -Fe are therefore different compared to ceramics such as NiO, which has a NaCl crystal structure with the primary slip systems {110}<1-10> at RT [34]. Basic consideration reveals, that such NaCl structures have two independent slip systems and that the von Mises criterion is not fulfilled; the absorption of plasticity by NiO is consequently limited. Hence, NiO cannot absorb general strain through slip, and the likelihood of the fragmentation of polycrystalline NiO is increased by the lack of matching slip systems of adjacent grains [34].
These considerations are important for a better understanding of the deformation process in such complex systems. Whether the initial phase is α -Fe or Ni, both phases are more ductile at RT than NiO. It could be that, especially at RT, the applied strain is absorbed by the α -Fe to a large extent, as the activation of slip is assumed to be easier in α -Fe than in the NiO-phase. It is plausible that through the elevated deformation temperatures, the activation of the additional slip systems is eased in NiO. The increased likelihood of slip in NiO could enhance fragmentation and consequently phase mixing. The eased activation of slip systems in NiO could be one reason for the drastic change of deformation behaviour at Tdef≥ 225 °C, which was seen for the Fe50NiO50 samples.
The discrete change of deformation behaviour between 200 °C and 225 °C (Figure 1e), could not be related to a specific transition temperature. Although NiO has a TN of ∼251 °C [25], the expected change of plasticity around the TN was not reported in [35]. The brittle-to-ductile transition temperature (BDTT) of NiO has been reported to be ∼0.3 of the melting temperature or approximately ∼600 °C [36], which is still significantly above 225 °C. In the same study, a brittle-to-ductile transition region was noted, ranging from 300 °C to ∼550 °C. Above 550 °C, NiO is considered to be ductile due to the activation of additional slip systems [36].
A further important point is the slip transfer across phase boundaries, which was observed in [37,38]. The likelihood for a glide or dislocation transfer between phases is higher, if the angle mismatch of adjacent slip systems is at a minimum [38], in addition to other conditions mentioned in [38]. HPT processing at elevated temperatures could lower the activation energy of additional slip systems within NiO. Therefore, the likelihood of dislocation transfer between adjacent phases is increased, because more slip systems are available inside NiO, if processed at elevated temperatures. This assumption could also explain the abrupt change in deformation behaviour observed in the Fe50NiO50 samples, when Tdef was elevated from Tdef = 200 °C to Tdef = 225 °C.
Furthermore, the possibility cannot be excluded, that the application of high hydrostatic pressure reduced the activation energy of additional slip systems in NiO and caused a shift to lower BDTT. Activation of additional slip systems through hydrostatic pressure has been discussed in the literature [39,40] and has been demonstrated for an Mg-alloy, in which non-basal glide systems were activated with an applied pressure of ∼125 MPa [40].
Eased slip in NiO can lead to a roughening of interface morphology on a nanometre scale; this effect has been observed in other two-phase systems [37]. The absorption of dislocations from local pile-ups could cause local plastic instabilities, which are believed to support fragmentation of the more brittle phase, as discussed in a recent study [13].
When the Fe10Ni40NiO50 composition was deformed at Tdef = 300 °C, the NiO-phase was conserved. In addition to the previously discussed impact of slip system activation and dislocation transfer in NiO, a work-hardening of the softer phase could also result in an enhanced fragmentation of NiO. Such a phenomenon has been reported for the Cu-Co-system during HPT-deformation [32]. The conservation of NiO facilitates a prolonged fragmentation, which could lead to the fine distribution of NiO embedded in Ni (Figure 3a).
NiO can break off from larger agglomerates, which would ease the reduction by Fe through the creation of additional phase interfaces. It is likely that the accumulation of γ -Fe2O3 occurs at phase interfaces or the grain boundary (GB). These small and dispersed clusters of γ -Fe2O3 could inhibit GB motion and accelerate grain refinement. In addition, through the efficient fragmentation of NiO, a highly diverse Ni and NiO-phase structure is created on a microscale, significantly hindering GB motion and plastic deformation. Both phenomena could have led to the small observed CSDS of approximately 20 nm according to the WH method at ϵ v M > 1280 (Table 2) and could have caused the unusually high Vickers microhardness of 9 to 9.9 GPa.
The mismatch of slip systems and lattice parameters of participating phases, especially between γ -Fe2O3 and the Ni- and NiO phases, could have led to a dislocation pile-up at the γ -Fe2O3 phase, resulting in the creation of a non-crystalline region at the phase interface adjacent to γ -Fe2O3. Previous research has cited the build-up of a non-crystalline region at the phase interface of the Cu-Nb system as creating an impenetrable barrier for dislocation [41].
Comparing the observed Vickers microhardness values in Figure 3b to the results obtained for nanocrystalline Ni [27] or slightly oxidized Ni-powder processed by HPT [28] shows the influence of a nanostructured NiO phase on mechanical properties. Despite the reported high hardness values of approximately 7 GPa for nanocrystalline Ni or Ni with NiO clusters [27,28] the bulk nanocomposite of Fe10Ni40NiO50 surpassed these results by 30–40%.

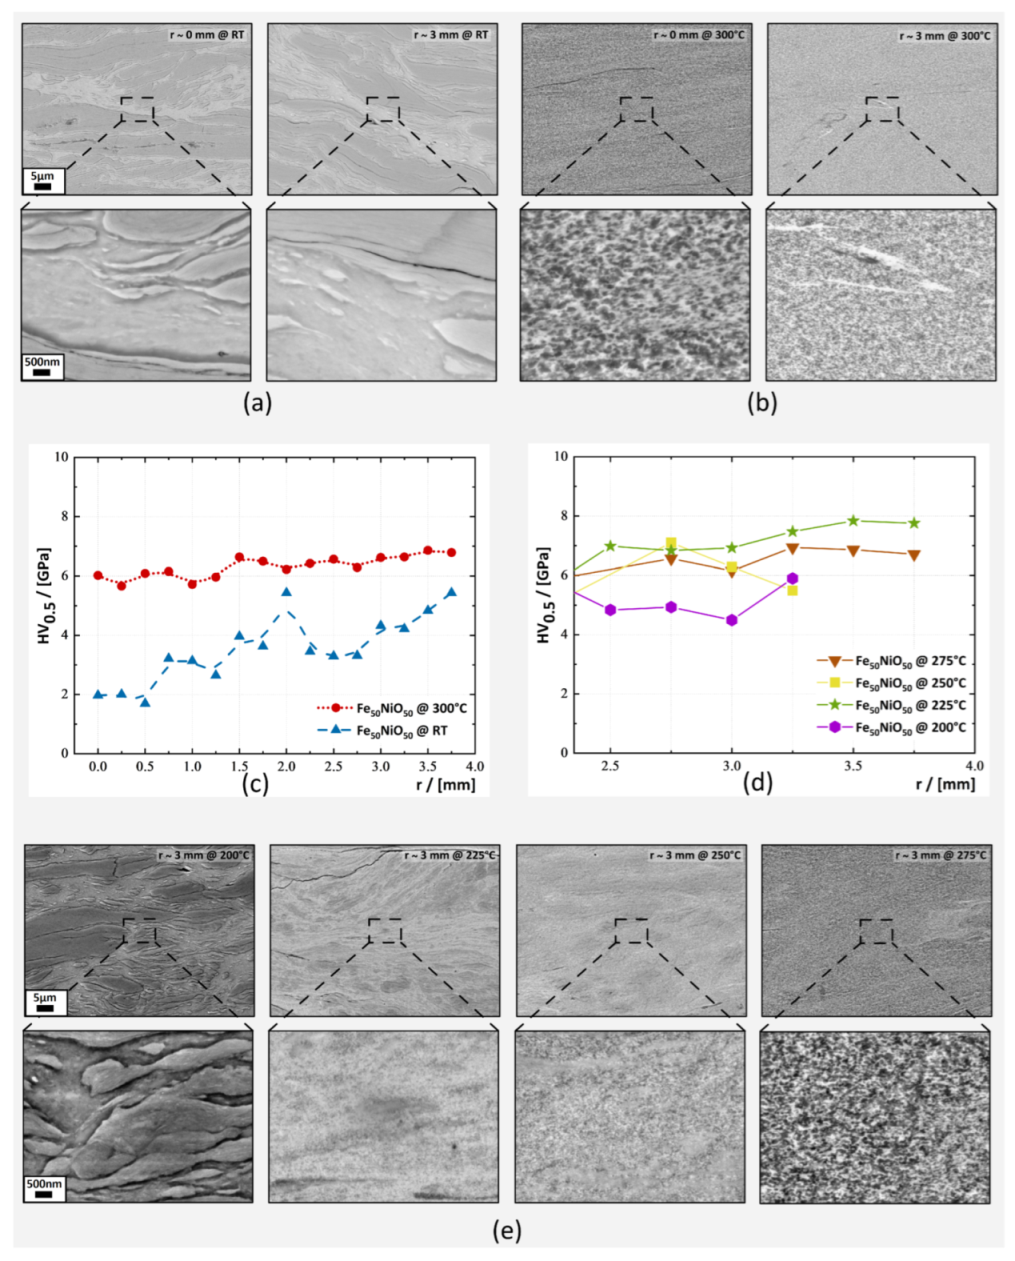
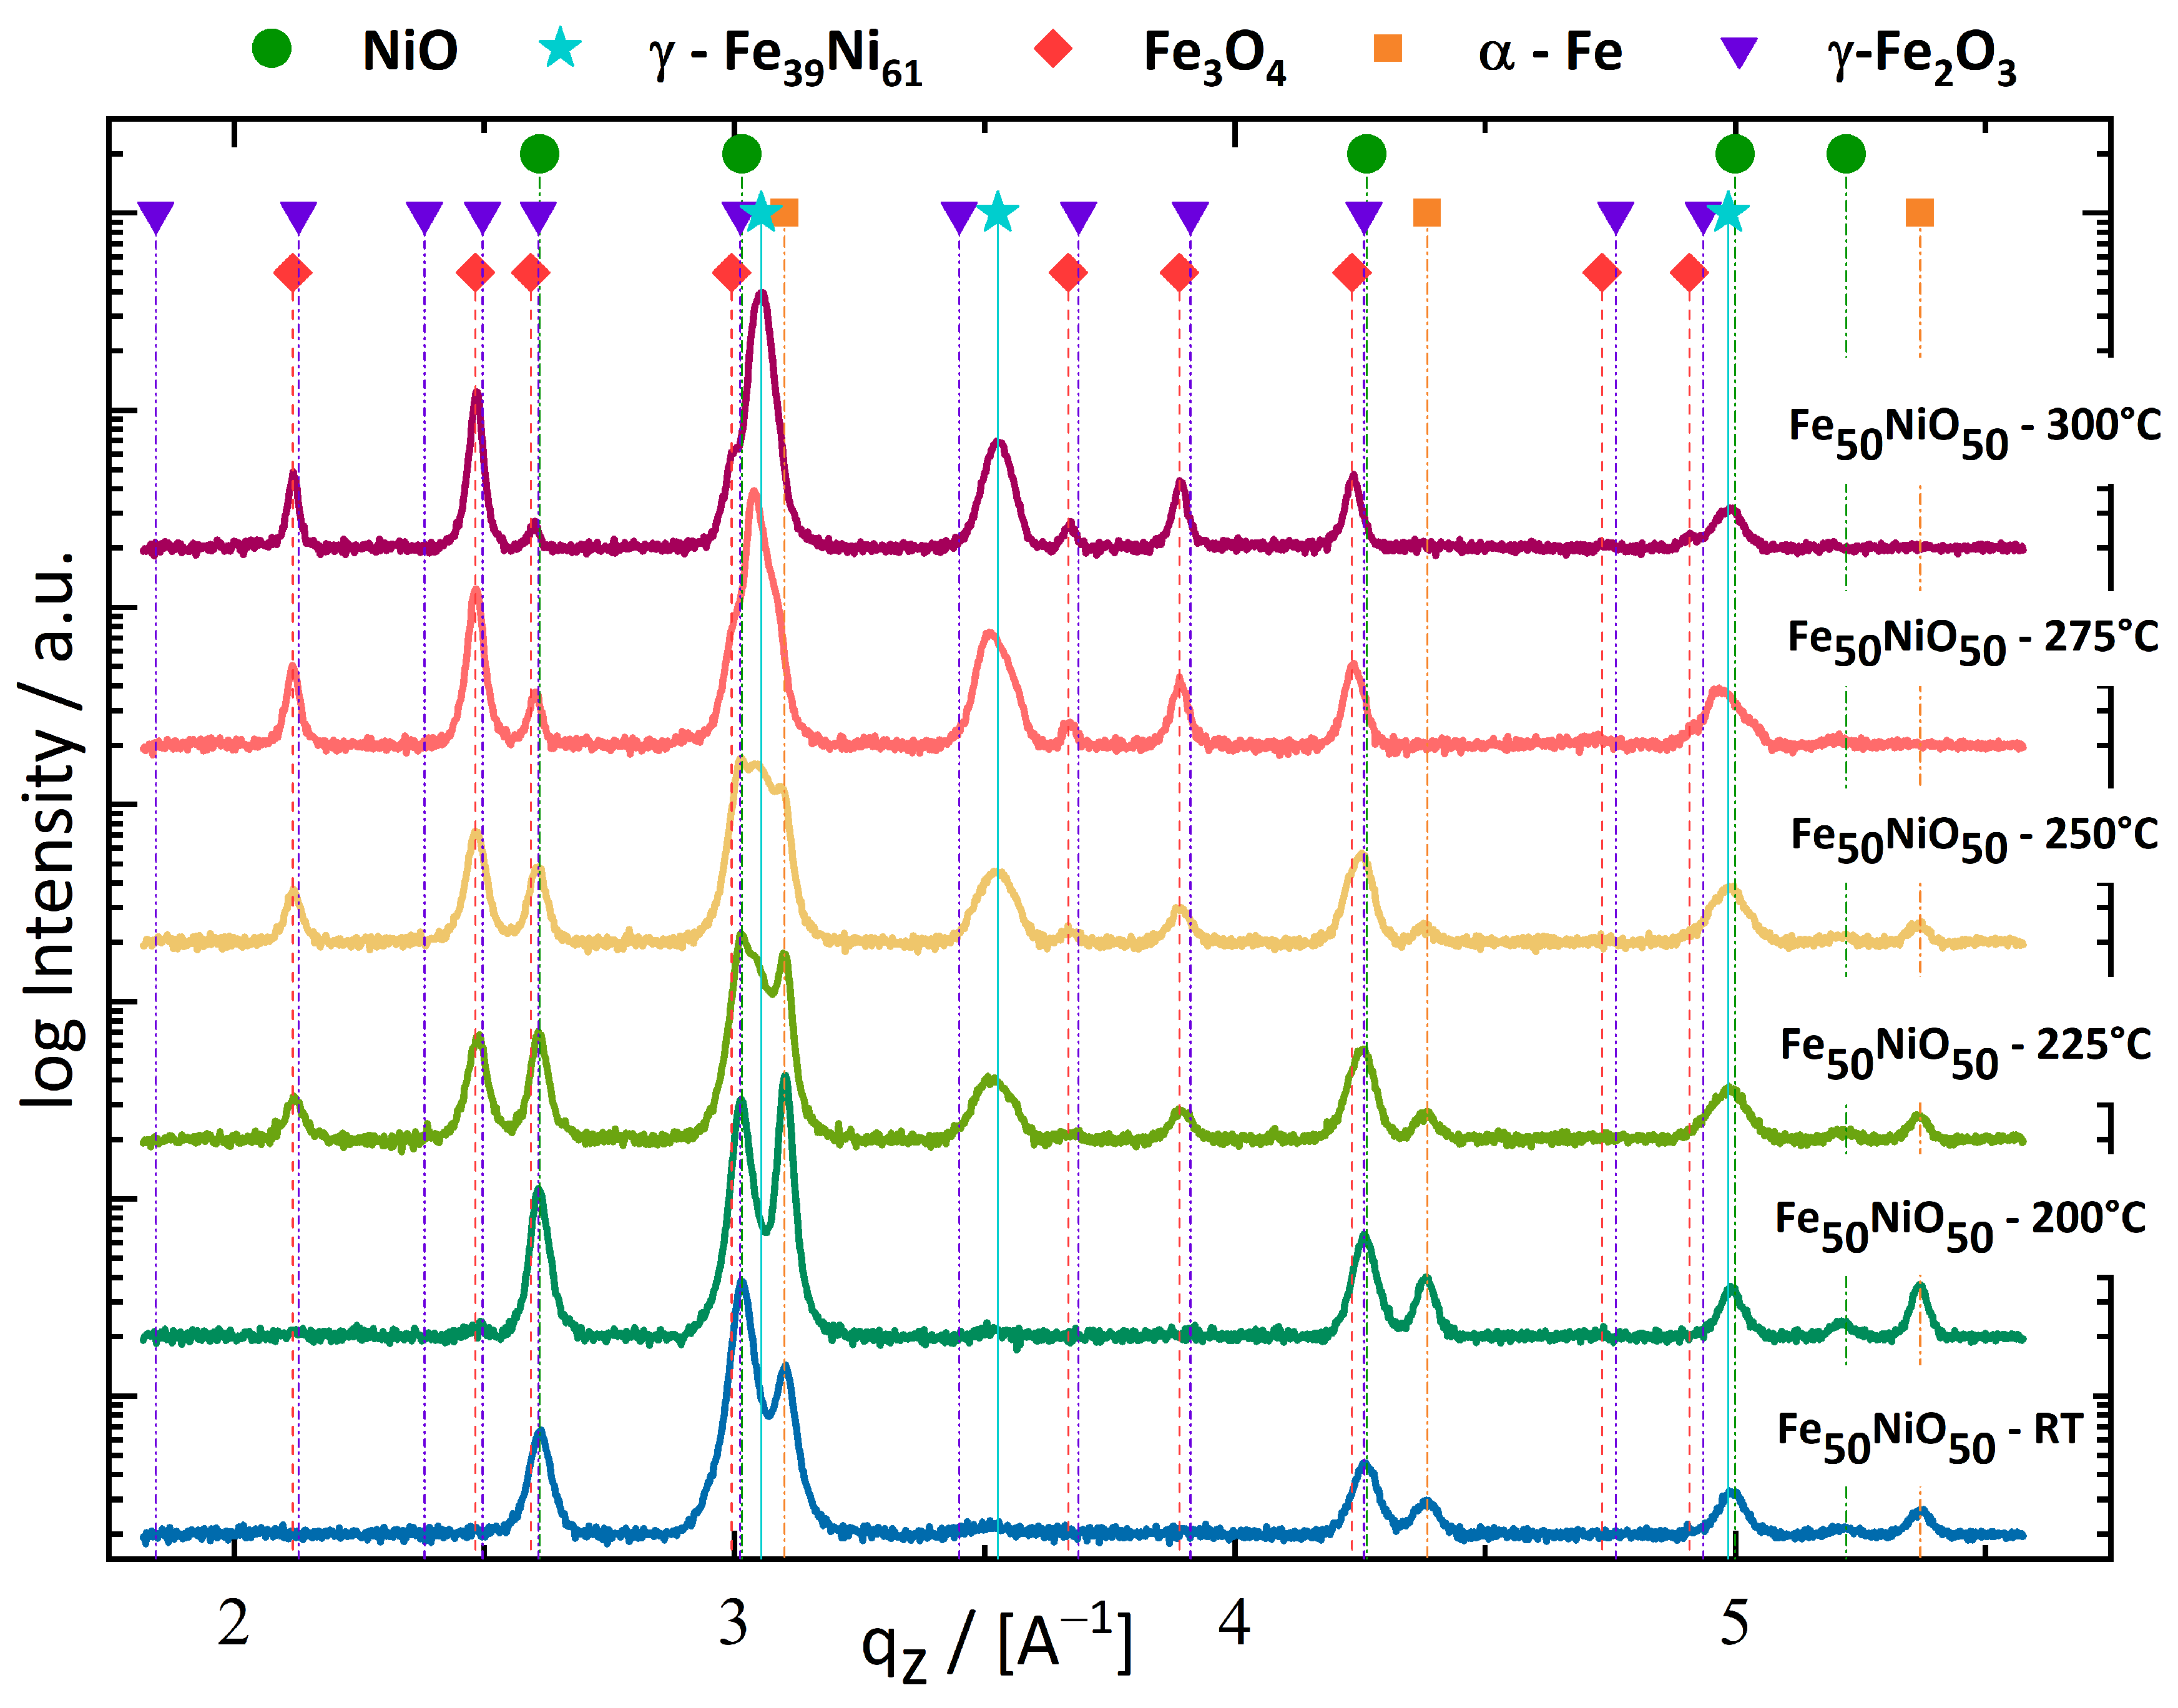
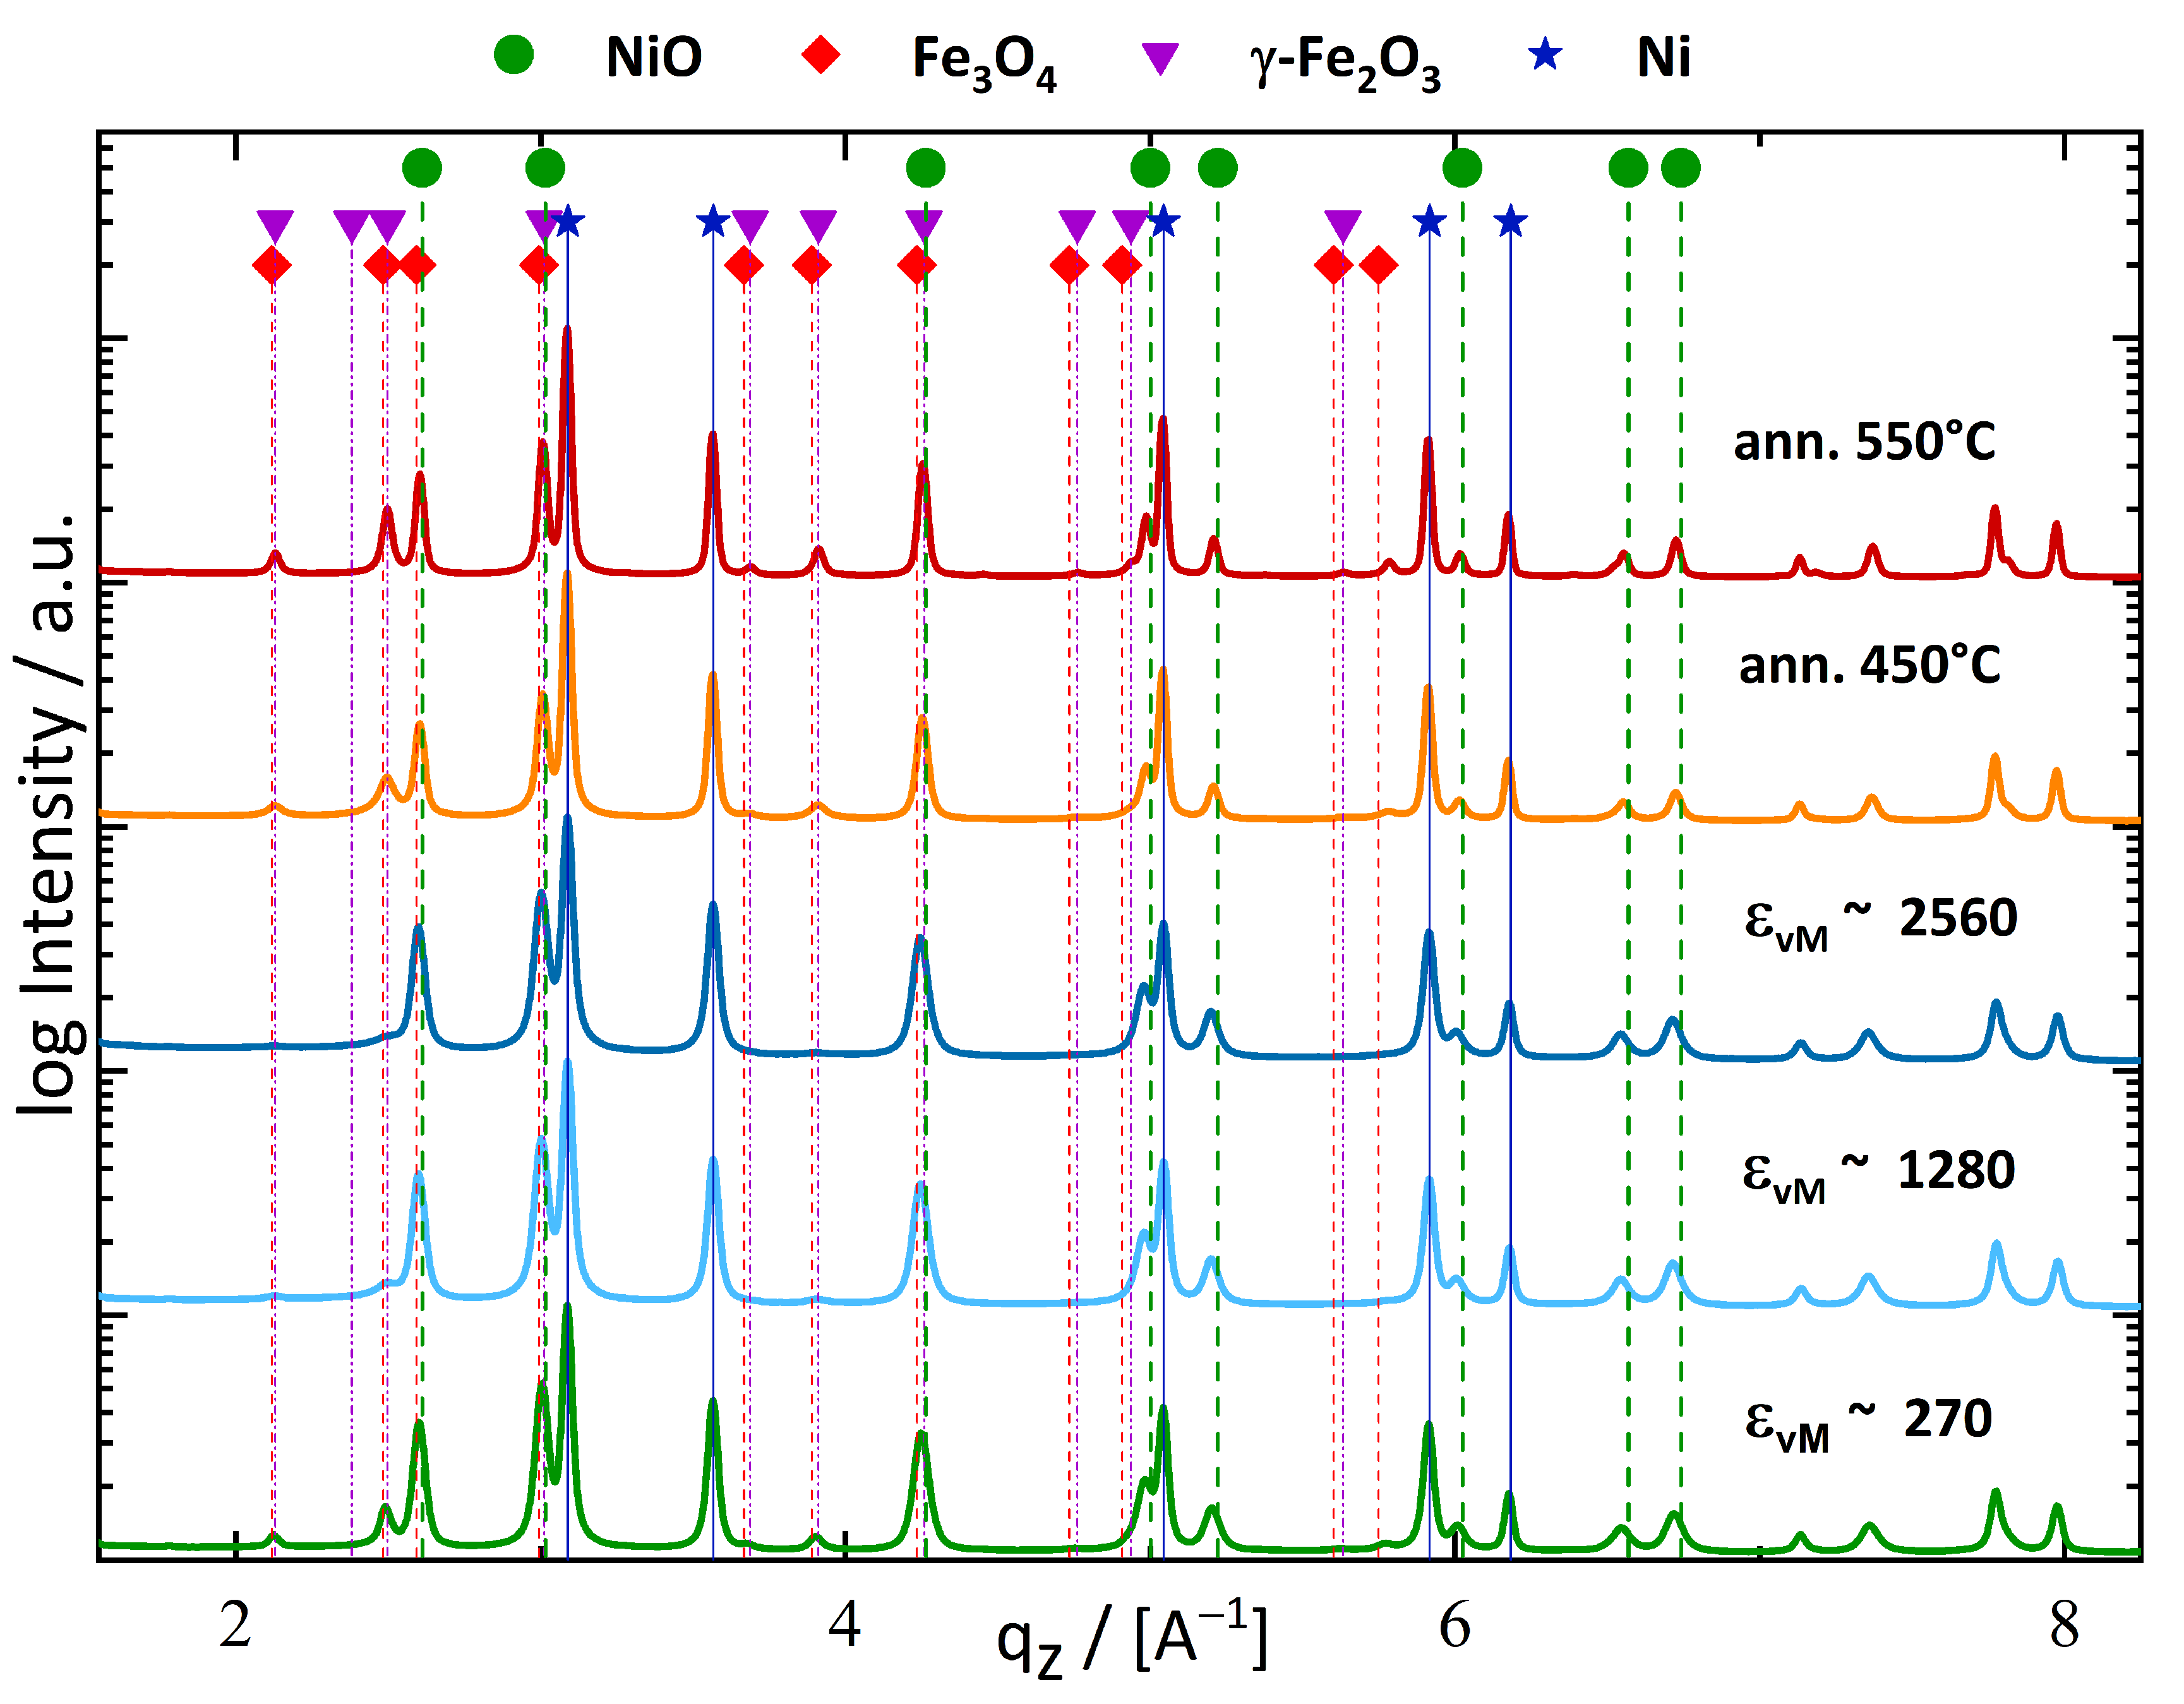
4.2. Phase Formation during Deformation

The efficient reduction of NiO and the observed formation of Fe3O4 and γ -Fe2O3 for both investigated compositions was unanticipated. Commercially available Ni powder is reported to oxidize at >350 °C in ambient atmosphere [42]. In general, NiO is considered to be a stable oxide, and therefore a reduction of Fe was not expected. This reduction can be explained by comparing the heat of formation, which is significantly less for NiO than for Fe3O4 and γ -Fe2O3 [43,44]. The difference in heat of formation could also explain the one-way characteristic of the reaction.
According to the data, the onset of NiO reduction by Fe during HPT processing was initiated between 200 °C and 225 °C (Figure 2). This reaction occurred much more efficiently at Tdef = 300 °C in the Fe50NiO50 material system. The formation of the thermodynamically more favourable Fe3O4 appears to have been enhanced by the extreme conditions during sample synthesis combined with the fragmented and nanocrystalline NiO, which provided a very large amount of interfacial phase area for the observed reduction of NiO. A slip in the {110}<1-10> system in the NiO phase could facilitate the oxidation of Fe because the occurrence of unsaturated oxygen bonds would be more likely. These two mentioned factors are considered to be the main cause for the observed two-phase system of Fe3O4 and γ -Fe39Ni61 for the Fe50NiO50 material system, when deformed at Tdef = 300 °C.
NiO could not be resolved in the XRD scan for the Fe50NiO50 samples deformed at Tdef = 300 °C (Figure 2), although 16-wt% NiO should have been left after synthesis inside the nanocomposite. The possibility that some residual NiO remained after deformation is supported by the analysis of the γ -FeNi phase XRD pattern. If complete reduction of NiO through Fe and complete incorporation of the residual Ni-atoms in the γ -FeNi phase is assumed, the composition of the γ -FeNi phase would change to γ -Fe20Ni80. The peak pattern of γ -Fe20Ni80 had its main peak at qz = 3.073 Å−1 and was therefore distinguishable from the peak position of the observed γ -Fe39Ni61 phase.
The XRD results of Fe50NiO50 and Fe10Ni40NiO50 samples in Figure 2 and Figure 4, respectively, detected different formations of the FexOy phase through the reduction of NiO. The formation of FexOy is influenced by the amount of available O [45]. In the Fe10Ni40NiO50 sample, the Fe content was much lower compared to Fe50NiO50, and therefore sufficient O was available to form γ -Fe2O3.
Moreover, γ -Fe2O3 is thermodynamically more stable than Fe3O4 [43] and therefore is considered more likely to be formed, provided that sufficient O is available during deformation. Another difference from the Fe50NiO50 samples at Tdef = 300 °C is the neglectable substitution of Fe inside the Ni. After the deformation of Fe10Ni40NiO50 composition, WAXS detected a γ -phase consisting solely of Ni.

4.3. Magnetic Properties

Regarding the magnetometry results, the aforementioned Fe-oxide phases (i.e., Fe3O4 and γ -Fe2O3) were both FM, but distinguished themselves in their magnetic properties, for example, bulk-MS,Fe3O4 = 98.6 emu/g [46] and bulk-MS, γ -Fe2O3 = 85.6 emu/g [47] at 8 K. Based on the results from WAXS measurements, the MS, γ -Fe2O3 is used in the following discussion of the results for Fe10Ni40NiO50 nanocomposite.
The Heb can be approximated for thin films with the simple theoretical model of H e b σ / ( M S × t F M ) ( σ = interfacial coupling energy density, tFM = FM-thickness) [48]. Utilising this model, with the assumption that it is valid to some extent for nanocomposites measured at 8 K as well, allows estimation of the origin of the observed change of Heb with applied strain.
The increase of Heb, ϵ v M ∼90 = −52 Oe to Heb, ϵ v M ∼2560 = −242 Oe cannot be explained by the decline of MS alone. As shown in Table 3, MS decreased by approximately 26% from MS, ϵ v M ∼90 = 37.3 emu/g to MS, ϵ v M ∼2560 = 27.6 emu/g, whereas Heb increased almost fivefold from Heb,min to Heb,max. Considering the observed changes of CSDS (Table 2) in addition to the decrease of MS yields a more accurate estimation (Figure 7). The increase of Heb, ϵ v M ∼270 = −90 Oe to Heb, ϵ v M ∼2560 = −242 Oe can be explained to a great extent by the combined decreases of MS and CSDS of γ -Fe2O3 using the approximation that σ was the same for both applied strains. This explanation implies, that NiO was exchange-biased to the γ -Fe2O3 as well as to the Ni-crystallites. From this calculation, it can be deduced that γ -Fe2O3 crystallites dominated the magnetic characteristic of the Fe10Ni40NiO50 samples and that the Ni-crystallites contributed partially.
The annealing experiments allow a deeper insight into the dependency of Heb on the nanocomposite microstructure. The variable MS recovered after deformation, from MS, ϵ v M ∼1150 = 32.3 emu/g to MS,ann. 550°C = 36.9 emu/g, and Heb decreased to ∼10% of its initial value of Heb,as def = −200 Oe through annealing at 550 °C. The annealed samples exhibited continuous CSDS growth for all three phases (Table 2) as well as phase size growth (Figure 5). Changes in CSDS in γ -Fe2O3 were approximately twofold as well, but the decrease of Heb was more significant and could be described only partially by the previous estimation.
Although CSDS apparently had a crucial influence on Heb, magnetic properties in annealed samples can be influenced by other effects as well. The application of temperature can initialize optimisation of the phase interface area to lower surface energies and cause a reduction of phase interface topology. Those effects should also transform the morphology of the FM-AFM interface to a sharper phase gradient. The decreased interfacial area could affect the enclosure of FM grains by the AFM phase and reduce the overall magnetic stiffness inside the FM phase. Phase size growth could enable magnetic nucleation during field reversal, which could further weaken Heb.
The variation of MS with applied strain or annealing temperature appears to have been related to some degree to the rise of CSDS of γ -Fe2O3, due to its large relative changes in size. Previous studies have found that FM-nanocrystallites possess a size-dependent MS in general. The decline of MS is related to a non-magnetic region at the crystallite boundary, which begins to influence MS non-linearly below approximately 20 nm of crystallite dimension through a growing surface-to-volume ratio [49].
To obtain a better insight, the simple approximation from [49] was used for MS, based on the relationship M S ( D C r y ) = M S ( b u l k ) × ( 1 3 × t n o n - m a g / D C r y ) (DCry...crystallite size; for the calculation, the CSDSs from Table 2 and tnon-mag...thickness of a non-magnetic layer between adjacent nanocrystallites were used) for nanocrystalline material. Utilising this model for the Fe10Ni40NiO50 nanocomposite, which consisted of 12-wt% γ -Fe2O3 and 48.6-wt% Ni; yields with a non-magnetic layer of 5.7 Å for γ -Fe2O3 [49], 3 Å for Ni (estimated for Ni) and assuming a bulk MS,Ni = 58.6 emu/g [50] and MS, γ -Fe2O3 = 85.6 emu/g [47]: Mcal.S, ϵ v M ∼270 = 35.7 emu/g, Mcal.S, ϵ v M ∼1280 = 35.1 emu/g and Mcal.S, ϵ v M ∼2560 = 34.2 emu/g, far more than measured (Table 3). These results suggest that the assumed thickness of the non-magnetic layer was underestimated for the considered nanocomposite and should have been much higher to match the experimental results. Regarding the different contributions to MS of γ -Fe2O3 and Ni, crystallites that possess different CSDS allow the conclusion, that the decrease of MS was mainly caused by the shrinking CSDS of γ -Fe2O3 crystallites through the deformation (Figure 8).
The results from the annealed samples support the previous argument, that the γ -Fe2O3 phase mainly influenced MS. Growth of γ -Fe2O3 from 8 nm to 14 nm CSDS would lead to the following calculated MS: Mcal.S, ϵ v M ∼1150 = 34.4 emu/g, Mcal.S,ann.450°C = 35.0 emu/g and Mcal.S,ann.550°C = 36.0 emu/g. The estimation for MS, ϵ v M ∼1150 is certainly higher than the measured MS value; however, MS,ann.450 °C and MS,ann.550 °C are in good accordance with the values presented in Table 3.
The discrepancy between MS, ϵ v M ∼1150 and MS, ϵ v M ∼2560 could be rooted in a larger number of non-magnetic regions than assumed. If complete oxidation of Fe to γ -Fe2O3 is assumed and crystal size effects are neglected, the calculated MS for the annealed Fe10Ni40NiO50 sample yields, a value of MS,cal = 38.3 emu/g. The MS,ann. 550°C = 36.9 emu/g is strikingly similar to the theoretical calculation. This comparison suggests that the non-magnetic phase was predominantly composed of Ni and γ -Fe2O3 and was reduced to a minimum by the annealing treatment.
There have been reports of a phase transition from FM γ -Fe2O3 to the thermodynamically more favourable AFM α -Fe2O3 at temperatures of 370–600 °C [43]. While this transition could have occurred during annealing, an accumulation of non-crystalline regions through the application of strain is more likely. On one hand, the XRD peak pattern of α -Fe2O3 is distinct from γ -Fe2O3; on other hand, a formation of α -Fe2O3 cannot explain the rise in MS through annealing. The plausible existence of non-crystalline regions at interfaces, presumably containing γ -Fe2O3, would have a fraction of bulk MS, MS,amorphous∼2–5% [51], and the transition from crystalline γ -Fe2O3 phase to a phase with non-crystalline regions at the crystallite boundary could explain the changes in MS, detected when large amounts of strain had been applied. Composites, such as Nb-Cu, deformed by SPD have been reported to contain non-crystalline regions at phase interfaces [41,52]. The crystallisation of these non-crystalline regions was observed when annealing was applied [41]. These results suggest that similar behaviour occurred in the Fe10Ni40NiO50 nanocomposite.

5. Conclusions

This study presents an insight into the deformation behaviour of phases possessing very distinct mechanical properties. Although NiO has, due to its NaCl-structure, different primary slip systems compared to Fe or FeNi, it was possible to synthesise nanocomposites with a homogeneous microstructure on the sub-micrometre regime. The importance of thermal HPT processing was demonstrated on the Fe50NiO50 composition. Through the deformation at 300 °C, a homogeneous two-phase microstructure evolved. XRD investigations confirmed a reduction of NiO through Fe leading to the formation of Fe3O4 and γ -Fe39Ni61.
To conserve the AFM NiO in respect to enhance the Heb, a composition of Fe10Ni40NiO50 was synthesised by HPT at 300 °C and nanocomposites with a unique microstructure were obtained. SEM micrographs showed a very homogeneous microstructure, which primarily contained NiO and Ni according to WAXS investigations. The formation of an additional phase was detected by WAXS, which consisted of γ -Fe2O3. Vickers microhardness measurements detected a microstructural saturation behaviour with a slight increase to outer radii to an unusually high Vickers microhardness of ∼9.9 GPa. WAXS, SEM and magnetometry results conveyed an ongoing refinement of the nanocomposite’s microstructure.
It was possible to demonstrate the existence of Heb in such bulk-sized nanocomposite and the continual increase of Heb with applied strain was correlated to the evolving microstructure. The rise of Heb was mainly attributed to a simultaneous decrease in MS, reduction of FM-phase size dimensions and crystallite size of the FM-phases, predominantly γ -Fe2O3.
Annealing experiments of Fe10Ni40NiO50 samples showed a decrease of Heb and an increase of MS. Those changes of Heb and MS contributed to the growth of FM-phase dimensions and the subsequent reduction of phase interfaces.

Author Contributions

Conceptualization, M.Z.; Methodology, M.Z.; Validation, M.Z., L.W., H.K., S.W. and A.B.; Formal Analysis, M.Z.; Investigation, M.Z.; Data Curation, M.Z.; Writing—Original Draft Preparation, M.Z.; Writing—Review and Editing, H.K., L.W., S.W. and A.B.; Visualization, M.Z.; Supervision, H.K. and A.B.; Project Administration, A.B.; Funding Acquisition, A.B. All authors have read and agreed to the published version of the manuscript.

Funding

This project has received funding from the European Research Council (ERC) under the European Union’s Horizon 2020 research and innovation programme (grant agreement No:757333).

Data Availability Statement

Not applicable.

Acknowledgments

We acknowledge DESY (Hamburg, Germany), a member of the Helmholtz Association HGF, for the provision of experimental facilities. Parts of this research were carried out at (PETRA III) and we would like to thank (N. Schell and E. Maawad) for assistance in using (P07B- High Energy Materials Science).

Conflicts of Interest

The authors declare no conflict of interest.

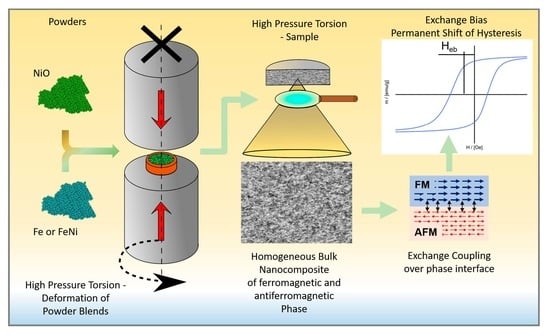
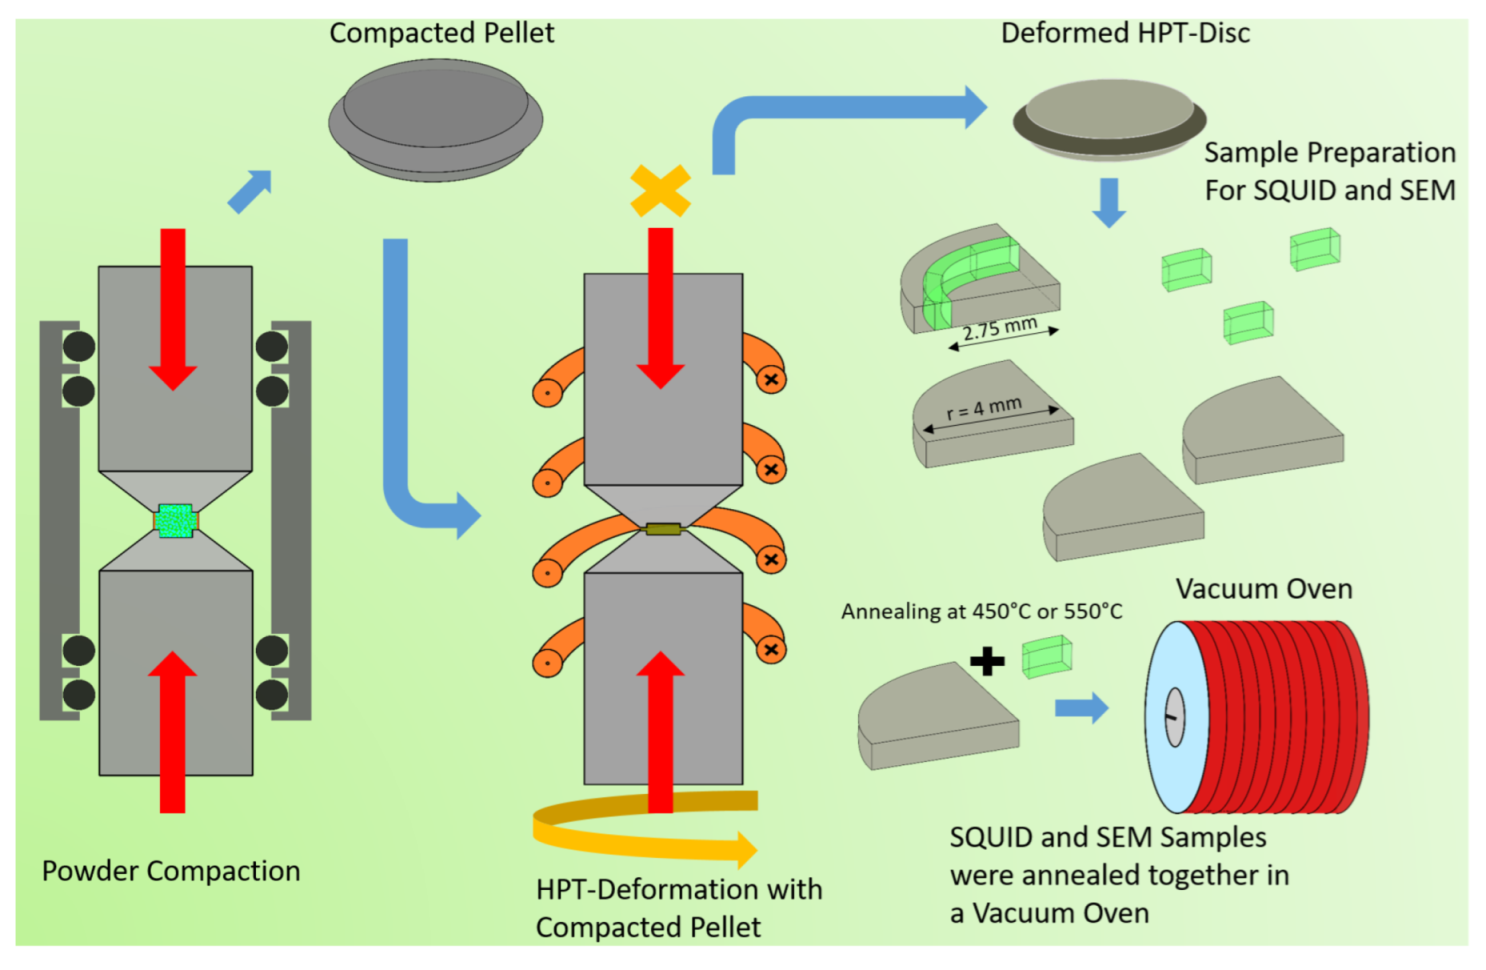
Appendix A. Schematic Illustration of the HPT-Synthesis

Figure A1. Schematic description of the sample synthesis. From left to right: Powder blends were compacted with HPT inside an airtight capsule. The obtained pellet was used for HPT-deformation experiments. An inductive heating system provided the needed processes temperature for the HPT-anvils. HPT-disc was cut into the desired size for further investigations. The SQUID samples were cut out at the desired radius. For the annealing experiments a HPT-disc was cut into quarters. One quarter provided the SQUID-samples, which were cut out at the same radius. The SQUID sample was simultaneously annealed with a quarter of the HPT-disc.
Nanomaterials 13 00344 g0a1

References

  1. Sahu, T.; Ratre, Y.K.; Chauhan, S.; Bhaskar, L.V.; Nair, M.P.; Verma, H.K. Nanotechnology based drug delivery system: Current strategies and emerging therapeutic potential for medical science. J. Drug Deliv. Sci. Technol. 2021, 63, 102487. [Google Scholar] [CrossRef]
  2. Mitchell, S.; Qin, R.; Zheng, N.; Pérez-Ramírez, J. Nanoscale engineering of catalytic materials for sustainable technologies. Nat. Nanotechnol. 2021, 16, 129–139. [Google Scholar] [CrossRef] [PubMed]
  3. Zhang, X.; Zhao, Z.; Zhao, S.; Xiang, S.; Gao, W.; Wang, L.; Xu, J.; Wang, Y. The promoting effect of alkali metal and H2O on Mn-MOF derivatives for toluene oxidation: A combined experimental and theoretical investigation. J. Catal. 2022, 415, 218–235. [Google Scholar] [CrossRef]
  4. Nikolic, M.V.; Milovanovic, V.; Vasiljevic, Z.Z.; Stamenkovic, Z. Semiconductor gas sensors: Materials, technology, design, and application. Sensors 2020, 20, 6694. [Google Scholar] [CrossRef]
  5. Sreenivasulu, V.B.; Narendar, V. A Comprehensive Analysis of Junctionless Tri-Gate (TG) FinFET Towards Low-Power and High-Frequency Applications at 5-nm Gate Length. Silicon 2022, 14, 2009–2021. [Google Scholar] [CrossRef]
  6. Ovid’ko, I.A.; Valiev, R.Z.; Zhu, Y.T. Review on superior strength and enhanced ductility of metallic nanomaterials. Prog. Mater. Sci. 2018, 94, 462–540. [Google Scholar] [CrossRef]
  7. Valiev, R.Z.; Estrin, Y.; Horita, Z.; Langdon, T.G.; Zehetbauer, M.J.; Zhu, Y.T. Fundamentals of superior properties in bulk NanoSPD materials. Mater. Res. Lett. 2016, 4, 1–21. [Google Scholar] [CrossRef]
  8. Herzer, G. Modern soft magnets: Amorphous and nanocrystalline materials. Acta Mater. 2013, 61, 718–734. [Google Scholar] [CrossRef]
  9. Coey, J.M. Hard magnetic materials: A perspective. IEEE Trans. Magn. 2011, 47, 4671–4681. [Google Scholar] [CrossRef]
  10. Skomski, R.; Coey, J.M. Magnetic anisotropy-How much is enough for a permanent magnet? Scr. Mater. 2016, 112, 3–8. [Google Scholar] [CrossRef]
  11. Gutfleisch, O.; Willard, M.A.; Brück, E.; Chen, C.H.; Sankar, S.G.; Liu, J.P. Magnetic materials and devices for the 21st century: Stronger, lighter, and more energy efficient. Adv. Mater. 2011, 23, 821–842. [Google Scholar] [CrossRef] [PubMed]
  12. Meyers, M.A.; Mishra, A.; Benson, D.J. Mechanical properties of nanocrystalline materials. Prog. Mater. Sci. 2006, 51, 427–556. [Google Scholar] [CrossRef]
  13. Kormout, K.S.; Pippan, R.; Bachmaier, A. Deformation-Induced Supersaturation in Immiscible Material Systems during High-Pressure Torsion. Adv. Eng. Mater. 2017, 19, 1600675. [Google Scholar] [CrossRef]
  14. Wurster, S.; Weissitsch, L.; Stückler, M.; Knoll, P.; Krenn, H.; Pippan, R.; Bachmaier, A. Tuneable magneto-resistance by severe plastic deformation. Metals 2019, 9, 1188. [Google Scholar] [CrossRef] [Green Version]
  15. Bachmaier, A.; Krenn, H.; Knoll, P.; Aboulfadl, H.; Pippan, R. Tailoring the magnetic properties of nanocrystalline Cu-Co alloys prepared by high-pressure torsion and isothermal annealing. J. Alloys Compd. 2017, 725, 744–749. [Google Scholar] [CrossRef] [Green Version]
  16. Weissitsch, L.; Stückler, M.; Wurster, S.; Knoll, P.; Krenn, H.; Pippan, R.; Bachmaier, A. Strain induced anisotropic magnetic behaviour and exchange coupling effect in Fe-SmCo5 permanent magnets generated by high pressure torsion. Crystals 2020, 10, 1026. [Google Scholar] [CrossRef]
  17. Menéndez, E.; Sort, J.; Langlais, V.; Zhilyaev, A.; Muñoz, J.S.; Suriñach, S.; Nogués, J.; Baró, M.D. Cold compaction of metal-ceramic (ferromagnetic-antiferromagnetic) composites using high pressure torsion. J. Alloys Compd. 2007, 434–435, 505–508. [Google Scholar] [CrossRef]
  18. Pippan, R.; Wetscher, F.; Hafok, M.; Vorhauer, A.; Sabirov, I. The limits of refinement by severe plastic deformation. Adv. Eng. Mater. 2006, 8, 1046–1056. [Google Scholar] [CrossRef]
  19. Meiklejohn, W.H.; Bean, C.P. New magnetic anisotropy. Phys. Rev. 1956, 102, 1413–1414. [Google Scholar] [CrossRef]
  20. Blachowicz, T.; Ehrmann, A. Exchange bias in thin films—an update. Coatings 2021, 11, 122. [Google Scholar] [CrossRef]
  21. Childress, J.R.; Fontana, R.E. Magnetic recording read head sensor technology. Comptes Rendus Phys. 2005, 6, 997–1012. [Google Scholar] [CrossRef]
  22. Edalati, K. Review on Recent Advancements in Severe Plastic Deformation of Oxides by High-Pressure Torsion (HPT). Adv. Eng. Mater. 2019, 21, 1800272. [Google Scholar] [CrossRef]
  23. Hohenwarter, A.; Bachmaier, A.; Gludovatz, B.; Scheriau, S.; Pippan, R. Technical parameters affecting grain refinement by high pressure torsion. Int. J. Mater. Res. 2009, 100, 1653–1661. [Google Scholar] [CrossRef]
  24. Valiev, R.; Islamgaliev, R.; Alexandrov, I. Bulk nanostructured materials from severe plastic deformation. Prog. Mater. Sci. 2000, 45, 103–189. [Google Scholar] [CrossRef]
  25. Srinivasan, G.; Seehra, M.S. Magnetic susceptibilities, their temperature variation, and exchange constants of NiO. Phys. Rev. B 1984, 29, 6295–6298. [Google Scholar] [CrossRef]
  26. Owen, E.A.; Yates, E.L.; Sully, A.H. An X-ray investigation of pure iron-nickel alloys. Part 4: The variation of lattice-parameter with composition. Proc. Phys. Soc. 1937, 49, 315–322. [Google Scholar] [CrossRef]
  27. Siow, K.S.; Tay, A.A.; Oruganti, P. Mechanical properties of nanocrystalline copper and nickel. Mater. Sci. Technol. 2004, 20, 285–294. [Google Scholar] [CrossRef]
  28. Bachmaier, A.; Hohenwarter, A.; Pippan, R. New procedure to generate stable nanocrystallites by severe plastic deformation. Scr. Mater. 2009, 61, 1016–1019. [Google Scholar] [CrossRef]
  29. Kumar, D.; Singh, S.; Gupta, A. Effect of interface roughness on exchange coupling in polycrystalline Co/CoO bilayer structure: An in-situ investigation. J. Appl. Phys. 2016, 120, 085307. [Google Scholar] [CrossRef]
  30. Nogués, J.; Moran, T.J.; Lederman, D.; Schuller, I.K.; Rao, K.V. Role of interfacial structure on exchange-biased FeF2-Fe. Phys. Rev. B 1999, 59, 6984–6993. [Google Scholar] [CrossRef]
  31. Renk, O.; Pippan, R. Saturation of grain refinement during severe plastic deformation of single phase materials: Reconsiderations, current status and open questions. Mater. Trans. 2019, 60, 1270–1282. [Google Scholar] [CrossRef] [Green Version]
  32. Bachmaier, A.; Schmauch, J.; Aboulfadl, H.; Verch, A.; Motz, C. On the process of co-deformation and phase dissolution in a hard-soft immiscible Cu-Co alloy system during high-pressure torsion deformation. Acta Mater. 2016, 115, 333–346. [Google Scholar] [CrossRef] [Green Version]
  33. Sabirov, I.; Pippan, R. Characterization of tungsten fragmentation in a W–25%Cu composite after high-pressure torsion. Mater. Charact. 2007, 58, 848–853. [Google Scholar] [CrossRef]
  34. Groves, G.W.; Kelly, A. Independent slip systems in crystals. Philos. Mag. 1963, 8, 877–887. [Google Scholar] [CrossRef]
  35. Guiberteau, F.; Donminguez-Rodriguez, A.; Spendel, M.; Castaing, J. Plastic deformation of bunsenite (NiO) at temperatures below 1 050 °C. Rev. Phys. Appliquée 1986, 21, 87–92. [Google Scholar] [CrossRef] [Green Version]
  36. Evans, A.G.; Rajdev, D.; Douglass, D.L. The mechanical properties of nickel oxide and their relationship to the morphology of thick oxide scales formed on nickel. Oxid. Met. 1972, 4, 151–170. [Google Scholar] [CrossRef]
  37. Guétaz, L.; Pénisson, J. High resolution electron microscopy of a deformed superalloy: Shear of precipitates. Mater. Sci. Eng. A 1994, 175, 141–148. [Google Scholar] [CrossRef]
  38. Sinclair, C.; Embury, J.; Weatherly, G. Basic aspects of the co-deformation of bcc/fcc materials. Mater. Sci. Eng. A 1999, 272, 90–98. [Google Scholar] [CrossRef]
  39. Wenk, H.R.; Matthies, S.; Hemley, R.J.; Mao, H.K.; Shu, J. The plastic deformation of iron at pressures of the Earth’s inner core. Nature 2000, 405, 1044–1047. [Google Scholar] [CrossRef]
  40. Kang, F.; Liu, J.Q.; Wang, J.T.; Zhao, X. The effect of hydrostatic pressure on the activation of non-basal slip in a magnesium alloy. Scr. Mater. 2009, 61, 844–847. [Google Scholar] [CrossRef]
  41. Raabe, D.; Hangen, U. Observation of amorphous areas in a heavily cold rolled Cu-20 wt% Nb composite. Mater. Lett. 1995, 22, 155–161. [Google Scholar] [CrossRef]
  42. Cabanas-Polo, S.; Bermejo, R.; Ferrari, B.; Sanchez-Herencia, A.J. Ni-NiO composites obtained by controlled oxidation of green compacts. Corros. Sci. 2012, 55, 172–179. [Google Scholar] [CrossRef]
  43. Cornell, R.M.; Schwertmann, U. The Iron Oxides: Structure, Properties, Reactions, Occurrences, and Uses; Wiley-VCH: Hoboken, NJ, USA, 2003; p. 187, 382, 664. [Google Scholar]
  44. Gaskell, D.R. Discussion of “Representation of mixed reactive gases on free energy (Ellingham-Richardson) diagrams”. Metall. Mater. Trans. B 1996, 27, 693. [Google Scholar] [CrossRef]
  45. Wriedt, H. The Fe-O (Iron-Oxygen) System. J. Phase Equilibria 1991, 12, 170–200. [Google Scholar] [CrossRef]
  46. Caruntu, D.; Caruntu, G.; O’Connor, C.J. Magnetic properties of variable-sized Fe3O4 nanoparticles synthesized from non-aqueous homogeneous solutions of polyols. J. Phys. D Appl. Phys. 2007, 40, 5801–5809. [Google Scholar] [CrossRef] [Green Version]
  47. Roca, A.G.; Marco, J.F.; Del Puerto Morales, M.; Serna, C.J. Effect of nature and particle size on properties of uniform magnetite and maghemite nanoparticles. J. Phys. Chem. C 2007, 111, 18577–18584. [Google Scholar] [CrossRef]
  48. Berkowitz, A.; Takano, K. Exchange anisotropy—A review. J. Magn. Magn. Mater. 1999, 200, 552–570. [Google Scholar] [CrossRef]
  49. Berkowitz, A.E.; Schuele, W.J.; Flanders, P.J. Influence of crystallite size on the magnetic properties of acicular γ-Fe2O3 particles. J. Appl. Phys. 1968, 39, 1261–1263. [Google Scholar] [CrossRef]
  50. Crangle, J.; Goodman, G.M. The magnetization of pure iron and nickel. Proc. R. Soc. Lond. A Math. Phys. Sci. 1971, 321, 477–491. [Google Scholar] [CrossRef]
  51. Machala, L.; Zboril, R.; Gedanken, A. Amorphous iron(III) oxide—A review. J. Phys. Chem. B 2007, 111, 4003–4018. [Google Scholar] [CrossRef]
  52. Sauvage, X.; Renaud, L.; Deconihout, B.; Blavette, D.; Ping, D.; Hono, K. Solid state amorphization in cold drawn Cu/Nb wires. Acta Mater. 2001, 49, 389–394. [Google Scholar] [CrossRef]
Figure 1. SEM micrographs in BSE mode depict samples deformed at RT (a) and 300 °C (b) at r = 0 mm and r = 3 mm. EDX spectroscopy identified the dark phase as NiO for (a) or Fe3O4 for (b). (c) Vickers microhardness of Fe50NiO50 samples along the radial direction. The sample processed at 300 °C had a higher saturation microhardness compared to the sample deformed at RT. (d) Vickers microhardness values form r = 2.5 mm to r = 3.75 mm. Higher deformation temperatures led to a homogeneous microstructure and therefore higher hardness values. (e) SEM micrographs in BSE mode gained of Fe50NiO50 samples at the outer radii (r∼3 mm). An onset of homogenisation of microstructure could be seen at 225 °C and gradually improved towards 275 °C. The micron bar applies to all micrographs in the same row.
Nanomaterials 13 00344 g001
Figure 2. XRD-data is displayed of the Fe50NiO50 sample, which was measured with laboratory equipment. The formation of Fe3O4, through the reduction of NiO by Fe, was seen for samples deformed at Tdef ≥ 225 °C. α -Fe was not detectable at Tdef ≥ 275 °C.
Nanomaterials 13 00344 g002
Figure 3. (a) BSE micrographs of the Fe10Ni40NiO50 samples. Microstructural refinement was detected from left to right. Two samples were deformed to obtain the depicted micrographs. First samples were deformed with 30 rotations and micrographs of an applied strain of ϵ v M ∼90 to ϵ v M ∼610 were taken. The second samples were deformed with 125 rotations and micrographs of an applied strain of ϵ v M ∼270, ϵ v M ∼1280 and ϵ v M ∼2560 were taken. The micron bar applies to all micrographs in the same row. (b) Vickers microhardness of both Fe10Ni40NiO50 samples deformed at 300 °C.
Nanomaterials 13 00344 g003
Figure 4. Synchrotron WAXS results are shown for different applied strains of the Fe10Ni40NiO50 sample. Starting from bottom: ϵ v M ∼270, ϵ v M ∼1280 and ϵ v M ∼2560. The two annealed samples are at the top: atop the sample annealed at 550 °C and below the sample annealed at 450 °C. At low q-values the development of γ -Fe2O3 peaks were visible. γ -Fe2O3-peaks became weaker with high applied strains due to a reduction of CSDS.
Nanomaterials 13 00344 g004
Figure 5. SEM micrographs were done in BSE mode of as-deformed and annealed samples of the Fe10Ni40NiO50 composition. The annealing initiated a phase growth and change of interface morphology for the samples annealed at 450 °C and 550 °C. The micron bar applies to all micrographs in the same row.
Nanomaterials 13 00344 g005
Figure 6. The magnetic hysteresis loops of the Fe10Ni40NiO50 sample were measured at 8 K. The graph displays a zoom-in at ±2000 Oe. The inlet in the left corner provides the whole hysteresis loop. (a) Hysteresis loop of as-deformed samples (b) Hysteresis loops of the annealed samples. (c) Heb for different amounts of applied strain. The used fit is not based on a physical model and serves only to approximate the expected saturation of Heb for an infinite amount of applied strain.
Nanomaterials 13 00344 g006
Figure 7. Relative change of Heb related to Heb, ϵ v M ∼270 and comparison of the ratio to the relative changes of MS and CSDS size of t γ -Fe2O3 and tNi.
Nanomaterials 13 00344 g007
Figure 8. The influence of crystallite size on MS, according to [49], assuming a non-magnetic layer between adjacent crystallites of 5.7 Å for γ -Fe2O3 and 3 Å for Ni. Due to the smaller CSDS for γ -Fe2O3 the surface-to-volume ratio becomes larger, causing a stronger decrease of MS γ -Fe2O3.
Nanomaterials 13 00344 g008
Table 1. Summary of peak analysis executed for Fe50NiO50 sample deformed at RT and 300 °C. <Dx> is the average crystallite size or CSDS, Dx-WH represents the strain-less CSDS result and ϵ x-WH residual strain in the crystallite, both values are obtained via the WH method.
<DFe> /[nm]DFe-WH/[nm] ϵ Fe-WH<DNiO > /[nm]DNiO-WH/[nm] ϵ NiO-WH
Fe50NiO50
@Tdef = RT
11 ± 2402 × 10 2 11 ± 2302 × 10 2
<DFeNi> / [nm]DFeNi-WH/[nm] ϵ FeNi-WH<DFe3O4>
/[nm]
DFe3O4-WH/[nm] ϵ Fe3O4-WH
Fe50NiO50
@Tdef = 300 °C
12 ± 2453 × 10 2 19 ± 7431 × 10 2
Table 2. A summary of integral peak breadth analysis is shown, which was done for the Fe10Ni40NiO50 sample deformed at Tdef = 300 °C. <Dx> is the average crystallite size or CSDS, Dx-WH represents the strain-less CSDS result and ϵ x-WH residual strain in the crystallite both values were obtained by the WH method.
<DNi> /[nm]DNi-WH/[nm] ϵ Ni-WH<DNiO>
/[nm]
DNiO-WH/[nm] ϵ NiO-WH<D γ -Fe2O3>
/[nm]
ϵ vM∼27018 ± 2213 × 10 3 11 ± 3252 × 10 2 12 ± 2
ϵ vM∼128015 ± 5192 × 10 3 11 ± 2201 × 10 2 9 ± 4
ϵ vM∼256015 ± 4182 × 10 3 11 ± 2191 × 10 2 6 ± 2
ann. 450 °C21 ± 2221 × 10 3 14 ± 3229 × 10 3 8 ± 2
ann. 550 °C24 ± 2250.5 × 10 3 17 ± 3267 × 10 3 14 ± 2
Table 3. Summary of magnetic hysteresis loops of Fe10Ni40NiO50 samples measured at 8 K, which are shown in Figure 6a,b. Exchange bias (Heb), symmetric coercivity (HC), coercivity center side (HC1), coercivity right side (HC2), saturation magnetisation (MS) and magnetic remanence (MR).
Heb/[Oe]HC/[Oe]HC1/[Oe]HC2/[Oe]MS/[emu/g]MR/[emu/g]
ϵ vM∼90−52460−51240837.318.6
ϵ vM∼270−90625−71553532.621.2
ϵ vM∼610−124587−71046334.123.3
ϵ vM∼1280−186786−97160028.823.7
ϵ vM∼2560−243843−108559927.623.7
ϵ vM∼ 1150−200697−89449432.326.8
ann. 450 °C−67515−58144935.827.0
ann. 550 °C−23373−39634936.619.6
Disclaimer/Publisher’s Note: The statements, opinions and data contained in all publications are solely those of the individual author(s) and contributor(s) and not of MDPI and/or the editor(s). MDPI and/or the editor(s) disclaim responsibility for any injury to people or property resulting from any ideas, methods, instructions or products referred to in the content.

