
Sintering, Mechanical and Optical Properties of TiB2 Composites with and without High-Energy Milling

Abstract
:1. Introduction
2. Materials and Methods
- -
- B4C (H.C. Starck Grade HS-A, D90 2.0–4.0 μm, D50 0.6–1.2 μm, B:C ratio 3.7, impurities (wt. %): 0.7 N, 1.7 O, 0.05 Fe, 0.15 Si, 0.05 Al);
- -
- Si3N4 (α-Si3N4, H.C. Starck Grade M 11, α > 90%, D50 0.6 μm, D90 1.3 μm, D10 0.3 μm, impurities (wt. %): 0.5 O, 0.5 C, 0.08 Al, 0.01 Ca, 0.008 Fe);
- -
- MoSi2 (Sigma Aldrich, purity > 99% average particle size < 2 μm, metallic impurities (<2000 PPM): 400 ppm Al, 12 ppm Ba, 16ppm Cr, 400 Fe, 12 ppm K, 39 ppm W).
- -
- TiB2 + 5 vol.% B4C, labeled as TC;
- -
- TiB2 + 5 vol.% Si3N4, labeled as TS;
- -
- TiB2 + 5 vol.% MoSi2, labeled as TM.
3. Results and Discussion
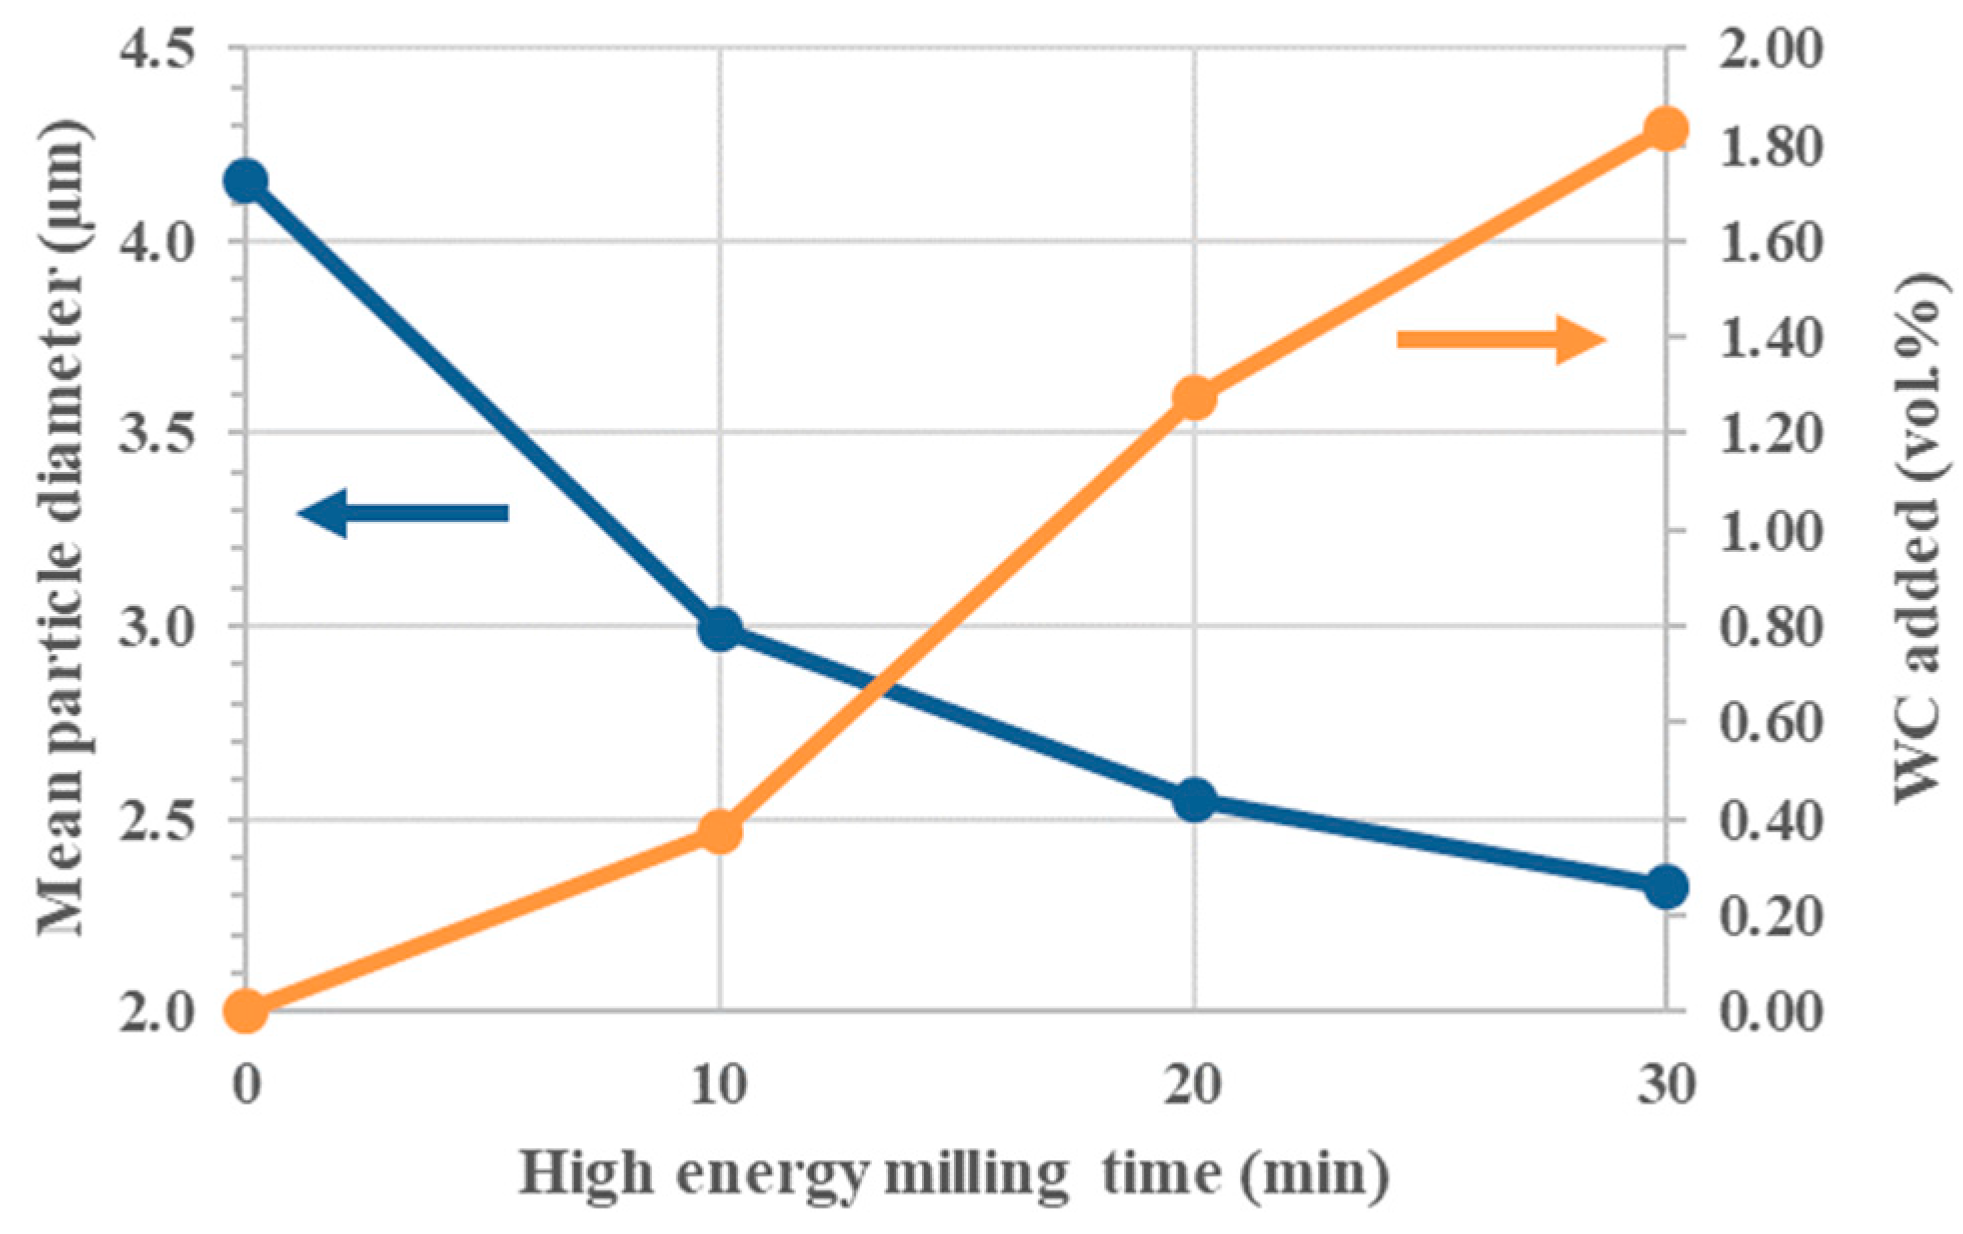
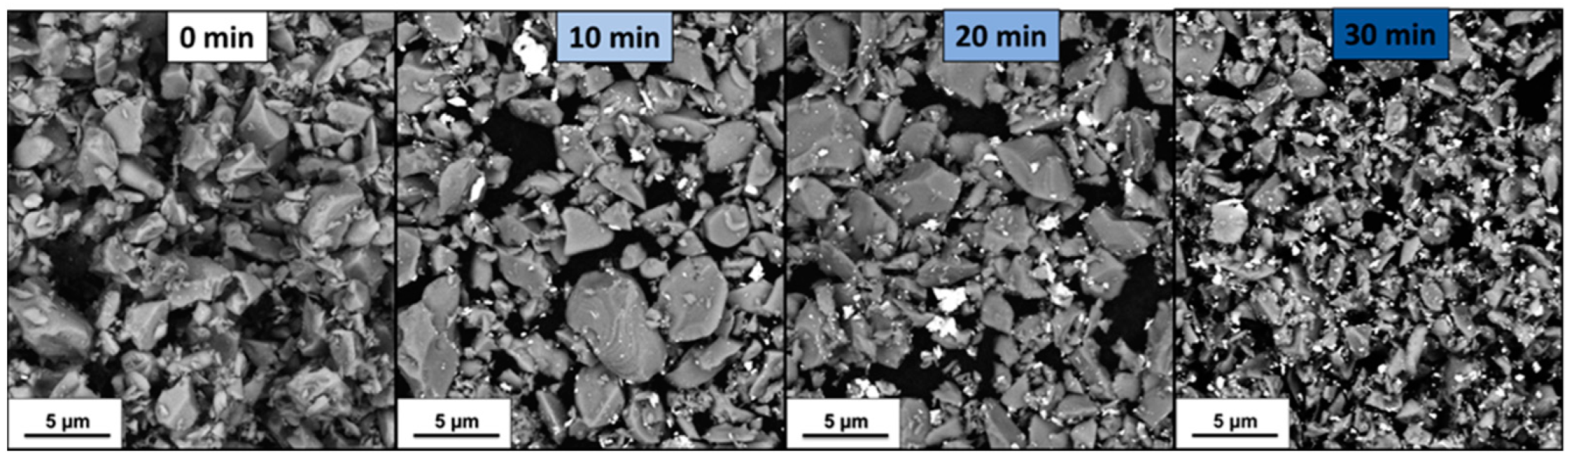
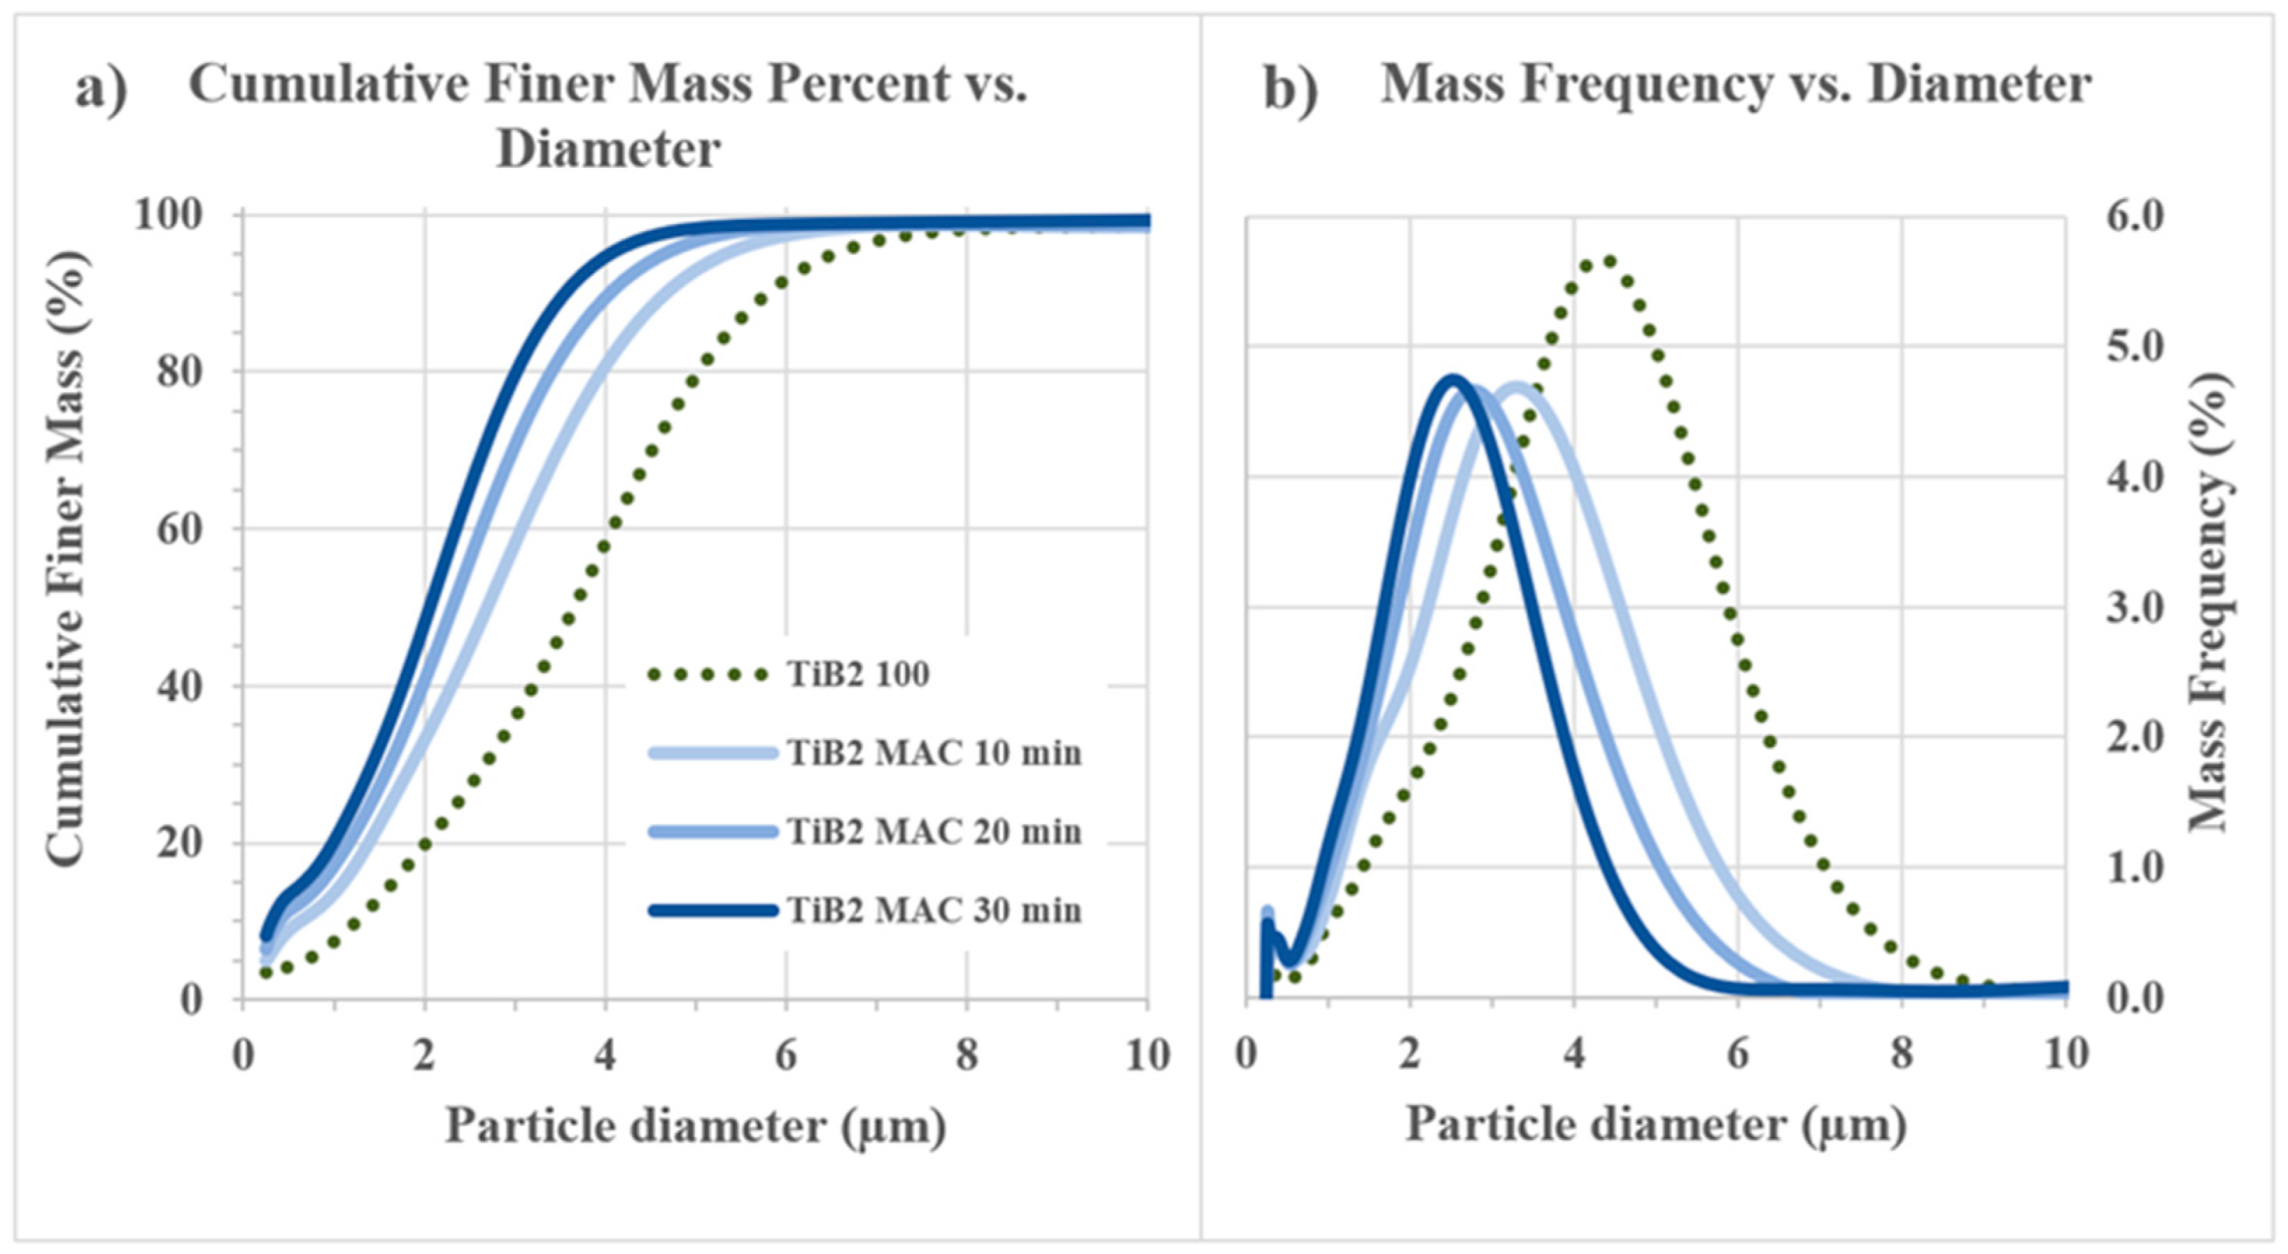
3.1. Effect of Milling with WC-Co Beads
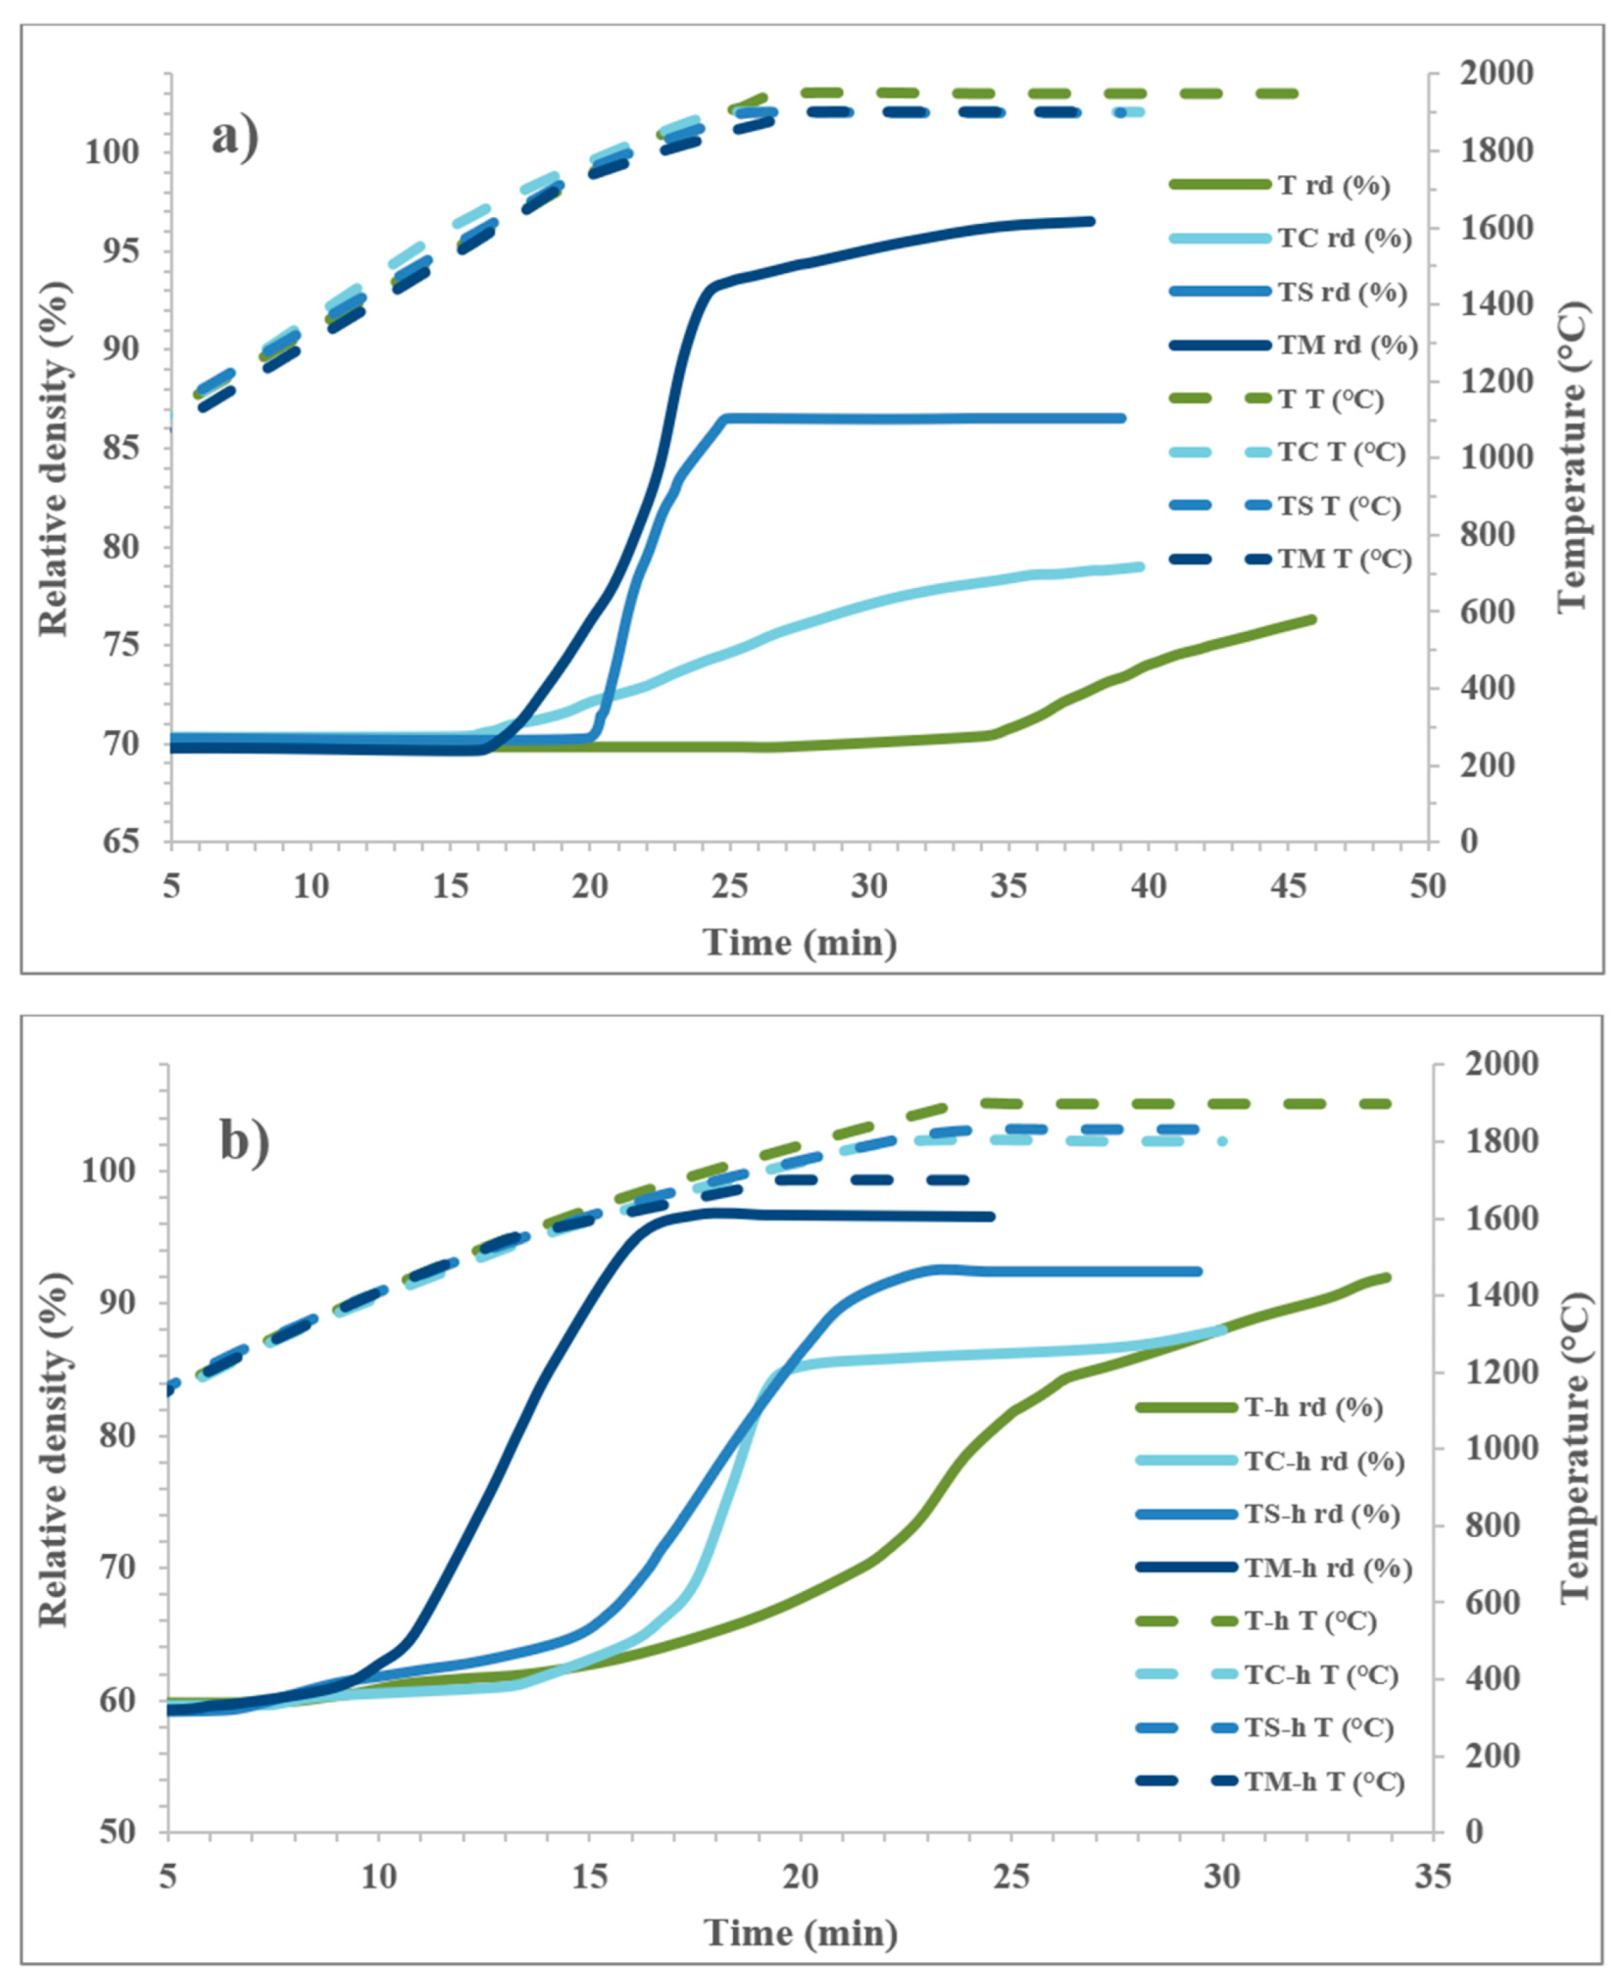
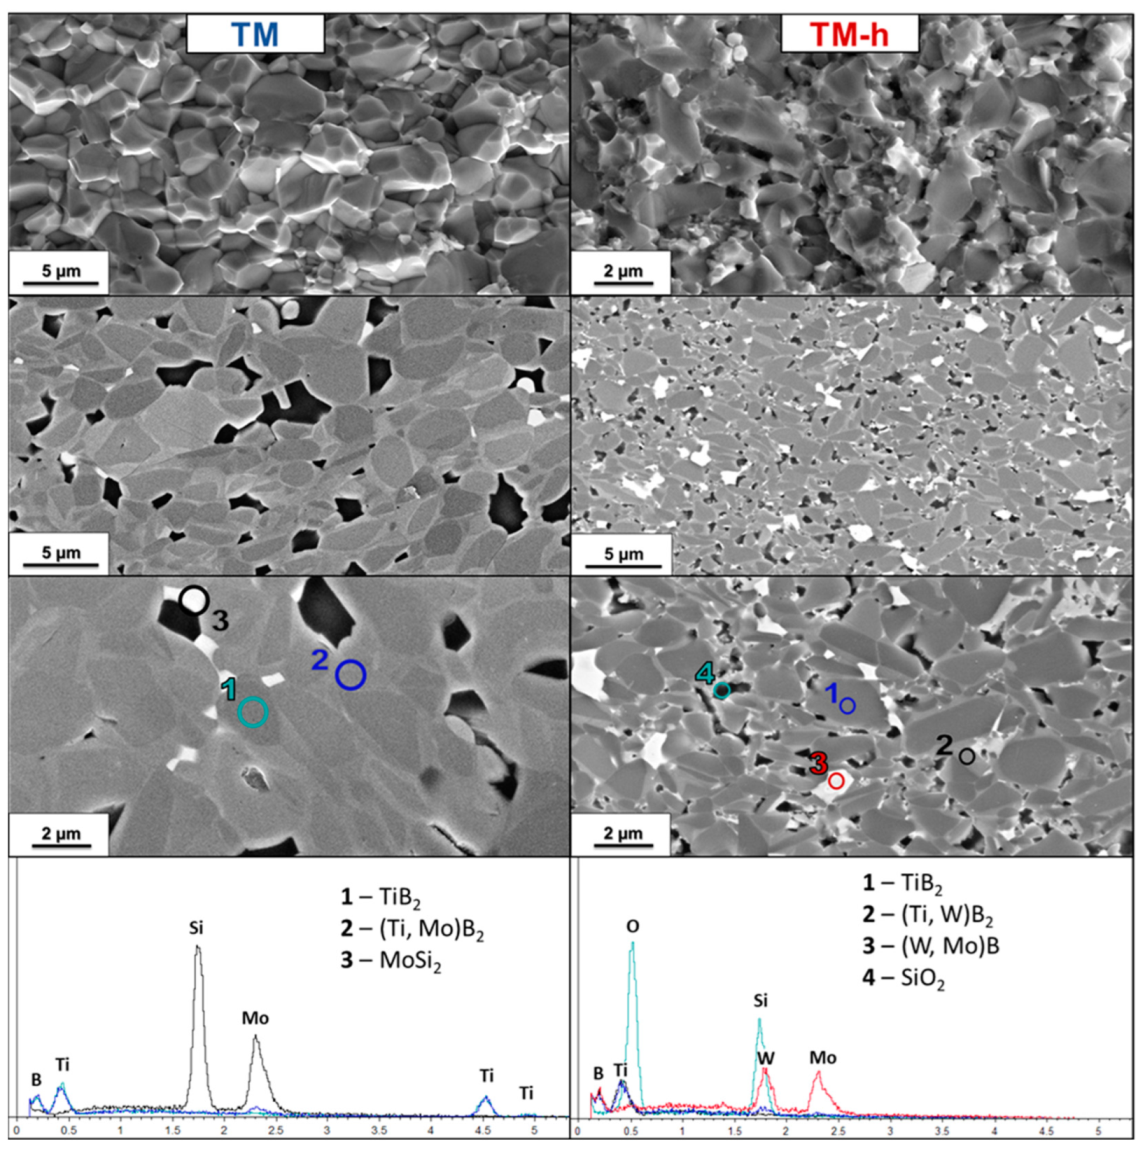
3.2. Sintering Behavior and Microstructural Features
Densification Mechanisms
3.3. Mechanical Properties
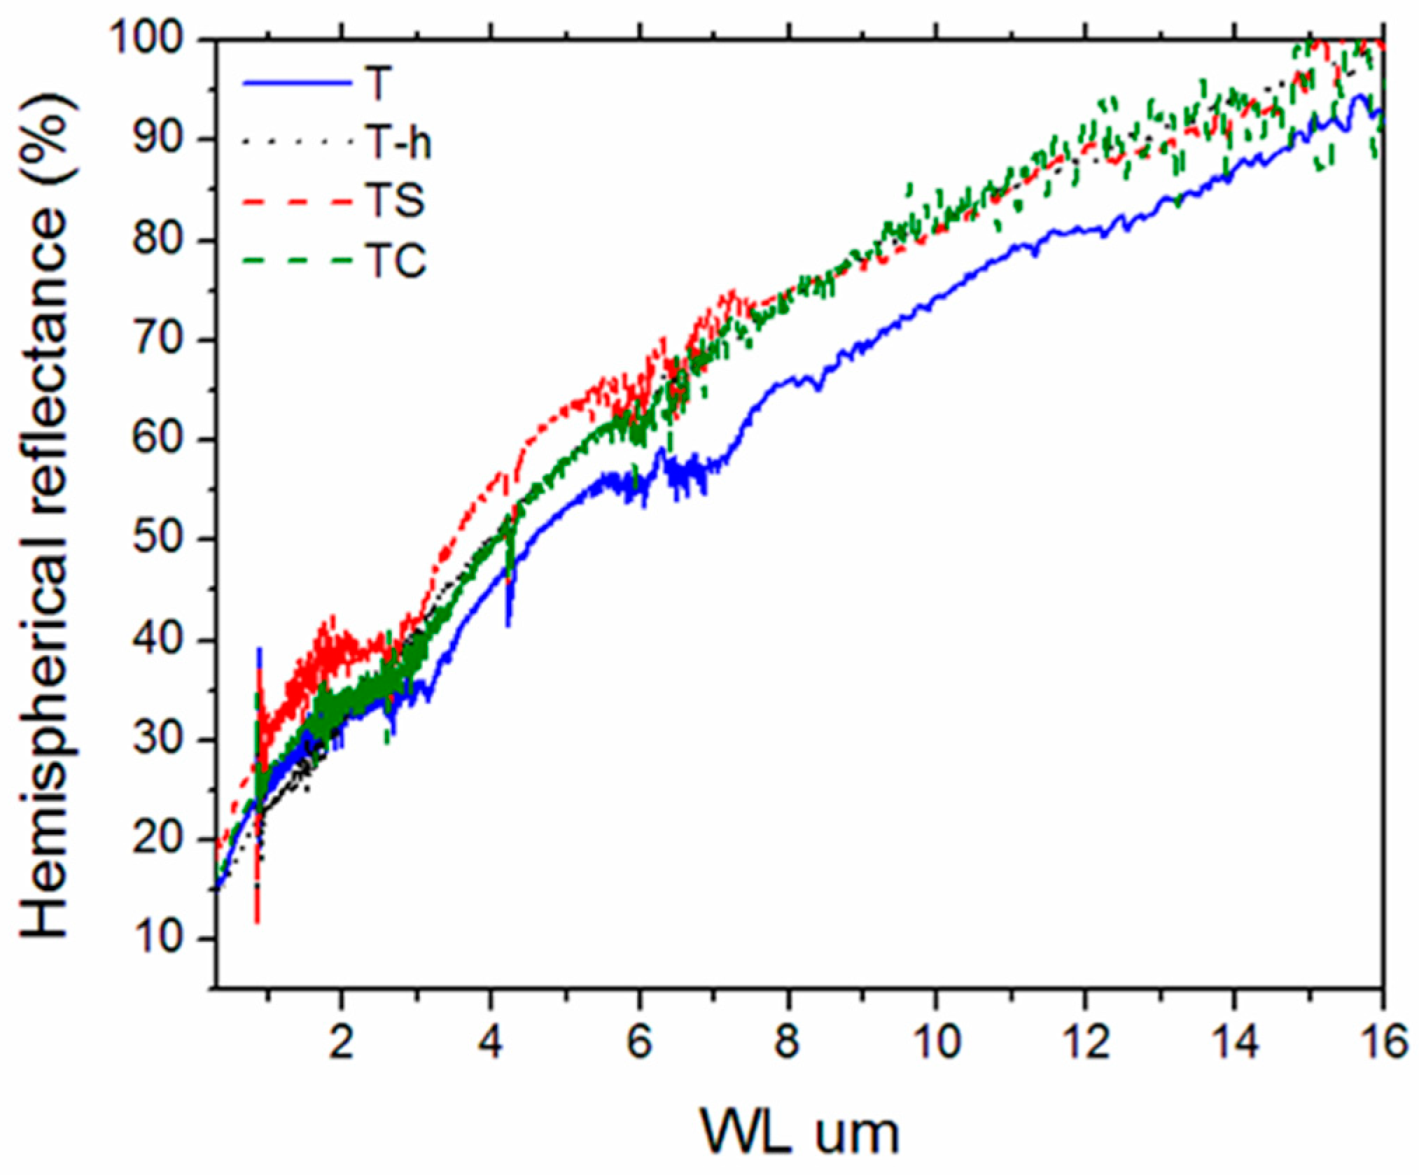
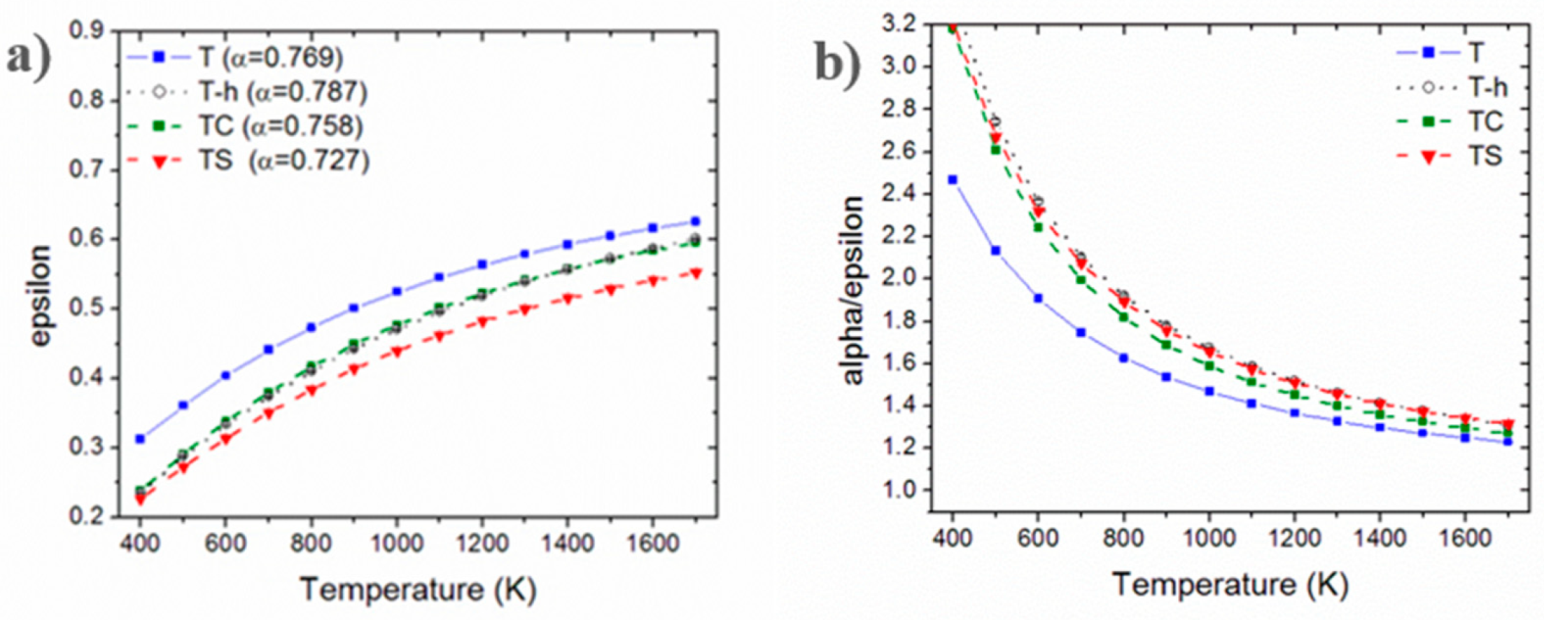
3.4. Optical Properties
4. Conclusions
Supplementary Materials
Author Contributions
Funding
Data Availability Statement
Acknowledgments
Conflicts of Interest
References
- Mandorf, V.; Hartwig, J.; Seldin, E.J. High Temperature Properties of Titanium Diboride. In High Temperature Materials II; Ault, G.M., Barclay, W.F., Munger, H.P., Eds.; Gordon and Breach: New York, NY, USA, 1963; pp. 455–467. [Google Scholar]
- Wiley, D.E.; Manning, W.R.; Hunter, O. Elastic Properties of Polycrystalline TiB2, ZrB2 and HfB2 from Room Temperature to 1300 °K. J. Less Common Met. 1969, 18, 149–157. [Google Scholar] [CrossRef]
- Baik, S.; Becher, P.F. Effect of Oxygen Contamination on Densification of TiB2. J Am. Ceram. Soc. 1987, 70, 527–530. [Google Scholar] [CrossRef]
- Matsushita, J.; Suzuki, T.; Sano, A. High Temperature Strength of TiB2 Ceramics. J. Ceram. Soc. Jpn. 1993, 101, 1074–1077. [Google Scholar] [CrossRef]
- Jüngling, T.; Sigl, L.S.; Oberacker, R.; Thümmler, F.; Schwetz, K.A. New Hardmetals Based on TiB2. Int. J. Refract. Met. Hard Mater. 1993, 12, 71–88. [Google Scholar] [CrossRef]
- Munro, R.G. Material Properties of Titanium Diboride. J. Res. Natl. Inst. Stand. Technol. 2000, 105, 709–720. [Google Scholar] [CrossRef]
- Murthy, T.S.R.C.; Basu, B.; Balasubramaniam, R.; Suri, A.K.; Subramanian, C.; Fotedar, R.K. Processing and Properties of TiB2 with MoSi2 Sinter-Additive: A First Report. J. Am. Ceram. Soc. 2006, 89, 131–138. [Google Scholar] [CrossRef]
- Murthy, T.S.R.C.; Sonber, J.K.; Subramanian, C.; Fotedar, R.K.; Kumar, S.; Gonal, M.R.; Suri, A.K. A New TiB2+CrSi2 Composite—Densification, Characterization and Oxidation Studies. Int. J. Refract. Met. Hard Mater. 2010, 28, 529–540. [Google Scholar] [CrossRef]
- Hamidzadeh Mahaseni, Z.; Dashti Germi, M.; Ahmadi, Z.; Shahedi Asl, M. Microstructural Investigation of Spark Plasma Sintered TiB2 Ceramics with Si3N4 Addition. Ceram. Int. 2018, 44, 13367–13372. [Google Scholar] [CrossRef]
- Ahmadi, Z.; Mahaseni, Z.H.; Germi, M.D.; Asl, M.S. Microstructure of Spark Plasma Sintered TiB2 and TiB2–AlN Ceramics. Adv. Ceram. Prog. 2019, 5, 36–40. [Google Scholar]
- Subramanian, C.; Murthy, T.S.R.C.; Suri, A.K. Synthesis and Consolidation of Titanium Diboride. Int. J. Refract. Met. Hard Mater. 2007, 25, 345–350. [Google Scholar] [CrossRef]
- Golla, B.R.; Bhandari, T.; Mukhopadhyay, A.; Basu, B. Titanium Diboride. In Ultra-High Temperature Ceramics; John Wiley & Sons, Ltd.: Hoboken, NJ, USA, 2014; pp. 316–360. ISBN 978-1-118-70085-3. [Google Scholar]
- Basu, B.; Raju, G.B.; Suri, A.K. Processing and Properties of Monolithic TiB2 Based Materials. Int. Mater. Rev. 2006, 51, 352–374. [Google Scholar] [CrossRef]
- Raju, G.B.; Basu, B. Development of High Temperature TiB2-Based Ceramics. Key Eng. Mater. 2009, 395, 89–124. [Google Scholar] [CrossRef]
- Sabahi Namini, A.; Seyed Gogani, S.N.; Shahedi Asl, M.; Farhadi, K.; Ghassemi Kakroudi, M.; Mohammadzadeh, A. Microstructural Development and Mechanical Properties of Hot Pressed SiC Reinforced TiB2 Based Composite. Int. J. Refract. Met. Hard Mater. 2015, 51, 169–179. [Google Scholar] [CrossRef]
- Masi, A.; Alvani, C.; Armenio, A.A.; Bellusci, M.; Celentano, G.; Zignani, C.F.; Fabbri, F.; Barbera, A.L.; Padella, F.; Pentimalli, M.; et al. Effect of Oxygen Contamination on Densification of Fe(Se,Te). J. Phys. Conf. Ser. 2020, 1559, 012051. [Google Scholar] [CrossRef]
- Tennery, V.J.; Finch, C.B.; Yust, C.S.; Clark, G.W. Structure-Property Correlations for TiB2-Based Ceramics Densified Using Active Liquid Metals. In Science of Hard Materials; Viswanadham, R.K., Rowcliffe, D.J., Gurland, J., Eds.; Springer: Boston, MA, USA, 1983; pp. 891–909. ISBN 978-1-4684-4319-6. [Google Scholar]
- Ferber, M.K.; Becher, P.F.; Finch, C.B. Effect of Microstructure on the Properties of TiB2 Ceramics. J. Am. Ceram. Soc. 1983, 66, C-2–C-3. [Google Scholar] [CrossRef]
- Baumgartner, H.; Steiger, R.A. Sintering and Properties of Titanium Diboride Made from Powder Synthesized in a Plasma-Arc Heater. J. Am. Ceram. Soc. 1984, 67, 207–212. [Google Scholar] [CrossRef]
- Pan, M.-J.; Hoffman, P.A.; Green, D.J.; Hellmann, J.R. Elastic Properties and Microcracking Behavior of Particulate Titanium Diboride–Silicon Carbide Composites. J. Am. Ceram. Soc. 1997, 80, 692–698. [Google Scholar] [CrossRef]
- Königshofer, R.; Fürnsinn, S.; Steinkellner, P.; Lengauer, W.; Haas, R.; Rabitsch, K.; Scheerer, M. Solid-State Properties of Hot-Pressed TiB2 Ceramics. Int. J. Refract. Met. Hard Mater. 2005, 23, 350–357. [Google Scholar] [CrossRef]
- Murthy, T.S.R.C.; Basu, B.; Srivastava, A.; Balasubramaniam, R.; Suri, A.K. Tribological Properties of TiB2 and TiB2–MoSi2 Ceramic Composites. J. Eur. Ceram. Soc. 2006, 26, 1293–1300. [Google Scholar] [CrossRef]
- Gu, M.L.; Xu, H.J.; Zhang, J.H.; Wei, Z. Influence of Hot Pressing Sintering Temperature and Time on Microstructure and Mechanical Properties of TiB2/Al2O3 Tool Materials. Adv. Mater. Res. 2012, 500, 629–633. [Google Scholar] [CrossRef]
- Turan, A.; Cinar Sahin, F.; Goller, G.; Yucel, O. Spark Plasma Sintering of Self-Propagating High-Temperature Synthesized TiB2 Ceramics. Nano Stud. 2017, 52, 27–34. [Google Scholar]
- Zhang, Z.H.; Shen, X.B.; Wang, F.C.; Lee, S.K.; Wang, L. Densification Behavior and Mechanical Properties of the Spark Plasma Sintered Monolithic TiB2 Ceramics. Mater. Sci. Eng. A 2010, 527, 5947–5951. [Google Scholar] [CrossRef]
- Balcı, Ö.; Burkhardt, U.; Schmidt, M.; Hennicke, J.; Barış Yağcı, M.; Somer, M. Densification, Microstructure and Properties of TiB2 Ceramics Fabricated by Spark Plasma Sintering. Mater. Charact. 2018, 145, 435–443. [Google Scholar] [CrossRef]
- Delbari, S.A.; Sabahi Namini, A.; Shahedi Asl, M. Hybrid Ti Matrix Composites with TiB2 and TiC Compounds. Mater. Today Commun. 2019, 20, 100576. [Google Scholar] [CrossRef]
- Sabahi Namini, A.; Motallebzadeh, A.; Nayebi, B.; Shahedi Asl, M.; Azadbeh, M. Microstructure–Mechanical Properties Correlation in Spark Plasma Sintered Ti–4.8 Wt.% TiB2 Composites. Mater. Chem. Phys. 2019, 223, 789–796. [Google Scholar] [CrossRef]
- Shayesteh, F.; Delbari, S.A.; Ahmadi, Z.; Shokouhimehr, M.; Shahedi Asl, M. Influence of TiN Dopant on Microstructure of TiB2 Ceramic Sintered by Spark Plasma. Ceram. Int. 2019, 45, 5306–5311. [Google Scholar] [CrossRef]
- Nguyen, T.P.; Hamidzadeh Mahaseni, Z.; Dashti Germi, M.; Delbari, S.A.; Le, Q.V.; Ahmadi, Z.; Shokouhimehr, M.; Shahedi Asl, M.; Sabahi Namini, A. Densification Behavior and Microstructure Development in TiB2 Ceramics Doped with H-BN. Ceram. Int. 2020, 46, 18970–18975. [Google Scholar] [CrossRef]
- Vajdi, M.; Sadegh Moghanlou, F.; Ahmadi, Z.; Motallebzadeh, A.; Shahedi Asl, M. Thermal Diffusivity and Microstructure of Spark Plasma Sintered TiB2SiCTi Composite. Ceram. Int. 2019, 45, 8333–8344. [Google Scholar] [CrossRef]
- Ağaoğulları, D.; Gökçe, H.; Duman, İ.; Öveçoğlu, M.L. Influences of Metallic Co and Mechanical Alloying on the Microstructural and Mechanical Properties of TiB2 Ceramics Prepared via Pressureless Sintering. J. Eur. Ceram. Soc. 2012, 32, 1949–1956. [Google Scholar] [CrossRef]
- Matsushita, J.; Sano, A. Sinterability of TiB2 Ceramics Containing Cr and C as the Sintering Aids. J. Ceram. Soc. Jpn. 1992, 100, 593–595. [Google Scholar] [CrossRef]
- Cymerman, K.; Oleszak, D.; Rosinski, M.; Michalski, A. Structure and Mechanical Properties of TiB2/TiC–Ni Composites Fabricated by Pulse Plasma Sintering Method. Adv. Powder Technol. 2018, 29, 1795–1803. [Google Scholar] [CrossRef]
- Missiaen, J.M.; Chaix, J.M. The Homogeneity of Phase Repartition in TiB2–Fe Composites Using Variance and Covariance Analysis. J. Microsc. 1994, 175, 195–204. [Google Scholar] [CrossRef]
- Tian, S.F.; Jiang, L.T.; Guo, Q.; Wu, G.H. Effect of Surface Roughness on Tribological Properties of TiB2/Al Composites. Mater. Des. 2014, 53, 129–136. [Google Scholar] [CrossRef]
- Bača, Ľ.; Lenčéš, Z.; Jogl, C.; Neubauer, E.; Vitkovič, M.; Merstallinger, A.; Šajgalík, P. Microstructure Evolution and Tribological Properties of TiB2/Ni–Ta Cermets. J. Eur. Ceram. Soc. 2012, 32, 1941–1948. [Google Scholar] [CrossRef]
- Kang, E.S.; Jang, C.W.; Lee, C.H.; Kim, C.H.; Kim, D.K. Effect of Iron and Boron Carbide on the Densification and Mechanical Properties of Titanium Diboride Ceramics. J. Am. Ceram. Soc. 1989, 72, 1868–1872. [Google Scholar] [CrossRef]
- Hunt, M.P.; Logan, K.V. Pressureless Sintering of Titanium Diboride Powders. Dev. Strateg. Mater. Ceram. Eng. Sci. Proc. 2008, 29, 211–221. [Google Scholar]
- Fu, Z.; Koc, R. Sintering and Mechanical Properties of TiB2-TiC-Ni Using Submicron Borides and Carbides. Mater. Sci. Eng. A 2016, 676, 278–288. [Google Scholar] [CrossRef]
- Karthiselva, N.S.; Murty, B.S.; Bakshi, S.R. Low Temperature Synthesis of Dense TiB2 Compacts by Reaction Spark Plasma Sintering. Int. J. Refract. Met. Hard Mater. 2015, 48, 201–210. [Google Scholar] [CrossRef]
- Tuffé, S.; Dubois, J.; Fantozzi, G.; Barbier, G. Densification, Microstructure and Mechanical Properties of TiB2-B4C Based Composites. Int. J. Refract. Met. Hard Mater. 1996, 14, 305–310. [Google Scholar] [CrossRef]
- Shahedi Asl, M.; Delbari, S.A.; Shayesteh, F.; Ahmadi, Z.; Motallebzadeh, A. Reactive Spark Plasma Sintering of TiB2–SiC–TiN Novel Composite. Int. J. Refract. Met. Hard Mater. 2019, 81, 119–126. [Google Scholar] [CrossRef]
- Zhao, H.; Cheng, Y.-B. Formation of TiB2–TiC Composites by Reactive Sintering. Ceram. Int. 1999, 25, 353–358. [Google Scholar] [CrossRef]
- Demirskyi, D.; Nishimura, T.; Sakka, Y.; Vasylkiv, O. High-Strength TiB2–TaC Ceramic Composites Prepared Using Reactive Spark Plasma Consolidation. Ceram. Int. 2016, 42, 1298–1306. [Google Scholar] [CrossRef]
- Telle, R. Analysis of Pressureless Sintering of Titanium Diboride Ceramics with Nickel, Cobalt, and Tungsten Carbide Additives. J. Eur. Ceram. Soc. 2019, 39, 2266–2276. [Google Scholar] [CrossRef]
- Kim, H.-J.; Choi, H.-J.; Lee, J.-G. Mechanochemical Synthesis and Pressureless Sintering of TiB2–AlN Composites. J. Am. Ceram. Soc. 2002, 85, 1022–1024. [Google Scholar] [CrossRef]
- Jain, D.; Reddy, K.M.; Mukhopadhyay, A.; Basu, B. Achieving Uniform Microstructure and Superior Mechanical Properties in Ultrafine Grained TiB2–TiSi2 Composites Using Innovative Multi Stage Spark Plasma Sintering. Mater. Sci. Eng. A 2010, 528, 200–207. [Google Scholar] [CrossRef]
- Murthy, T.S.R.C.; Balasubramaniam, R.; Basu, B.; Suri, A.K.; Mungole, M.N. Oxidation of Monolithic TiB2 and TiB2–20wt.% MoSi2 Composite at 850 °C. J. Eur. Ceram. Soc. 2006, 26, 187–192. [Google Scholar] [CrossRef]
- Mukhopadhyay, A.; Raju, G.B.; Basu, B. Understanding Influence of MoSi2 Addition (5 Weight Percent) on Tribological Properties of TiB2. Met. Mater. Trans. A 2008, 39, 2998–3013. [Google Scholar] [CrossRef]
- Raju, G.B.; Basu, B.; Suri, A.K. Oxidation Kinetics and Mechanisms of Hot-Pressed TiB2–MoSi2 Composites. J. Am. Ceram. Soc. 2008, 91, 3320–3327. [Google Scholar] [CrossRef]
- Fahrenholtz, W.G.; Hilmas, G.E.; Talmy, I.G.; Zaykoski, J.A. Refractory Diborides of Zirconium and Hafnium. J. Am. Ceram. Soc. 2007, 90, 1347–1364. [Google Scholar] [CrossRef]
- Sani, E.; Meucci, M.; Mercatelli, L.; Balbo, A.; Musa, C.; Licheri, R.; Orrù, R.; Cao, G. Titanium Diboride Ceramics for Solar Thermal Absorbers. Sol. Energy Mater. Sol. Cells 2017, 169, 313–319. [Google Scholar] [CrossRef]
- Sani, E.; Mercatelli, L.; Sans, J.-L.; Silvestroni, L.; Sciti, D. Porous and Dense Hafnium and Zirconium Ultra-High Temperature Ceramics for Solar Receivers. Opt. Mater. 2013, 36, 163–168. [Google Scholar] [CrossRef]
- Sani, E.; Mercatelli, L.; Meucci, M.; Silvestroni, L.; Balbo, A.; Sciti, D. Process and Composition Dependence of Optical Properties of Zirconium, Hafnium and Tantalum Borides for Solar Receiver Applications. Sol. Energy Mater. Sol. Cells 2016, 155, 368–377. [Google Scholar] [CrossRef]
- Sani, E.; Landi, E.; Sciti, D.; Medri, V. Optical Properties of ZrB2 Porous Architectures. Sol. Energy Mater. Sol. Cells 2016, 144, 608–615. [Google Scholar] [CrossRef]
- Silvestroni, L.; Sciti, D.; Zoli, L.; Balbo, A.; Zanotto, F.; Orrù, R.; Licheri, R.; Musa, C.; Mercatelli, L.; Sani, E. An Overview of Ultra-Refractory Ceramics for Thermodynamic Solar Energy Generation at High Temperature. Renew. Energy 2019, 133, 1257–1267. [Google Scholar] [CrossRef]
- Sciti, D.; Failla, S.; Turan, S.; Savaci, U.; Galizia, P. Properties and Ballistic Tests of Strong B4C-TiB2 Composites Densified by Gas Pressure Sintering. J. Eur. Ceram. Soc. 2023, 43, 1334–1342. [Google Scholar] [CrossRef]
- Suryanarayana, C.; Klassen, T.; Ivanov, E. Synthesis of Nanocomposites and Amorphous Alloys by Mechanical Alloying. J. Mater. Sci. 2011, 46, 6301–6315. [Google Scholar] [CrossRef]
- Failla, S.; Melandri, C.; Zoli, L.; Zucca, G.; Sciti, D. Hard and Easy Sinterable B4C-TiB2-Based Composites Doped with WC. J. Eur. Ceram. Soc. 2018, 38, 3089–3095. [Google Scholar] [CrossRef]
- Silvestroni, L.; Failla, S.; Gilli, N.; Melandri, C.; Savacı, U.; Turan, S.; Sciti, D. Disclosing Small Scale Length Properties in Core-Shell Structured B4C-TiB2 Composites. Mater. Des. 2021, 197, 109204. [Google Scholar] [CrossRef]
- Zou, J.; Sun, S.-K.; Zhang, G.-J.; Kan, Y.-M.; Wang, P.-L.; Ohji, T. Chemical Reactions, Anisotropic Grain Growth and Sintering Mechanisms of Self-Reinforced ZrB2–SiC Doped with WC. J. Am. Ceram. Soc. 2011, 94, 1575–1583. [Google Scholar] [CrossRef]
- Fahrenholtz, W.G.; Wuchina, E.J.; Lee, W.E.; Zhou, Y. Ultra-High Temperature Ceramics: Materials for Extreme Environment Applications; John Wiley & Sons: Hoboken, NJ, USA, 2014; ISBN 978-1-118-92441-9. [Google Scholar]
- Park, J.-H.; Koh, Y.-H.; Kim, H.-E.; Hwang, C.S.; Kang, E.S. Densification and Mechanical Properties of Titanium Diboride with Silicon Nitride as a Sintering Aid. J. Am. Ceram. Soc. 1999, 82, 3037–3042. [Google Scholar] [CrossRef]
- Sciti, D.; Silvestroni, L.; Celotti, G.; Melandri, C.; Guicciardi, S. Sintering and Mechanical Properties of ZrB2–TaSi2 and HfB2–TaSi2 Ceramic Composites. J. Am. Ceram. Soc. 2008, 91, 3285–3291. [Google Scholar] [CrossRef]
- Silvestroni, L.; Kleebe, H.-J.; Lauterbach, S.; Müller, M.; Sciti, D. Transmission Electron Microscopy on Zr- and Hf-Borides with MoSi2 Addition: Densification Mechanisms. J. Mater. Res. 2010, 25, 828–834. [Google Scholar] [CrossRef]
- Katrych, S.; Grytsiv, A.; Bondar, A.; Rogl, P.; Velikanova, T.; Bohn, M. Structural Materials: Metal–Silicon–Boron: On the Melting Behavior of Mo–Si–B Alloys. J. Alloys Compd. 2002, 347, 94–100. [Google Scholar] [CrossRef]
- Demirskyi, D.; Agrawal, D.; Ragulya, A. Tough Ceramics by Microwave Sintering of Nanocrystalline Titanium Diboride Ceramics. Ceram. Int. 2014, 40, 1303–1310. [Google Scholar] [CrossRef]
- Demirskyi, D.; Sakka, Y. High-Temperature Reaction Consolidation of TaC–TiB2 Ceramic Composites by Spark-Plasma Sintering. J. Eur. Ceram. Soc. 2015, 35, 405–410. [Google Scholar] [CrossRef]
- MacMillan, M.F.; Devaty, R.P.; Choyke, W.J.; Goldstein, D.R.; Spanier, J.E.; Kurtz, A.D. Infrared Reflectance of Thick P-type Porous SiC Layers. J. Appl. Phys. 1996, 80, 2412–2419. [Google Scholar] [CrossRef]
- Sciti, D.; Silvestroni, L.; Sans, J.-L.; Mercatelli, L.; Meucci, M.; Sani, E. Tantalum Diboride-Based Ceramics for Bulk Solar Absorbers. Sol. Energy Mater. Sol. Cells 2014, 130, 208–216. [Google Scholar] [CrossRef]
- Tao, Y.; Mao, Z.; Yang, Z.; Zhang, J. Preparation and Characterization of Polymer Matrix Passive Cooling Materials with Thermal Insulation and Solar Reflection Properties Based on Porous Structure. Energy Build. 2020, 225, 110361. [Google Scholar] [CrossRef]
- Caron, S.; Garrido, J.; Ballestrín, J.; Sutter, F.; Röger, M.; Manzano-Agugliaro, F. A Comparative Analysis of Opto-Thermal Figures of Merit for High Temperature Solar Thermal Absorber Coatings. Renew. Sustain. Energy Rev. 2022, 154, 111818. [Google Scholar] [CrossRef]
- G03 Committee. Tables for Reference Solar Spectral Irradiances: Direct Normal and Hemispherical on 37 Tilted Surface; ASTM International: West Conshohocken, PA, USA, 2012. [Google Scholar]
- Watanabe, H.; Ishii, J.; Wakabayashi, H.; Kumano, T.; Hanssen, L. Spectral Emissivity Measurements. In Experimental Methods in the Physical Sciences; Germer, T.A., Zwinkels, J.C., Tsai, B.K., Eds.; Academic Press: Cambridge, MA, USA, 2014; Volume 46, pp. 333–366. [Google Scholar]
- Sciti, D.; Silvestroni, L.; Mercatelli, L.; Sans, J.-L.; Sani, E. Suitability of Ultra-Refractory Diboride Ceramics as Absorbers for Solar Energy Applications. Sol. Energy Mater. Sol. Cells 2013, 109, 8–16. [Google Scholar] [CrossRef]
- Silvestroni, L.; Capiani, C.; Sciti, D.; Sani, E. Coloring Zirconium Oxide for Novel Energy Saving Industrial Applications. Renew. Energy 2022, 190, 223–231. [Google Scholar] [CrossRef]
- Arancibia-Bulnes, C.A.; Estrada, C.A.; Ruiz-Suárez, J.C. Solar Absorptance and Thermal Emittance of Cermets with Large Particles. J. Phys. D Appl. Phys. 2000, 33, 2489. [Google Scholar] [CrossRef]


| Label | Sintering Aid | HEM | Max T/Time | Bulk Density | Relative Density | Crystalline Phases | Mean Grain Size | HV 1.0 | KIc |
|---|---|---|---|---|---|---|---|---|---|
| vol.% | No | °C/min | g/cm3 | % | TiB2, μm | GPa | MPa m1/2 | ||
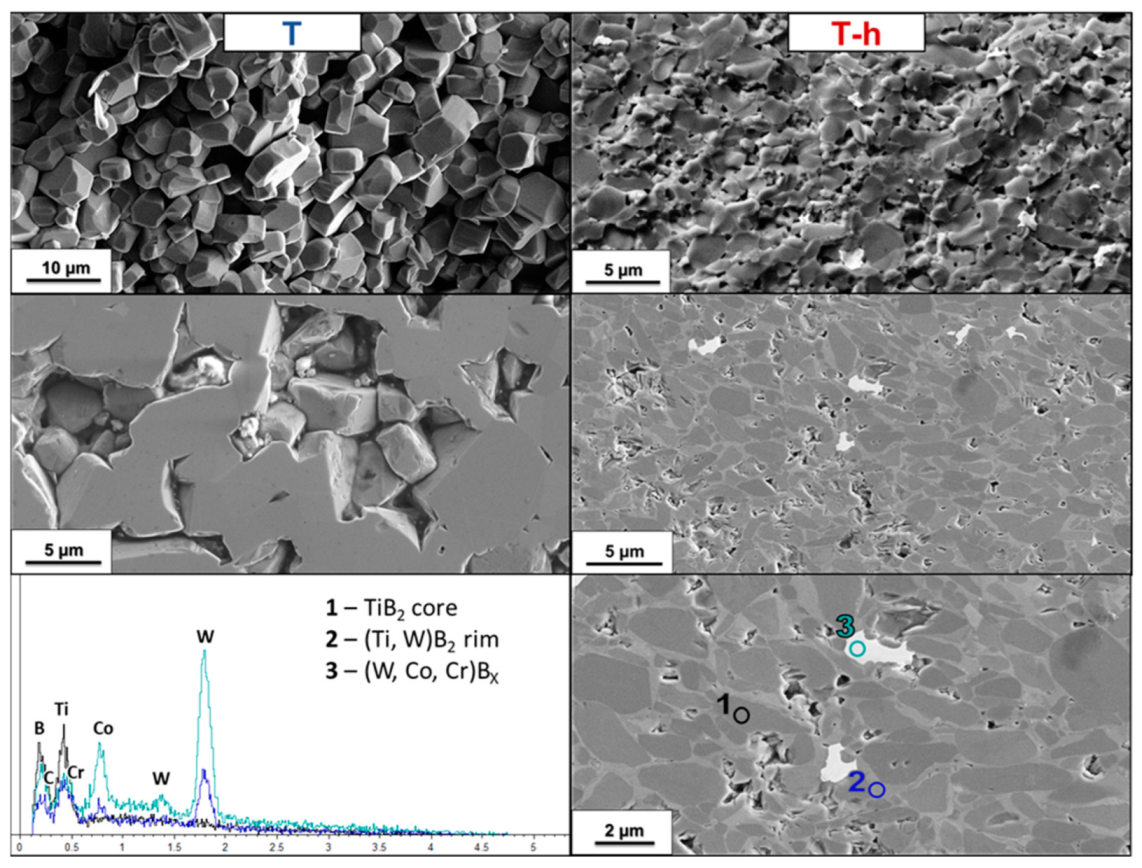
| T | No | No | 1950, 20 | 3.45 | ≈76 | TiB2 | 3.2 ± 0.1 | - | - |
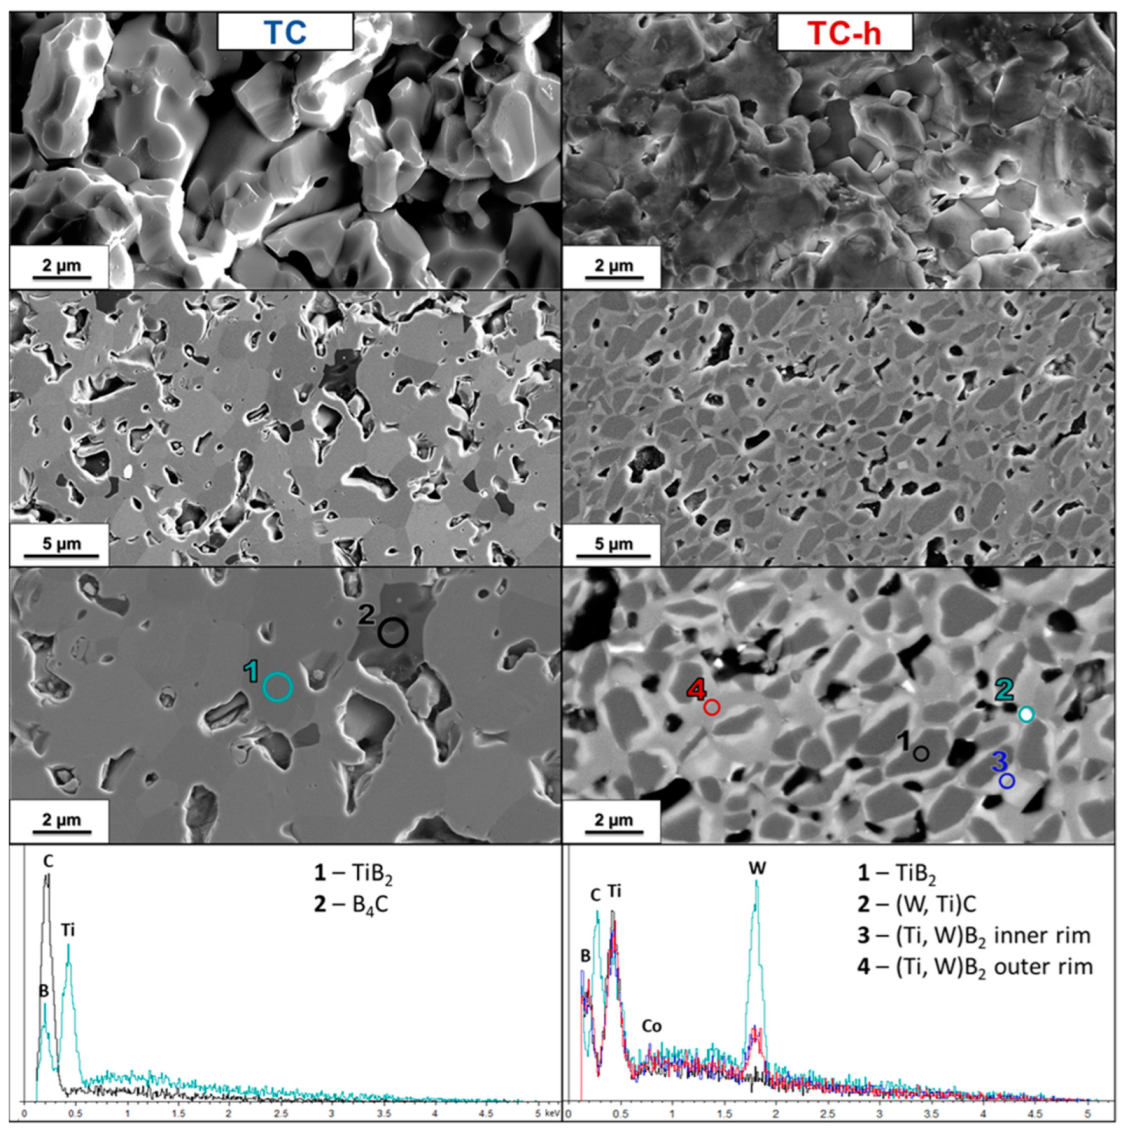
| TC | 5 B4C | No | 1900, 15 | 3.71 | ≈78 | TiB2 | 2.4 ± 0.1 | - | - |
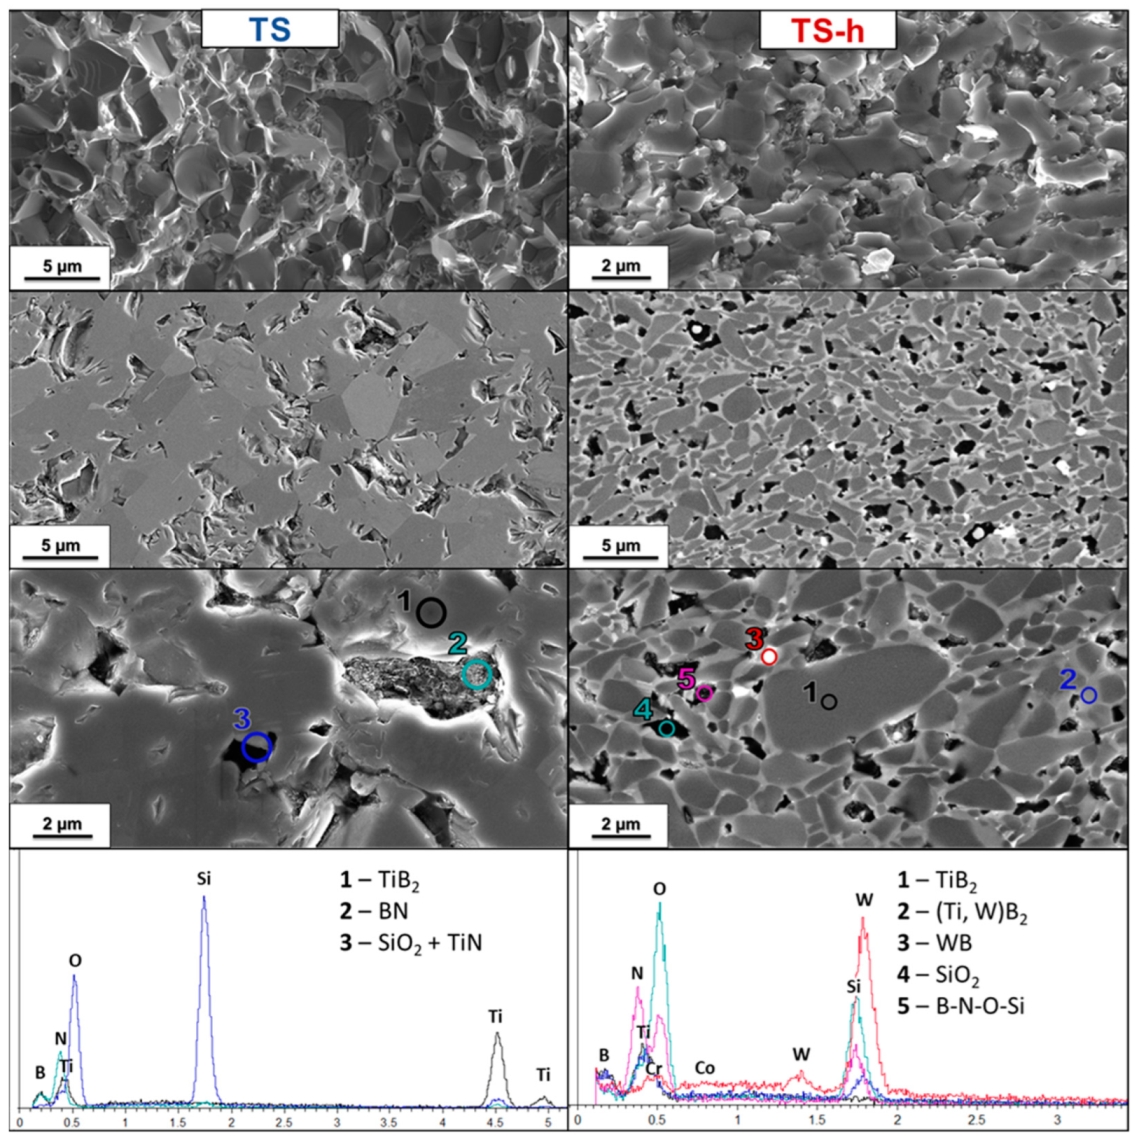
| TS | 5 Si3N4 | No | 1900, 15 | 4.28 | 85.6 * (>98) | TiB2, TiN | 3.1 ± 0.1 | 22.2 ± 0.5 | 5.4 ± 0.4 |
| TM | 5 MoSi2 | No | 1900, 10 | 4.43 | 95.1 * (>98) | TiB2, MoSi2 | 1.8 ± 0.1 | 24.4 ± 0.4 | 5.4 ± 0.2 |
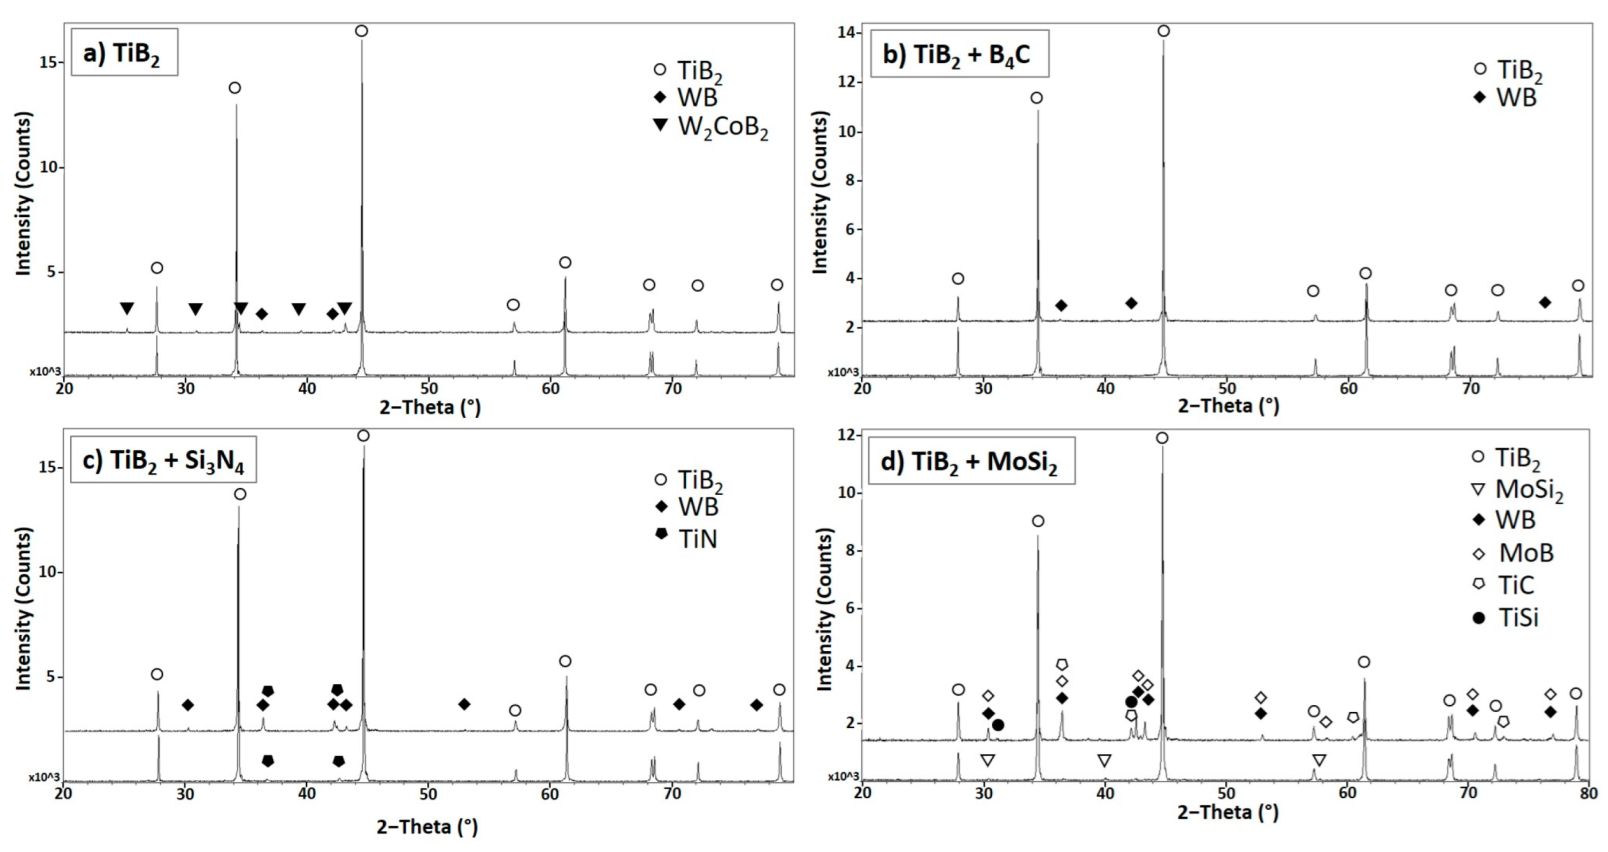
| T-h | No | WC media | 1900, 10 | 4.60 | 93.4 | TiB2, WB, W2CoB2 | 1.0 ± 0.1 | 24.5 ± 0.2 | 5.0 ± 0.5 |
| TC-h | 5 B4C | WC media | 1900, 10 | 4.22 | 87.9 | TiB2, WB | 1.3 ± 0.1 | 19.6 ± 0.3 | 4.1 ± 0.1 |
| TS-h | 5 Si3N4 | WC media | 1830, 10 | 4.54 | 92.4 * (>98) | TiB2, TiN, WB | 0.9 ± 0.1 | 23.2 ± 0.2 | 3.6 ± 0.1 |
| TM-h | 5 MoSi2 | WC media | 1700, 10 | 4.67 | 94.7 * (>98) | TiB2, TiC, TiSi, MoB, WB | 0.8 ± 0.1 | 24.4 ± 0.2 | 3.5 ± 0.1 |
| Sample Composition | Processing Details: Method, Temperature, Dwell Time | Relative Density | Mean Grain Size | HV 1.0 | KIc | Reference |
|---|---|---|---|---|---|---|
| wt% | °C/min | % | TiB2, μm | GPa | MPa m1/2 | |
| TiB2 | HP, 1800, 60 | 90 | - | 24 | 5.8 | Park et al. [64] |
| TiB2 | MWS, 1700, 10 | 95.5 | 2.0 | 24 | 5.6 | Demirskyi et al. [68] |
| TiB2 | SPS, 2000, 5 | 96 | 6–10 | 23.5 | 5.5 | Demirskyi and Sakka [69] |
| TiB2 | HEM, HP, 1900, 10 | 93.4 | 1.0 | 24.5 | 5.0 | Present work |
| TiB2 + 2.5Si3N4 | HP, 1800, 60 | 99 | - | 27 | 5.1 | Park et al. [64] |
| TiB2 + 10Si3N4 | HP, 1800, 60 | 96 | - | 20 | 5.4 | Park et al. [64] |
| TiB2 + 3.6Si3N4 | HP, 1900, 15 | >98 * | 3.1 | 22.2 | 5.4 | Present work |
| TiB2 + 3.6Si3N4 | HEM, HP, 1830, 15 | >98 * | 0.9 | 23.2 | 3.6 | Present work |
| TiB2 + 6.8MoSi2 | HP, 1900, 10 | >98 * | 1.8 | 24.4 | 5.4 | Present work |
| TiB2 + 6.8MoSi2 | HEM, HP, 1700, 10 | >98 * | 0.8 | 24.4 | 3.5 | Present work |
| TiB2 + 10MoSi2 | HP, 1700, 60 | 99.3 | 1–2 | 27 | 4.0 | Ch. Murthy et al. [7] |
| TiB2 + 20MoSi2 | HP, 1700, 60 | 98.7 | 1–2 | 25 | 5.0 | Ch. Murthy et al. [7] |
| TiB2 + 10TaC | SPS, 2000, 5 | >98 | 2–4 | 28.8 | 5.9 | Demirskyi and Sakka [69] |
Disclaimer/Publisher’s Note: The statements, opinions and data contained in all publications are solely those of the individual author(s) and contributor(s) and not of MDPI and/or the editor(s). MDPI and/or the editor(s) disclaim responsibility for any injury to people or property resulting from any ideas, methods, instructions or products referred to in the content. |
© 2023 by the authors. Licensee MDPI, Basel, Switzerland. This article is an open access article distributed under the terms and conditions of the Creative Commons Attribution (CC BY) license (https://creativecommons.org/licenses/by/4.0/).
Share and Cite
Taraborelli, S.; Failla, S.; Sani, E.; Sciti, D. Sintering, Mechanical and Optical Properties of TiB2 Composites with and without High-Energy Milling. Nanomaterials 2023, 13, 2683. https://doi.org/10.3390/nano13192683
Taraborelli S, Failla S, Sani E, Sciti D. Sintering, Mechanical and Optical Properties of TiB2 Composites with and without High-Energy Milling. Nanomaterials. 2023; 13(19):2683. https://doi.org/10.3390/nano13192683
Chicago/Turabian StyleTaraborelli, Simone, Simone Failla, Elisa Sani, and Diletta Sciti. 2023. "Sintering, Mechanical and Optical Properties of TiB2 Composites with and without High-Energy Milling" Nanomaterials 13, no. 19: 2683. https://doi.org/10.3390/nano13192683