
Structure and Magnetic Properties of ErFexMn12−x (7.0 ≤ x ≤ 9.0, Δx = 0.2)

Abstract
:1. Introduction
2. Experimental Methods
3. Experimental Results and Analysis
4. Conclusions
Author Contributions
Funding
Data Availability Statement
Conflicts of Interest
References
- Florio, J.V.; Rundle, R.E.; Snow, A.I. Compounds of Thorium with Transition Metals. I. The Thorium-Manganese System. Acta Cryt. 1952, 5, 449. [Google Scholar] [CrossRef]
- Deportes, J.; Givord, D.; Lemaire, R.; Nagaï, H. Magnetic interactions in the R-Mn12 compounds. Physica B+C 1977, 86–88, 69–70. [Google Scholar] [CrossRef]
- Kirchmayr, H.R. Magnetic properties of rare earth—Manganese compounds. IEEE Trans. Magn. 1966, 2, 493–499. [Google Scholar] [CrossRef]
- Yang, Y.C. Structural and magnetic properties of Y(Mn(1−x)Fex)12. Acta Metall. Sin. 1981, 17, 355–358. [Google Scholar]
- Li, H.S.; Coey, J.M.D. Handbook of Magnetic Materials; Bushcow, K.H.J., Ed.; Elsevier Science Publishers B.V.: Amsterdam, The Netherlands, 1991; Volume 6, pp. 6–41. [Google Scholar]
- Mooij, D.B.; De Buschow, K.H.J. Some novel ternary ThMn12-type compounds. J. Less Common Met. 1988, 136, 207–215. [Google Scholar] [CrossRef]
- Ohashi, K.; Tawara, Y.; Osugi, R.; Tawara, Y. The magnetic and structural properties of R-Ti-Fe ternary compounds. IEEE Trans. Magn. 1987, 23, 3101–3103. [Google Scholar] [CrossRef]
- Wang, X.Z.; Chevalier, B.; Berlureau, T.; Etourneau, J.; Coey, J.M.D.; Cadogan, J.M. Iron-rich pseudobinary alloys with the ThMn12 structure obtained by melt spinning: Gd(FenAl12−n), n = 6, 8. J. Less Common Met. 1988, 138, 235–240. [Google Scholar] [CrossRef] [Green Version]
- Muller, K.H. Magnetic material R, Fe, Mo, (Co) with ThMn12 structure. J. Appl. Phys. 1988, 64, 249–251. [Google Scholar] [CrossRef]
- Okamoto, N.; Nagai, H.; Yoshie, H.; Tsujimura, A.; Hihara, T. The coexistence of ferromagnetic and antiferromagnetic interactions in the GdMn12 compound. J. Magn. Magn. Mater. 1987, 70, 299–300. [Google Scholar] [CrossRef]
- Yang, Y.C.; Kebe, B.; James, W.J.; Deportes, J.; Yelon, W. Structural and magetic properties of Y(Mn1−xFex)12. J. Appl. Phys. 1981, 52, 2077–2078. [Google Scholar] [CrossRef]
- Amako, Y.; Saoka, S.; Yoshie, H.; Nagai, H.; Adachi, K. Antiferromagnetic Ordering Temperature of RMn12−xFex (R = Rare Earth). J. Phys. Soc. Jpn. 1995, 64, 1860–1861. [Google Scholar] [CrossRef]
- Stankiewicz, J.; Bartolome, J.; Morales, M.; Bacmann, M.; Fruchart, D. Resistivity of RMn12−xFex alloys. J. Appl. Phys. 2001, 90, 5632–5636. [Google Scholar] [CrossRef]
- Morales, M.; Bacmann, M.; Wolfers, P.; Fruchart, D.; Ouladdiaf, B. Magnetic properties and interactions in the RMn12−xFex series R(Y, Ho, Er, Nd; x ≤ 9). Phys. Rev. B 2001, 64, 144426. [Google Scholar] [CrossRef]
- Mao, W.H.; Yang, J.B.; Cheng, B.P.; Yang, Y.C. Unusual magnetic properties of Ho(Fe0.6Mn0.4)12. Solid State Commun. 1999, 109, 655–659. [Google Scholar] [CrossRef]
- Dong, S.Z.; Yang, J.; Yang, Y.C. Structure and Magnetic Properties of Y(Fe1−xMnx)12 Compounds and Their Nitrides (x = 0.2 and 0.4). Solid State Commun. 1995, 94, 809–812. [Google Scholar] [CrossRef]
- Stankiewicz, J.; Bartolome, J.; Fruchart, D. Spin Disorder Scattering in Magnetic Metallic Alloys. Phys. Rev. Lett. 2002, 89, 106602. [Google Scholar] [CrossRef] [PubMed]
- Yang, J.B.; Yelon, W.B.; James, W.J.; Cai, Q.S.; Eckert, D.; Handstein, A.; Muller, K.H.; Yang, Y.C. Structural and magnetic properties of RFexMn12−x, (R = Ho,Y). Phys. Rev. B 2002, 65, 064444. [Google Scholar] [CrossRef]
- Stankiewicz, J.; Bartolome, J. Magnetic scattering in RMn12−xFex alloys. Phys. Rev. B 2002, 67, 092409. [Google Scholar] [CrossRef]
- Pique, C.; Abad, E.; Blanco, J.A.; Burriel, R.; Fernandez-Diaz, M.T. Interplay between competing exchange interactions and magnetocrystalline anisotropies in YFexMn12−x: The magnetic phase diagram. Phys. Rev. B 2005, 71, 174422. [Google Scholar] [CrossRef]
- Shelyapina, M.G.; Morales, M.; Bacmann, M.; Baudelet, F.; Fruchart, D.; Giorgetti, C.; Hlil, E.K.; Krill, G.; Wolfers, P. Magnetic properties of RMn12−xFex type compounds: I. X-ray magnetic circular dichroism study of the ErMn12−xFex series with x = 0, 7, 8 and 9. J. Alloys Compd. 2004, 368, 84–93. [Google Scholar] [CrossRef]
- Pique, C.; Blanco, J.A.; Burriel, R.; Abad, E.; Artigas, M.; Fernandez-Diaz, M.T. Influence of 3d-4f interactions in the magnetic phases of RFexMn12−x (R = Gd, Tb, and Dy) compounds: Coexistence of ferromagnetism and antiferromagnetism at different crystallographic sites. Phys. Rev. B 2007, 75, 224424. [Google Scholar] [CrossRef]
- Xia, Y.H.; Wu, R.; Zhang, Y.F.; Liu, S.Q.; Du, H.L.; Han, J.Z.; Wang, C.S.; Chen, X.P.; Xie, L.; Yang, Y.C.; et al. Tunable giant exchange bias in the single-phase rare-earth–transition-metal intermetallics YMn12−xFex with highly homogenous intersublattice exchange coupling. Phys. Rev. B 2017, 96, 064440. [Google Scholar] [CrossRef] [Green Version]
- Nogués, J.; Schuller, I.K. Exchange bias. J. Magn. Magn. Mater. 1999, 192, 203–232. [Google Scholar] [CrossRef]
- Nogués, J.; Sort, J.; Langlais, V.; Skumryev, S.; Suriñach, S.; Muñoz, J.S.; Baró, M.D. Exchange bias in nanostructures. Phys. Rep. 2005, 422, 65–117. [Google Scholar] [CrossRef]
- Giri, S.; Patra, M.; Majumdar, S. Exchange bias effect in alloys and compounds. J. Phys. Condens. Matter 2011, 23, 073201. [Google Scholar] [CrossRef] [PubMed]
- Rodríguez-Carvajal, J. Recent advances in magnetic structure determination by neutron powder diffraction. Physica B 1993, 192, 55–69. [Google Scholar] [CrossRef]
- Zarkevich, N.A.; Zverev, V.I. Viable Materials with a Giant Magnetocaloric Effect. Crystals 2020, 10, 815. [Google Scholar] [CrossRef]


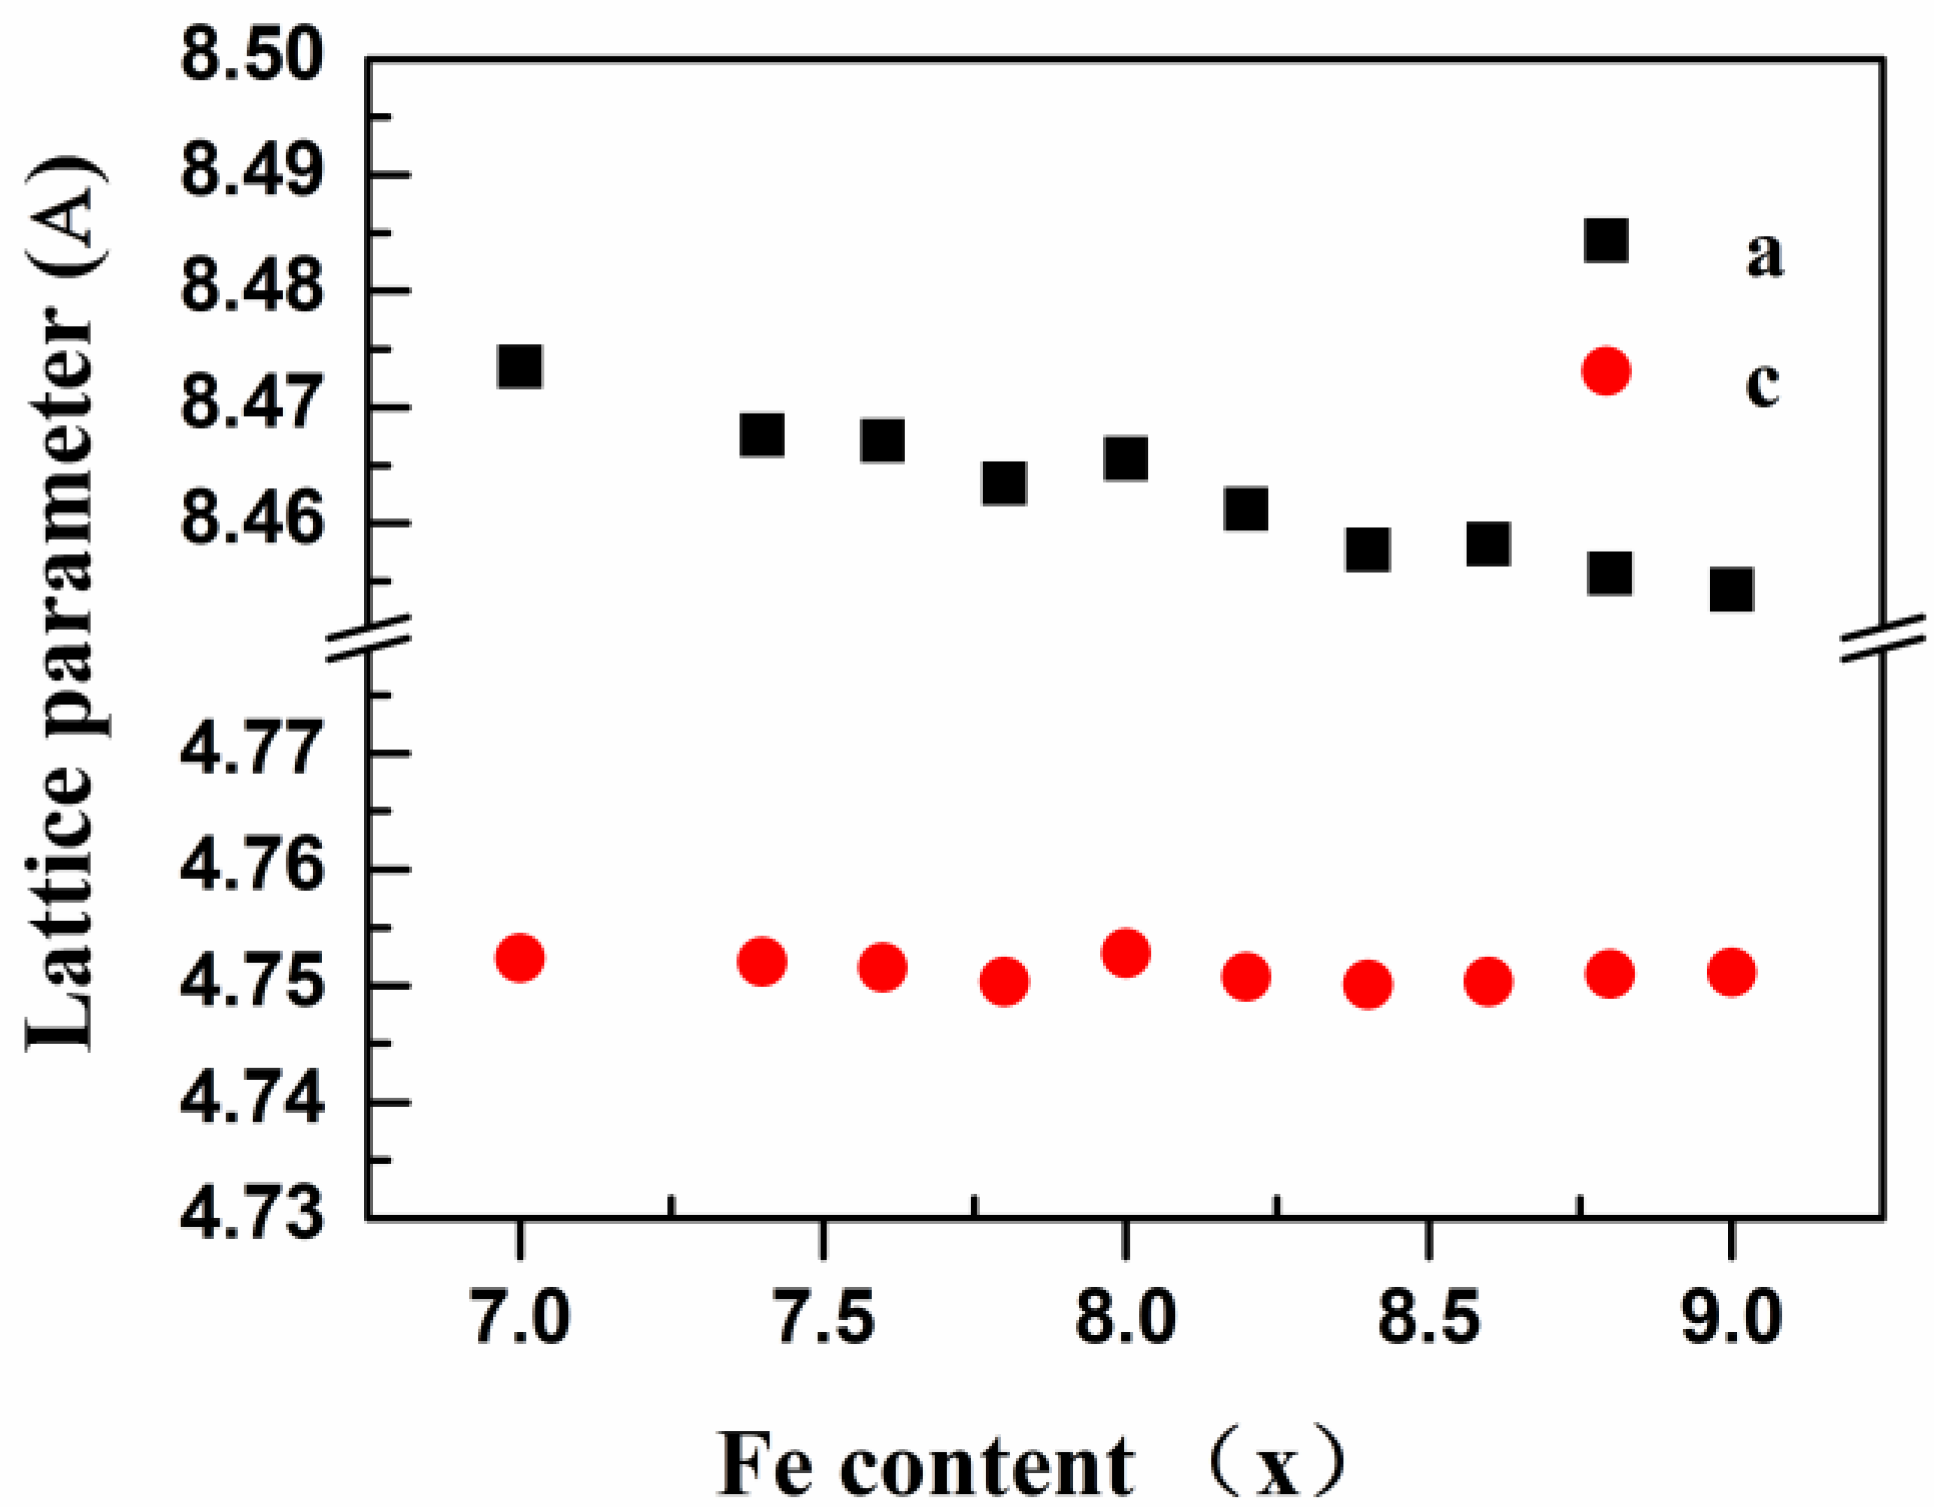
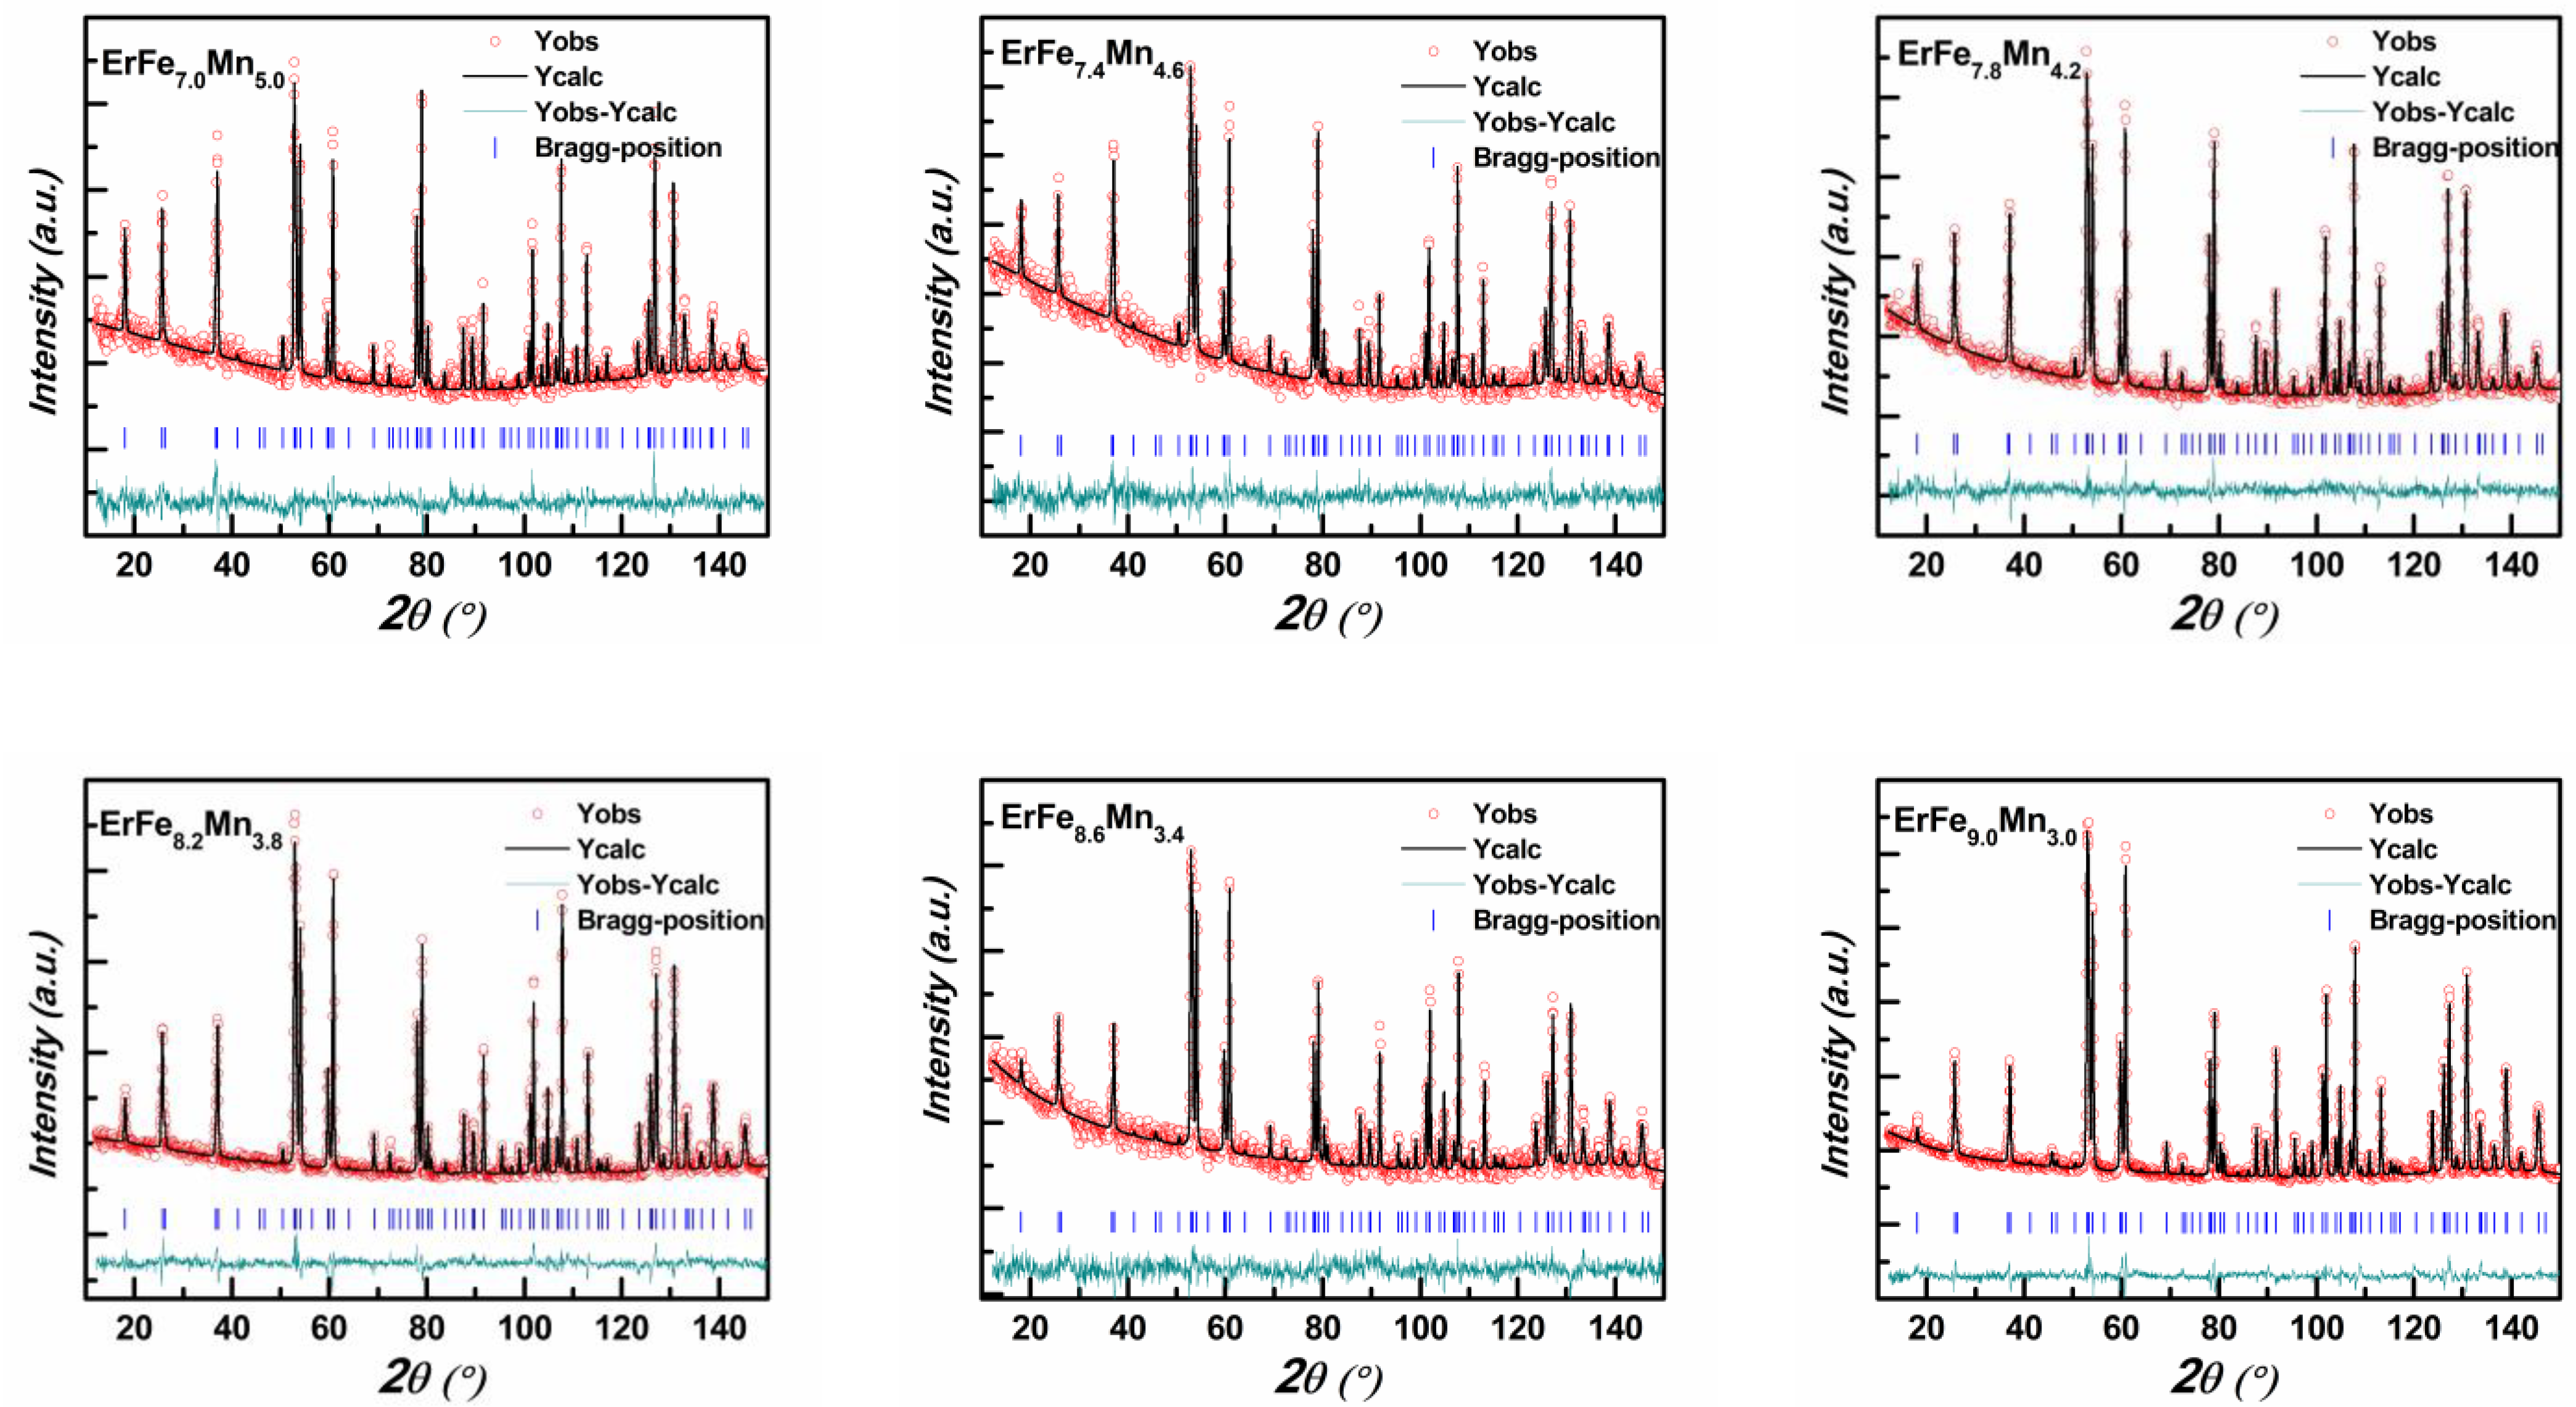
| ErFexMn12−x | a(Å) | c(Å) | occ, Fe, 8i | occ, Fe, 8j | occ, Fe, 8f | n, Fe | n, Mn | Rwp |
|---|---|---|---|---|---|---|---|---|
| ErFe9.0Mn3.0 | 8.45469(11) | 4.75397(7) | 0.476(0) | 0.836(4) | 0.928(8) | 8.96 | 3.04 | 5.11 |
| ErFe8.6Mn3.4 | 8.45777(24) | 4.75346(16) | 0.412(4) | 0.788(12) | 0.892(16) | 8.368 | 3.632 | 4.54 |
| ErFe8.2Mn3.8 | 8.46289(11) | 4.75501(7) | 0.344(0) | 0.792(4) | 0.908(8) | 8.176 | 3.824 | 4.73 |
| ErFe7.8Mn4.2 | 8.46758(16) | 4.75572(11) | 0.300(0) | 0.704(8) | 0.832(8) | 7.344 | 4.656 | 3.88 |
| ErFe7.4Mn4.6 | 8.47191(24) | 4.75547(16) | 0.284(0) | 0.640(8) | 0.764(8) | 6.752 | 5.248 | 3.29 |
| ErFe7.0Mn5.0 | 8.47767(19) | 4.75605(13) | 0.232(0) | 0.636(4) | 0.796(8) | 6.656 | 5.344 | 7.28 |
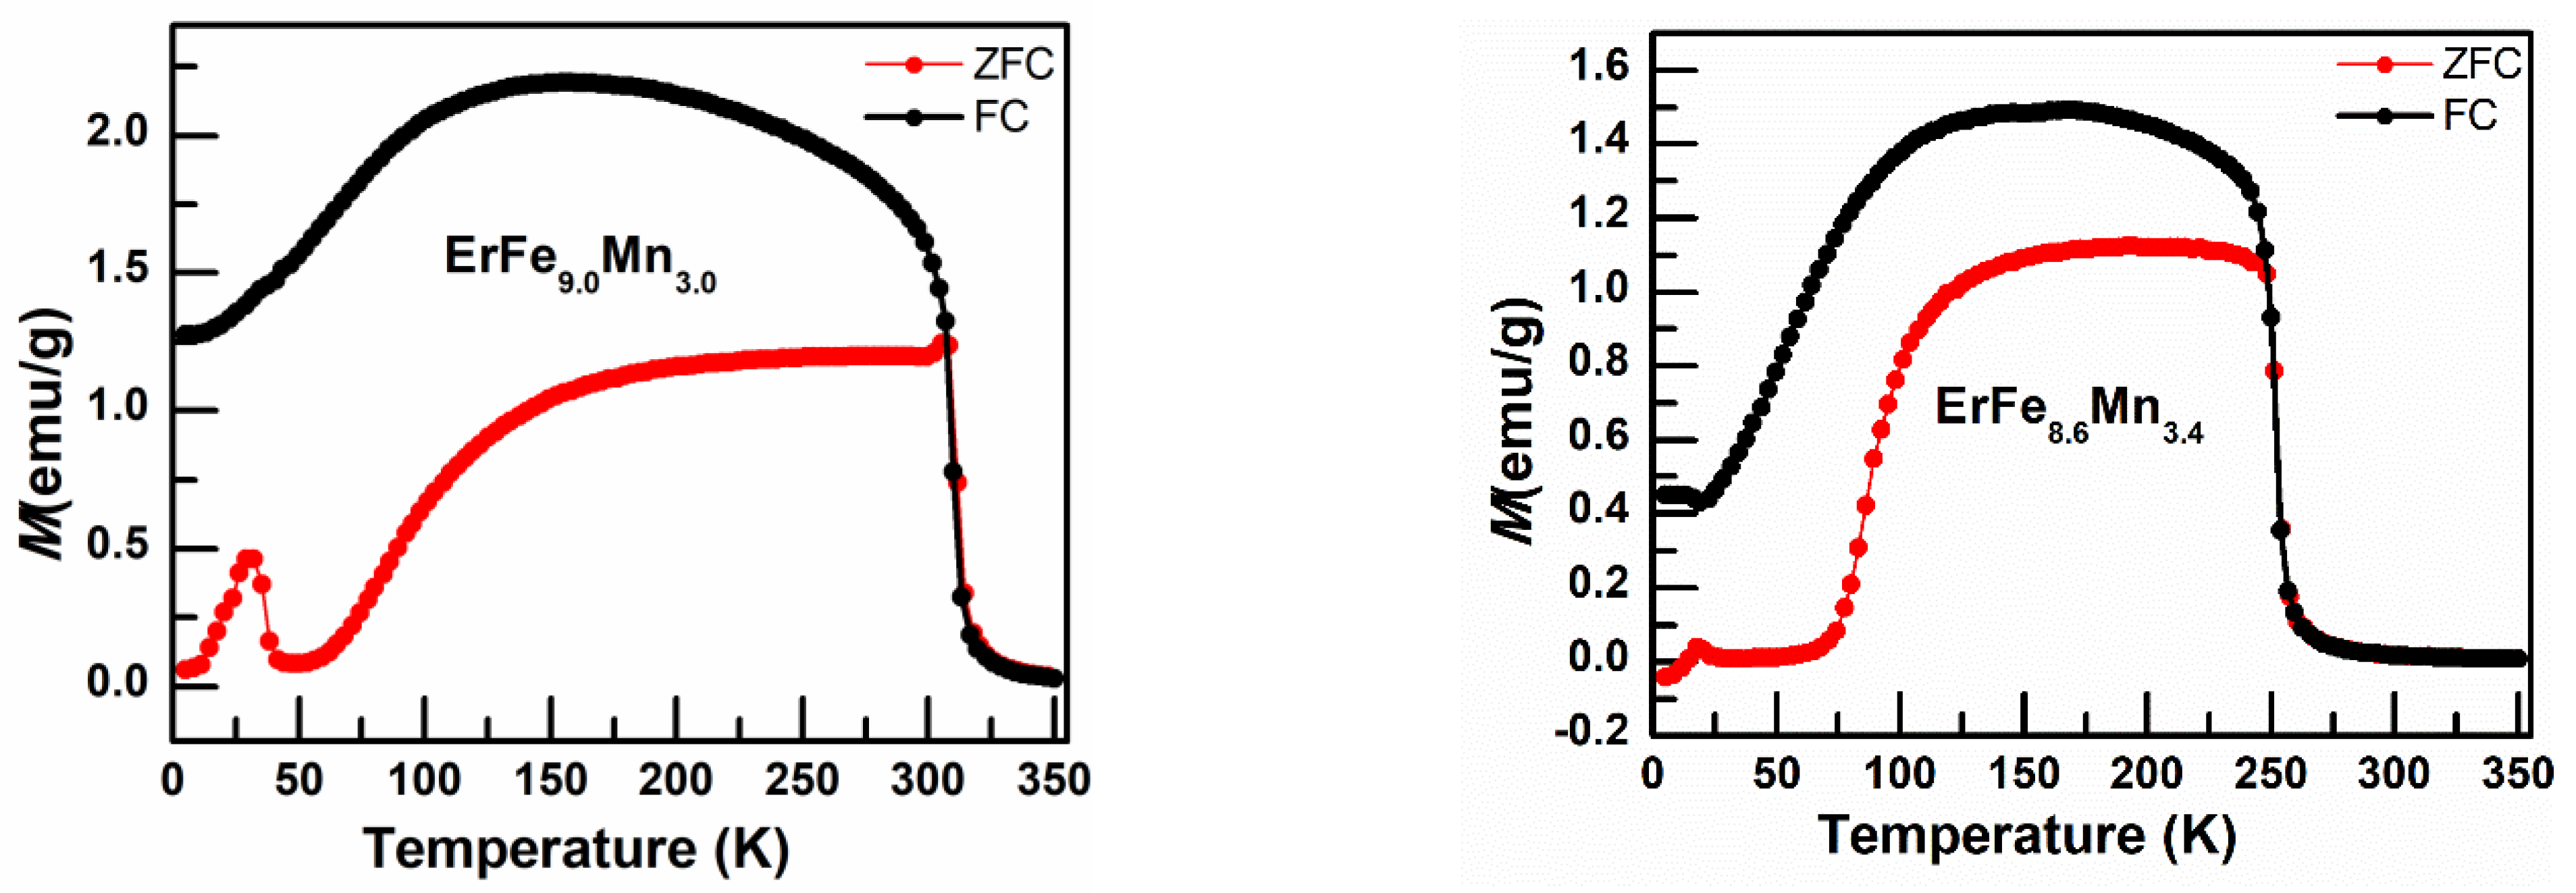
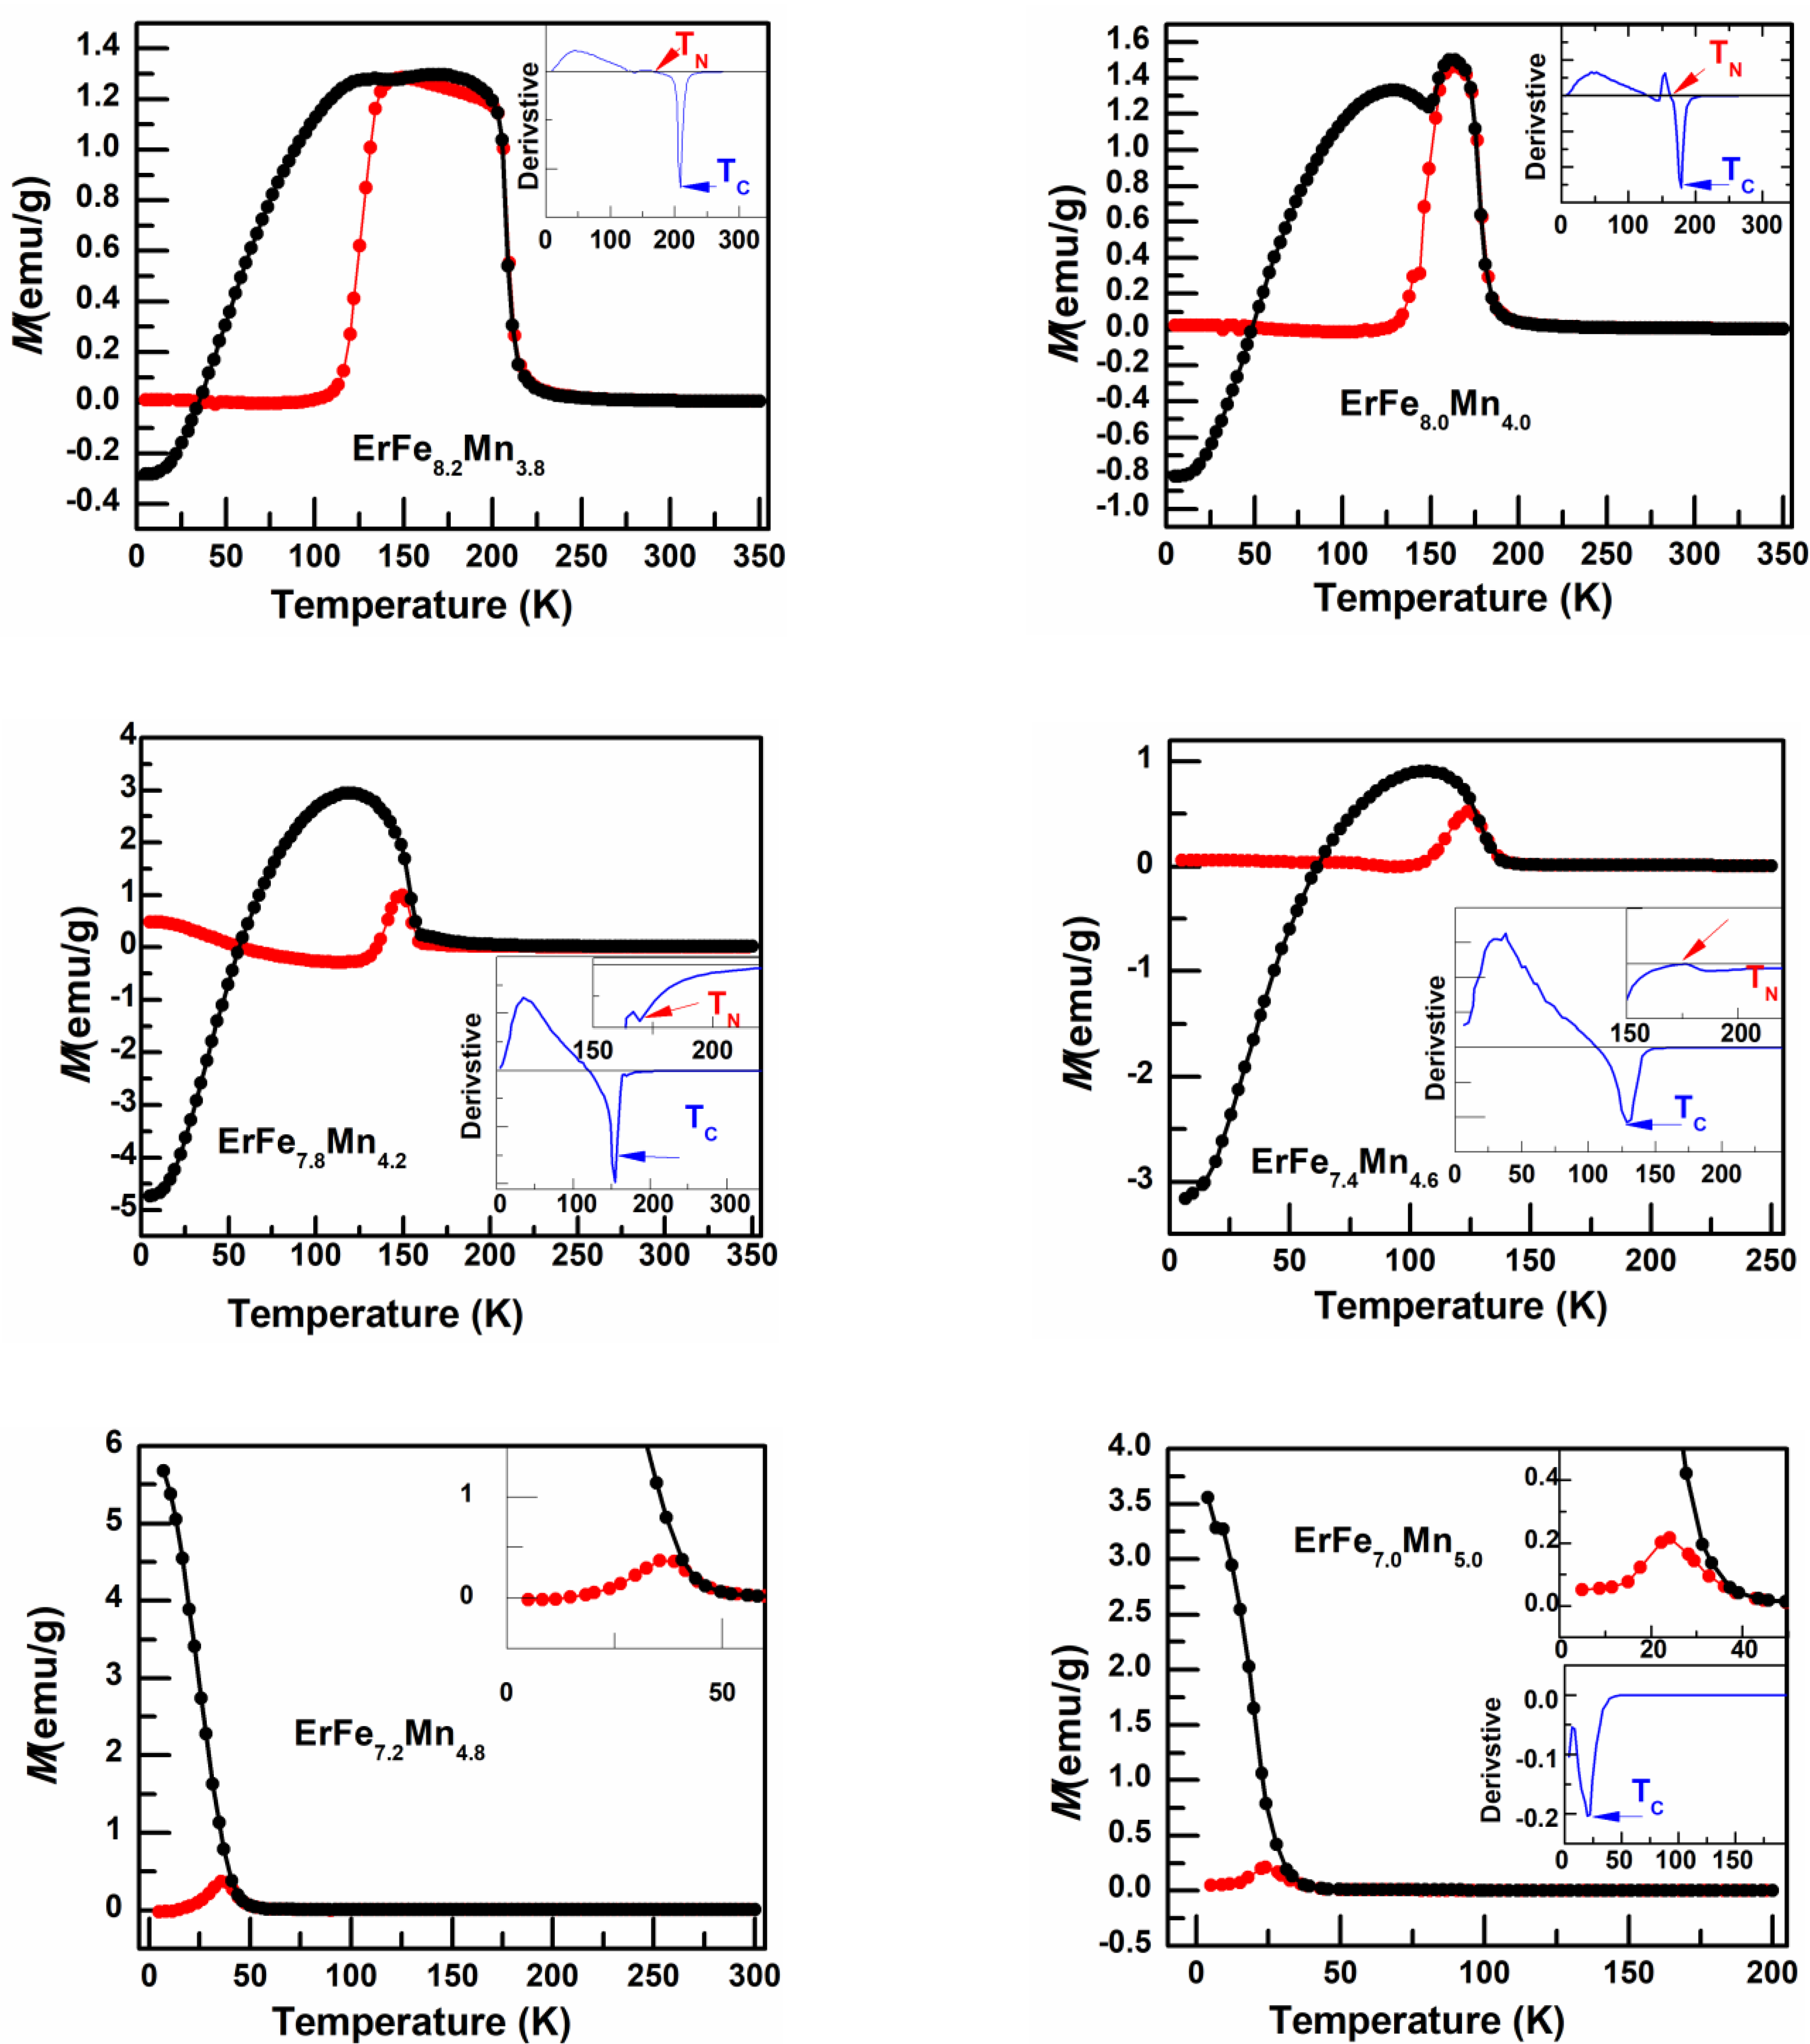
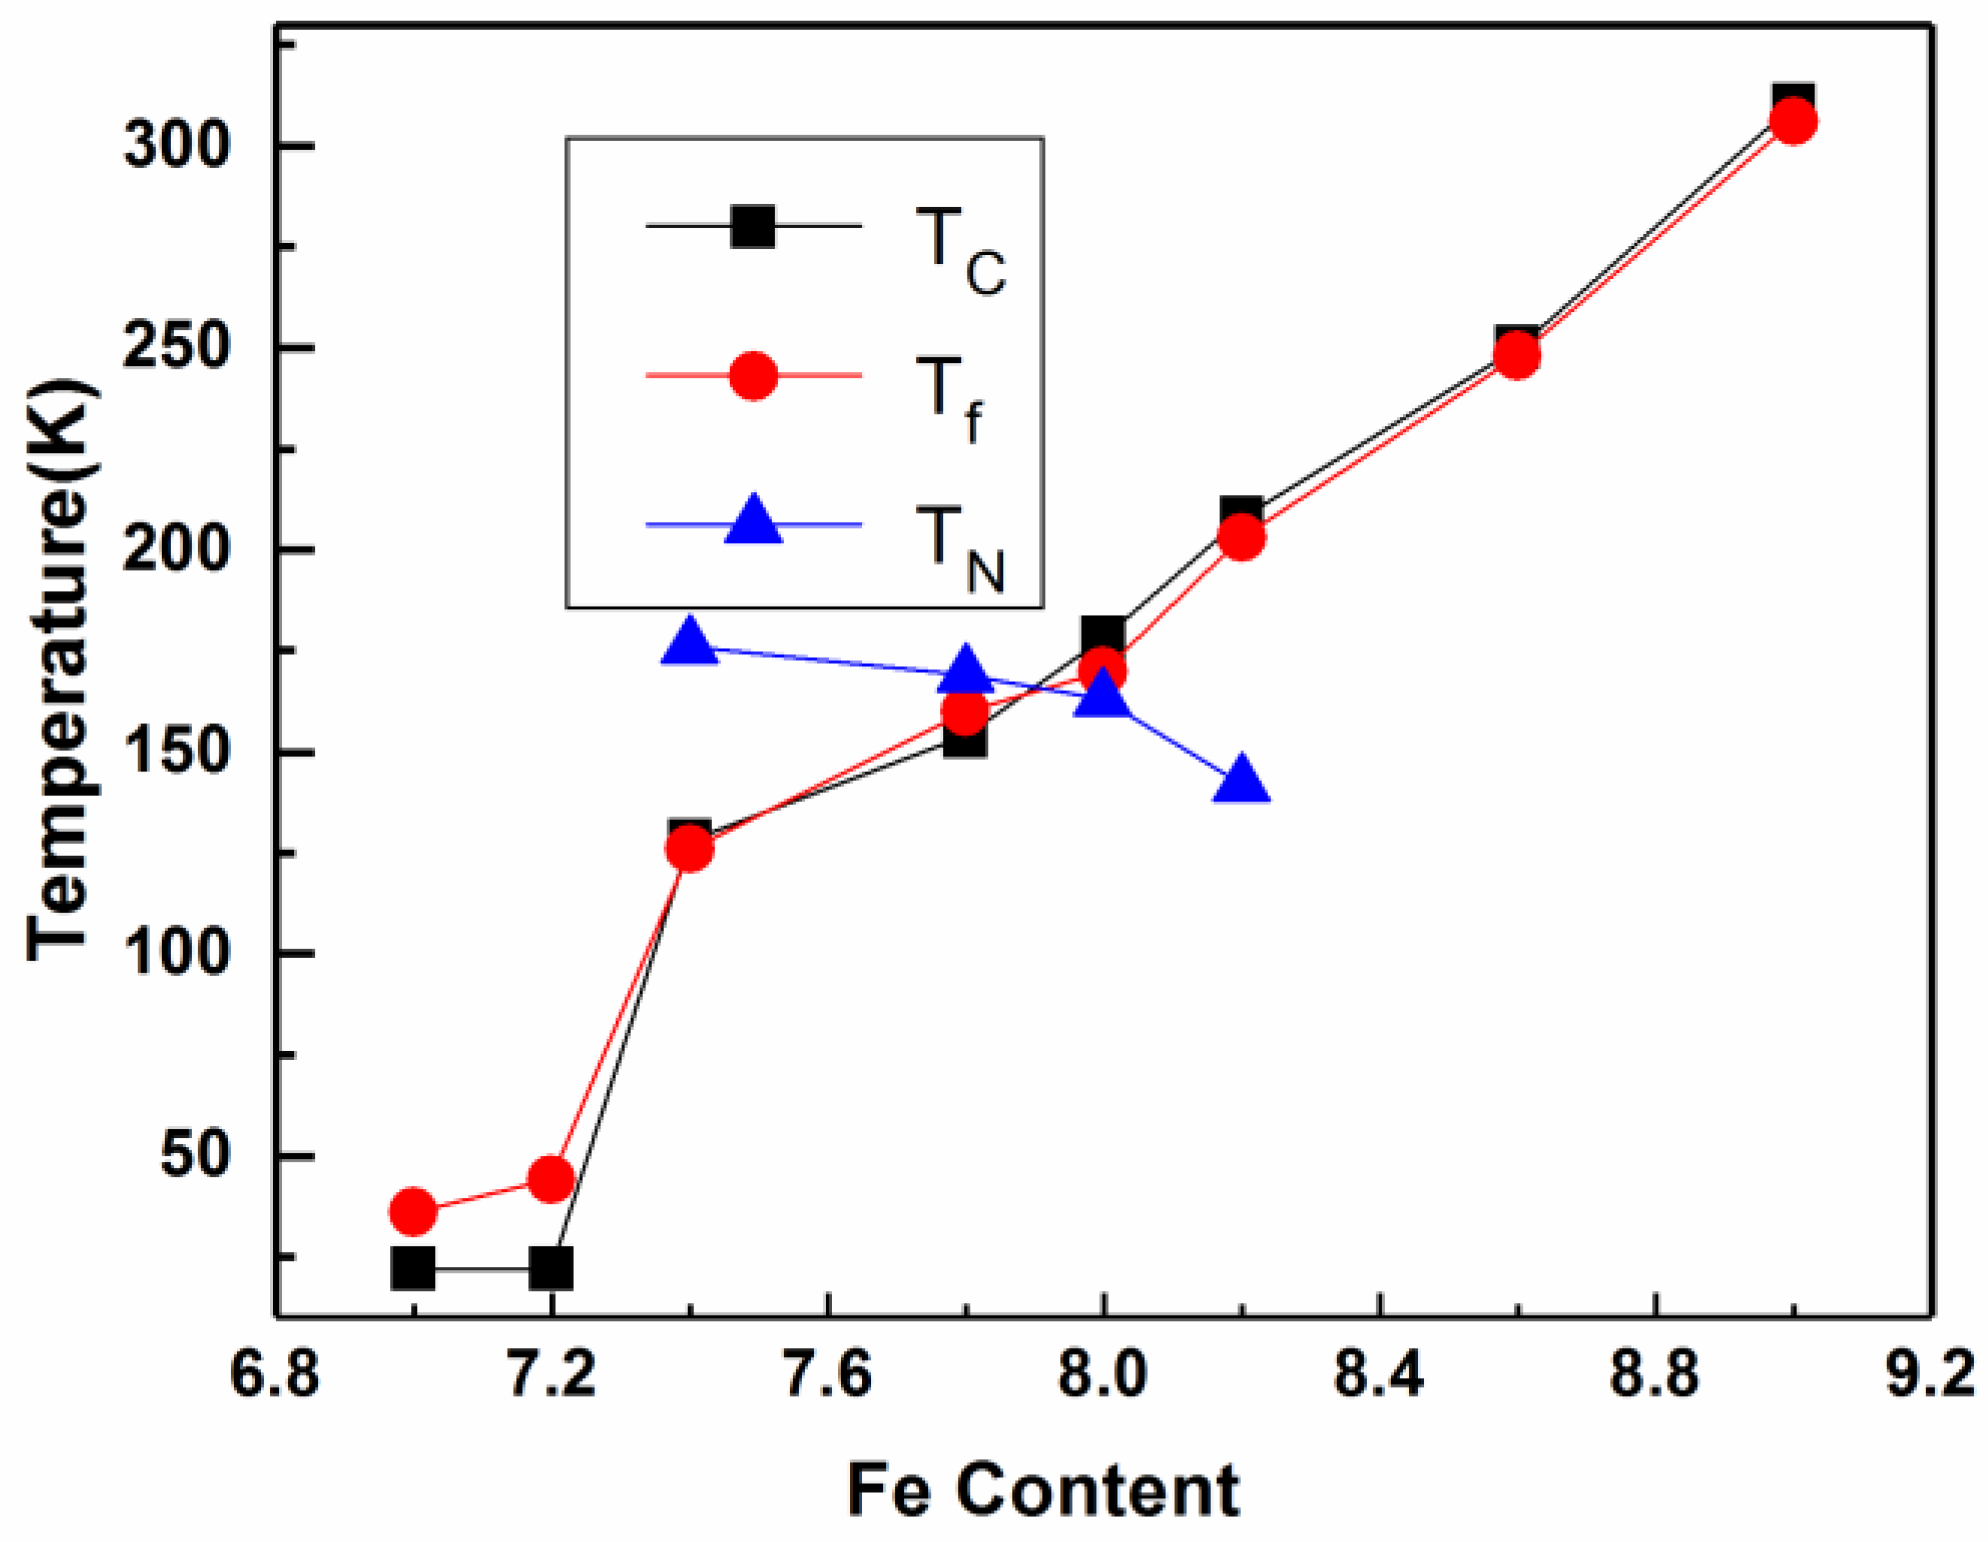
| ErFexMn12−x | TC (K) | Tf (K) | TN (K) | HE (kOe) | HC (kOe) |
|---|---|---|---|---|---|
| Cooling Field | 50 Oe | 50 Oe | 50 Oe | 1000 Oe | 1000 Oe |
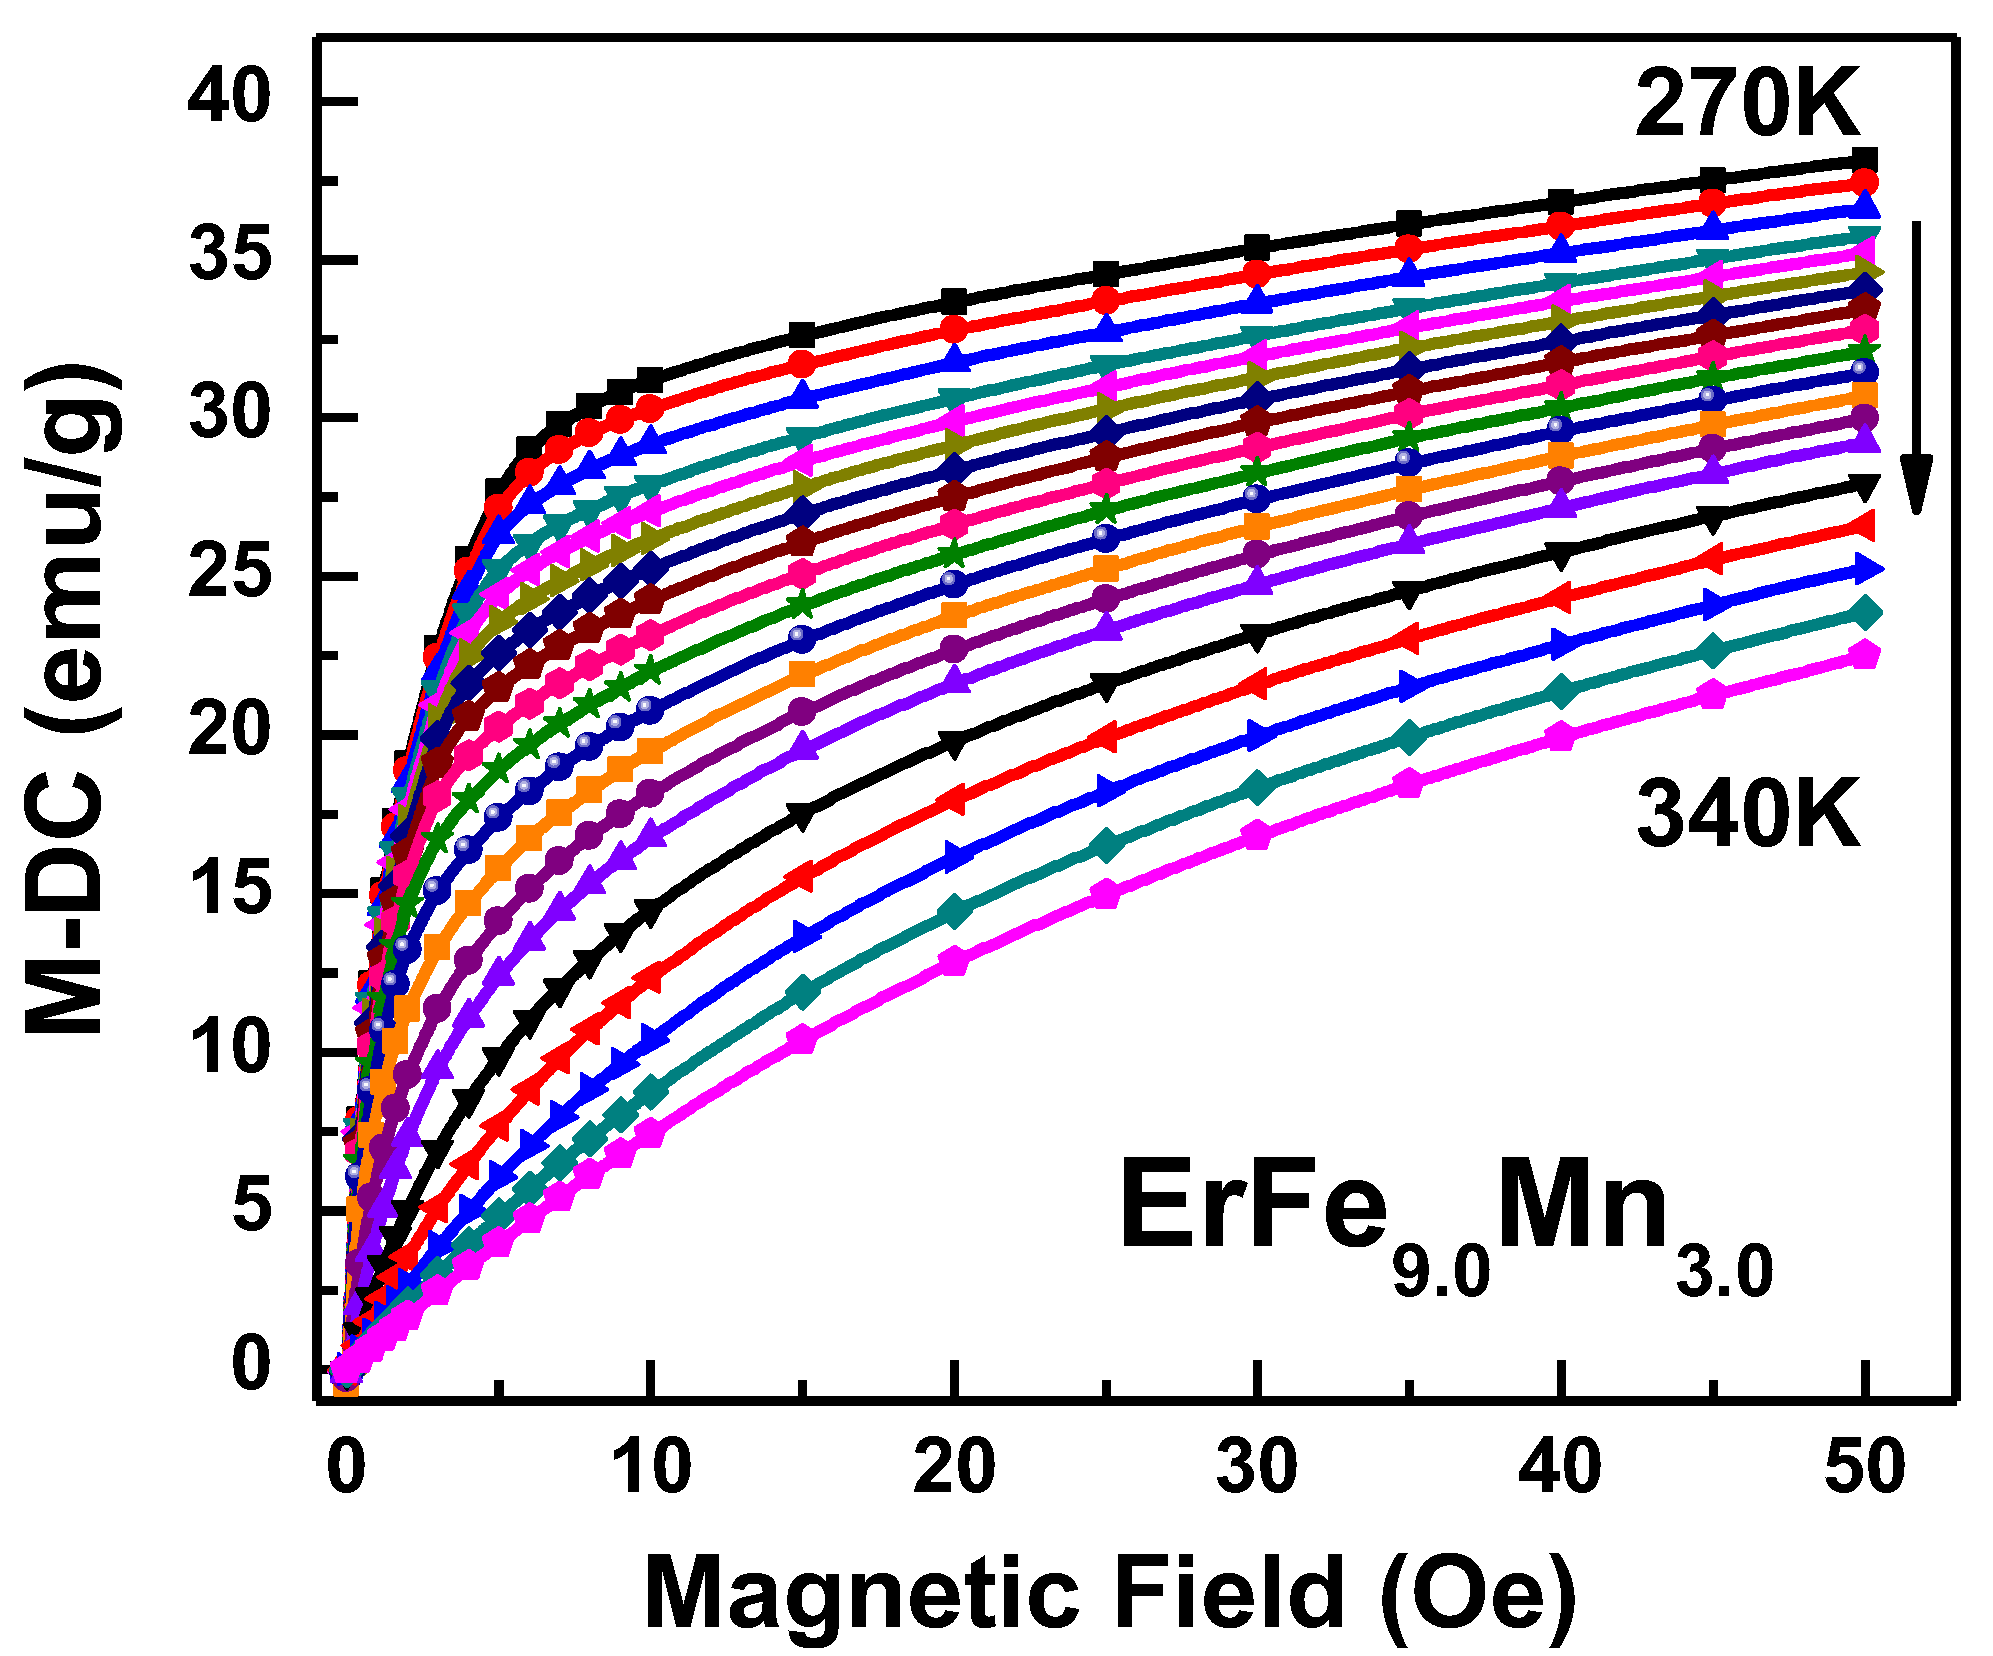
| ErFe9.0Mn3.0 | 310 | 306 | |||
| ErFe8.6Mn3.4 | 250 | 248 | −0.22 | 1.28 | |
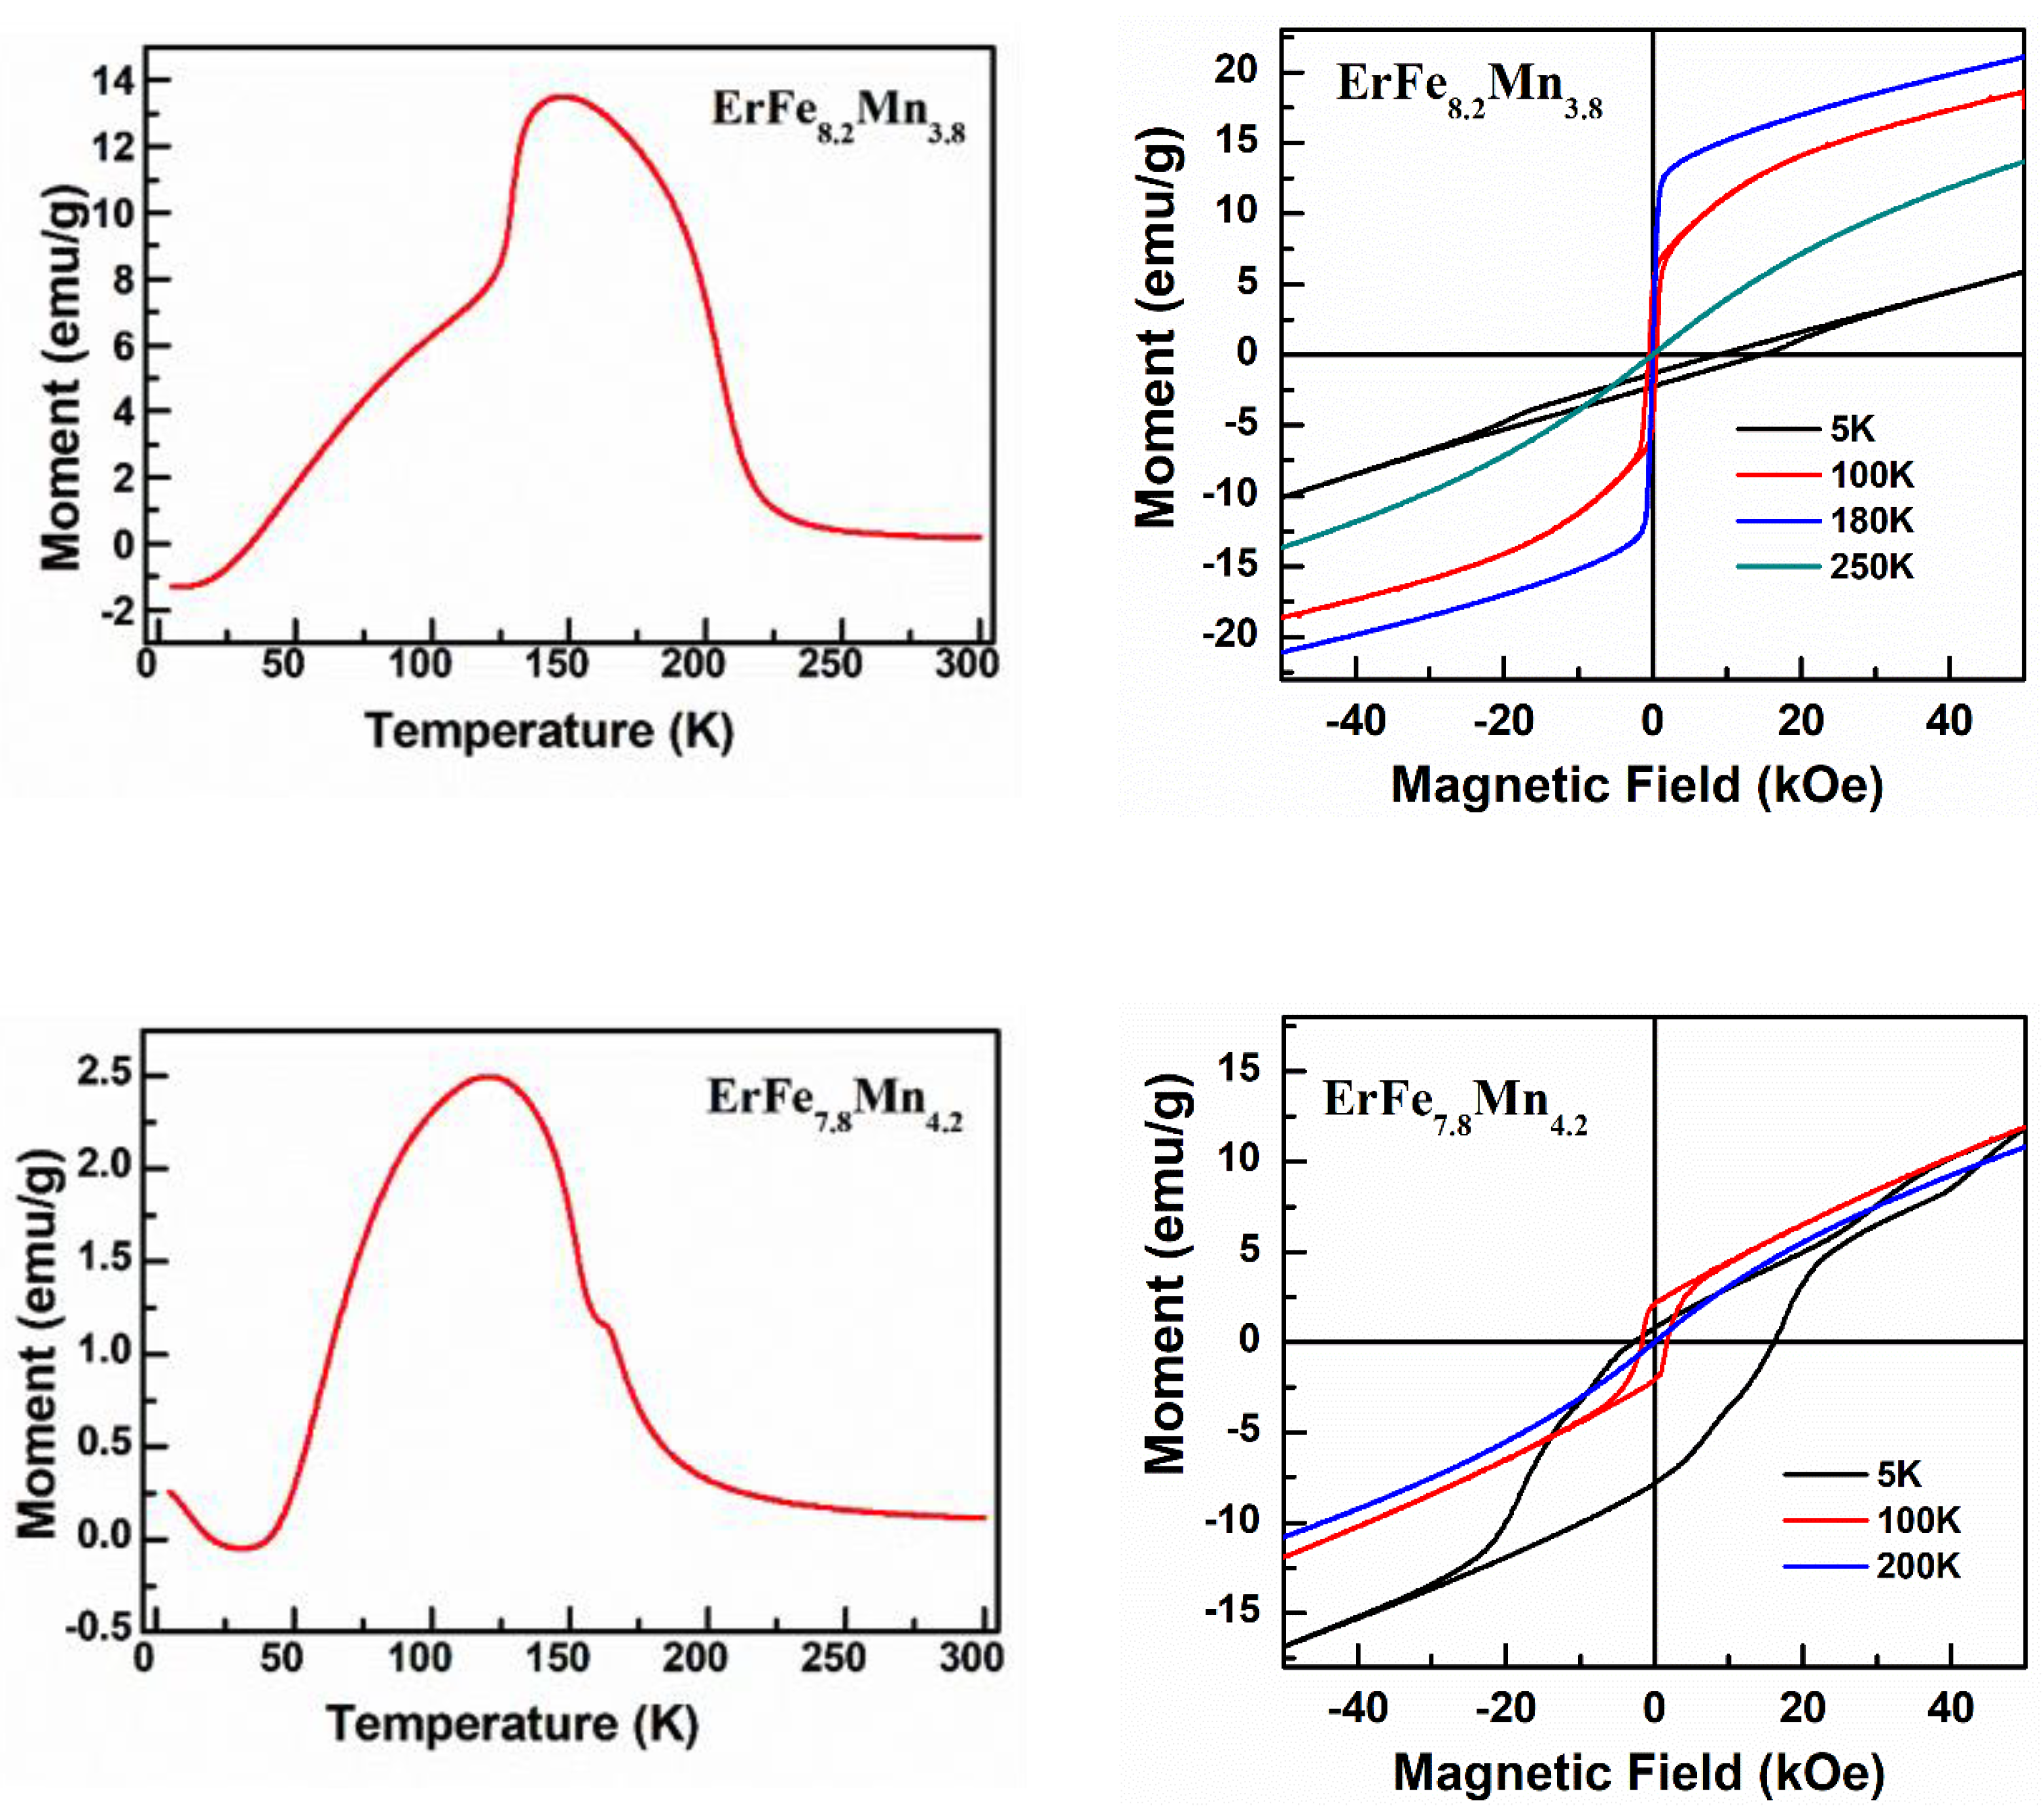
| ErFe8.2Mn3.8 | 208 | 203 | 142 | 11.73 | 2.97 |
| ErFe8.0Mn4.0 | 178 | 170 | 163 | ||
| ErFe7.8Mn4.2 | 154 | 160 | 169 | 6.615 | 9.54 |
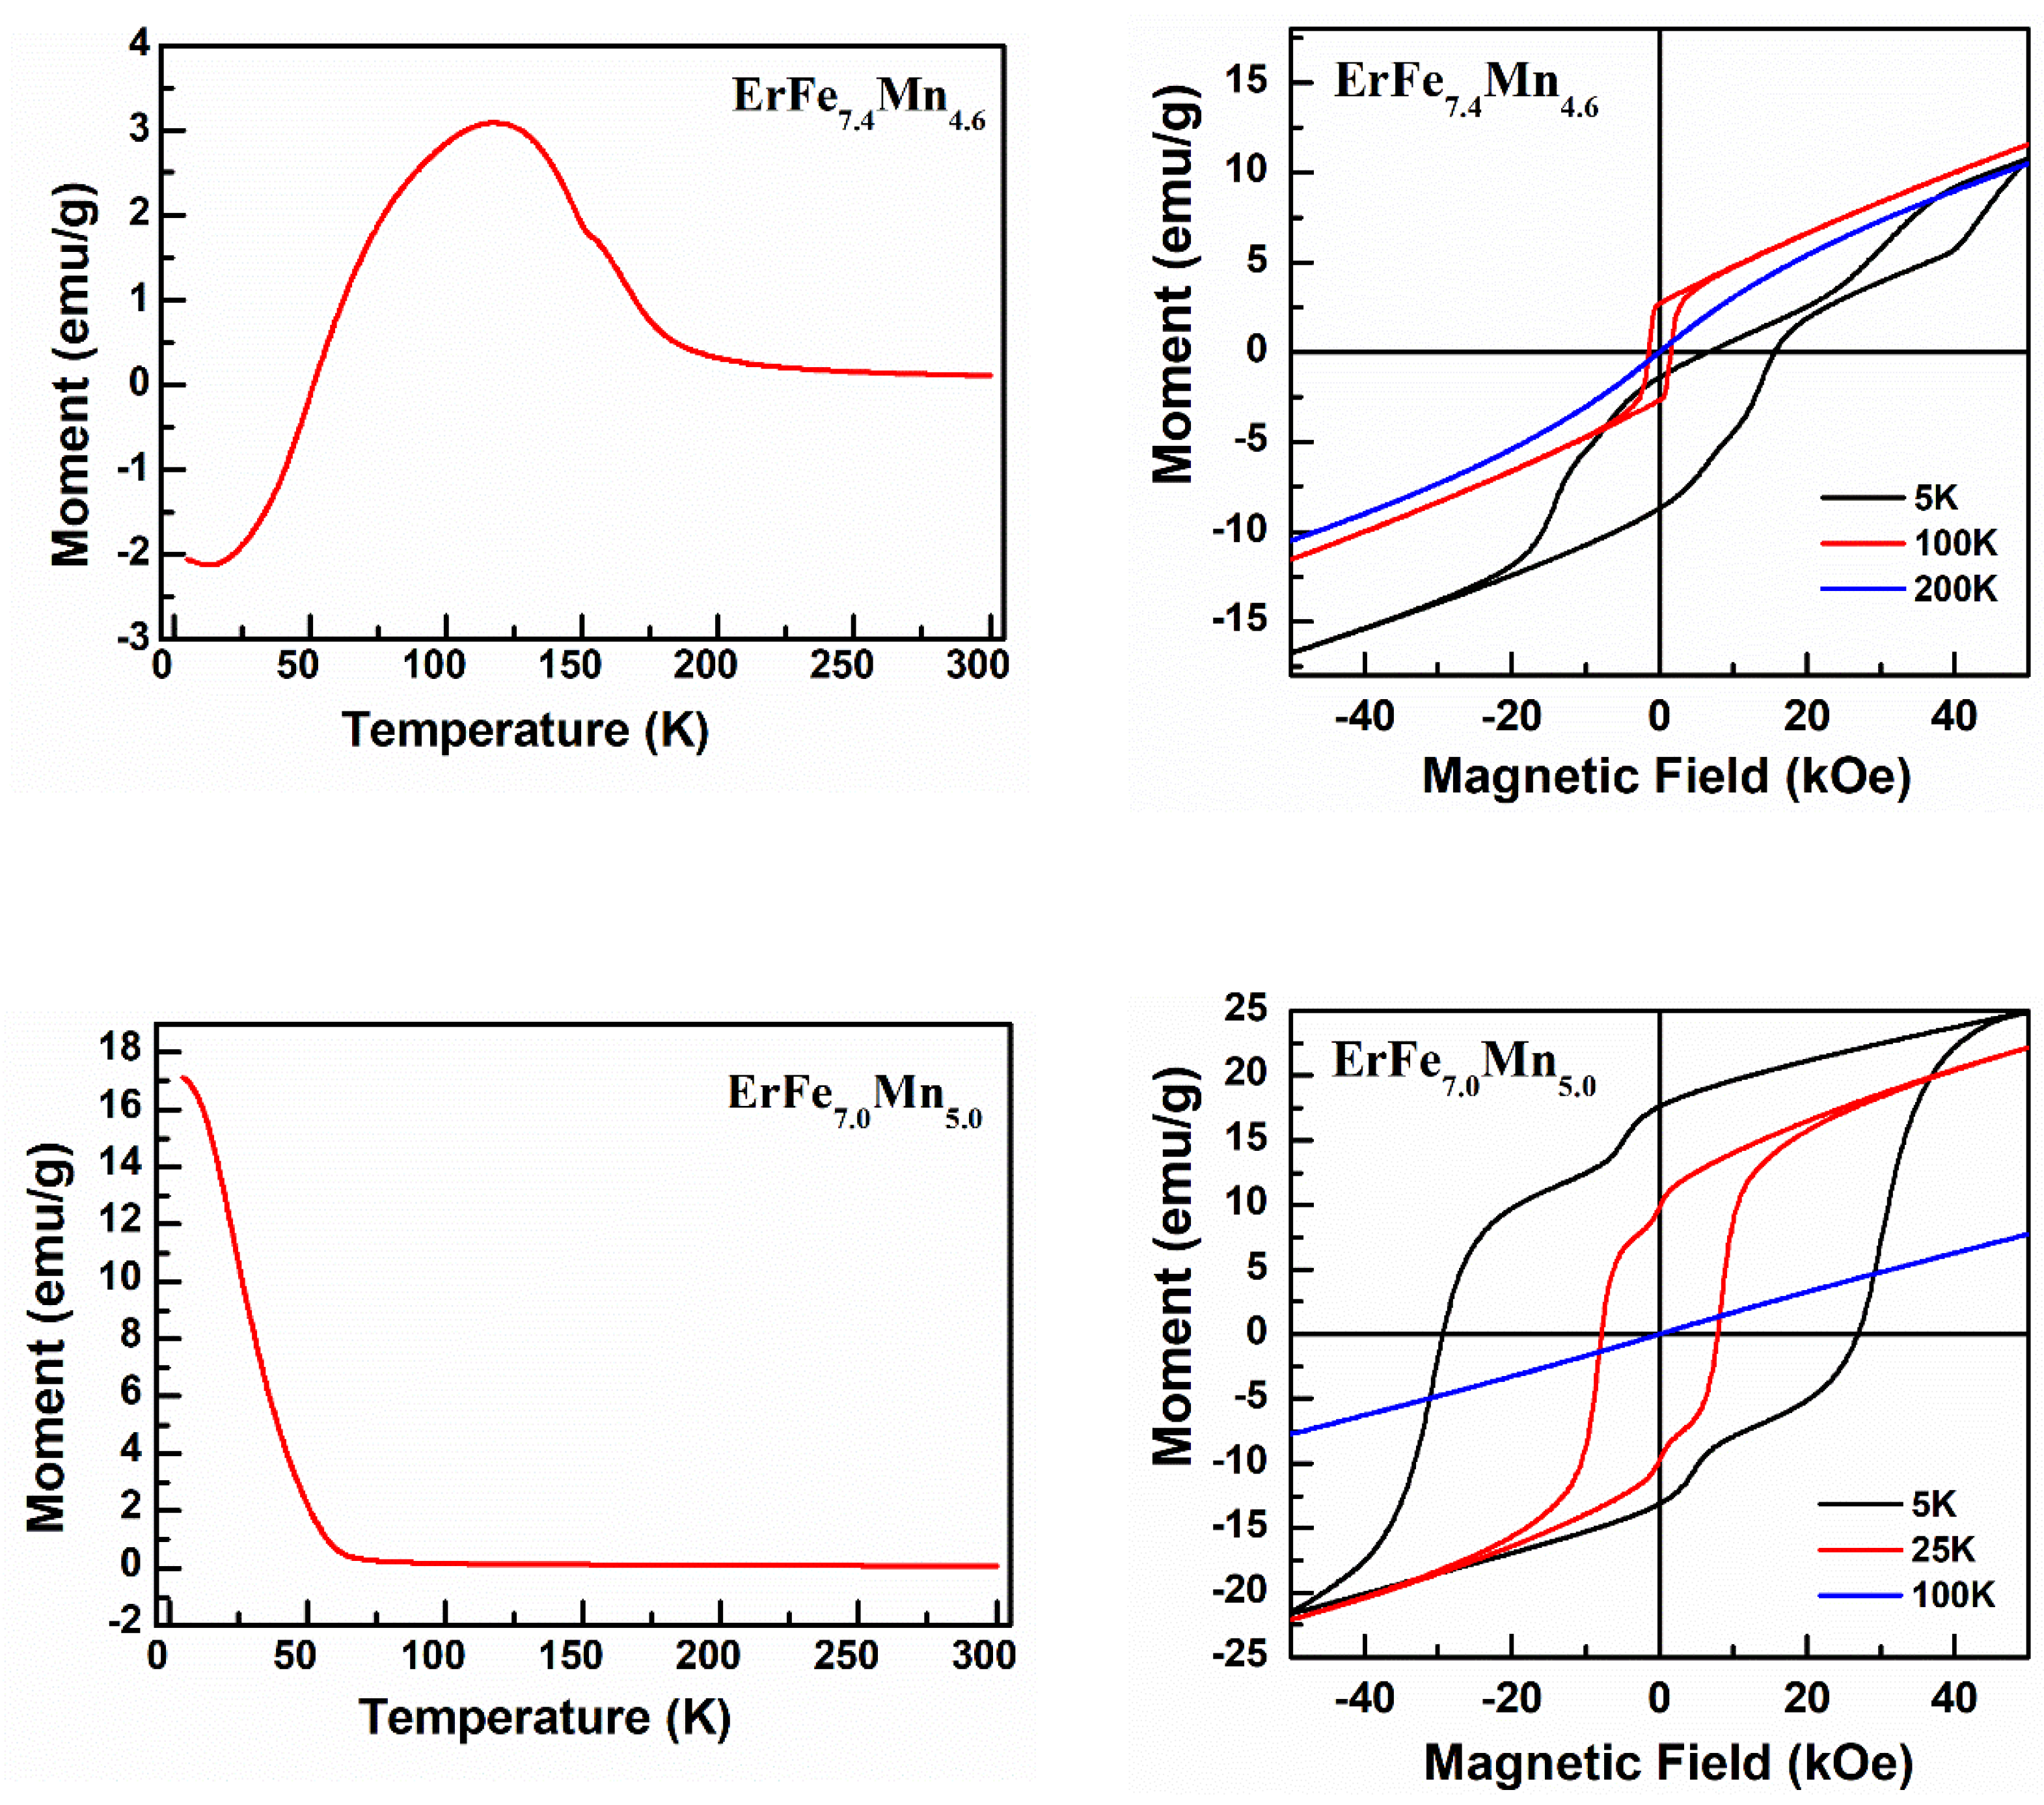
| ErFe7.4Mn4.6 | 128 | 126 | 176 | 11.08 | 4.52 |
| ErFe7.2Mn4.8 | 22 | 44 | |||
| ErFe7.0Mn5.0 | 22 | 36 | −1.27 | 28.11 |
Publisher’s Note: MDPI stays neutral with regard to jurisdictional claims in published maps and institutional affiliations. |
© 2022 by the authors. Licensee MDPI, Basel, Switzerland. This article is an open access article distributed under the terms and conditions of the Creative Commons Attribution (CC BY) license (https://creativecommons.org/licenses/by/4.0/).
Share and Cite
Gao, P.; Xia, Y.; Gong, J.; Ju, X. Structure and Magnetic Properties of ErFexMn12−x (7.0 ≤ x ≤ 9.0, Δx = 0.2). Nanomaterials 2022, 12, 1586. https://doi.org/10.3390/nano12091586
Gao P, Xia Y, Gong J, Ju X. Structure and Magnetic Properties of ErFexMn12−x (7.0 ≤ x ≤ 9.0, Δx = 0.2). Nanomaterials. 2022; 12(9):1586. https://doi.org/10.3390/nano12091586
Chicago/Turabian StyleGao, Penglin, Yuanhua Xia, Jian Gong, and Xin Ju. 2022. "Structure and Magnetic Properties of ErFexMn12−x (7.0 ≤ x ≤ 9.0, Δx = 0.2)" Nanomaterials 12, no. 9: 1586. https://doi.org/10.3390/nano12091586