Bell Shape Curves of Hemolysis Induced by Silver Nanoparticles: Review and Experimental Assay


 , , , , , and
Abstract
:1. Introduction
2. Materials and Methods
2.1. Characterization of AgNPs Formulation Argovit™
2.2. Solutions
2.3. Erythrocyte Suspensions
2.4. Hemolysis Test
2.5. Ethical Considerations
2.6. Donors
2.7. Statistical Analysis
3. Results
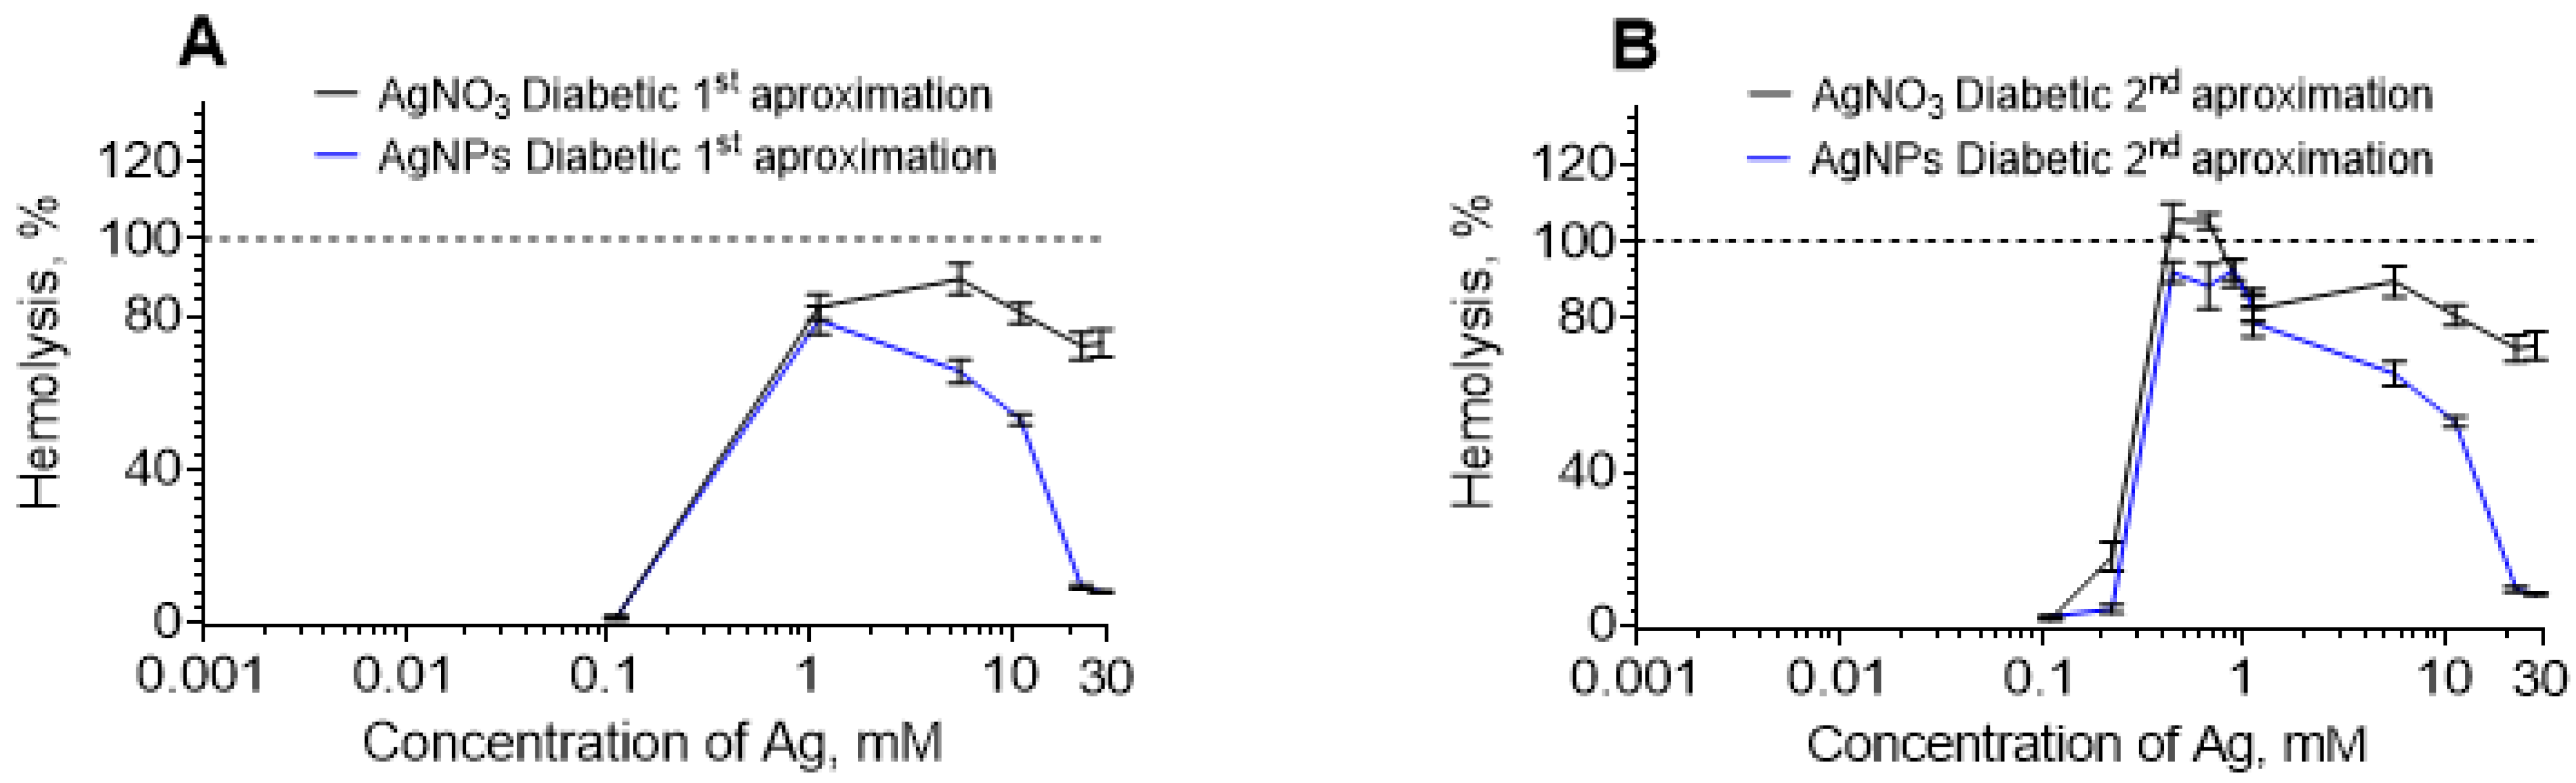
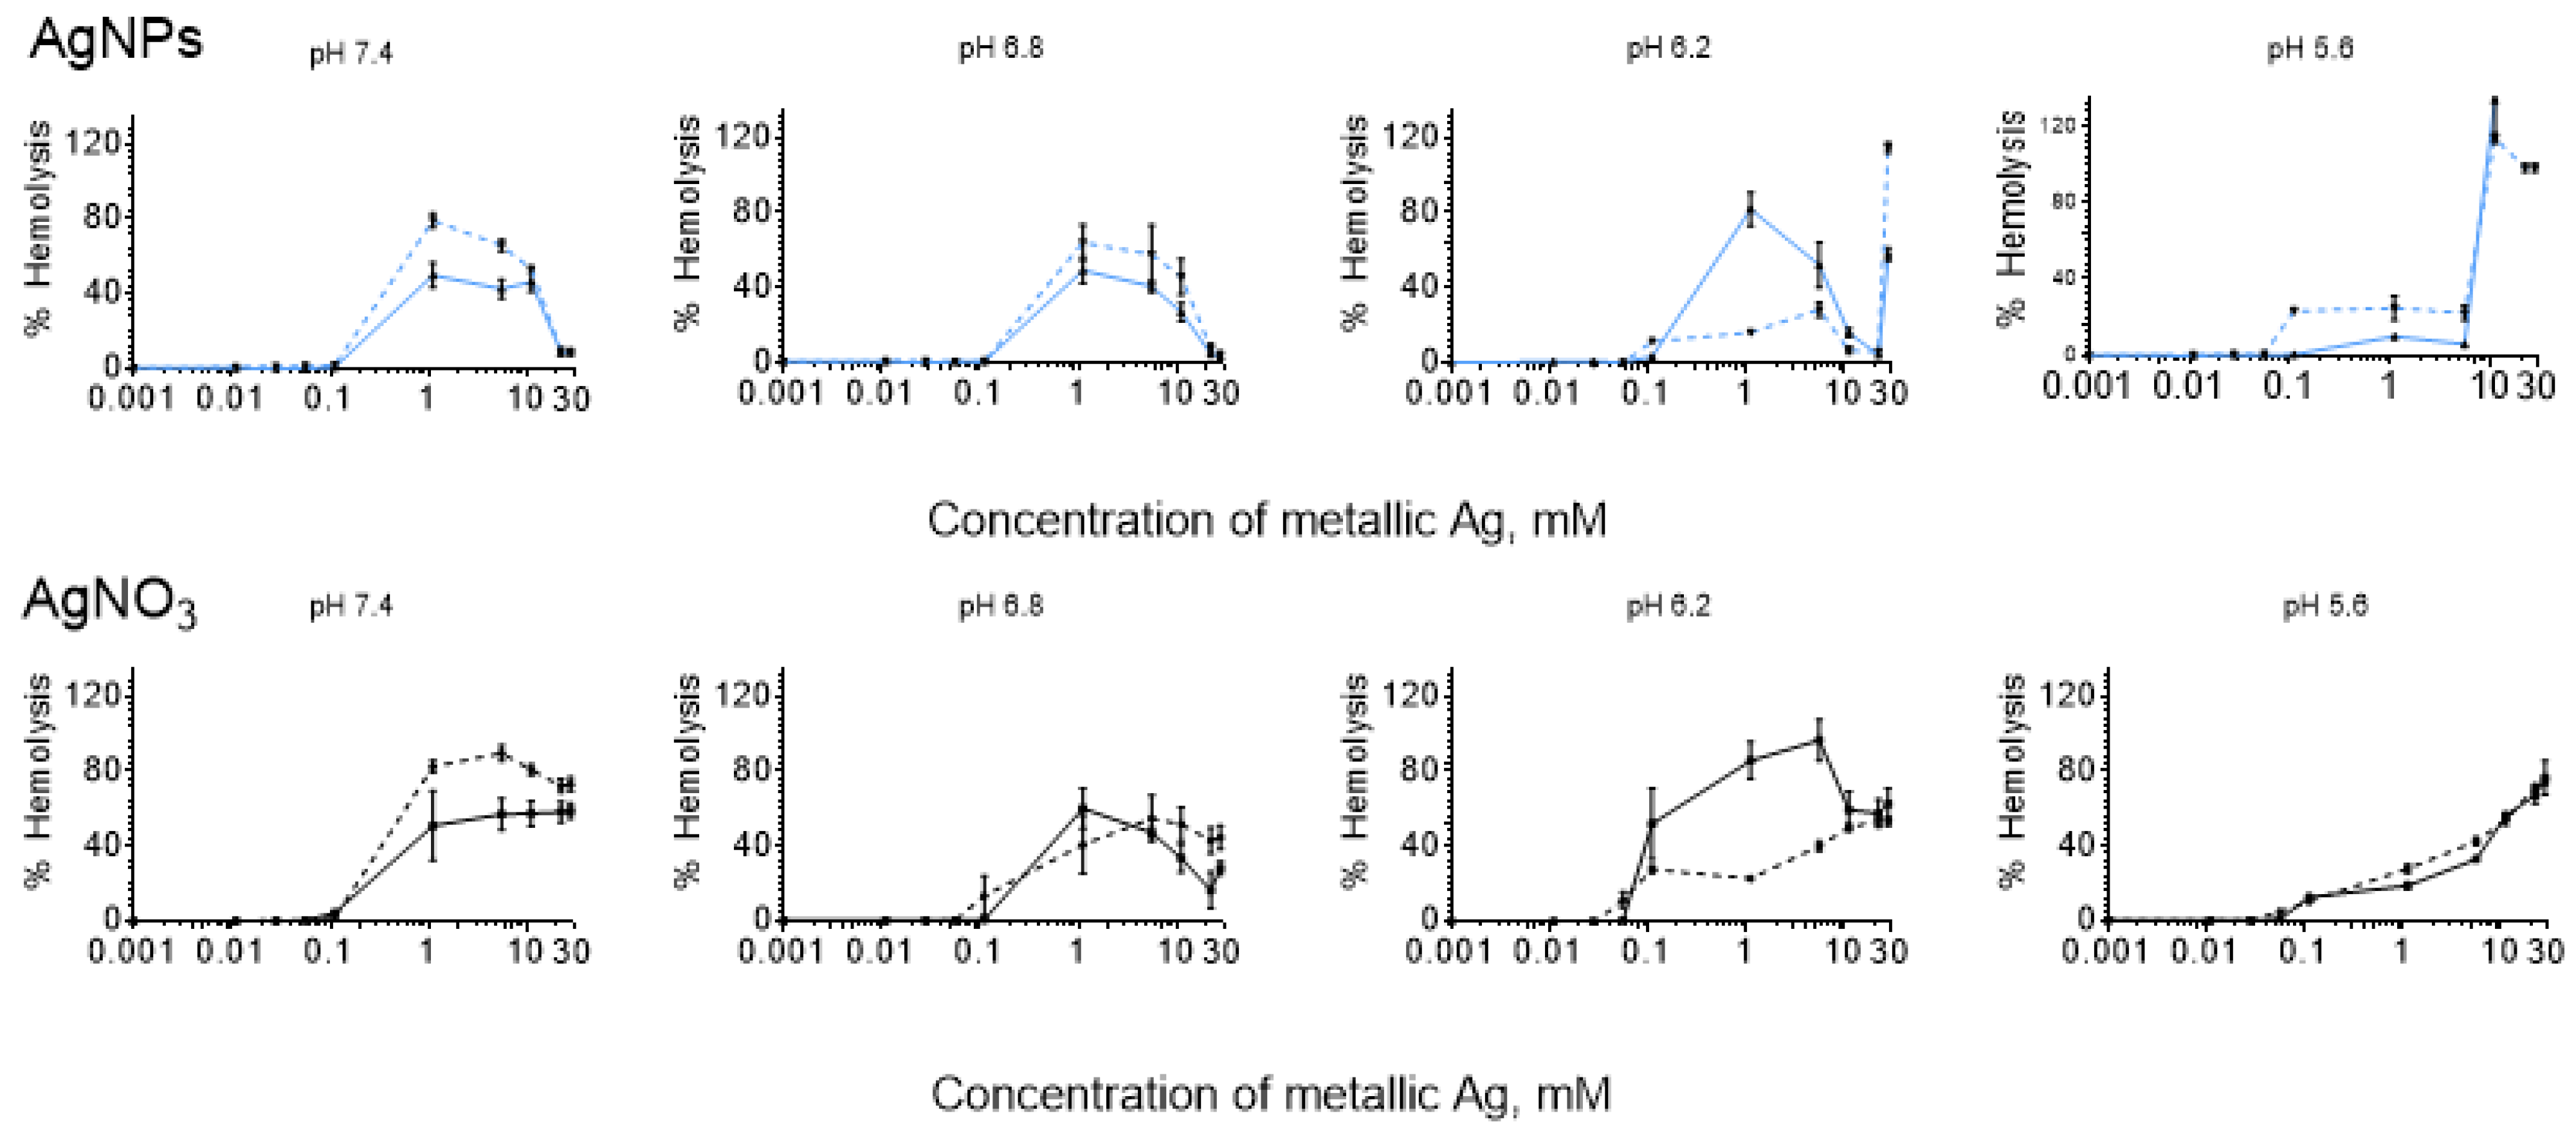
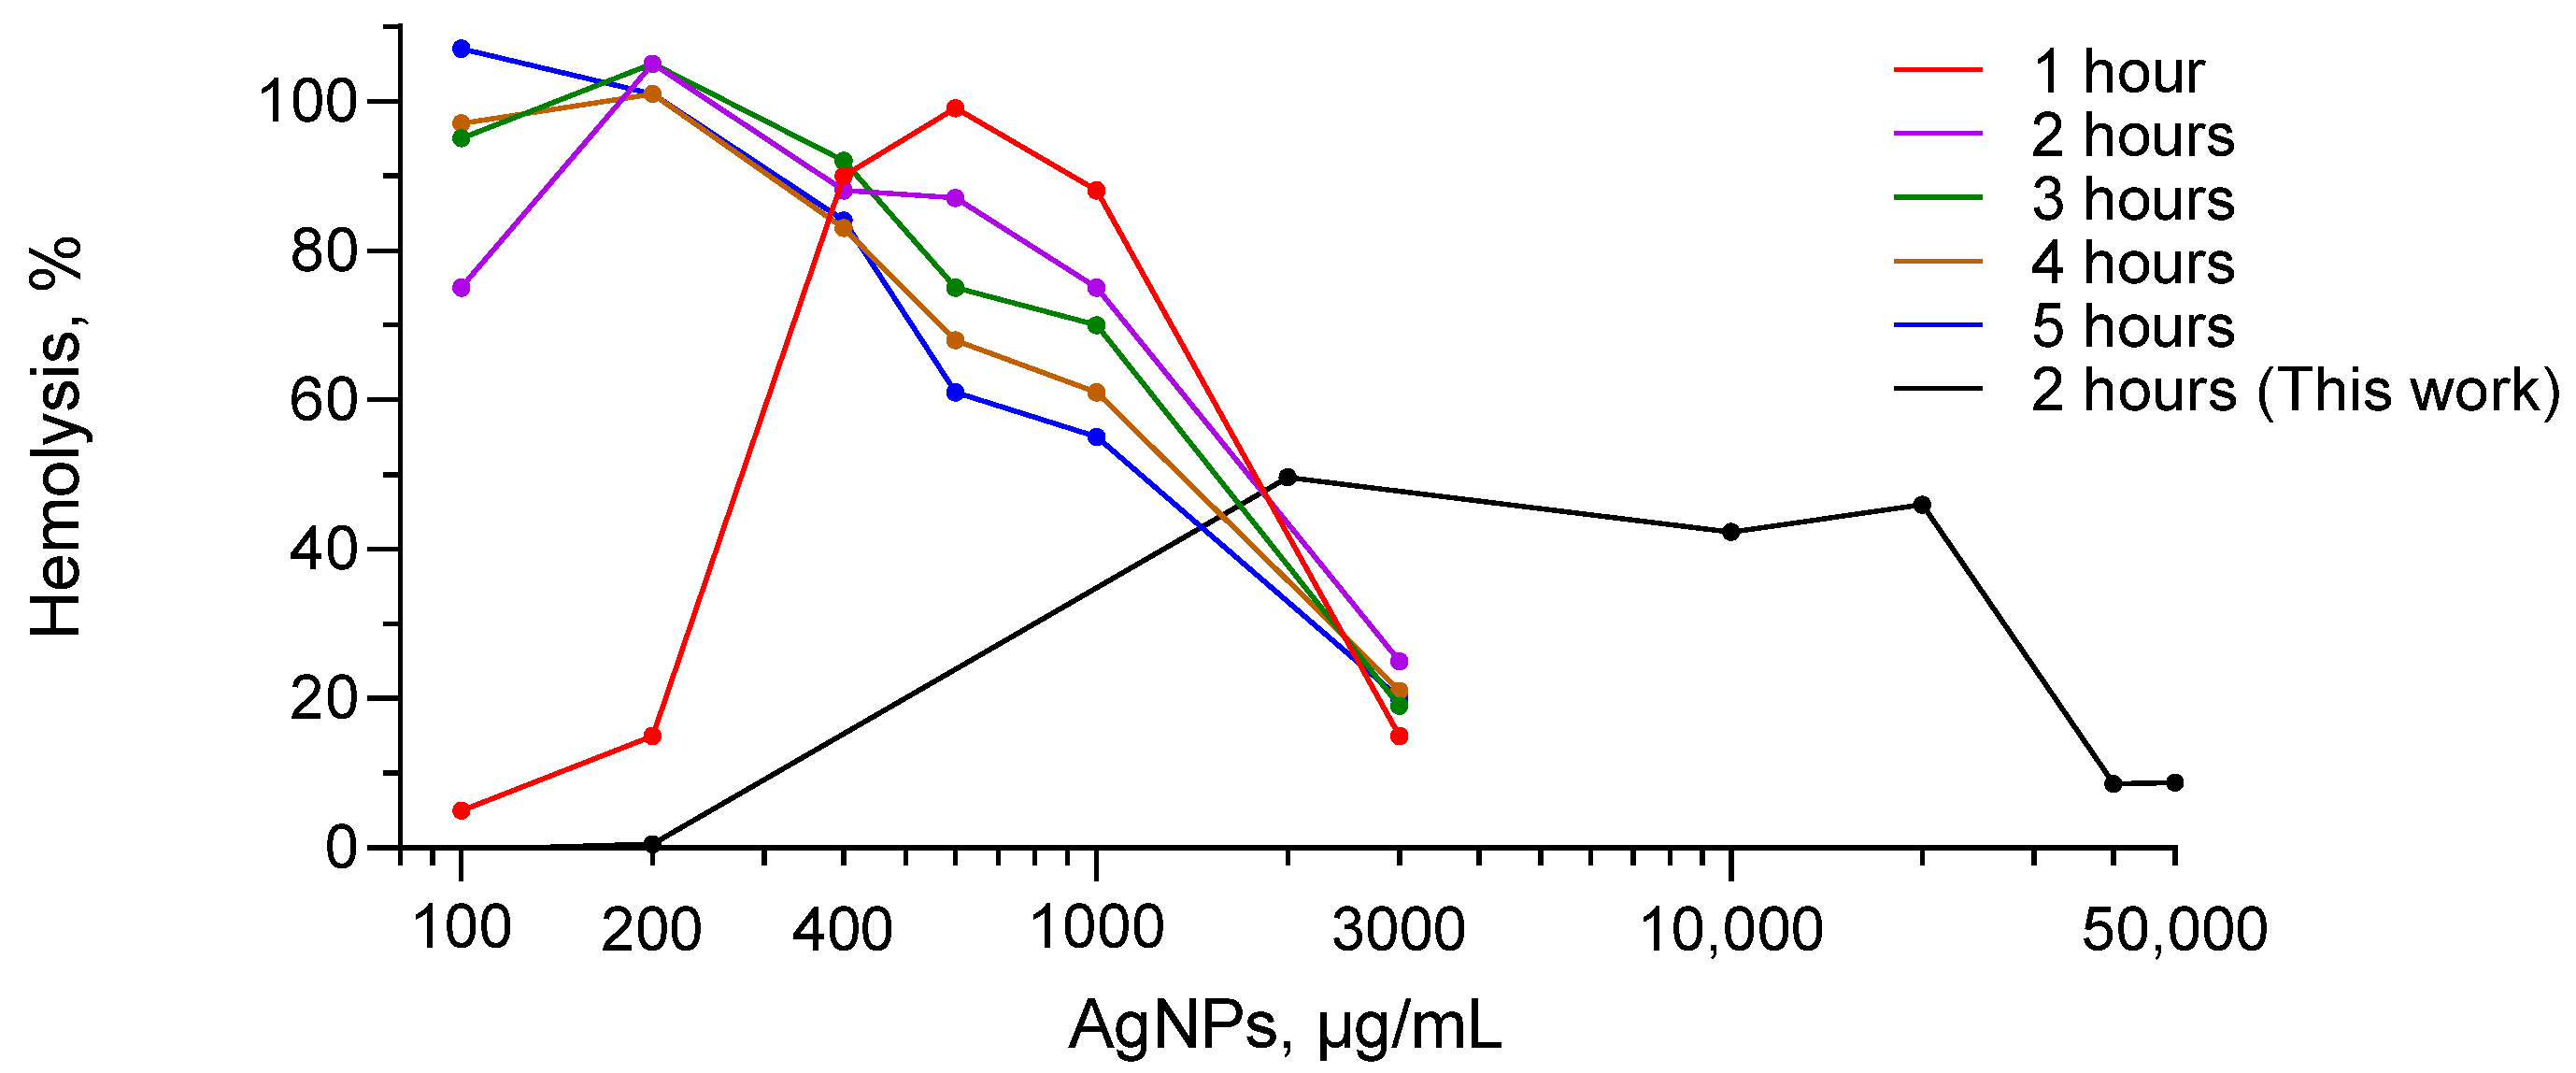
3.1. Bell-Shaped Hemolysis Profile
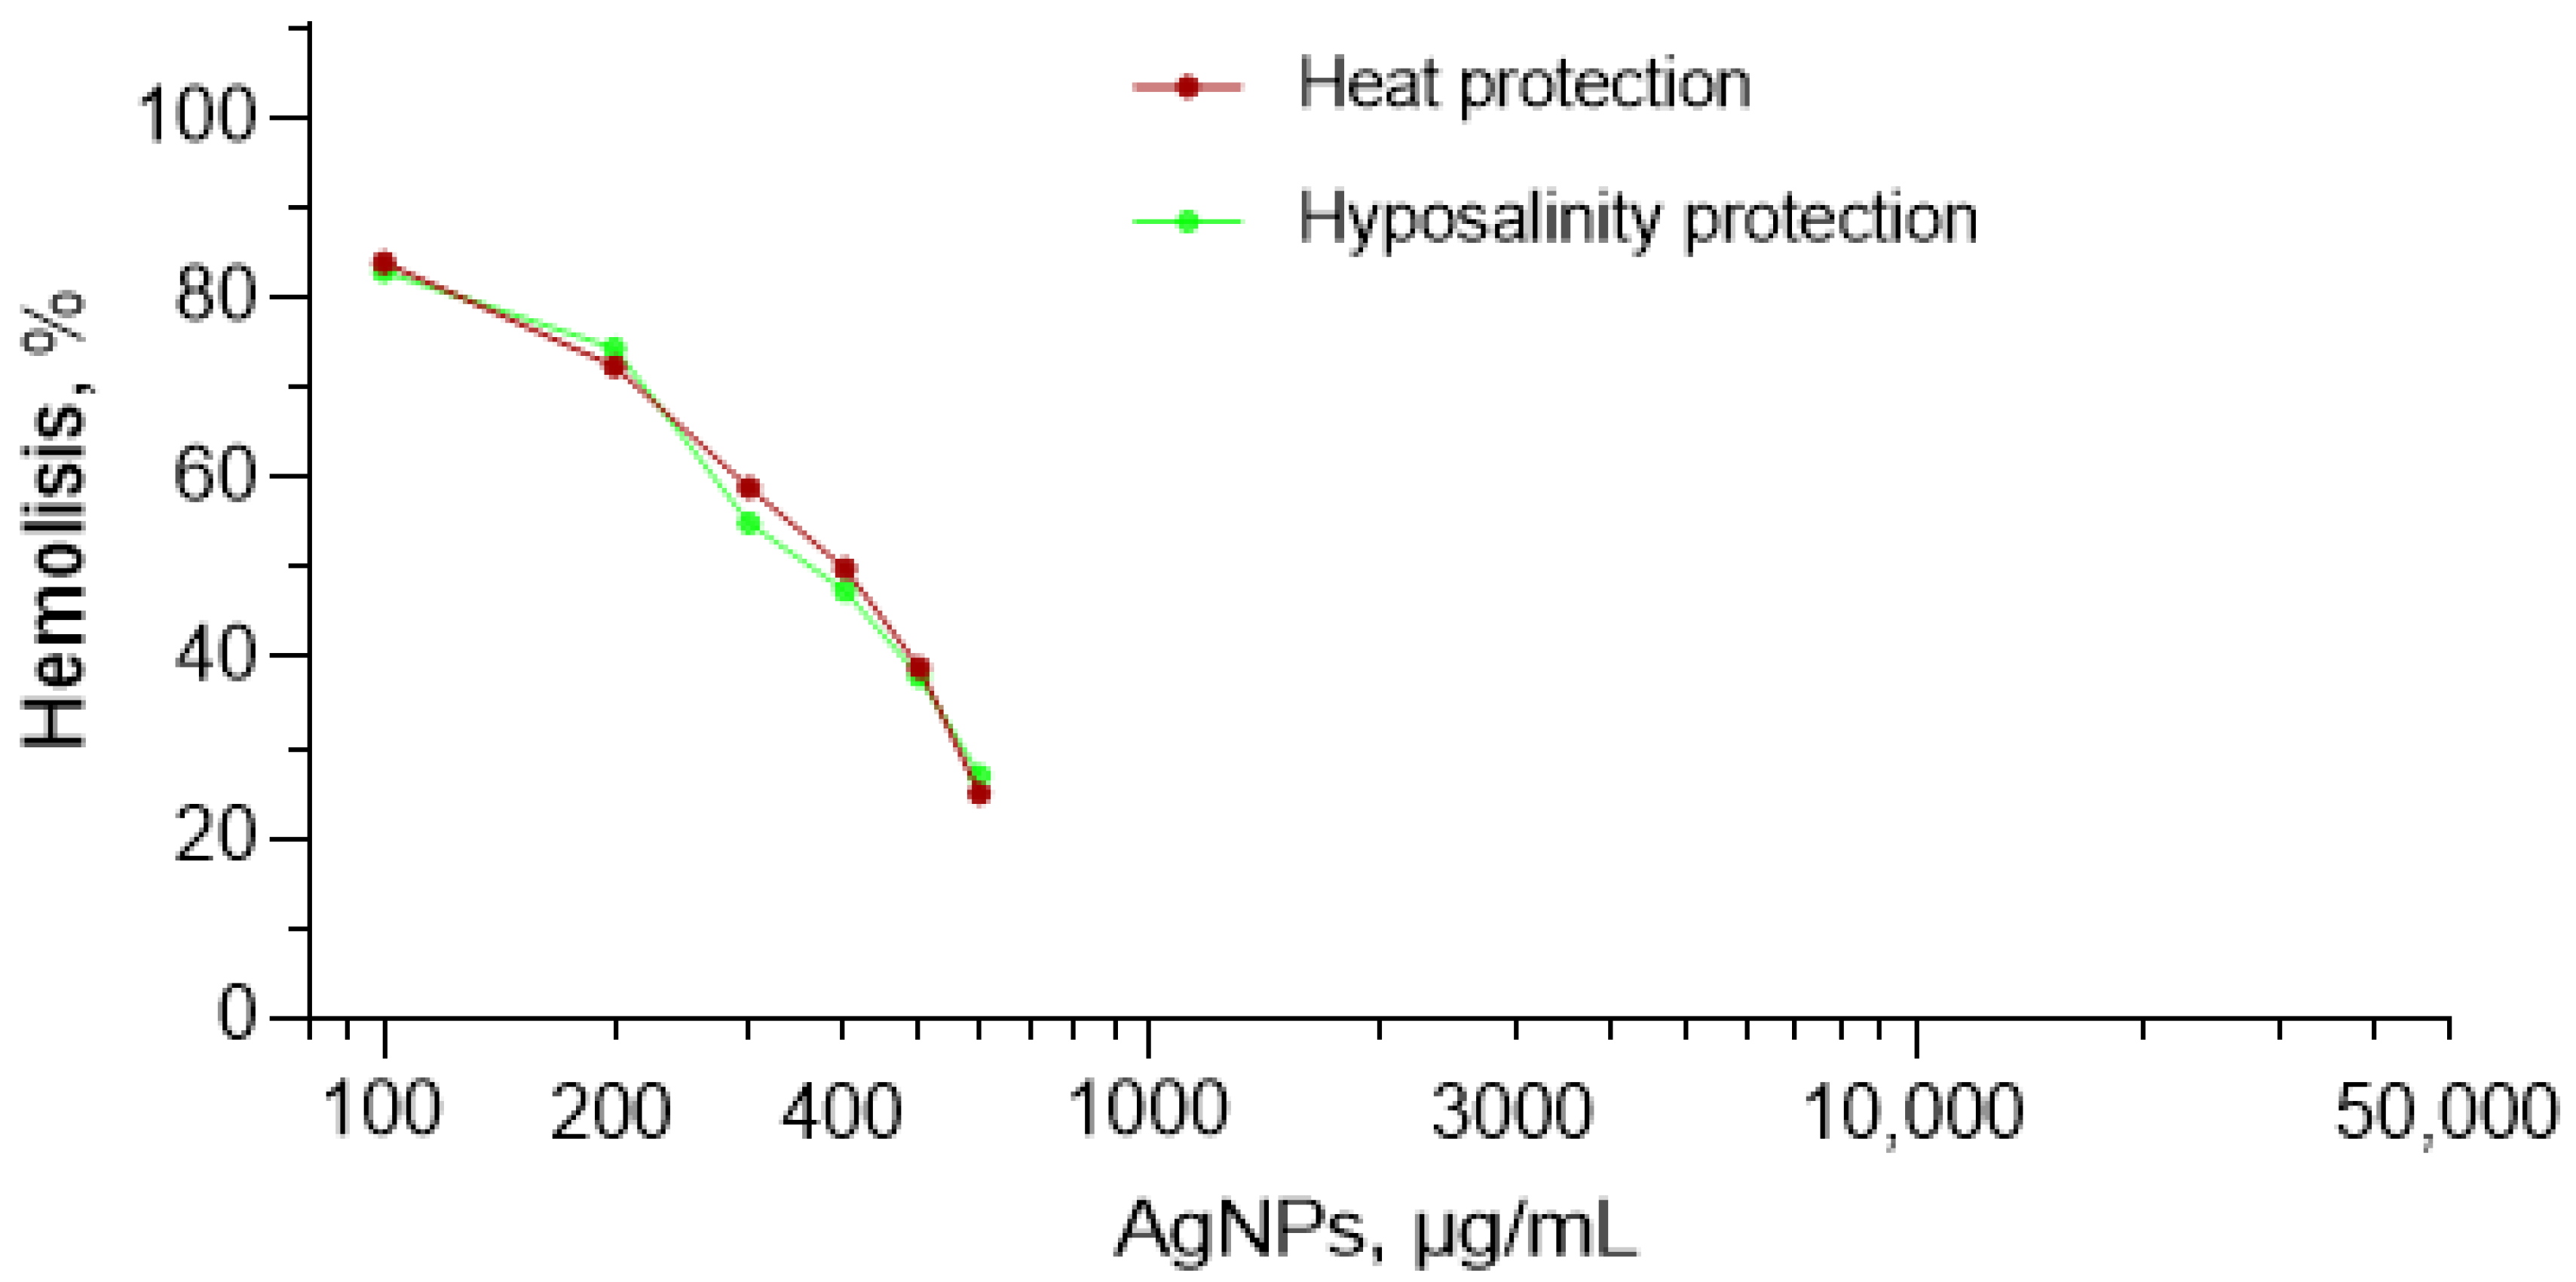
3.2. DDE and HDE
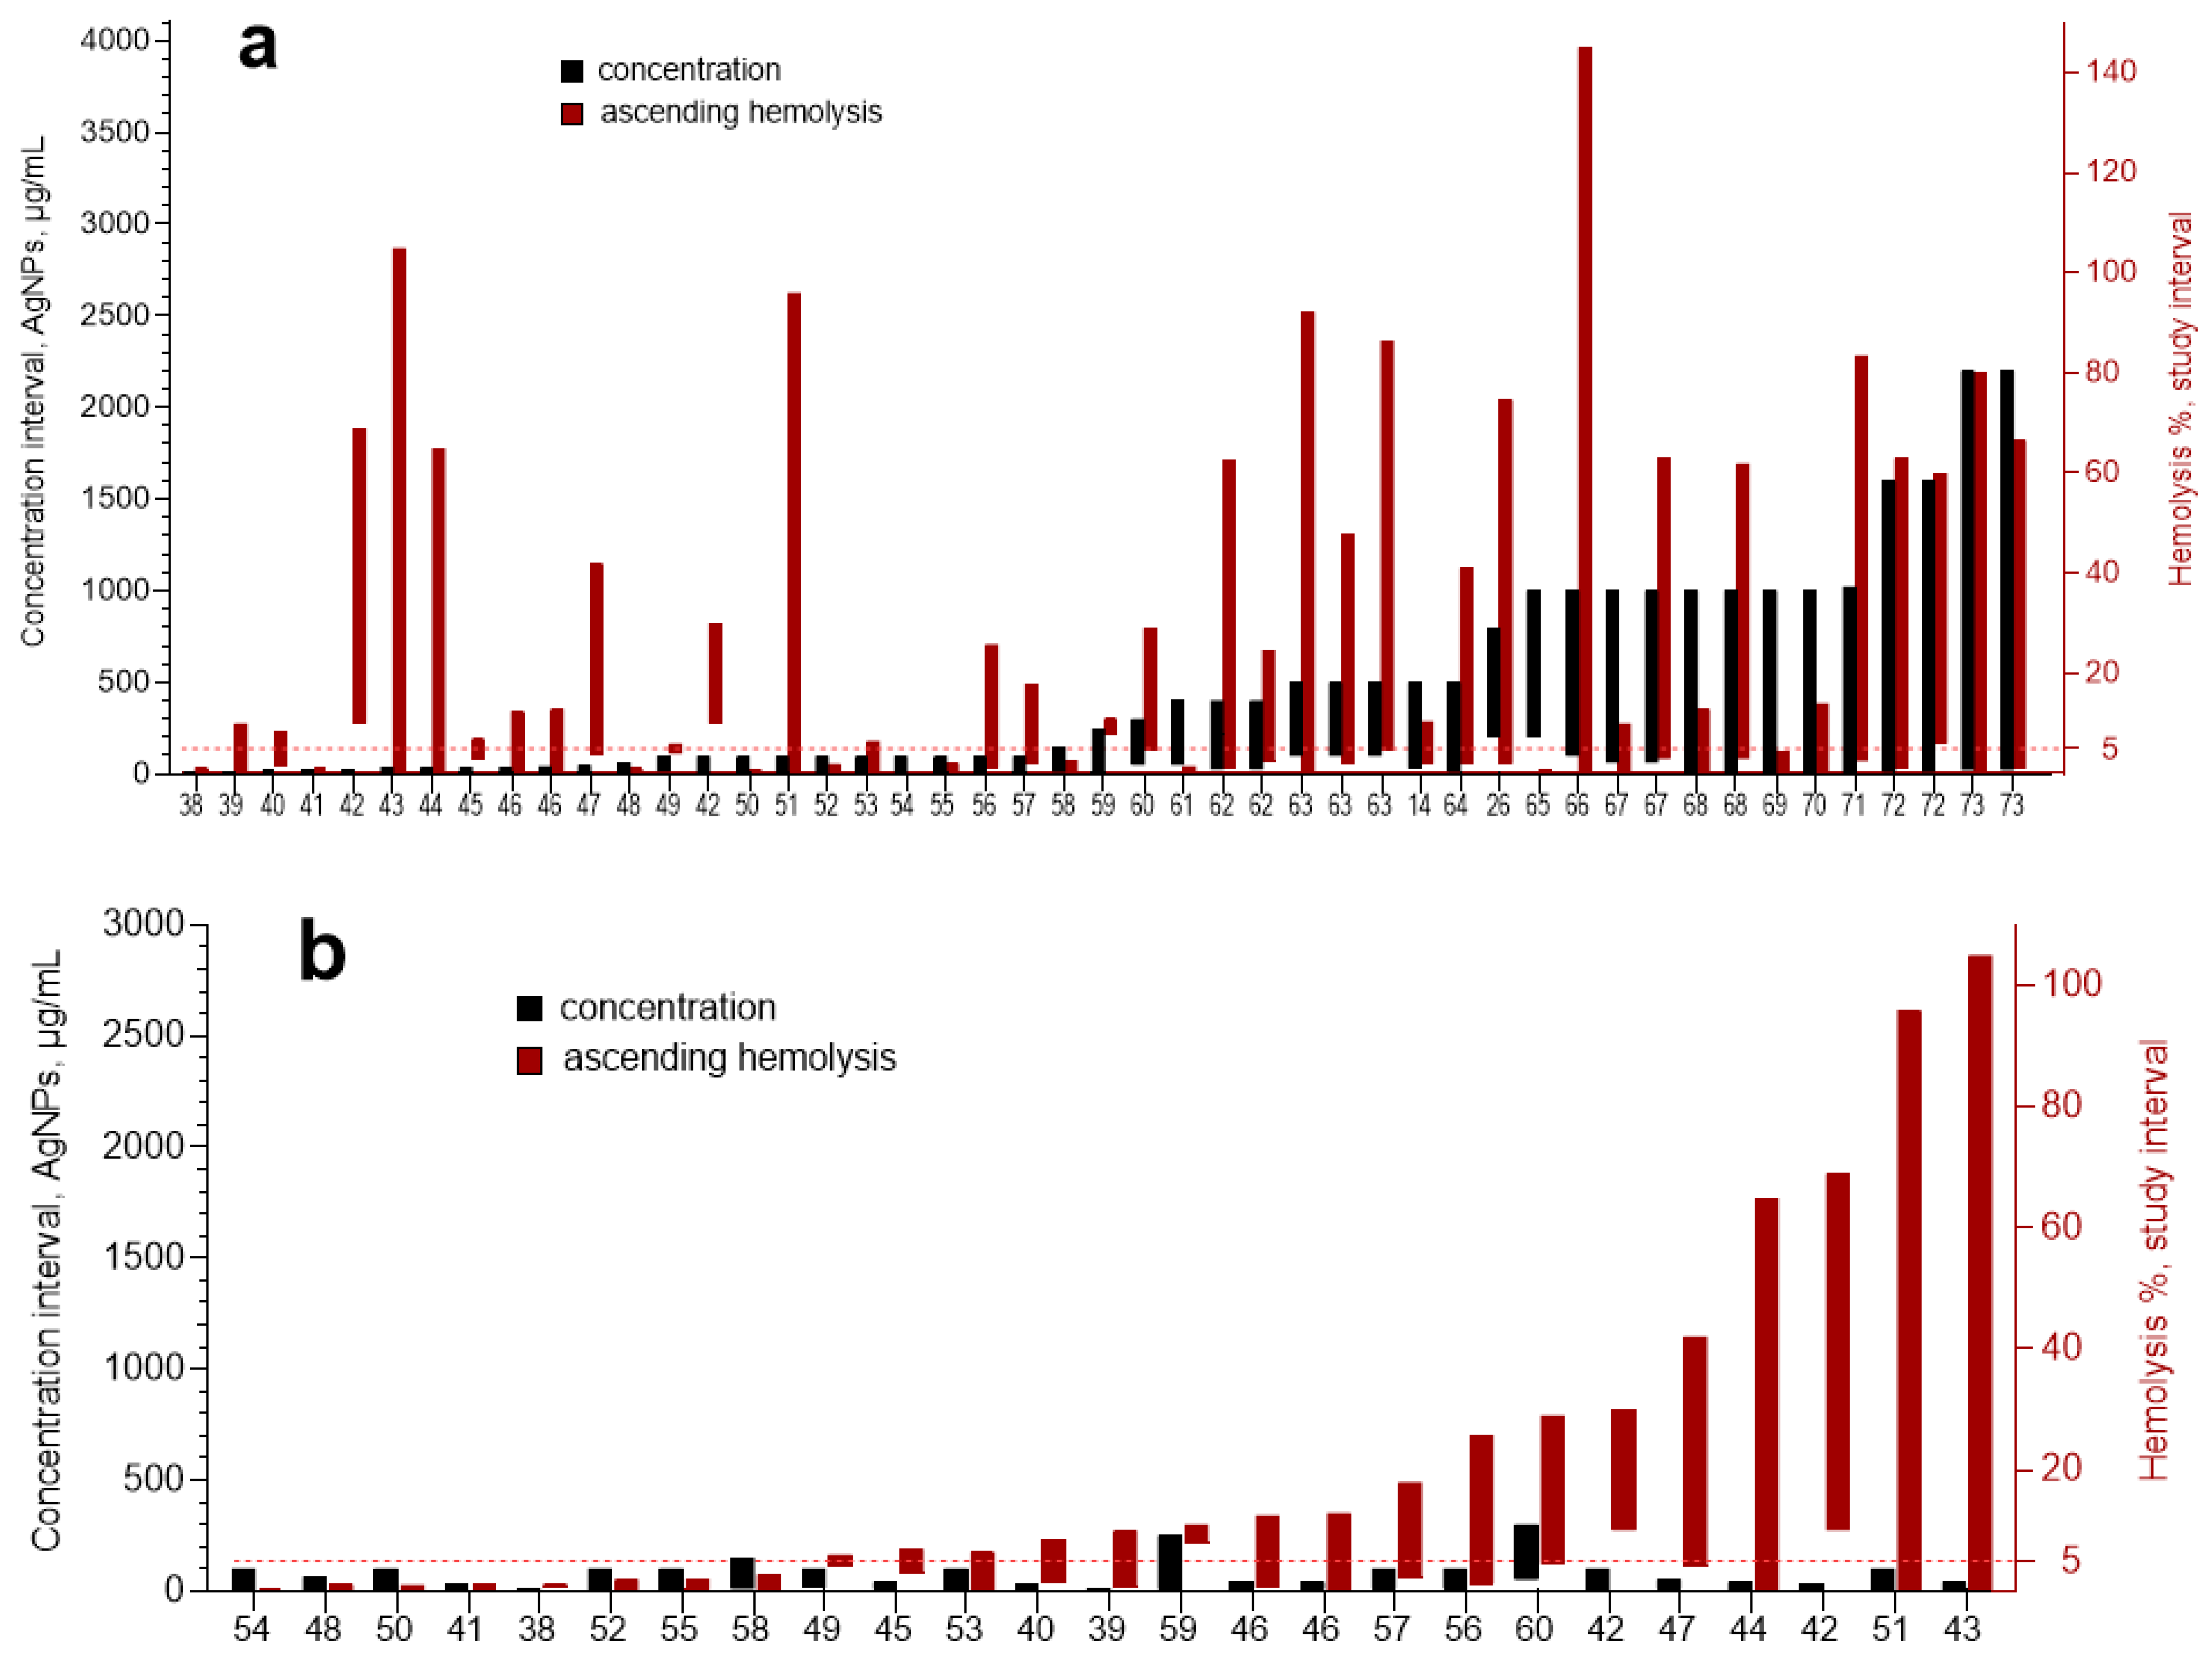
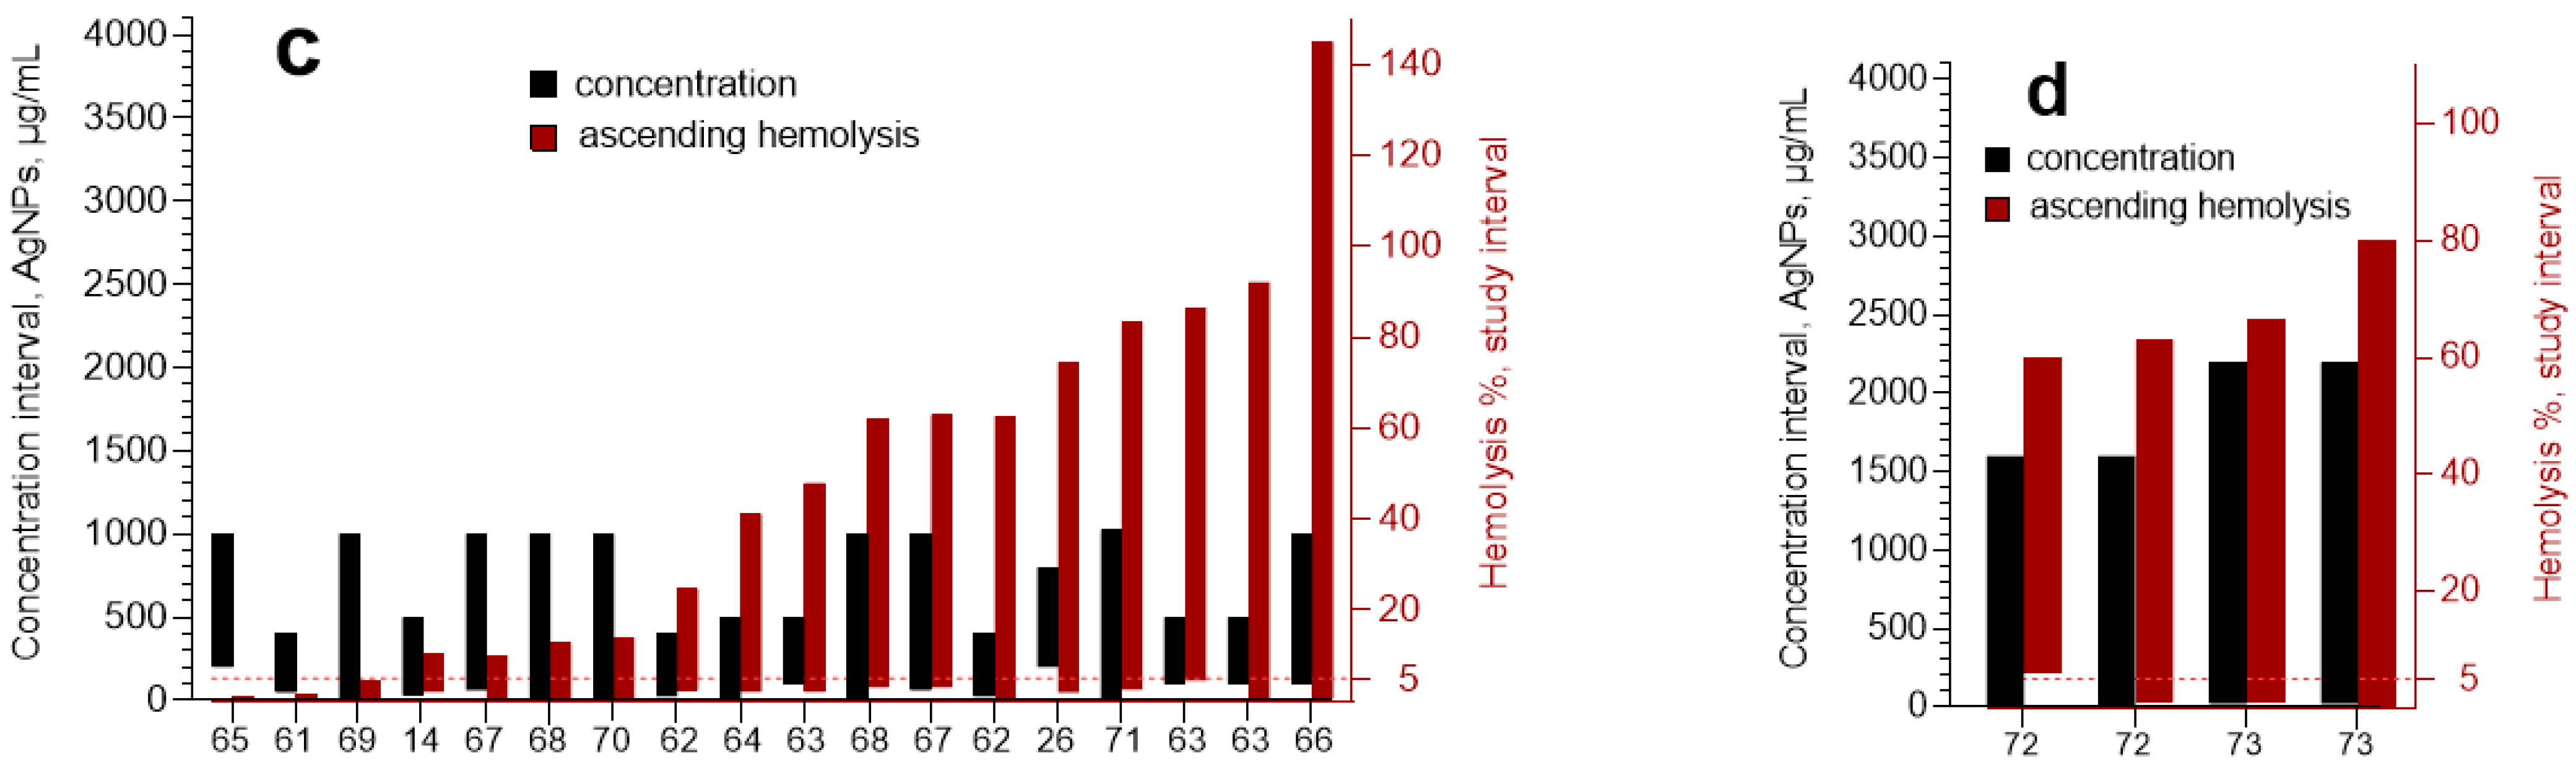
3.3. Meta-Analysis
4. Discussion
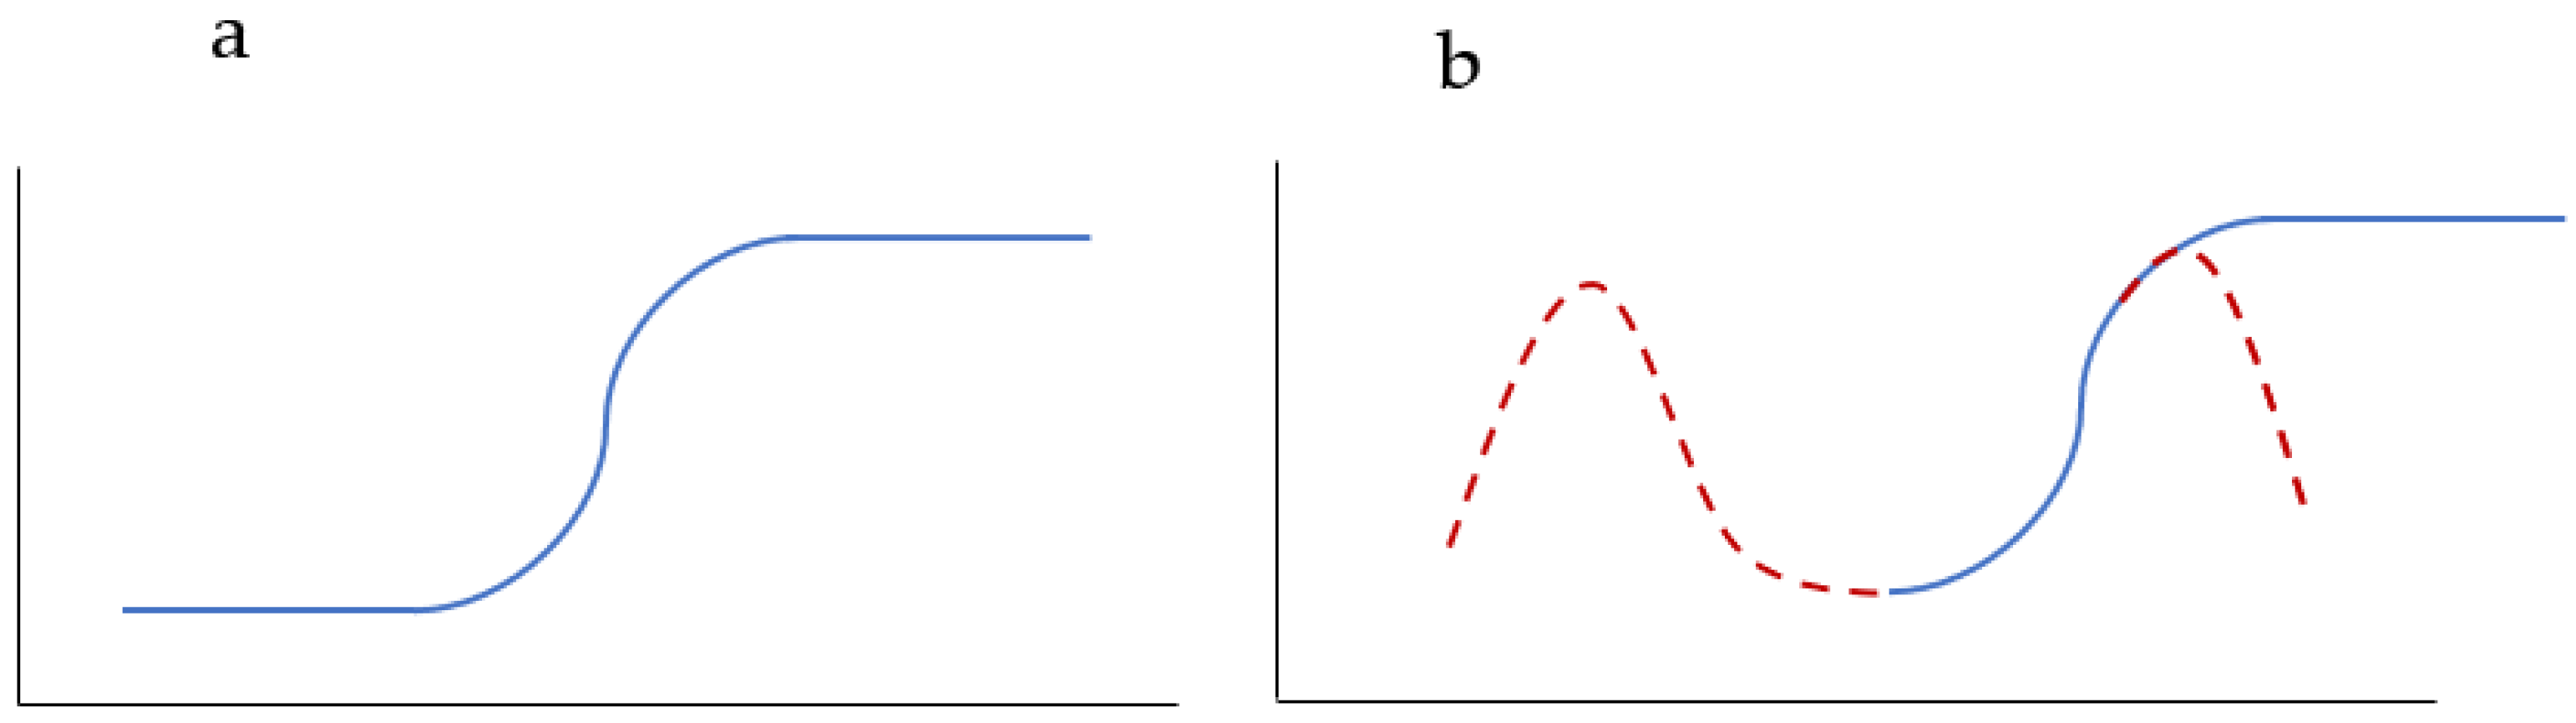
4.1. Bell-Shaped Hemolysis Profile
4.2. The Possible Reason for the Bell-Shaped Hemolysis Profile
4.3. Influence of pH
4.4. Hemolysis Caused by AgNO3
5. Conclusions
Author Contributions
Funding
Institutional Review Board Statement
Informed Consent Statement
Data Availability Statement
Conflicts of Interest
References
- Mukhopadhyay, S. Nanotechnology in agriculture: Prospects and constraints. Nanotechnol. Sci. Appl. 2014, 7, 63–71. [Google Scholar] [CrossRef] [PubMed] [Green Version]
- Shang, Y.; Hasan, M.K.; Ahammed, G.J.; Li, M.; Yin, H.; Zhou, J. Applications of Nanotechnology in Plant Growth and Crop Protection: A Review. Molecules 2019, 24, 2558. [Google Scholar] [CrossRef] [Green Version]
- Neme, K.; Nafady, A.; Uddin, S.; Tola, Y.B. Application of nanotechnology in agriculture, postharvest loss reduction and food processing: Food security implication and challenges. Heliyon 2021, 7, e08539. [Google Scholar] [CrossRef] [PubMed]
- Bai, D.-P.; Lin, X.-Y.; Huang, Y.-F.; Zhang, X.-F. Theranostics Aspects of Various Nanoparticles in Veterinary Medicine. Int. J. Mol. Sci. 2018, 19, 3299. [Google Scholar] [CrossRef] [Green Version]
- Enas Hatem, K.; Tamara Natik, D.; Firas Rashad, A.-S. Application of Nanoparticle in the Veterinary Medicine. Magna Sci. Adv. Res. Rev. 2022, 4, 27–38. [Google Scholar]
- Saleem, H.; Zaidi, S.J. Sustainable Use of Nanomaterials in Textiles and Their Environmental Impact. Materials 2020, 13, 5134. [Google Scholar] [CrossRef]
- Bhandari, V.; Jose, S.; Badanayak, P.; Sankaran, A.; Anandan, V. Antimicrobial Finishing of Metals, Metal Oxides, and Metal Composites on Textiles: A Systematic Review. Ind. Eng. Chem. Res. 2022, 61, 86–101. [Google Scholar] [CrossRef]
- Khan, S.A. Metal nanoparticles toxicity: Role of physicochemical aspects. In Metal Nanoparticles for Drug Delivery and Diagnostic Applications; Shah, M.R., Imran, M., Ullah, S., Eds.; Elsevier: Amsterdam, The Netherlands, 2020; pp. 1–11. [Google Scholar]
- Yaqoob, A.A.; Ahmad, H.; Parveen, T.; Ahmad, A.; Oves, M.; Ismail, I.M.I.; Qari, H.A.; Umar, K.; Ibrahim, M.N.M. Recent Advances in Metal Decorated Nanomaterials and Their Various Biological Applications: A Review. Front. Chem. 2020, 8, 341. [Google Scholar] [CrossRef]
- Kumar, H.; Venkatesh, N.; Bhowmik, H.; Kuila, A. Metallic Nanoparticle: A Review. Biomed. J. Sci. Tech. Res. 2018, 4, 3765–3775. [Google Scholar]
- Chandrakala, V.; Aruna, V.; Angajala, G. Review on metal nanoparticles as nanocarriers: Current challenges and perspectives in drug delivery systems. Emergent Mater. 2022, 1–23. [Google Scholar] [CrossRef]
- Klębowski, B.; Depciuch, J.; Parlińska-Wojtan, M.; Baran, J. Applications of Noble Metal-Based Nanoparticles in Medicine. Int. J. Mol. Sci. 2018, 19, 4031. [Google Scholar] [CrossRef] [Green Version]
- Burdușel, A.-C.; Gherasim, O.; Grumezescu, A.M.; Mogoantă, L.; Ficai, A.; Andronescu, E. Biomedical Applications of Silver Nanoparticles: An Up-to-Date Overview. Nanomaterials 2018, 8, 681. [Google Scholar] [CrossRef] [Green Version]
- Parthiban, E.; Manivannan, N.; Ramanibai, R.; Mathivanan, N. Green synthesis of silver-nanoparticles from Annona reticulata leaves aqueous extract and its mosquito larvicidal and anti-microbial activity on human pathogens. Biotechnol. Rep. 2019, 21, e00297. [Google Scholar] [CrossRef]
- AshaRrani, P.V.; Low Kah Mun, G.; Hande, M.P.; Valiyaveettil, S. Cytotoxicity and Genotoxicity of Silver Nanoparticles in Human Cells. ACS Nano 2009, 3, 279–290. [Google Scholar] [CrossRef]
- Khatoon, U.T.; Rao, G.N.; Mohan, M.K.; Ramanaviciene, A.; Ramanavicius, A. Comparative study of antifungal activity of silver and gold nanoparticles synthesized by facile chemical approach. J. Environ. Chem. Eng. 2018, 6, 5837–5844. [Google Scholar] [CrossRef]
- Khatoon, U.T.; Rao, G.N.; Mohan, K.M.; Ramanaviciene, A.; Ramanavicius, A. Antibacterial and antifungal activity of silver nanospheres synthesized by tri-sodium citrate assisted chemical approach. Vacuum 2017, 146, 259–265. [Google Scholar] [CrossRef]
- Almonaci-Hernández, C.A.; Clinic, E.I.A.A.; Juarez-Moreno, K.O.; Castañeda-Juarez, M.E.; Almanza-Reyes, H.; Pestryakov, A.; Bogdanchikova, N. Silver Nanoparticles for the Rapid Healing of Diabetic Foot Ulcers. Int. J. Med. Nano Res. 2017, 4, 20–25. [Google Scholar] [CrossRef] [Green Version]
- Hernández, C.A.A.; Torres, I.M.C.; López-Acevedo, R.; Juárez-Moreno, K.O.; Castañeda-Juárez, M.E.; Almanza-Reyes, H.; Pestryakov, A.; Bogdanchikova, N. Diabetic foot ulcers treatment with silver nanoparticles. Rev. Cienc. Tecnológicas 2019, 2, 20–25. [Google Scholar] [CrossRef]
- Almonaci-Hernández, C.A.; Luna-Vazquez-Gomez, R.; Luna-Vazquez-Gomez, R.A.; Valenciano-Vega, J.I.; Carriquiry-Chequer, N.I.; Rembao-Hernández, A.; Gomez-Zendejas, M.L.; Almanza-Reyes, H.; Garibo-Ruiz, D.; Pestryakov, A.; et al. Nanomedicine approach for the rapid healing of diabetic foot ulcers with silver nanoparticles. J. Clin. Med. Images 2020, 3, 1–7. [Google Scholar]
- Juarez-Moreno, K.; Gonzalez, E.B.; Girón-Vazquez, N.; Chavez-Santoscoy, R.A.; Mota-Morales, J.; Perez-Mozqueda, L.L.; Garcia-Garcia, M.R.; Pestryakov, A.; Bogdanchikova, N. Comparison of cytotoxicity and genotoxicity effects of silver nanoparticles on human cervix and breast cancer cell lines. Hum. Exp. Toxicol. 2017, 36, 931–948. [Google Scholar] [CrossRef]
- Valenzuela-Salas, L.M.; Girón-Vázquez, N.G.; García-Ramos, J.C.; Torres-Bugarín, O.; Gómez, C.; Pestryakov, A.; Villarreal-Gómez, L.J.; Toledano-Magaña, Y.; Bogdanchikova, N. Antiproliferative and Antitumour Effect of Nongenotoxic Silver Nanoparticles on Melanoma Models. Oxidative Med. Cell. Longev. 2019, 2019, 4528241. [Google Scholar] [CrossRef]
- Ruiz-Ruiz, B.; Arellano-García, M.E.; Radilla-Chávez, P.; Salas-Vargas, D.S.; Toledano-Magaña, Y.; Casillas-Figueroa, F.; Luna Vazquez-Gomez, R.; Pestryakov, A.; García-Ramos, J.C.; Bogdanchikova, N. Cytokinesis-Block Micronucleus Assay Using Human Lymphocytes as a Sensitive Tool for Cytotoxicity/Genotoxicity Evaluation of AgNPs. ACS Omega 2020, 5, 12005–12015. [Google Scholar] [CrossRef] [PubMed]
- Casillas-Figueroa, F.; Arellano-García, M.E.; Leyva-Aguilera, C.; Ruíz-Ruíz, B.; Vázquez-Gómez, R.L.; Radilla-Chávez, P.; Chávez-Santoscoy, R.A.; Pestryakov, A.; Toledano-Magaña, Y.; García-Ramos, J.C.; et al. Argovit™ Silver Nanoparticles Effects on Allium cepa: Plant Growth Promotion without Cyto Genotoxic Damage. Nanomaterials 2020, 10, 1386. [Google Scholar] [CrossRef]
- Castro-Gamboa, S.; Garcia-Garcia, M.R.; Piñon-Zarate, G.; Rojas-Lemus, M.; Jarquin-Yañez, K.; Herrera-Enriquez, M.A.; Fortoul, T.I.; Toledano-Magaña, Y.; Garcia-Iglesias, T.; Pestryakov, A.; et al. Toxicity of silver nanoparticles in mouse bone marrow-derived dendritic cells: Implications for phenotype. J. Immunotoxicol. 2019, 16, 54–62. [Google Scholar] [CrossRef] [PubMed]
- Luna-Vázquez-Gómez, R.; Arellano-García, M.; García-Ramos, J.; Radilla-Chávez, P.; Salas-Vargas, D.; Casillas-Figueroa, F.; Ruiz-Ruiz, B.; Bogdanchikova, N.; Pestryakov, A. Hemolysis of Human Erythrocytes by Argovit™ AgNPs from Healthy and Diabetic Donors: An In Vitro Study. Materials 2021, 14, 2792. [Google Scholar] [CrossRef] [PubMed]
- Stephano-Hornedo, J.L.; Torres-Gutiérrez, O.; Toledano-Magaña, Y.; Gradilla-Martínez, I.; Pestryakov, A.; Sánchez-González, A.; García-Ramos, J.C.; Bogdanchikova, N. Argovit™ silver nanoparticles to fight Huanglongbing disease in Mexican limes (Citrus aurantifolia Swingle). RSC Adv. 2020, 10, 6146–6155. [Google Scholar] [CrossRef] [Green Version]
- Semenov, F.V.; Fidarova, K.M. The treatment of the patients presenting with chronic inflammation of the trepanation cavity with a preparation containing silver nanoparticles following sanitation surgery of the open type. Vestn. Otorinolaringol. 2012, 117–119. [Google Scholar]
- Uraskulova, B.B.; Gyusan, A.O. The clinical and bacteriological study of the effectiveness of the application of silver nanoparticle for the treatment of tuberculosis. Vestn. Otorinolaringol. 2017, 82, 54–57. [Google Scholar] [CrossRef]
- Bogdanchikova, N.; Vazquez-Munoz, R.; Huerta-Saquero, A.; Jasso, A.P.; Uzcanga, G.A.; Díaz, P.L.P.; Pestryakov, A.; Burmistrov, V.; Martynyuk, O.; Gómez, R.L.V.; et al. Silver nanoparticles composition for treatment of distemper in dogs. Int. J. Nanotechnol. 2016, 13, 227. [Google Scholar] [CrossRef]
- Research and Production Center “Vector-Vita”. Available online: http://www.vector-vita.com/company.html (accessed on 10 February 2022).
- Research and Production Center “Bionag”. 2021. Available online: http://bionag.com/index.html (accessed on 10 February 2022).
- Evans, B.C.; Nelson, C.E.; Shann, S.Y.; Beavers, K.R.; Kim, A.J.; Li, H.; Nelson, H.M.; Giorgio, T.D.; Duvall, C.L. Ex vivo red blood cell hemolysis assay for the evaluation of pH-responsive endosomolytic agents for cytosolic delivery of biomacromolecular drugs. J. Vis. Exp. 2013, 73, e50166. [Google Scholar]
- Pagurova, V.I. On Confidence Estimation in a General Linear Regression Model with Nonhomogeneous Variances. Theory Probab. Its Appl. 1983, 27, 407–411. [Google Scholar] [CrossRef]
- Priyadarshini, K.H.; Latha, P.A.; Pradnya, S.; Juhi, A.; Samatha, P.; Ratnam, K.M. Comparative study of erythrocyte fragility in diabetes mellitus and non diabetes mellitus. Int. J. Med. Res. Health Sci. 2015, 4, 183. [Google Scholar] [CrossRef]
- Rafiq, S.; Rownak, N.; Akhter, S.; Khatun, M.; Baksh, S.; Rahman, M. Study of Osmotic Fragility Status of Red Blood Cell in Type II Diabetes Mellitus Patients. Eur. J. Environ. Public Health 2017, 1, 1–7. [Google Scholar] [CrossRef] [Green Version]
- Kwon, T.; Woo, H.J.; Kim, Y.H.; Lee, H.J.; Park, K.H.; Park, S.; Youn, B. Optimizing hemocompatibility of surfactant-coated silver nanoparticles in human erythrocytes. J. Nanosci. Nanotechnol. 2012, 12, 6168–6175. [Google Scholar] [CrossRef] [PubMed]
- Hamouda, R.A.; Hussein, M.H.; Abo-Elmagd, R.A.; Bawazir, S.S. Synthesis and biological characterization of silver nanoparticles derived from the cyanobacterium Oscillatoria limnetica. Sci. Rep. 2019, 9, 13071. [Google Scholar] [CrossRef]
- Jayeoye, T.J.; Nwabor, O.F.; Rujiralai, T. Synthesis of highly stable and dispersed silver nanoparticles/poly(vinyl alcohol-co-ethylene glycol)/poly(3-aminophenyl boronic acid) nanocomposite: Characterization and antibacterial, hemolytic and cytotoxicity studies. J. Ind. Eng. Chem. 2020, 89, 288–300. [Google Scholar]
- Sudarsan, S.; Shankar, M.K.; Motatis, A.K.B.; Shankar, S.; Krishnappa, D.; Mohan, C.; Rangappa, K.; Gupta, V.; Siddaiah, C. Green Synthesis of Silver Nanoparticles by Cytobacillus firmus Isolated from the Stem Bark of Terminalia arjuna and Their Antimicrobial Activity. Biomolecules 2021, 11, 259. [Google Scholar] [CrossRef]
- Birtekocak, F.; Demirbolat, G.M.; Cevik, O. TRAIL Conjugated Silver Nanoparticle Synthesis, Characterization and Therapeutic Effects on HT-29 Colon Cancer Cells. Iran. J. Pharm. Res. 2021, 20, 45–56. [Google Scholar] [CrossRef]
- Hajtuch, J.; Santos-Martinez, M.J.; Wojcik, M.; Tomczyk, E.; Jaskiewicz, M.; Kamysz, W.; Narajczyk, M.; Inkielewicz-Stepniak, I. Lipoic Acid-Coated Silver Nanoparticles: Biosafety Potential on the Vascular Microenvironment and Antibacterial Properties. Front. Pharmacol. 2021, 12, 733743. [Google Scholar] [CrossRef]
- Chi, Z.; Lin, H.; Li, W.; Zhang, X.; Zhang, Q. In vitro assessment of the toxicity of small silver nanoparticles and silver ions to the red blood cells. Environ. Sci. Pollut. Res. 2018, 25, 32373–32380. [Google Scholar] [CrossRef]
- Zharkova, M.S.; Golubeva, O.Y.; Orlov, D.S.; Vladimirova, E.V.; Dmitriev, A.V.; Tossi, A.; Shamova, O.V. Silver Nanoparticles Functionalized with Antimicrobial Polypeptides: Benefits and Possible Pitfalls of a Novel Anti-infective Tool. Front. Microbiol. 2021, 12, 750556. [Google Scholar] [CrossRef] [PubMed]
- Sen, I.K.; Mandal, A.K.; Chakraborti, S.; Dey, B.; Chakraborty, R.; Islam, S.S. Green synthesis of silver nanoparticles using glucan from mushroom and study of antibacterial activity. Int. J. Biol. Macromol. 2013, 62, 439–449. [Google Scholar] [CrossRef] [PubMed]
- Huang, H.; Lai, W.; Cui, M.; Liang, L.; Lin, Y.; Fang, Q.; Liu, Y.; Xie, L. An Evaluation of Blood Compatibility of Silver Nanoparticles. Sci. Rep. 2016, 6, 25518. [Google Scholar] [CrossRef] [Green Version]
- Maity, G.N.; Maity, P.; Choudhuri, I.; Sahoo, G.C.; Maity, N.; Ghosh, K.; Bhattacharyya, N.; Dalai, S.; Mondal, S. Green synthesis, characterization, antimicrobial and cytotoxic effect of silver nanoparticles using arabinoxylan isolated from Kalmegh. Int. J. Biol. Macromol. 2020, 162, 1025–1034. [Google Scholar] [CrossRef] [PubMed]
- Sheng, Y.; Narayanan, M.; Basha, S.; Elfasakhany, A.; Brindhadevi, K.; Xia, C.; Pugazhendhi, A. In vitro and in vivo efficacy of green synthesized AgNPs against Gram negative and Gram positive bacterial pathogens. Process Biochem. 2022, 112, 241–247. [Google Scholar] [CrossRef]
- Habeeb, Z.F. Biosynthesis, Characterization, Antioxidant Activity, and Clinical Application of Silver Nanoparticles Synthesized from Dodonaea Viscosa Leaves Extract; University of Kerbala: Kerbala, Iraq, 2021. [Google Scholar]
- Saadh, M.J. Effect of silver nanoparticles on the antibacterial activity of Levofloxacin against methicillin-resistant Staphylococcus aureus. Eur. Rev. Med. Pharmacol. Sci. 2021, 25, 5507–5510. [Google Scholar] [PubMed]
- Halbandge, S.D.; Mortale, S.P.; Karuppayil, S.M. Biofabricated Silver Nanoparticles Synergistically Activate Amphotericin B Against Mature Biofilm Forms of Candida Albicans. Open Nanomed. J. 2017, 4, 1–16. [Google Scholar] [CrossRef]
- Tag, H.M.; Saddiq, A.A.; Alkinani, M.; Hagagy, N. Biosynthesis of silver nanoparticles using Haloferax sp. NRS1: Image analysis, characterization, in vitro thrombolysis and cytotoxicity. AMB Express 2021, 11, 75. [Google Scholar] [CrossRef]
- Jayeoye, T.J.; Eze, F.N.; Olatunde, O.O.; Singh, S.; Zuo, J.; Olatunji, O.J. Multifarious Biological Applications and Toxic Hg2+ Sensing Potentiality of Biogenic Silver Nanoparticles Based on Securidaca inappendiculata Hassk Stem Extract. Int. J. Nanomed. 2021, 16, 7557–7574. [Google Scholar] [CrossRef]
- Laloy, J.; Minet, V.; Alpan, L.; Mullier, F.; Beken, S.; Toussaint, O.; Lucas, S.; Dogné, J.-M. Impact of Silver Nanoparticles on Haemolysis, Platelet Function and Coagulation. Nanobiomedicine 2014, 1, 4. [Google Scholar] [CrossRef]
- Katva, S.; Das, S.; Moti, H.S.; Jyoti, A.; Kaushik, S. Antibacterial Synergy of Silver Nanoparticles with Gentamicin and Chloramphenicol against Enterococcus faecalis. Pharmacogn. Mag. 2018, 13, S828–S833. [Google Scholar] [CrossRef] [PubMed]
- Nasar, M.Q.; Zohra, T.; Khalil, A.T.; Saqib, S.; Ayaz, M.; Ahmad, A.; Shinwari, Z.K. Seripheidium quettense mediated green synthesis of biogenic silver nanoparticles and their theranostic applications. Green Chem. Lett. Rev. 2019, 12, 310–322. [Google Scholar] [CrossRef] [Green Version]
- Nasar, M.Q.; Shah, M.; Khalil, A.T.; Ayaz, M.; Dablool, A.S.; Shinwari, Z.K. Ephedra intermedia mediated synthesis of biogenic silver nanoparticles and their antimicrobial, cytotoxic and hemocompatability evaluations. Inorg. Chem. Commun. 2022, 137, 109252. [Google Scholar] [CrossRef]
- Srećković, N.Z.; Nedić, Z.P.; Liberti, D.; Monti, D.M.; Mihailović, N.R.; Stanković, J.S.K.; Dimitrijević, S.; Mihailović, V.B. Application potential of biogenically synthesized silver nanoparticles using Lythrum salicaria L. extracts as pharmaceuticals and catalysts for organic pollutant degradation. RSC Adv. 2021, 11, 35585–35599. [Google Scholar] [CrossRef]
- Shah, A.; Lutfullah, G.; Ahmad, K.; Khalil, A.T.; Maaza, M. Daphne mucronata-mediated phytosynthesis of silver nanoparticles and their novel biological applications, compatibility and toxicity studies. Green Chem. Lett. Rev. 2018, 11, 318–333. [Google Scholar] [CrossRef] [Green Version]
- Jalil, P.J. Silver Nanoparticles: Green Synthesis, Characterization, Blood Compatibility and Protoscolicidal Efficacy against Echinococcus granulosus. Pak. Vet. J. 2021, 41, 393–399. [Google Scholar] [CrossRef]
- Faisal, S.; Khan, M.A.; Jan, H.; Shah, S.A.; Abdullah, A.; Shah, S.; Rizwan, M.; Wajidullah, W.; Akbar, M.T.; Redaina, R. Edible mushroom (Flammulina velutipes) as biosource for silver nanoparticles: From synthesis to diverse biomedical and environmental applications. Nanotechnology 2021, 32, 065101. [Google Scholar] [CrossRef]
- Asharani, P.V.; Sethu, S.; Vadukumpully, S.; Zhong, S.; Lim, C.T.; Hande, M.P.; Valiyaveettil, S. Investigations on the Structural Damage in Human Erythrocytes Exposed to Silver, Gold, and Platinum Nanoparticles. Adv. Funct. Mater. 2010, 20, 1233–1242. [Google Scholar]
- Kim, M.J.; Shin, S. Toxic effects of silver nanoparticles and nanowires on erythrocyte rheology. Food Chem. Toxicol. 2014, 67, 80–86. [Google Scholar] [CrossRef]
- Bian, Y.; Kim, K.; Ngo, T.; Kim, I.; Bae, O.-N.; Lim, K.-M.; Chung, J.-H. Silver nanoparticles promote procoagulant activity of red blood cells: A potential risk of thrombosis in susceptible population. Part. Fibre Toxicol. 2019, 16, 9. [Google Scholar] [CrossRef]
- Nelsonjoseph, L.; Vishnupriya, B.; Amsaveni, R.; Bharathi, D.; Thangabalu, S. Rehna, Synthesis and characterization of silver nanoparticles using Acremonium borodinense and their anti-bacterial and hemolytic activity. Biocatal. Agric. Biotechnol. 2022, 39, 102222. [Google Scholar] [CrossRef]
- Das, P.; Dutta, T.; Manna, S.; Loganathan, S. Basak, Facile green synthesis of non-genotoxic, non-hemolytic organometallic silver nanoparticles using extract of crushed, wasted, and spent Humulus lupulus (hops): Characterization, anti-bacterial, and anti-cancer studies. Environ. Res. 2022, 204 Pt A, 111962. [Google Scholar] [CrossRef]
- Chahardoli, A.; Hajmomeni, P.; Ghowsi, M.; Qalekhani, F.; Shokoohinia, Y.; Fattahi, A. Optimization of Quercetin-Assisted Silver Nanoparticles Synthesis and Evaluation of Their Hemocompatibility, Antioxidant, Anti-Inflammatory, and Antibacterial effects. Glob. Chall. 2021, 5, 2100075. [Google Scholar] [PubMed]
- Chahrdoli, A.; Qalekhani, F.; Ghowsi, M.; Nemati, H.; Shokoohinia, Y.; Fattahi, A. Achillea wilhelmsii C. Koch Mediated Blood Compatible Silver Nanoparticles. Mater. Today Commun. 2020, 25, 101577. [Google Scholar]
- Al-Turnachy, H.H.; Madhloom, A.A.A.; Motaweq, Z.Y.; Abdulla, N.Y. Biosynthesis of Silver Nanoparticles by Punica Granatum Peel Extract and their Biological Activity on different Pathogenic Bacteria. NeuroQuantology 2021, 19, 38–45. [Google Scholar]
- Ghazali, S.Z.; Noor, N.R.M.; Mustaffa, K.M.F. Anti-plasmodial activity of aqueous neem leaf extract mediated green synthesis-based silver nitrate nanoparticles. Prep. Biochem. Biotechnol. 2022, 52, 99–107. [Google Scholar] [CrossRef]
- Siritongsuk, P.; Hongsing, N.; Thammawithan, S.; Daduang, S.; Klaynongsruang, S.; Tuanyok, A.; Patramanon, R. Two-Phase Bactericidal Mechanism of Silver Nanoparticles against Burkholderia pseudomallei. PLoS ONE 2016, 11, e0168098. [Google Scholar] [CrossRef]
- Hossain, M.M.; Polash, S.A.; Takikawa, M.; Shubhra, R.D.; Saha, T.; Islam, Z.; Hossain, S.; Hasan, M.A.; Takeoka, S.; Sarker, S.R. Investigation of the Antibacterial Activity and in vivo Cytotoxicity of Biogenic Silver Nanoparticles as Potent Therapeutics. Front. Bioeng. Biotechnol. 2019, 7, 239. [Google Scholar] [CrossRef]
- Choi, J.; Reipa, V.; Hitchins, V.M.; Goering, P.L.; Malinauskas, R.A. Physicochemical Characterization and In Vitro Hemolysis Evaluation of Silver Nanoparticles. Toxicol. Sci. 2011, 123, 133–143. [Google Scholar] [CrossRef] [Green Version]
- Korolev, D.; Shumilo, M.; Shulmeyster, G.; Krutikov, A.; Golovkin, A.; Mishanin, A.; Gorshkov, A.; Spiridonova, A.; Domorad, A.; Krasichkov, A.; et al. Hemolytic Activity, Cytotoxicity, and Antimicrobial Effects of Human Albumin- and Polysorbate-80-Coated Silver Nanoparticles. Nanomaterials 2021, 11, 1484. [Google Scholar] [CrossRef]
- Krajewski, S.; Prucek, R.; Panacek, A.; Avci-Adali, M.; Nolte, A.; Straub, A.; Zboril, R.; Wendel, H.P.; Kvitek, L. Hemocompatibility evaluation of different silver nanoparticle concentrations employing a modified Chandler-loop in vitro assay on human blood. Acta Biomater. 2013, 9, 7460–7468. [Google Scholar] [CrossRef] [PubMed]
- Zawadzka, K.; Felczak, A.; Nowak, M.; Kowalczyk, A.; Piwoński, I.; Lisowska, K. Antimicrobial activity and toxicological risk assessment of silver nanoparticles synthesized using an eco-friendly method with Gloeophyllum striatum. J. Hazard. Mater. 2021, 418, 126316. [Google Scholar] [CrossRef] [PubMed]
- Bagheri, M.; Validi, M.; Gholipour, A.; Makvandi, P.; Sharifi, E. Chitosan nanofiber biocomposites for potential wound healing applications: Antioxidant activity with synergic antibacterial effect. Bioeng. Transl. Med. 2022, 7, e10254. [Google Scholar] [CrossRef]
- ASTM E2524-08; Standard Test Method for Analysis of Hemolytic Properties of Nanoparticles. ASTM International: West Conshohocken, PA, USA, 2013.
- Zhang, S.; Du, C.; Wang, Z.; Han, X.; Zhang, K.; Liu, L. Reduced cytotoxicity of silver ions to mammalian cells at high concentration due to the formation of silver chloride. Toxicol. Vitr. 2013, 27, 739–744. [Google Scholar] [CrossRef] [Green Version]
- Toh, H.S.; Batchelor-McAuley, C.; Tschulik, K.; Compton, R.G. Chemical interactions between silver nanoparticles and thiols: A comparison of mercaptohexanol against cysteine. Sci. China Ser. B Chem. 2014, 57, 1199–1210. [Google Scholar] [CrossRef]
- del Rocío Coutiño, E.M.; Lagunes, L.Á.; Helguera, O.A. Las nanopartículas de plata: Mecanismos de entrada Toxicidad y Estress oxidativo. REB 2017, 36, 39–54. Available online: https://www.medigraphic.com/pdfs/revedubio/reb-2017/reb172b.pdf (accessed on 10 February 2022).
- de la Harpe, K.M.; Kondiah, P.P.; Choonara, Y.E.; Marimuthu, T.; du Toit, L.C.; Pillay, V. The Hemocompatibility of Nanoparticles: A Review of Cell-Nanoparticle Interactions and Hemostasis. Cells 2019, 8, 1209. [Google Scholar]
- Shang, L.; Nienhaus, K.; Nienhaus, G.U. Engineered nanoparticles interacting with cells: Size matters. J. Nanobiotechnol. 2014, 12, 5. [Google Scholar] [CrossRef] [Green Version]
- Kosch, M.; Hausberg, M.; Westermann, G.; Köneke, J.; Matzkies, F.; Rahn, K.H.; Kisters, K. Alterations in calcium and magnesium content of red cell membranes in patients with primary hypertension. Am. J. Hypertens. 2001, 14, 254–258. [Google Scholar] [CrossRef] [Green Version]
- Levard, C.; Mitra, S.; Yang, T.; Jew, A.D.; Badireddy, A.R.; Lowry, G.V.; Brown, J.G.E. Effect of Chloride on the Dissolution Rate of Silver Nanoparticles and Toxicity to E. coli. Environ. Sci. Technol. 2013, 47, 5738–5745. [Google Scholar] [CrossRef]
- Fernando, I.; Zhou, Y. Impact of pH on the stability, dissolution and aggregation kinetics of silver nanoparticles. Chemosphere 2019, 216, 297–305. [Google Scholar] [CrossRef] [PubMed]
- Chen, L.Q.; Fang, L.; Ling, J.; Ding, C.Z.; Kang, B.; Huang, C.Z. Nanotoxicity of Silver Nanoparticles to Red Blood Cells: Size Dependent Adsorption, Uptake, and Hemolytic Activity. Chem. Res. Toxicol. 2015, 28, 501–509. [Google Scholar] [CrossRef] [PubMed]
- Anwar, S.; Almatroodi, S.A.; Almatroudi, A.; Allemailem, K.S.; Joseph, R.J.; Khan, A.A.; Alrumaihi, F.; Alsahli, M.A.; Rahmani, A.H. Biosynthesis of silver nanoparticles using Tamarix articulata leaf extract: An effective approach for attenuation of oxidative stress mediated diseases. Int. J. Food Prop. 2021, 24, 677–701. [Google Scholar] [CrossRef]


| References | Reason of Exclusion |
|---|---|
| [74] | The concentration of AgNPs is not indicated. |
| [75] | Data of hemolysis are presented in mg/dL, and initial erythrocyte concentration is absent. |
| [76] | Data of AgNPs are presented in µM. It is impossible to convert to µg/mL due to the fact that AgNPs are not molecules. |
| [77] | Hemolysis data presented in description and in corresponding figures are inconsistent (with a ten-fold difference). |
Publisher’s Note: MDPI stays neutral with regard to jurisdictional claims in published maps and institutional affiliations. |
© 2022 by the authors. Licensee MDPI, Basel, Switzerland. This article is an open access article distributed under the terms and conditions of the Creative Commons Attribution (CC BY) license (https://creativecommons.org/licenses/by/4.0/).
Share and Cite
Luna-Vázquez-Gómez, R.; Arellano-García, M.E.; Toledano-Magaña, Y.; García-Ramos, J.C.; Radilla-Chávez, P.; Salas-Vargas, D.S.; Casillas-Figueroa, F.; Ruiz-Ruiz, B.; Pestryakov, A.; Bogdanchikova, N. Bell Shape Curves of Hemolysis Induced by Silver Nanoparticles: Review and Experimental Assay. Nanomaterials 2022, 12, 1066. https://doi.org/10.3390/nano12071066
Luna-Vázquez-Gómez R, Arellano-García ME, Toledano-Magaña Y, García-Ramos JC, Radilla-Chávez P, Salas-Vargas DS, Casillas-Figueroa F, Ruiz-Ruiz B, Pestryakov A, Bogdanchikova N. Bell Shape Curves of Hemolysis Induced by Silver Nanoparticles: Review and Experimental Assay. Nanomaterials. 2022; 12(7):1066. https://doi.org/10.3390/nano12071066
Chicago/Turabian StyleLuna-Vázquez-Gómez, Roberto, María Evarista Arellano-García, Yanis Toledano-Magaña, Juan Carlos García-Ramos, Patricia Radilla-Chávez, David Sergio Salas-Vargas, Francisco Casillas-Figueroa, Balam Ruiz-Ruiz, Alexey Pestryakov, and Nina Bogdanchikova. 2022. "Bell Shape Curves of Hemolysis Induced by Silver Nanoparticles: Review and Experimental Assay" Nanomaterials 12, no. 7: 1066. https://doi.org/10.3390/nano12071066