Article

Comparative Study on Nanotoxicity in Human Primary and Cancer Cells

Nano-Safety Team, Safety Measurement Institute, Korea Research Institute of Standards and Science (KRISS), Yuseong-gu, Daejeon 34113, Korea
*
Author to whom correspondence should be addressed.
Nanomaterials 2022, 12(6), 993; https://doi.org/10.3390/nano12060993
Submission received: 17 February 2022 / Revised: 15 March 2022 / Accepted: 16 March 2022 / Published: 17 March 2022
(This article belongs to the Special Issue Toxicity Evaluation of Nanoparticles)

Abstract

:
Nanomaterial toxicity tests using normal and cancer cells may yield markedly different results. Here, nanomaterial toxicity between cancer and primary human cells was compared to determine the basic cell line selection criteria for nanomaterial toxicity analyses. Specifically, we exposed two cancer (A549 and HepG2) and two normal cell lines (NHBE and HH) cell lines to SiO2 nanoparticles (NPs) and evaluated the cytotoxicity (MTS assay), cell death mode, and intracellular NP retention. MTS assay results revealed higher sensitivity of HH cells to SiO2 NPs than HepG2 cells, while no difference was observed between NHBE and A549 cells. In addition, SiO2 NPs primarily induced necrosis in all the cell lines. Moreover, we evaluated NP accumulation by treating the cell lines with fluorescein-isothiocyanate-labeled SiO2 NPs. After 48 h of treatment, less than 10% of A549 and HepG2 cells and more than 30% of NHBE and HH cells contained the labeled NPs. Collectively, our results suggest that cell viability, death mode, and intracellular compound accumulation could be assessed using cancer cells. However, the outcomes of certain investigations, such as intracellular NP retention, may differ between cancer and normal cells.

1. Introduction

Nanotechnology has become a valuable and effective essential technology across several fields in recent years. Various nanomaterials, with sizes smaller than those of human cells, are widely used in cosmetics [1,2], sunscreens [3], food packaging [4], and pharmaceuticals [5]. However, their small size can make them toxic, posing risks to human health and safety [6,7,8].
As one of the most-produced nanoparticles (NPs) globally, silica NPs (SiNPs) are used in all aspects of life, including agriculture, food, and consumer goods [9]. In addition, the biocompatibility and stability of SiNPs make them promising candidates in various biomedical fields, such as gene carriers, drug delivery, and molecular imaging [10,11]. However, previous studies have reported on the toxic effects of SiNPs on essential organs such as the liver, lungs, brain, and kidneys [12,13]. Thus, extensive use has increased the risk of SiNPs exposure in humans.
Therefore, it is essential to investigate the safety of nanomaterials. Traditionally, toxicity studies using animals have been conducted to estimate the adverse effects of chemicals and nanomaterials on humans. However, many countries, particularly those in Europe, have recently begun regulating and limiting animal studies for ethical reasons; therefore, other test methods that estimate chemical or nanomaterial toxicity reliably are required [14]. Accordingly, human cell models that reduce unnecessary animal sacrifice and lower costs have been established. Presently, nanomaterial toxicity is being investigated using human cancer cells or immortalized cells [15,16]. Owing to their low cost, ease of handling, and excellent reproducibility, human cancer cells have considerable advantages in the rapid toxicity screening of nanomaterials or chemicals over other cells. However, unlike normal cells, cancer cells have unique characteristics, such as proliferating indefinitely due to excessive cell division from lack of cell cycle control and the apoptosis function [17]. In addition, cancer cells acquire energy by metabolizing glucose. The glycoprotein structure expressed on their membrane surface significantly differs from those on normal cells [18,19], resulting in studies raising concerns regarding the misjudgment of toxicity outcomes. Studies have associated nanomaterial toxicity with the cell lines used [20,21]. Therefore, results can be entirely different from those of normal cells when analyzing cell viability and the mechanism underlying the toxicity of nanomaterials using cancer cells [22].
Here, we compared the differences in nanomaterial toxicity between cancer and primary human cells. The liver and lungs, most affected by toxic substances, were the target organs in the current study. We used A549 (human lung cancer cell line) and NHBE cells (normal human bronchial epithelial cell line) as the lung model cells, and HepG2 (human liver cancer cell line) and HH cells (normal human hepatocyte line) as the liver model cells. Our goal was to aid the selection of cell lines for nanomaterial toxicity studies by comparing the toxicity test results and confirming differences in modes of cell death caused by SiO2 NPs using different target organ cell lines.

2. Materials and Methods

2.1. Materials and Reagents

For the experiments, we used 20 nm SiO2 NPs, which are certified reference materials (CRM, 301-01-002) produced by the Korea Research Institute of Standards and Science (Daejeon, Korea). Cadmium sulfate (CdSO4, #383082) and stauroporine (STS, #S5921) were purchased from Sigma-Aldrich (St. Louis, MO, USA).

2.2. Preparation and Characterization of SiO2 NPs

The SiO2 NPs were dispersed in deionized water or the Dulbecco’s modified Eagle medium (DMEM; #LM001-05, Welgene, Gyeongsan, South Korea) via vortexing for 1 min. The morphology and size of the primary SiO2 NPs were analyzed using transmission electron microscopy (TEM; JEM-ARM200F, JEOL Ltd., Tokyo, Japan) and scanning electron microscopy (SEM; Gemini SEM 500, Carl Zeiss, Oberkochen, Germany). The size distribution of the SiO2 NPs was measured using dynamic light scattering (DLS; Nano ZS90, Malvern Panalytical, Worcestershire, UK) and scanning mobility particle sizer (SMPS; TSI Incorporated, Shoreview, MN, USA). The zeta-potential was measured using the Zetasizer instrument (Nano ZS90, Malvern, UK).

2.3. Cell Culture

A549 and HepG2 cells, purchased from the American Type Culture Collection (Manassas, VA, USA), were cultured in DMEM supplemented with 10% fetal bovine serum (FBS; #SH30084.03, HyClone™, Marlborough, MA, USA) and 1% penicillin-streptomycin (#LS202-02, Welgene™). NHBE cells were purchased from Lonza™ (Alps, Switzerland). These cells were cultured in bronchial epithelial cell growth basal medium (#CC-3171, Lonza™) containing a supplement pack (#CC-4175, Lonza™). HH cells purchased from ScienCell™ (Carlsbad, CA, USA) were cultured in hepatocyte medium (#5201, ScienCell™) containing 5% FBS (#0025, ScienCell™), 1% penicillin-streptomycin (#0503, ScienCell™), and hepatocyte growth supplement (#5252, ScienCell™). All cells were incubated at 37 °C in a humidified atmosphere containing 5% CO2. All cells were expanded after passage number three and then frozen in liquid nitrogen. After thawing, cells having passage numbers between 4 and 7 were used for the toxicity test.

2.4. Cytotoxicity Assay and Statistical Analysis

All cells were seeded at a density of 1.0 × 10⁴ cells/well onto a 96-well plate (#3596, Corning®, Glendale, AZ, USA) and incubated for 24 h. After washing the cells with phosphate-buffered saline (PBS; LB001-02, Welgene™), they were treated with the prepared SiO2 NPs, dispersed in serum-free DMEM, for 4 h. Cytotoxicity was quantified using MTS assay (CellTiter96® AQueous One Solution Cell Proliferation Assay kit, Promega, Madison, WI, USA) according to the manufacturer’s instructions. The 96-well plates were then incubated at 37 °C in a humidified atmosphere containing 5% CO2 for 1 h. Cell viability was calculated using Equation (1). IC50 values of the NPs were calculated using the SoftMax Pro software (Molecular Devices, San Jose, CA, USA).
Cell   viability   %   = Absorbance   value   of   test   cells Absorvance   value   of   control   cells × 100
The results of all experiments were statistically analyzed using GraphPad Prism software (version 7.0; GraphPad Software Inc., San Diego, CA, USA) and represented as the mean and standard error of independent experiments (n = 12). The normality of the data was assessed using the Kolmogorov–Smirnov test, and equal variance using Bartlett’s test. For normally distributed data, statistical differences were determined using variance analysis followed by Bonferroni’s multiple comparison test; else, the Kruskal–Wallis test was performed, followed by Dunn’s test.

2.5. Investigation of Cell Death Mode

An Annexin V–Fluorescein Isothiocyanate (FITC) Apoptosis Detection kit (#130-092-052, Miltenyi Biotec, Bergisch Gladbach, Germany) was used to determine apoptosis according to the manufacturer’s instructions. Using this kit, we washed the cells twice with 1 × binding buffer and then resuspended in 100 µL of 1 × binding buffer per 1.0 × 10⁶ cells. Next, the cells were incubated with 10 μL of Annexin V-FITC in the dark at room temperature for 15 min and washed with 1 mL of 1 × binding buffer. Thereafter, the cells were stained with propidium iodide (PI), before resuspending in 500 µL of 1 × binding buffer per 1.0 × 10⁶ cells. We added 5 μL of PI solution prior to analysis by fluorescence microscopy or flow cytometry. Fluorescence microscopy was performed using a confocal laser scanning microscope (Olympus, Tokyo, Japan), and flow cytometry was performed using Eclipse™ (Sony Biotechnology, San Jose, CA, USA).

2.6. Visualization of FITC-Labeled 20 nm SiO2 NPs Using Fluorescence Microscopy

Cells (5.0 × 10⁴ cells/well), seeded on a coverslip and incubated for 48 h, were treated with FITC-labeled 20 nm SiO2 NPs for 4 h and fixed with 4% paraformaldehyde for 20 min. Next, the cells were washed twice with PBS and observed using fluorescence microscopy (Leica Microsystems, Wetzlar, Germany).

2.7. FITC-Labeled 20 nm SiO2 NPs Uptake Analysis Using Flow Cytometry

For uptake analysis, cells (2.5 × 10⁵ cells/well) were first seeded on 6 well plates and incubated. The next day, FITC-labeled 20 nm SiO2 NPs were co-cultured with the cells for 4 h. The cells were washed twice with PBS and analyzed using flow cytometry. The live single-cell population was gated in a plot of FSC versus SSC after excluding cell FITC-negative cell population was gated in a plot of FSC versus FITC in the untreated sample. In all samples, the percentage of FITC-positive cells in a single-cell population decided the intracellular localization of FITC-SiO2 NPs.

3. Results

3.1. Characterization of SiO2 NPs

For characterization of SiO2 NPs in deionized water, their morphology and size were investigated using electron microscopy. SiO2 NPs exhibit uniform spherical morphology and size distribution in SEM (Figure 1a) and TEM (Figure 1b) images. DLS (Figure 1c) and SMPS (Figure 1d) determined the hydrodynamic sizes of SiO2 NPs, which were 19.2 and 21.7 nm, respectively. Since NPs can have significant variations in size distribution in biological environments, we compared SiO2 NPs in deionized water and serum-free DMEM. Unexpectedly, z-average and polydispersity index are similar in the two dispersions (Figure 1e). In addition, the zeta-potential show negative charges in both conditions (Figure 1e). These results indicate that SiO2 NPs are monodispersed without aggregation.

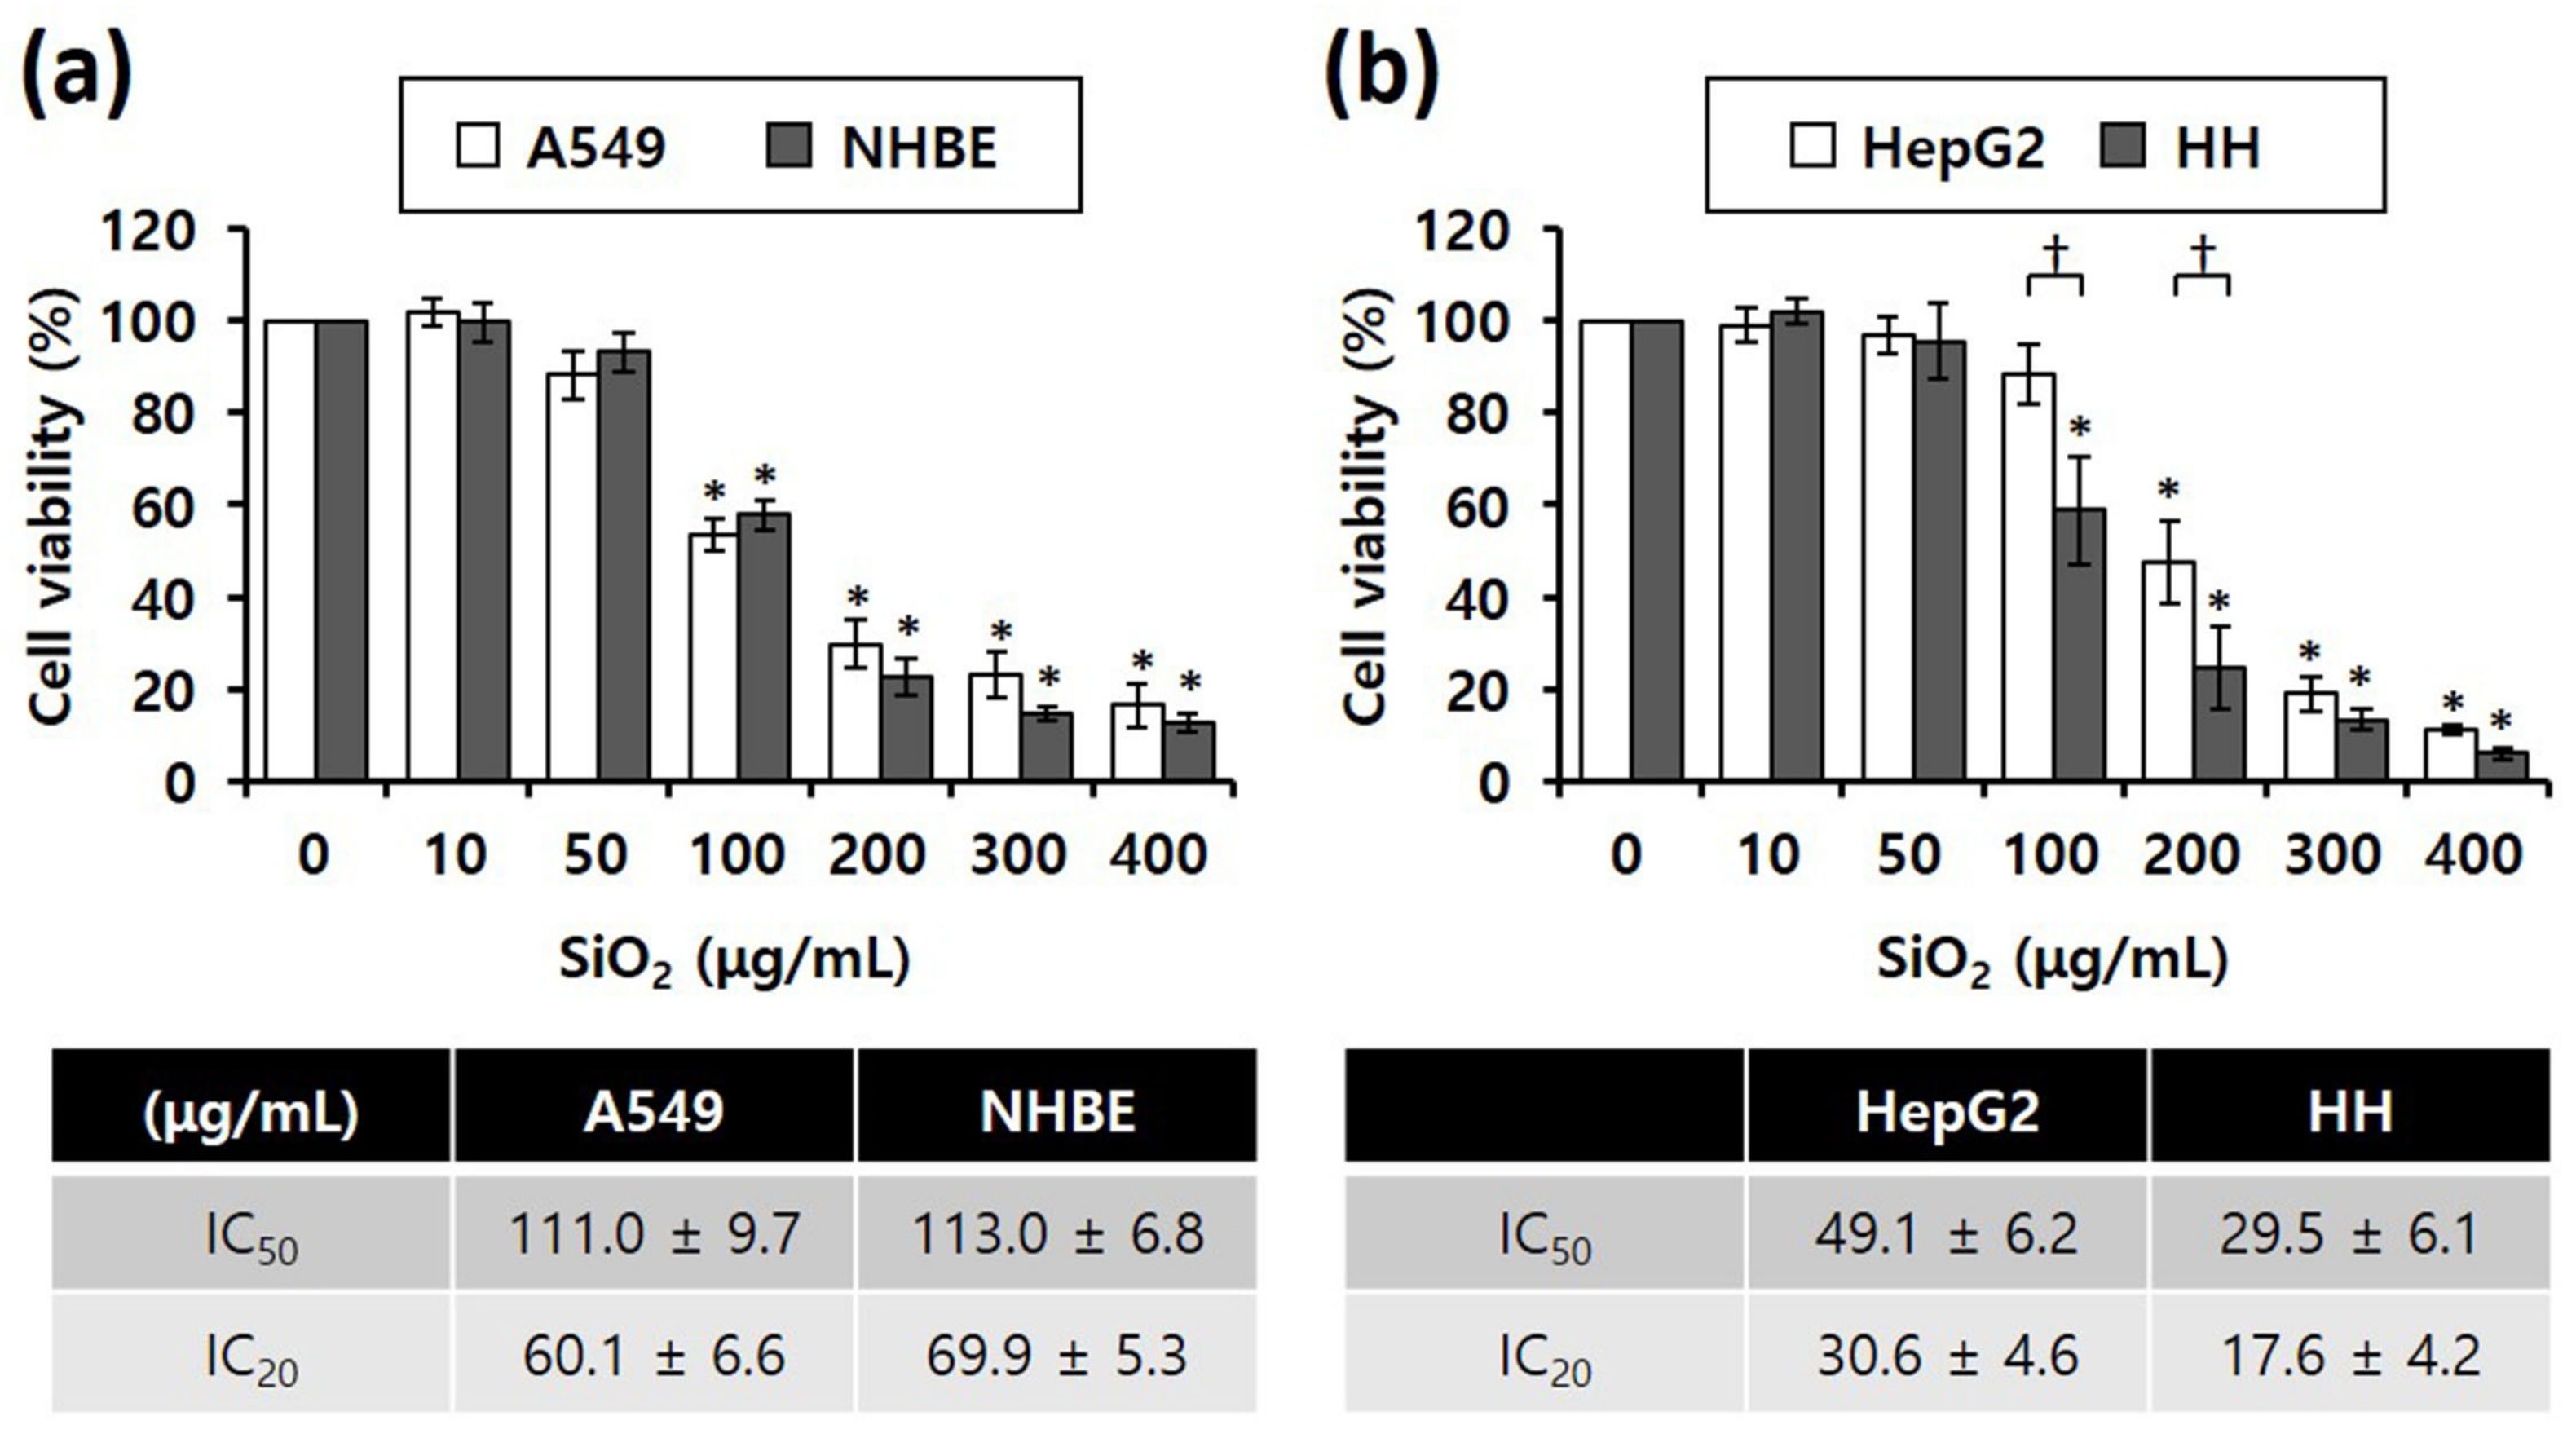
3.2. Cytotoxicity of SiO2 NPs

Our study compared SiO2 NPs toxicity between cancer (A549 and HepG2) and normal cell lines (NHBE and HH), MTS assay results revealed that the viability of all four cell lines significantly decreased depending on the concentration of SiO2 NPs in the cells (Figure 2). Notably, IC50 values of SiO2 NPs were almost similar between the lung-derived A549 and NHBE cells (Figure 2a), suggesting that there was no difference in toxicity caused by SiO2 NPs between the two cell lines. However, in the liver-derived cell lines, the IC50 values of SiO2 NPs in normal HH cells were approximately 1.5-fold higher than that in HepG2 cells, suggesting that the higher sensitivity of HH cells to SiO2 NPs was higher than that of HepG2 cells (Figure 2b).

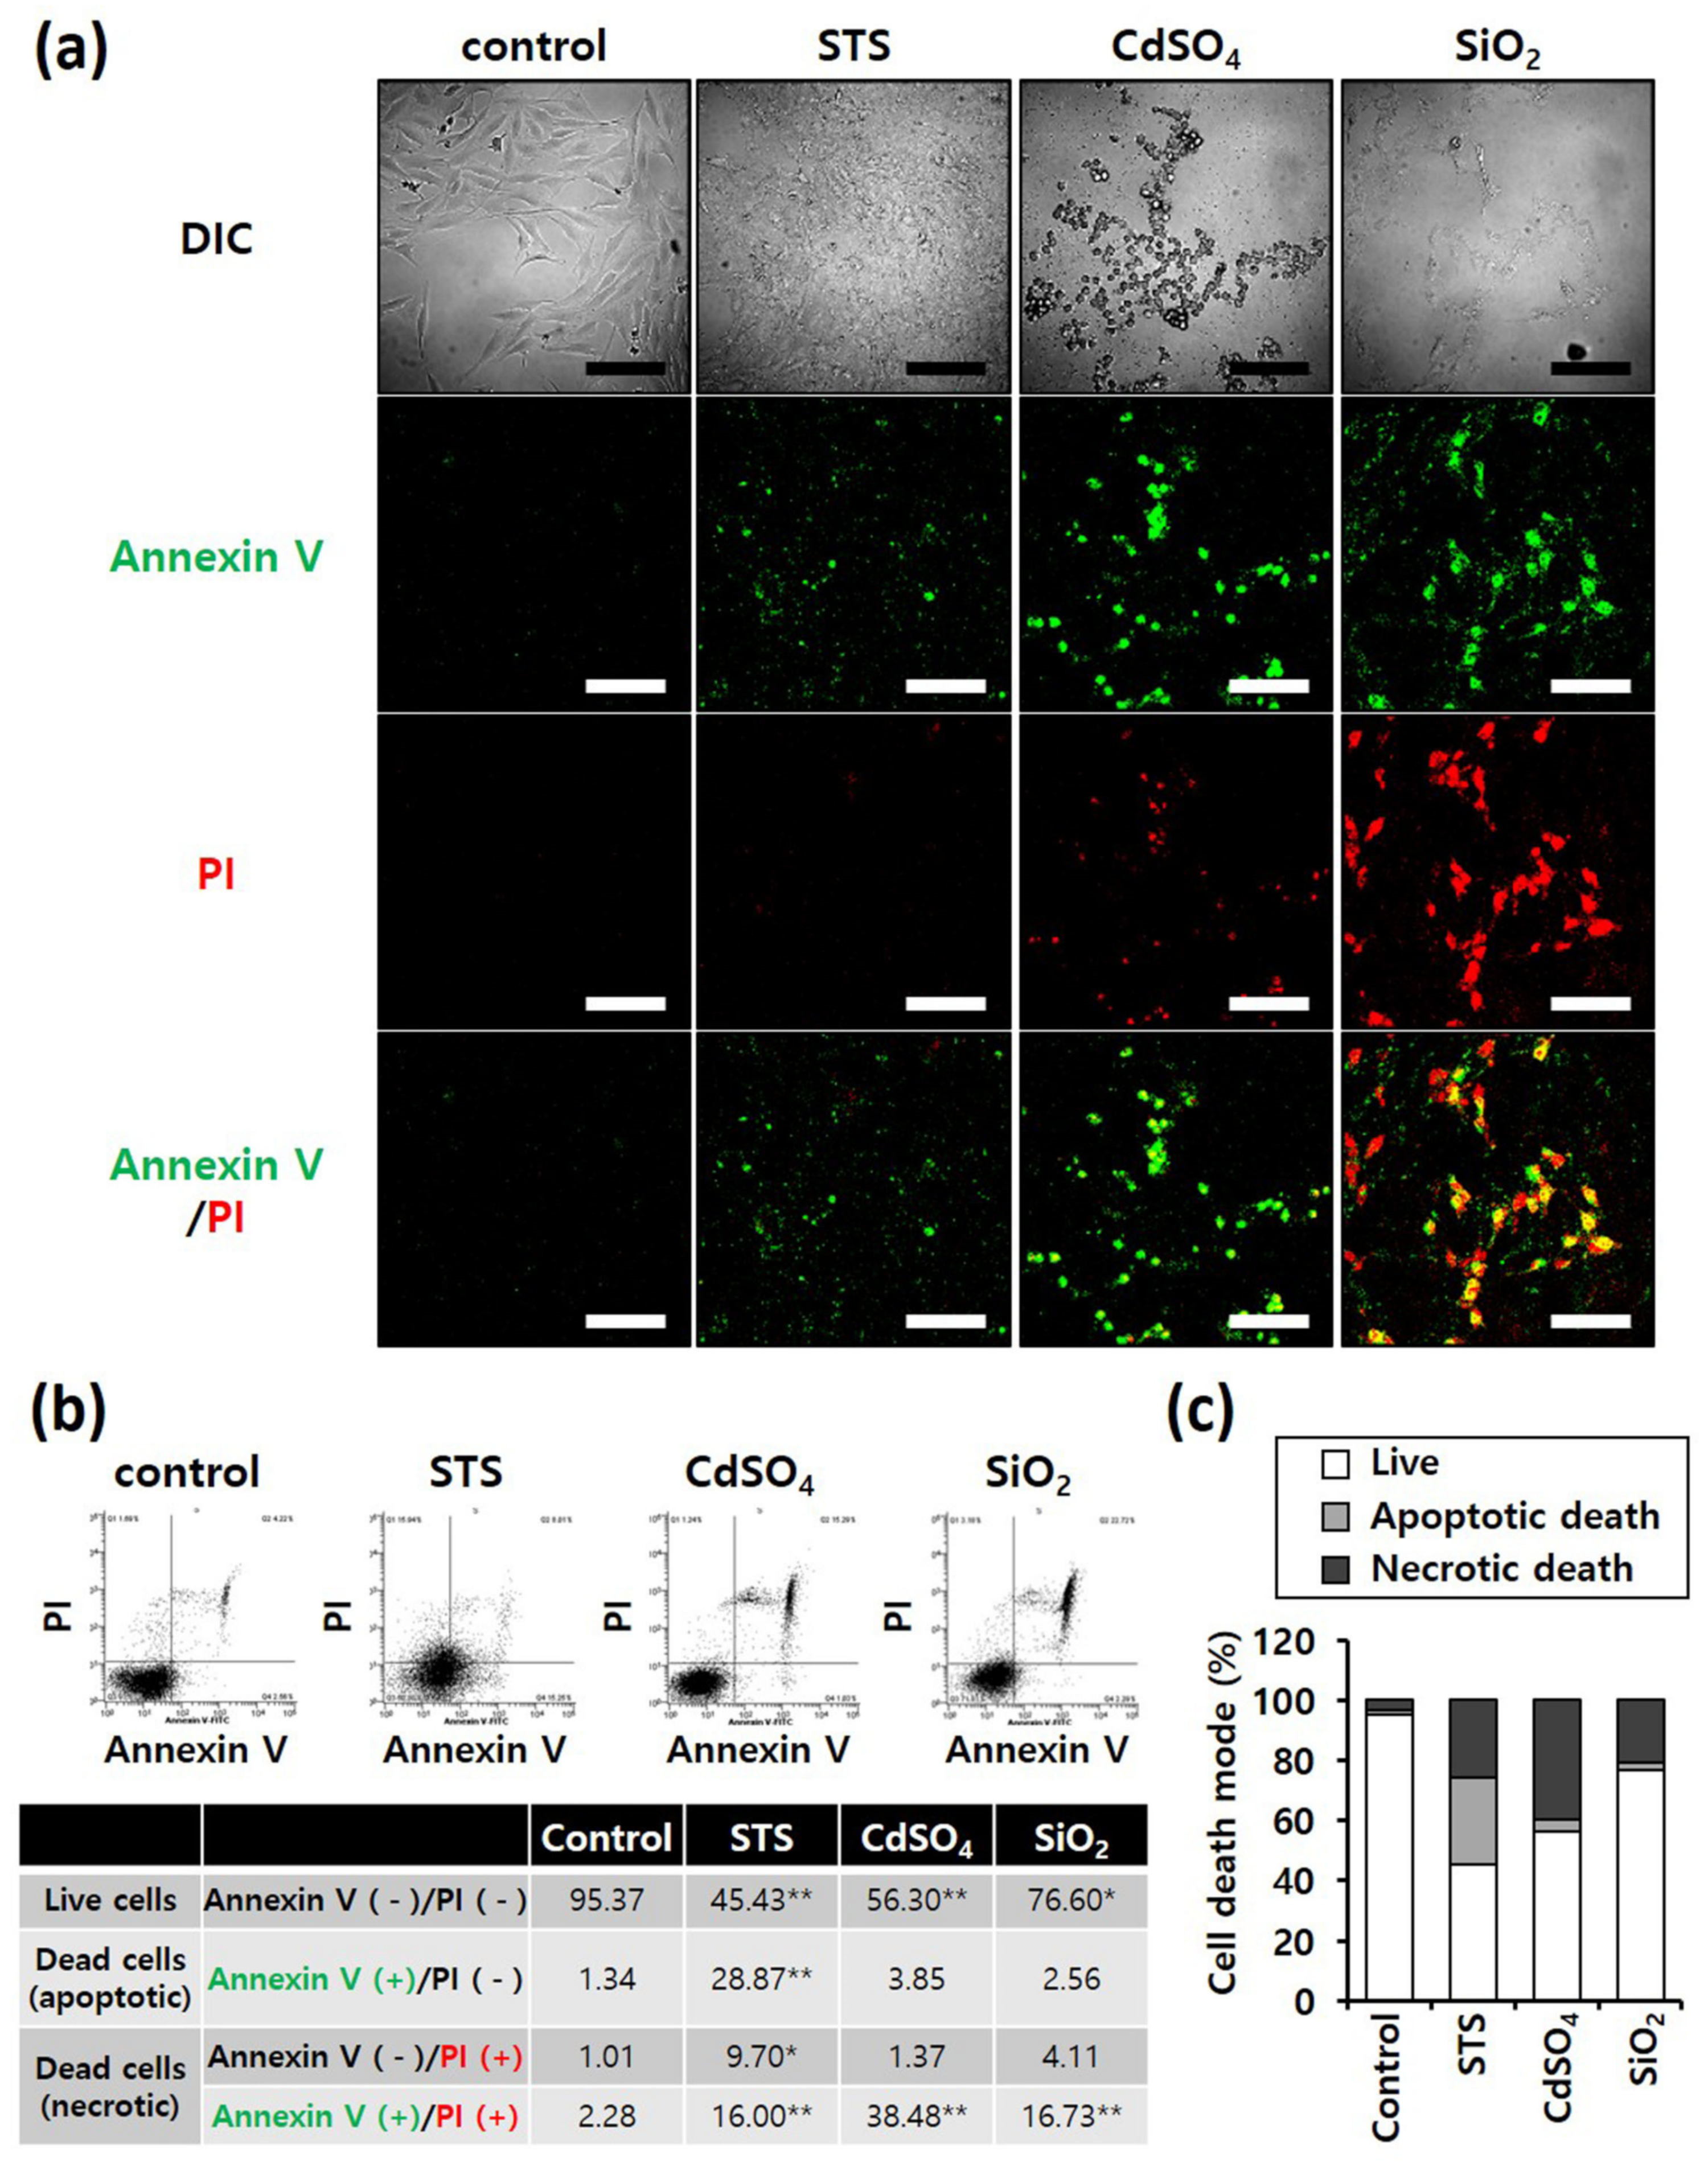
3.3. Cell Death Mode

Annexin V/PI staining was performed to determine differences in the mode of death caused by SiO2 NPs between cancer and normal cells. STS was used as a positive control for apoptosis, and CdSO4 for necrosis. In distinguishing the mode of cell death, Annexin V(+)/PI(−) cell populations were considered apoptotic, while Annexin V(−)/PI(+) or Annexin V(+)/PI(+) cell populations were considered necrotic. Fluorescence microscopy shows that the STS treatment increased green fluorescence intensity, while CdSO4 treatment increased green and red fluorescence intensities in the lung-derived cell lines, A549 and NHBE (Figure 3a,d). Green and red fluorescence intensities were also significantly increased by SiO2 NP treatment. Next, the mode of cell death was analyzed by sorting cells according to fluorescence using flow cytometry. STS primarily induced apoptosis, while CdSO4 and SiO2 NPs induced necrosis in A549 cells (Figure 3b,c). In NHBE cells, STS induced a mixture of apoptosis and necrosis, while CdSO4 primarily induced necrosis. SiO2 NPs induced necrosis in NHBE cells (Figure 3e,f). These results suggest that the mode of death induced by SiO2 NPs was similar in A549 and NHBE cells. Similar to the lung-derived cell lines, STS treatment increased green fluorescence intensity, while CdSO4 and SiO2 NPs increased green/red fluorescence intensity in HepG2 and HH cell lines (Figure 4a,d). Flow cytometry analysis revealed that STS induced both apoptosis and necrosis, while CdSO4 mostly induced necrosis (Figure 4b,c,e,f). In contrast, SiO2 NP treatment mostly induced necrosis in HepG2 cells and apoptosis and necrosis in HH cells (Figure 4b,c,e,f). These results suggest that the mode of death induced by SiO2 NPs in HepG2 and HH cells differ partially.

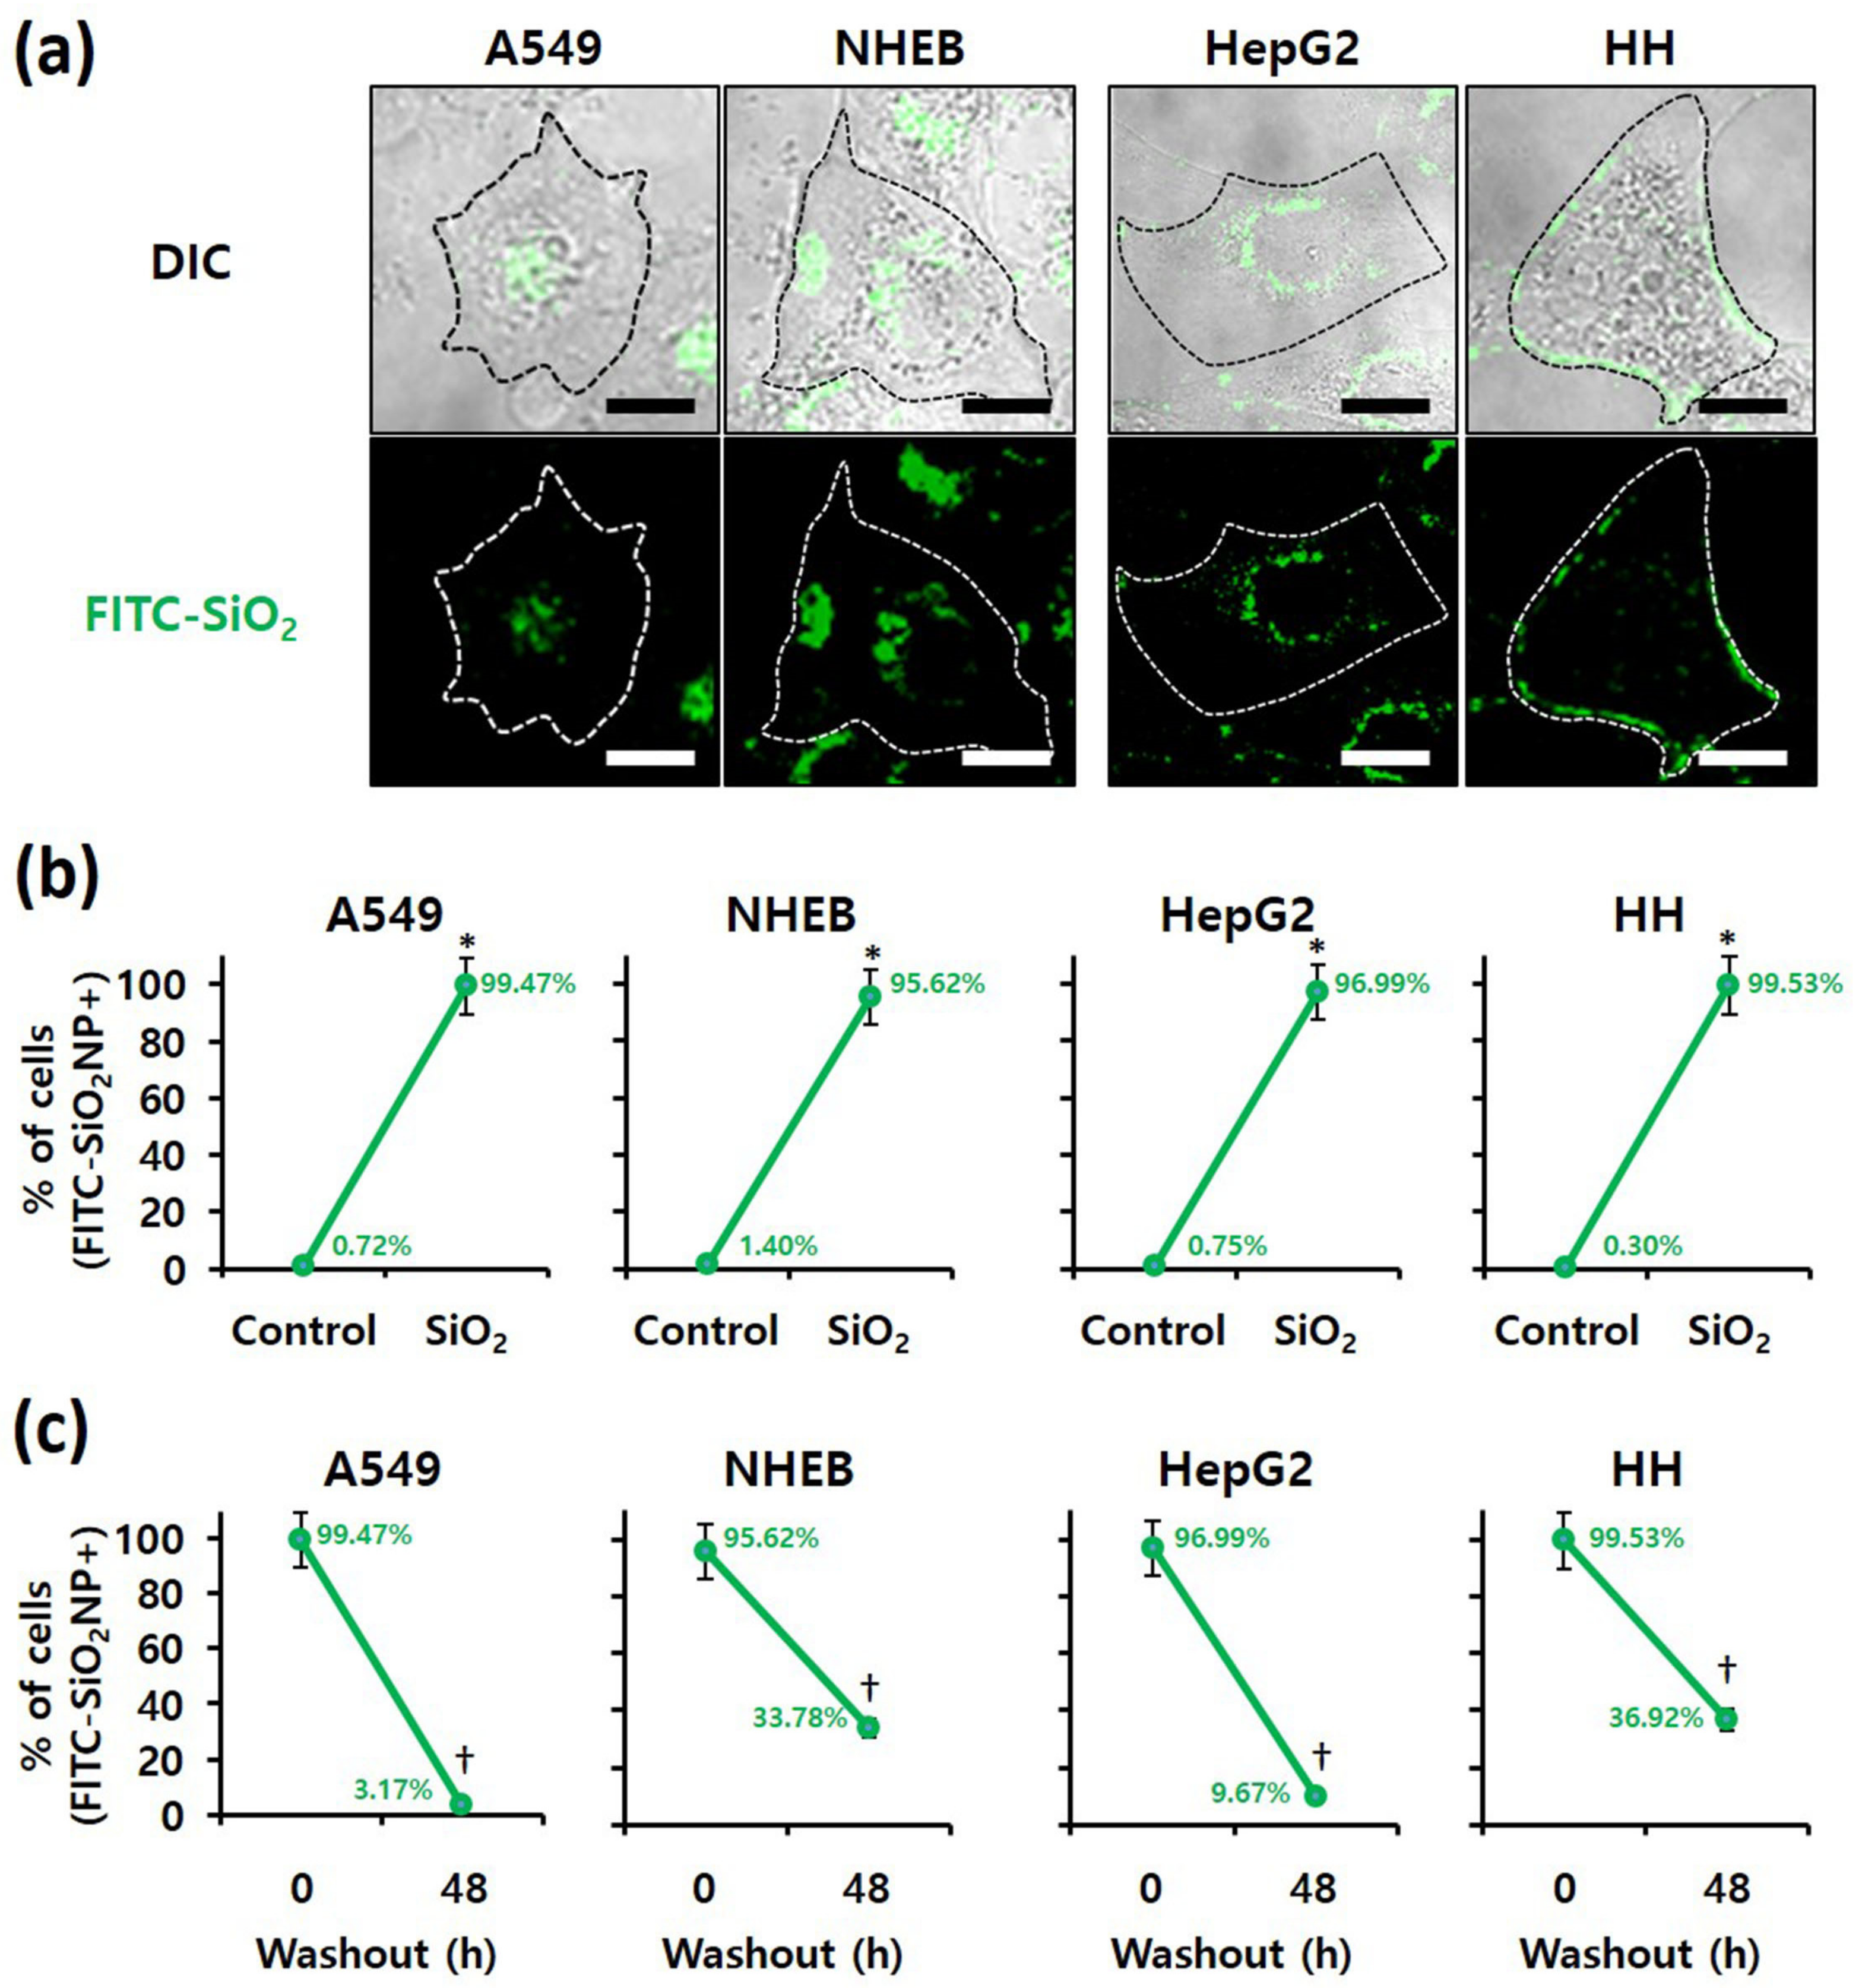
3.4. Examination of SiO2 NPs Retention in Cells

Because intracellular nanomaterials can majorly cause cytotoxicity, the intracellular accumulation of SiO2 NPs was confirmed. First, confocal microscopy revealed FITC-labeled SiO2 NPs in the four cell lines when treated with these NPs (Figure 5a). In addition, the proportion of cells containing FITC-labeled SiO2 NPs, determined by flow cytometry, revealed that more than 95% of all A549, NHBE, HepG2, and HH cells contained FITC-labeled SiO2 NPs (Figure 5b). We conclude that SiO2 NPs were internalized in the four cell lines without difficulty. For analysis of residual NPs, the culture medium was changed after 4 h of FITC-labeled SiO2 NP treatment (Figure 5c). The number of cells containing FITC-labeled SiO2 NPs was counted using flow cytometry at 0 and 48 h after treatment. After 48 h of treatment, FITC-labeled SiO2 NPs were less than 10% in A549 and HepG2 cancer cells and more than 30% in NHBE and HH normal cells. Thus, the removal rate of NPs from cancer cells was markedly faster than that from normal cells. Therefore, regardless of their origin, cancer and normal cells differ.

4. Discussion

When screening NPs, selecting the appropriate cell type is critical. Primary cells have several disadvantages, such as limited lifespan, specific culture conditions, and batch-to-batch differences [23,24]. It has been shown that NP-induced effects can vary according to species, tissue, and cell line in many groups. Therefore, cancer cell lines are used as a universal model in nanosafety evaluation. However, uncertainty can be introduced depending on the cell line type and characteristics when generalizing data [25,26,27,28]. A few studies have compared normal and cancer cells in the same species and tissue. Ekstrand-Hammarstrom and colleagues compared the cellular uptake and response of TiO2 NPs to NHBE (primary), BEAS-2B (human bronchial epithelial cell line, immortalized), and A549 (cancerous). NHBE, BEAS-2B, and A549 cells had similar cell viability and oxidative stress induction, but different proinflammatory responses [29]. Kermanizadeh and co-workers showed similar cellular responses to ZnO, MWCNT, Ag, and TiO2 NPs in primary human hepatocytes (normal) and C3A cell lines (clonal derivative of HepG2, hepatocellular carcinoma) [30].
This study is the first to compare the cytotoxic effects and cellular localization of SiO2 NPs in cancer cells (lung-A549, liver-HepG2) and corresponding primary human cells (lung-NHBE, liver-HH). While lung-origin cells had similar sensitivity to SiO2 NPs (Figure 2 and Figure 3), hepatic-origin had higher HH sensitivity to SiO2 NPs than HepG2 (Figure 2 and Figure 4). In addition, we confirmed that the degree of intracellular accumulation of SiO2 NPs was similar in the four cell types (Figure 5). Therefore, we infer no difficulty using cancer cells for short-term cytotoxicity screening of NPs, while probably abandoning the notion of representing all cells.
We showed that the clearance of intracellular SiO2 NPs was much faster in cancer cells (Figure 5c). The pathway of eliminating intracellular NPs compared to the cellular uptake mechanism is less well known. Intracellular NP concentration can be reduced through (1) apoptosis, (2) cell proliferation, (3) NP diffusion, (4) lysosomal degradation, and (5) exocytosis [31]. Since intracellular NPs fail to reach sufficient concentrations to cause cell death, cell death or proliferation need not be the main mechanism for cellular excretion of NPs [31]. Because cancer cells have a significantly higher proliferation rate than normal cells, the intracellular particle concentration is reduced more efficiently in our study. In addition, the difference in the ability of lysosomes between normal and cancer cells may affect the SiO2 NP removal rate. Lysosomes remove intracellular NPs through direct degradation [32,33] and exocytosis [34,35,36,37,38,39]. Many researchers argue that lysosomal stability is necessary to clear intracellular NP [34,35,36,40]. During transformation into malignancy, cancer cells have enhanced lysosomal functions, such as biosynthesis, hydrolase activity, and exocytosis, to obtain substances necessary for assimilation and catabolism [41]. Therefore, we suggest that cancer cells with improved lysosomal function can reduce the intracellular particle concentration more efficiently than normal cells. In addition, cell viability and response between normal and cancer cells may differ upon long-term exposure to low SiO2 NP concentration because the accumulated NPs can destroy organelles such as lysosomes and reach the cytoplasm.
Many studies on the toxic effects of SiNPs have been performed using in vivo models. However, awareness of interspecies differences [42,43,44] and restrictions on animal ethics [EU-Directive 2010/63] drive interest in developing human-based in vitro models. Despite their drawbacks in representing effects on humans or tissues due to their simplicity, they can be a valuable source in evaluating toxicity and mechanical data for drugs, chemicals, and NPs. Therefore, finding a cell line that is more similar to the tissue of origin is important in developing a standardized protocol for nanosafety evaluation. Although the current study cannot represent all cells, it provides a rationale for using cancer cells for short-term nanosafety screening. More research is needed for more accurate results on clinical trials, which requires data accumulation.

5. Conclusions

This study determines the possibility of using cancer cells instead of normal cells to evaluate the safety of nanomaterials in vitro. Viability, mode of death, and intracellular compound accumulation were compared between cancer and normal cells after treating them with SiO2 NPs. The results suggested that cancer cells can be used to investigate the above parameters, having short evaluation periods. However, long-term evaluations, such as recovery after exposure to NPs, may differ between cancer and normal cells. In conclusion, the standardization of nanomaterial safety evaluation is required in future studies because the effect of NPs may vary depending on the origin of the test cells.

Author Contributions

Conceptualization, I.Y.K. and M.B.H.; Methodology, M.K., J.K. and M.B.H.; Validation, M.B.H.; Data curation, I.Y.K.; Writing—original draft preparation, I.Y.K. and M.B.H.; Writing—review and editing, I.Y.K.; Project administration, M.B.H.; Funding acquisition, T.G.L. and M.B.H. All authors have read and agreed to the published version of the manuscript.

Funding

This research was supported by the Nano Material Technology Development Program [grant number 2016M3A7B6908929, 2021M3C1C3097638] of the National Research Foundation (NRF) of Korea, funded by the Ministry of Science and ICT (MSIT); Development of Measurement Standards and Technology for Biomaterials and Medical Convergence, funded by the Korea Research Institute of Standards and Science [KRISS–2022–GP2022-0006]; and the Industrial Strategic Technology Development Program [20009773, Commercialization of 3D Multifunction Tissue Mimetics Based Drug Evaluation Platform], funded by the Ministry of Trade, Industry & Energy (MOTIE, Korea).

Institutional Review Board Statement

Not applicable.

Informed Consent Statement

Not applicable.

Data Availability Statement

The data presented in this study are available on request from the corresponding author.

Conflicts of Interest

The authors declare no conflict of interest.

References

  1. Fytianos, G.; Rahdar, A.; Kyzas, G.Z. Nanomaterials in Cosmetics: Recent Updates. Nanomaterials 2020, 10, 979–995. [Google Scholar] [CrossRef]
  2. Raj, S.; Jose, S.; Sumod, U.S.; Sabitha, M. Nanotechnology in Cosmetics: Opportunities and Challenges. J. Pharm. Bioallied Sci. 2012, 4, 186–193. [Google Scholar] [CrossRef] [PubMed]
  3. Nasir, A.; Wang, S.; Friedman, A. The Emerging Role of Nanotechnology in Sunscreens: An Update. Expert Rev. Dermatol. 2011, 6, 437–439. [Google Scholar] [CrossRef]
  4. Chaudhary, P.; Fatima, F.; Kumar, A. Relevance of Nanomaterials in Food Packaging and Its Advanced Future Prospects. J. Inorg. Organomet. Polym. Mater. 2020, 30, 5180–5192. [Google Scholar] [CrossRef] [PubMed]
  5. Uddin, I.; Venkatachalam, S.; Mukhopadhyay, A.; Usmani, M.A. Nanomaterials in the Pharmaceuticals: Occurrence, Behaviour and Applications. Curr. Pharm. Des. 2016, 22, 1472–1484. [Google Scholar] [CrossRef] [PubMed]
  6. Sharifi, S.; Behzadi, S.; Laurent, S.; Forrest, M.L.; Stroeve, P.; Mahmoudi, M. Toxicity of Nanomaterials. Chem. Soc. Rev. 2012, 41, 2323–2343. [Google Scholar] [CrossRef] [PubMed]
  7. Sukhanova, A.; Bozrova, S.; Sokolov, P.; Berestovoy, M.; Karaulov, A.; Nabiev, I. Dependence of Nanoparticle Toxicity on Their Physical and Chemical Properties. Nanoscale Res. Lett. 2018, 13, 44. [Google Scholar] [CrossRef] [PubMed] [Green Version]
  8. Hassanpour, P.; Panahi, Y.; Ebrahimi-Kalan, A.; Akbarzadeh, A.; Davaran, S.; Nasibova, A.N.; Khalilov, R.; Kavetskyy, T. Biomedical Applications of Aluminium Oxide Nanoparticles. Micro Nano Lett. 2018, 13, 1227–1231. [Google Scholar] [CrossRef]
  9. Liu, Y.; Li, H.; Xiao, K. Distribution and biological effects of nanoparticles in the reproductive system. Curr. Drug Metab. 2016, 17, 478–496. [Google Scholar] [CrossRef]
  10. Bitar, A.; Ahmad, N.M.; Fessi, H.; Elaissari, A. Silica-based nanoparticles for biomedical applications. Drug Discov. Today 2012, 17, 1147–1154. [Google Scholar] [CrossRef]
  11. Tang, L.; Cheng, J.J. Nanoporous silica nanoparticle for nanomedicine application. Nano Today 2013, 8, 290–312. [Google Scholar] [CrossRef] [PubMed] [Green Version]
  12. McAuliffe, M.E.; Perry, M.J. Are nanoparticles potential male reproductive toxicants? A literature review. Nanotoxicology 2007, 1, 204–210. [Google Scholar] [CrossRef]
  13. Wang, R.; Song, B.; Wu, J.; Zhang, Y.; Chen, A.; Shao, L. Potential adverse effects of nanoparticles on the reproductive system. Int. J. Nanomed. 2018, 13, 8487. [Google Scholar] [CrossRef] [PubMed] [Green Version]
  14. Valic, M.S.; Zheng, G. Research Tools for Extrapolating the Disposition and Pharmacokinetics of Nanomaterials from Preclinical Animals to Humans. Theranostics 2019, 9, 3365–3387. [Google Scholar] [CrossRef]
  15. Bahadar, H.; Maqbool, F.; Niaz, K.; Abdollahi, M. Toxicity of Nanoparticles and an Overview of Current Experimental Models. Iran. Biomed. J. 2016, 20, 1–11. [Google Scholar] [CrossRef]
  16. Kim, I.Y.; Lee, T.G.; Reipa, V.; Heo, M.B. Titanium Dioxide Induces Apoptosis Under UVA Irradiation via the Generation of Lysosomal Membrane Permeabilization-Dependent Reactive Oxygen Species in HaCat Cells. Nanomaterials 2021, 11, 1943. [Google Scholar] [CrossRef]
  17. Feitelson, M.A.; Arzumanyan, A.; Kulathinal, R.J.; Blain, S.W.; Holcombe, R.F.; Mahajna, J.; Marino, M.; Martinez-Chantar, M.L.; Nawroth, R.; Sanchez-Garcia, I.; et al. Sustained Proliferation in Cancer: Mechanisms and Novel Therapeutic Targets. Semin. Cancer Biol. 2015, 35, S25–S54. [Google Scholar] [CrossRef]
  18. San-Millán, I.; Brooks, G.A. Reexamining Cancer Metabolism: Lactate Production for Carcinogenesis Could Be the Purpose and Explanation of the Warburg Effect. Carcinogenesis 2017, 38, 119–133. [Google Scholar] [CrossRef]
  19. Granchi, C.; Minutolo, F. Anti-Cancer Agents Counteracting Tumor Glycolysis. ChemMedChem 2012, 7, 1318–1350. [Google Scholar] [CrossRef] [Green Version]
  20. Stefano, D.D.; Carnuccio, R.; Maiuri, M.C. Nanomaterials Toxicity and Cell Death Modalities. J. Drug Deliv. 2012, 2012, 1–14. [Google Scholar] [CrossRef] [Green Version]
  21. Yildirimer, L.; Thanh, N.T.K.; Loizidou, M.; Seifalian, A.M. Toxicology and Clinical Potential of Nanoparticles. Nano Today. 2011, 6, 585–607. [Google Scholar] [CrossRef] [Green Version]
  22. Barabadi, H.; Alizadeh, A.; Ovais, M.; Ahmadi, A.; Shinwari, Z.K.; Saravanan, M. Efficacy of Green Nanoparticles Against Cancerous and Normal Cell Lines: A Systematic Review and Meta-Analysis. IET Nanobiotechnol. 2018, 12, 377–391. [Google Scholar] [CrossRef]
  23. Joris, F.; Manshian, B.B.; Peynshaert, K.; de Smedt, S.C.; Braeckmans, K.; Soenen, S.J. Assessing nanoparticle toxicity in cell-based assays: Influence of cell culture parameters and optimized models for bridging the in vitro-in vivo gap. Chem. Soc. Rev. 2013, 42, 8339–8359. [Google Scholar] [CrossRef] [Green Version]
  24. Kermanizadeh, A.; Lohr, M.; Roursgaard, M.; Messner, S.; Gunness, P.; Kelm, J.M.; Moller, P.; Stone, V.; Loft, S. Hepatic toxicology following single and multiple exposure of engineered nanomaterials utilizing a novel primary human 3D liver microtissue model. Part Fibre Toxicol. 2014, 11, 56. [Google Scholar] [CrossRef] [Green Version]
  25. Zhang, H.; Wang, X.; Wang, M.; Li, L.; Chang, C.H.; Ji, Z.; Xia, T.; Nel, A.E. Mammalian cells exhibit a range of sensitivities to silver nanoparticles that are partially explicable by variations in antioxidant defense and metallothionein expression. Small 2015, 11, 3797–3805. [Google Scholar] [CrossRef] [Green Version]
  26. Luengo, Y.; Nardecchia, S.; Morales, M.P.; Serrano, M.C. Different cell responses induced by exposure to maghemite nanoparticles. Nanoscale 2013, 5, 11428–11437. [Google Scholar] [CrossRef] [Green Version]
  27. Mukherjee, S.G.; O’Claonadh, N.; Casey, A.; Chambers, G. Comparative in vitro cytotoxicity study of silver nanoparticle on two mammalian cell lines. Toxicol. In Vitro 2012, 26, 238–251. [Google Scholar] [CrossRef] [Green Version]
  28. Wang, Y.; Aker, W.G.; Hwang, H.M.; Yedjou, C.G.; Yu, H.; Tchounwou, P.B. A study of the mechanism of in vitro cytotoxicity of metal oxide nanoparticles using catfish primary hepatocytes and human HepG2 cells. Sci. Total Environ. 2011, 409, 4753–4762. [Google Scholar] [CrossRef] [Green Version]
  29. Ekstrand-Hammarstrom, B.; Akfur, C.M.; Andersson, P.O.; Lejon, C.; Osterlund, L.; Bucht, A. Human primary bronchial epithelial cells respond differently to titanium dioxide nanoparticles than the lung epithelial cell lines A549 and BEAS-2B. Nanotoxicology 2012, 6, 623–634. [Google Scholar] [CrossRef]
  30. Kermanizadeh, A.; Gaiser, B.K.; Ward, M.B.; Stone, V. Primary human hepatocytes versus hepatic cell line: Assessing their suitability for in vitro nanotoxicology. Nanotoxicology 2013, 7, 1255–1271. [Google Scholar] [CrossRef]
  31. Frohlich, E. Cellular elimination of nanoparticles. Environ. Toxicol. Pharmacol. 2016, 46, 90–94. [Google Scholar] [CrossRef] [PubMed]
  32. Laskar, A.; Ghosh, M.; Khattak, S.I.; Li, W.; Yuan, X.M. Degradation of superparamagnetic iron oxide nanoparticle-induced ferritin by lysosomal cathepsins and related immune response. Nanomedicine 2012, 7, 705–717. [Google Scholar] [CrossRef] [PubMed]
  33. Lunov, O.; Syrovets, T.; Rocker, C.; Tron, K.; Nienhaus, G.U.; Rasche, V.; Mailander, V.; Landfester, K.; Simmet, T. Lysosomal degradation of the carboxydextran shell of coated superparamagnetic iron oxide nanoparticles and the fate of professional phagocytes. Biomaterials 2010, 31, 9015–9022. [Google Scholar] [CrossRef] [PubMed]
  34. Chithrani, B.D.; Chan, W.C. Elucidating the mechanism of cellular uptake and removal of protein-coated gold nanoparticles of different sizes and shapes. Nano Lett. 2007, 7, 1542–1550. [Google Scholar] [CrossRef] [PubMed]
  35. Chu, Z.; Huang, Y.; Tao, Q.; Li, Q. Cellular uptake, evolution, and excretion of silica nanoparticles in human cells. Nanoscale 2011, 3, 3291–3299. [Google Scholar] [CrossRef]
  36. Fang, C.Y.; Vaijayanthimala, V.; Cheng, C.A.; Yeh, S.H.; Chang, C.F.; Li, C.L.; Chang, H.C. The exocytosis of fluorescent nanodiamond and its use as a long-term cell tracker. Small 2011, 7, 3363–3370. [Google Scholar] [CrossRef]
  37. Jiang, X.; Rocker, C.; Hafner, M.; Brandholt, S.; Dorlich, R.M.; Nienhaus, G.U. Endo- and exocytosis of zwitterionic quantum dot nanoparticles by live HeLa cells. ACS Nano 2010, 4, 6787–6797. [Google Scholar] [CrossRef]
  38. Jin, H.; Heller, D.A.; Sharma, R.; Strano, M.S. Size-dependent cellular uptake and expulsion of single-walled carbon nanotubes: Single particle tracking and a generic uptake model for nanoparticles. ACS Nano 2009, 3, 149–158. [Google Scholar] [CrossRef] [PubMed]
  39. Serda, R.E.; Mack, A.; van de Ven, A.L.; Ferrati, S.; Dunner, K., Jr.; Godin, B.; Chiappini, C.; Landry, M.; Brousseau, L.; Liu, X.; et al. Logic-embedded vectors for intracellular partitioning, endosomal escape, and exocytosis of nanoparticles. Small 2010, 6, 2691–2700. [Google Scholar] [CrossRef] [Green Version]
  40. Yanes, R.E.; Tarn, D.; Hwang, A.A.; Ferris, D.P.; Sherman, S.P.; Thomas, C.R.; Lu, J.; Pyle, A.D.; Zink, J.I.; Tamanoi, F. Involvement of lysosomal exocytosis in the excretion of mesoporous silica nanoparticles and enhancement of the drug delivery effect by exocytosis inhibition. Small 2013, 9, 697–704. [Google Scholar] [CrossRef] [Green Version]
  41. Kallukall, T.; Olsen, O.D.; Jaatella, M. Cancer-associated lysosomal changes: Friends or foes? Oncogene 2013, 32, 1995–2004. [Google Scholar]
  42. Hartung, T. Toxicology for the twenty-first century. Nature 2009, 460, 208–212. [Google Scholar] [CrossRef]
  43. Rangarajan, A.; Hong, S.J.; Gifford, A.; Weinberg, R.A. Species- and cell type-specific requirements for cellular transformation. Cancer Cell 2004, 6, 171–183. [Google Scholar] [CrossRef] [Green Version]
  44. Yang, K.; Pfeifer, N.D.; Kock, K.; Brouwer, K.L. Species differences in hepatobiliary disposition of taurocholic acid in human and rat sandwich-cultured hepatocytes: Implications for drug-induced liver injury. J. Pharmacol. Exp. Ther. 2015, 353, 415–423. [Google Scholar] [CrossRef] [Green Version]
Figure 1. Characterization of 20 nm SiO2 NPs: (a) Scanning electron microscopy image; (b) Transmission electron microscopy image; (c) Dynamic light scattering size analysis; (d) Scanning mobility particle sizer analysis; (e) Performance comparison in deionized water and serum-free DMEM.
Nanomaterials 12 00993 g001
Figure 2. MTS cytotoxicity assay results showing the different inhibitory concentrations of 20 nm SiO2 NPs against cells subjected to NP treatment for 4 h (total number of replicates = 12); (a) Lung-derived cells. * p < 0.005, compared with untreated cells. (b) Liver-derived cells. * p < 0.005, compared with untreated cells; † p < 0.05, compared with HepG2 cells.
Nanomaterials 12 00993 g002
Figure 3. Annexin-V/PI double-staining assay of A549 and NHBE cells; After treating A549 and NHBE cells with SiO2 NPs (at IC50) and two positive controls, the cells were stained with annexin V-fluorescein isothiocyanate and propidium iodide and analyzed by fluorescence microscopy and flow cytometry. CdSO4 (1.0 mM) was used to induce necrosis, and staurosporine (STS; 1.0 μM) was used to induce apoptosis; replicate number = 3. (a,d) Confocal fluorescence microscopy images; scale bars represent 200 μm. (b,e) Flow cytometry analysis. * p < 0.05, compared with control; ** p < 0.005, compared with control. (c,f) Percentage distribution of necrotic, apoptotic, and viable cells.
Nanomaterials 12 00993 g003aNanomaterials 12 00993 g003b
Figure 4. Annexin-V/PI double-staining assay of HepG2 and HH cells; After treating HepG2 and HH cells with SiO2 NPs (at IC50) and two positive controls, the cells were stained with annexin V-fluorescein isothiocyanate and propidium iodide and analyzed by fluorescence microscopy and flow cytometry. CdSO4 (1.0 mM) was used to induce necrosis, and staurosporine (STS; 1.0 μM) was used to induce apoptosis; replicate number = 3. (a,d) Confocal fluorescence microscopy images; scale bars represent 200 μm. (b,e) Flow cytometry analysis. * p < 0.05, compared with control; ** p < 0.005, compared with control. (c,f) Percentage distribution of necrotic, apoptotic, and viable cells.
Nanomaterials 12 00993 g004aNanomaterials 12 00993 g004b
Figure 5. Examination of SiO2 NPs retention in cells; Localization of fluorescein isothiocyanate (FITC)-labeled 20 nm SiO2 NPs in each cell line, as determined by (a) confocal fluorescence microscopy (scale bars represent 10 µm) and (b) flow cytometry after 4 h of treatment. * p < 0.005, compared with control. (c) Retention of FITC-labeled 20 nm SiO2 NPs in each cell line, as determined by flow cytometry at 0 and 48 h after 4 h of treatment. † p < 0.005, compared with washout for 0 h.
Nanomaterials 12 00993 g005
Publisher’s Note: MDPI stays neutral with regard to jurisdictional claims in published maps and institutional affiliations.

