
Deformation Mechanism of Depositing Amorphous Cu-Ta Alloy Film via Nanoindentation Test

 , , , , and
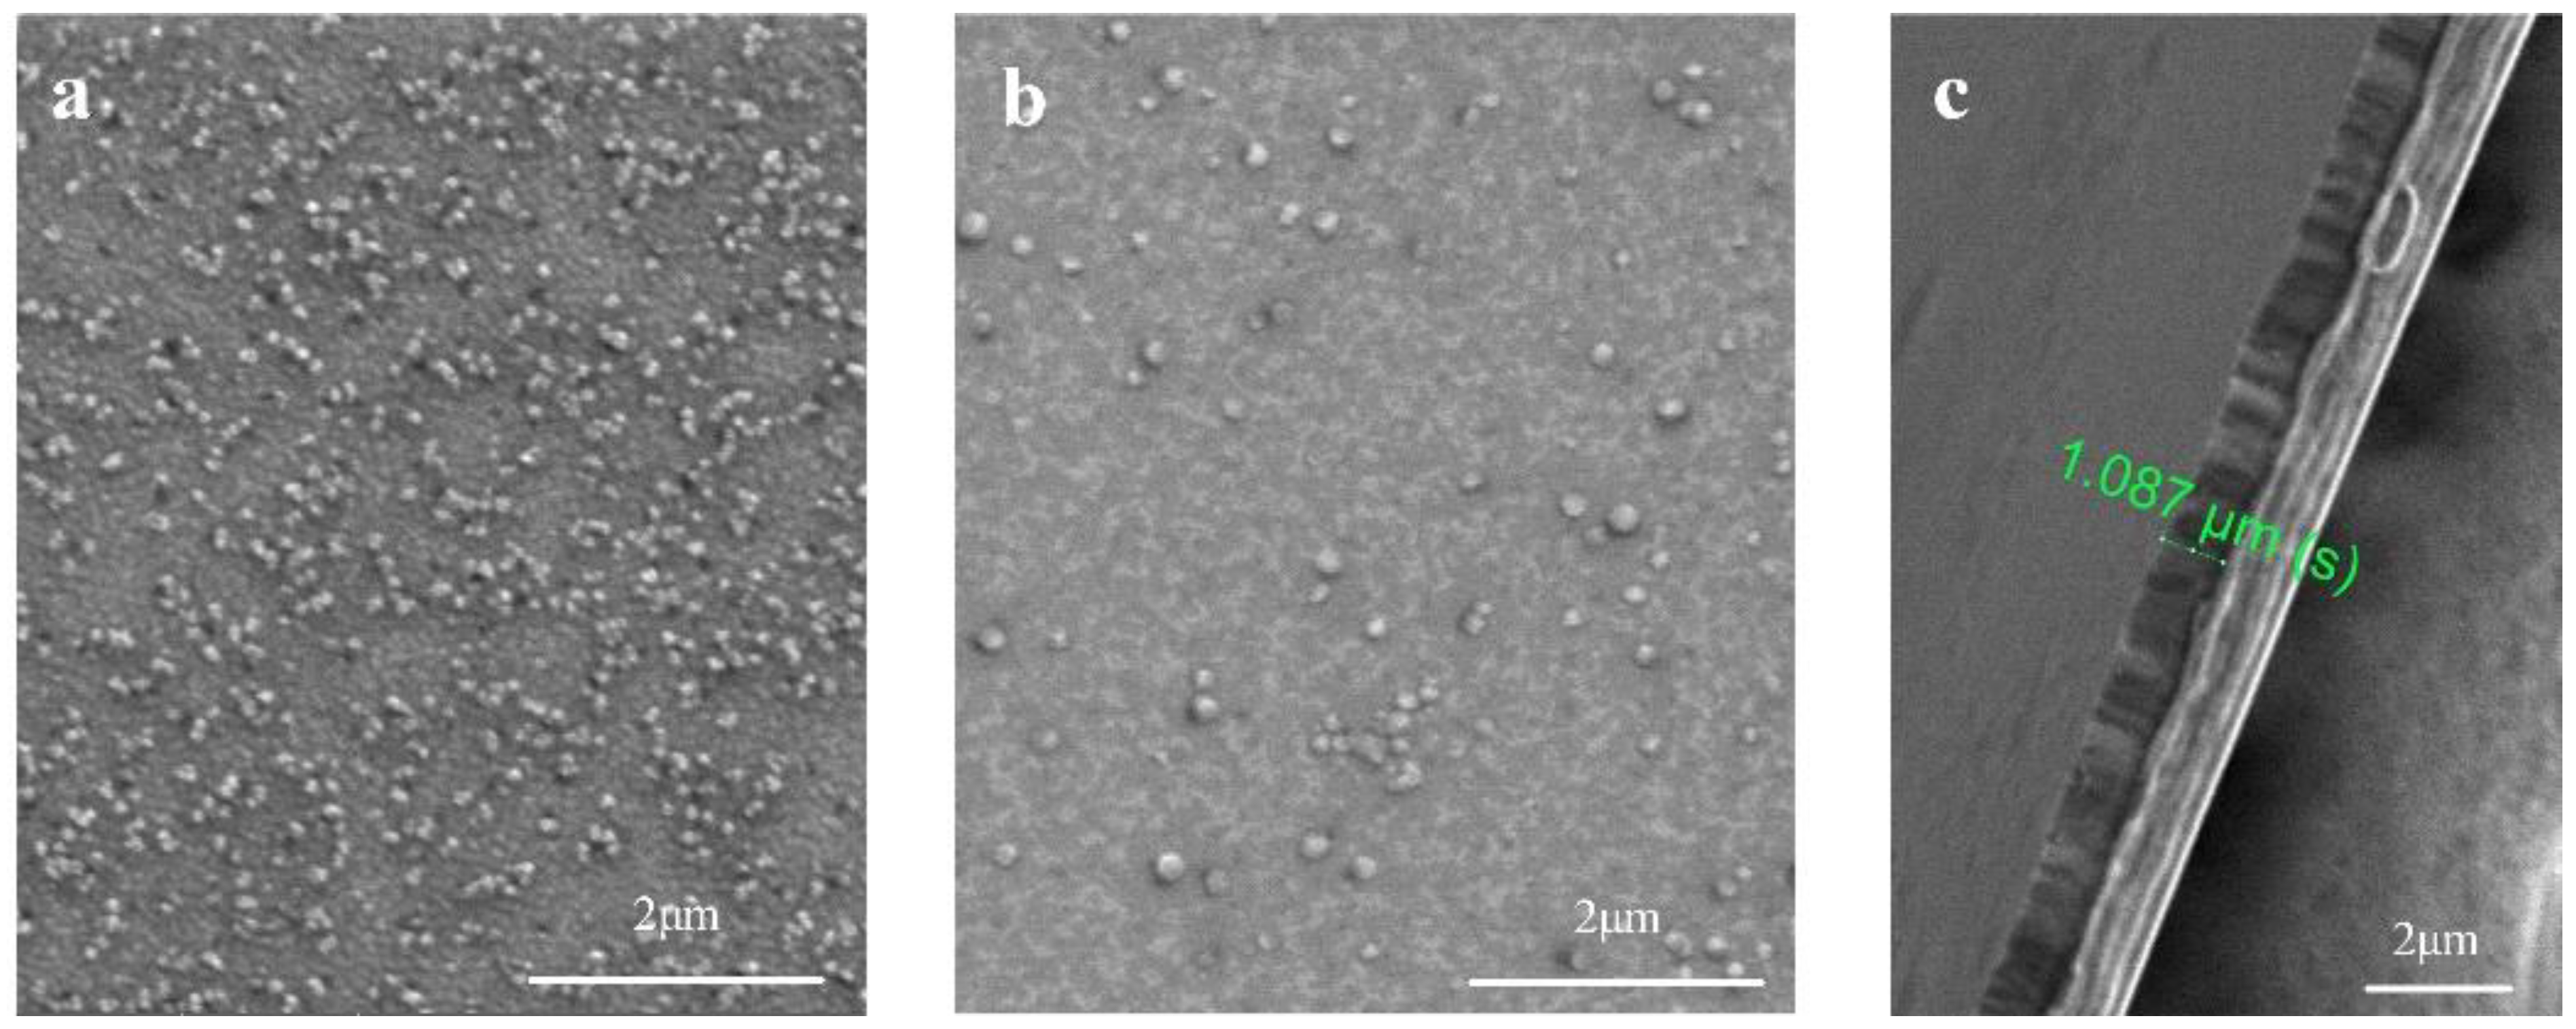
Abstract
:1. Introduction
2. Experimental
2.1. Magnetron Sputter Deposition
2.2. Nanoindentation
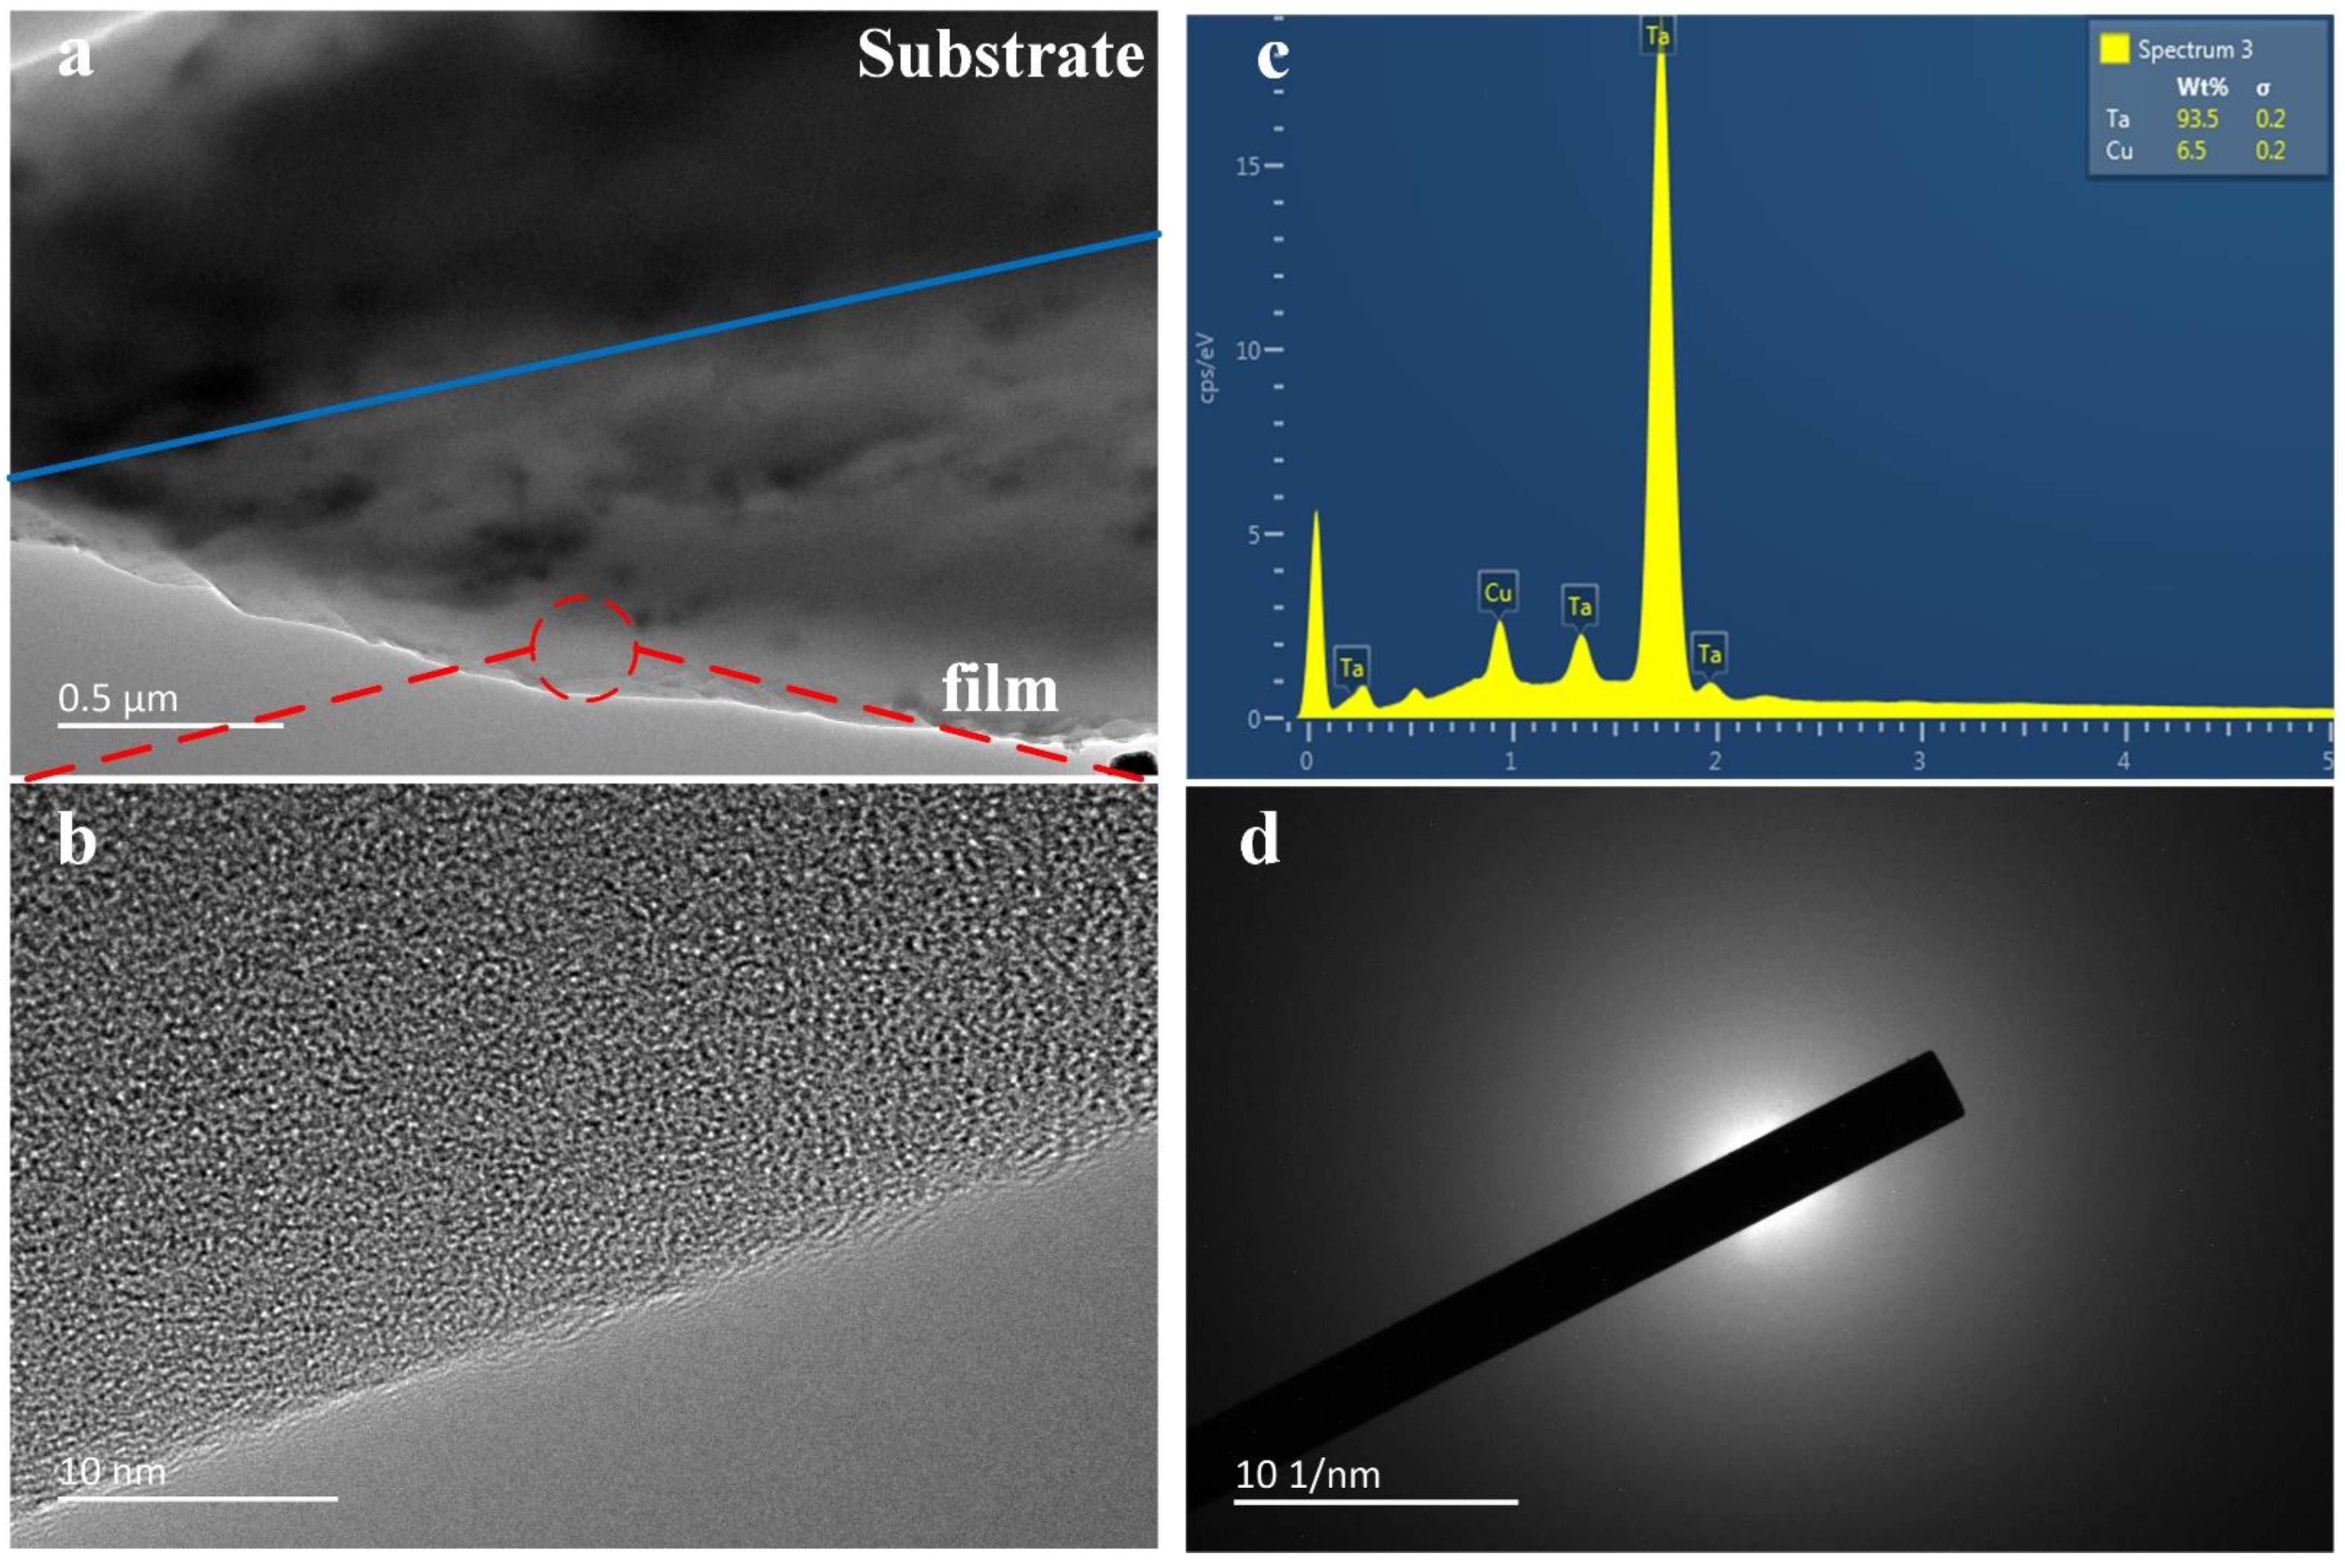
2.3. Microscopy
2.4. Theroy and Modeling
2.4.1. Elastic Modulus and Hardness
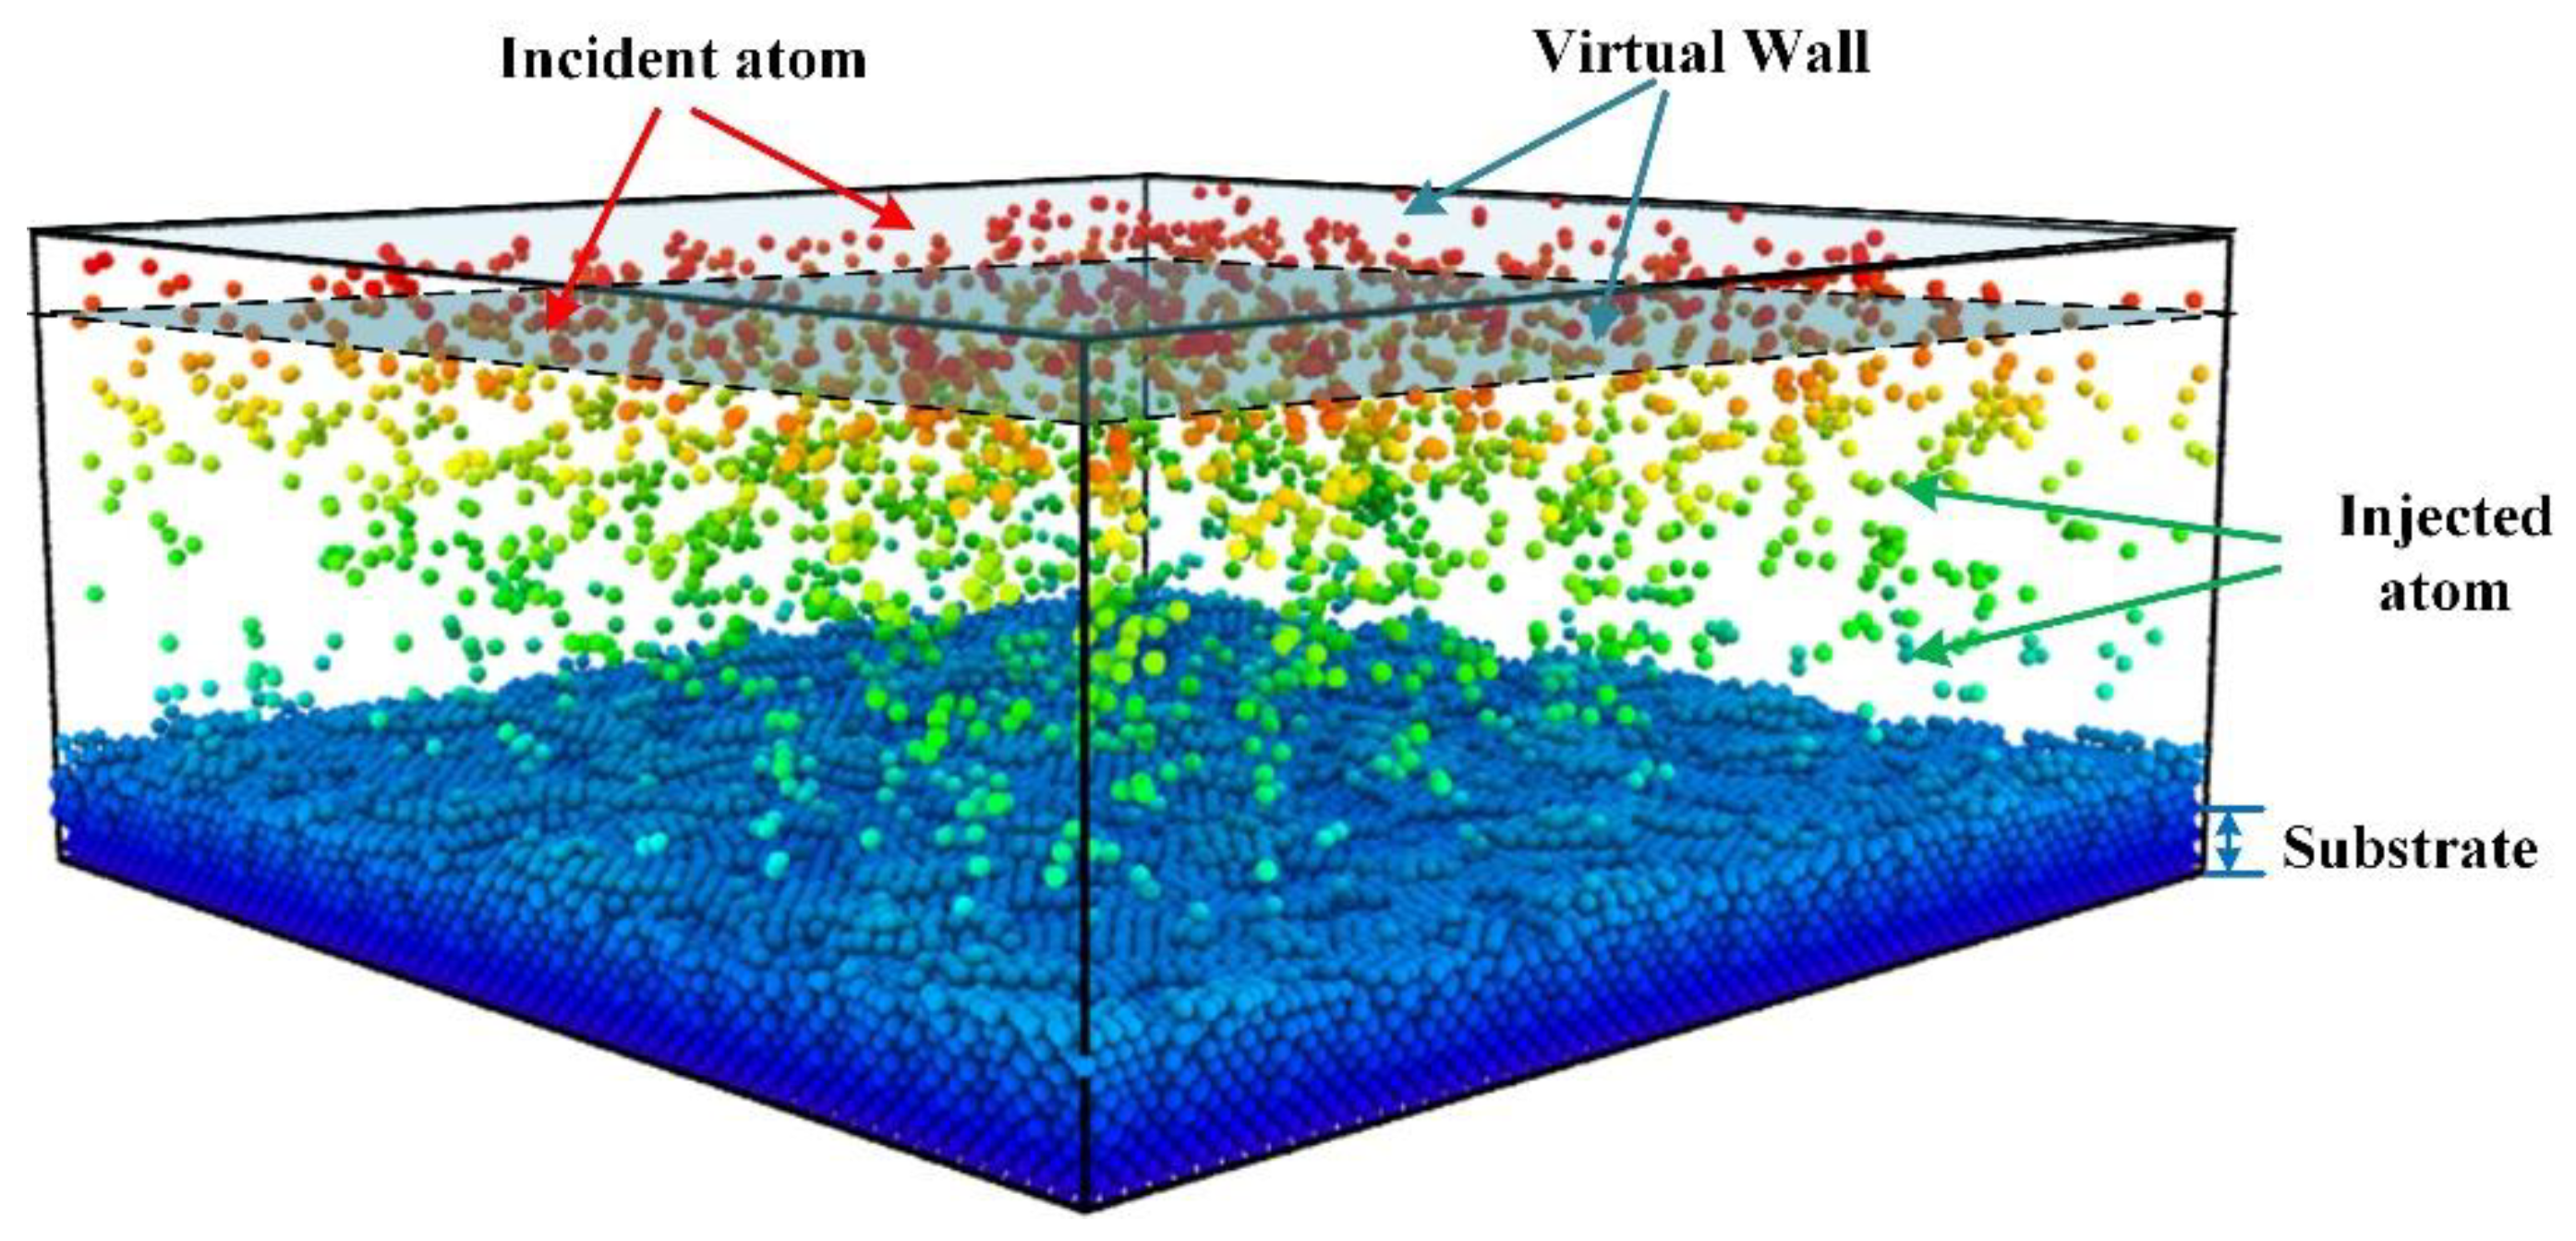
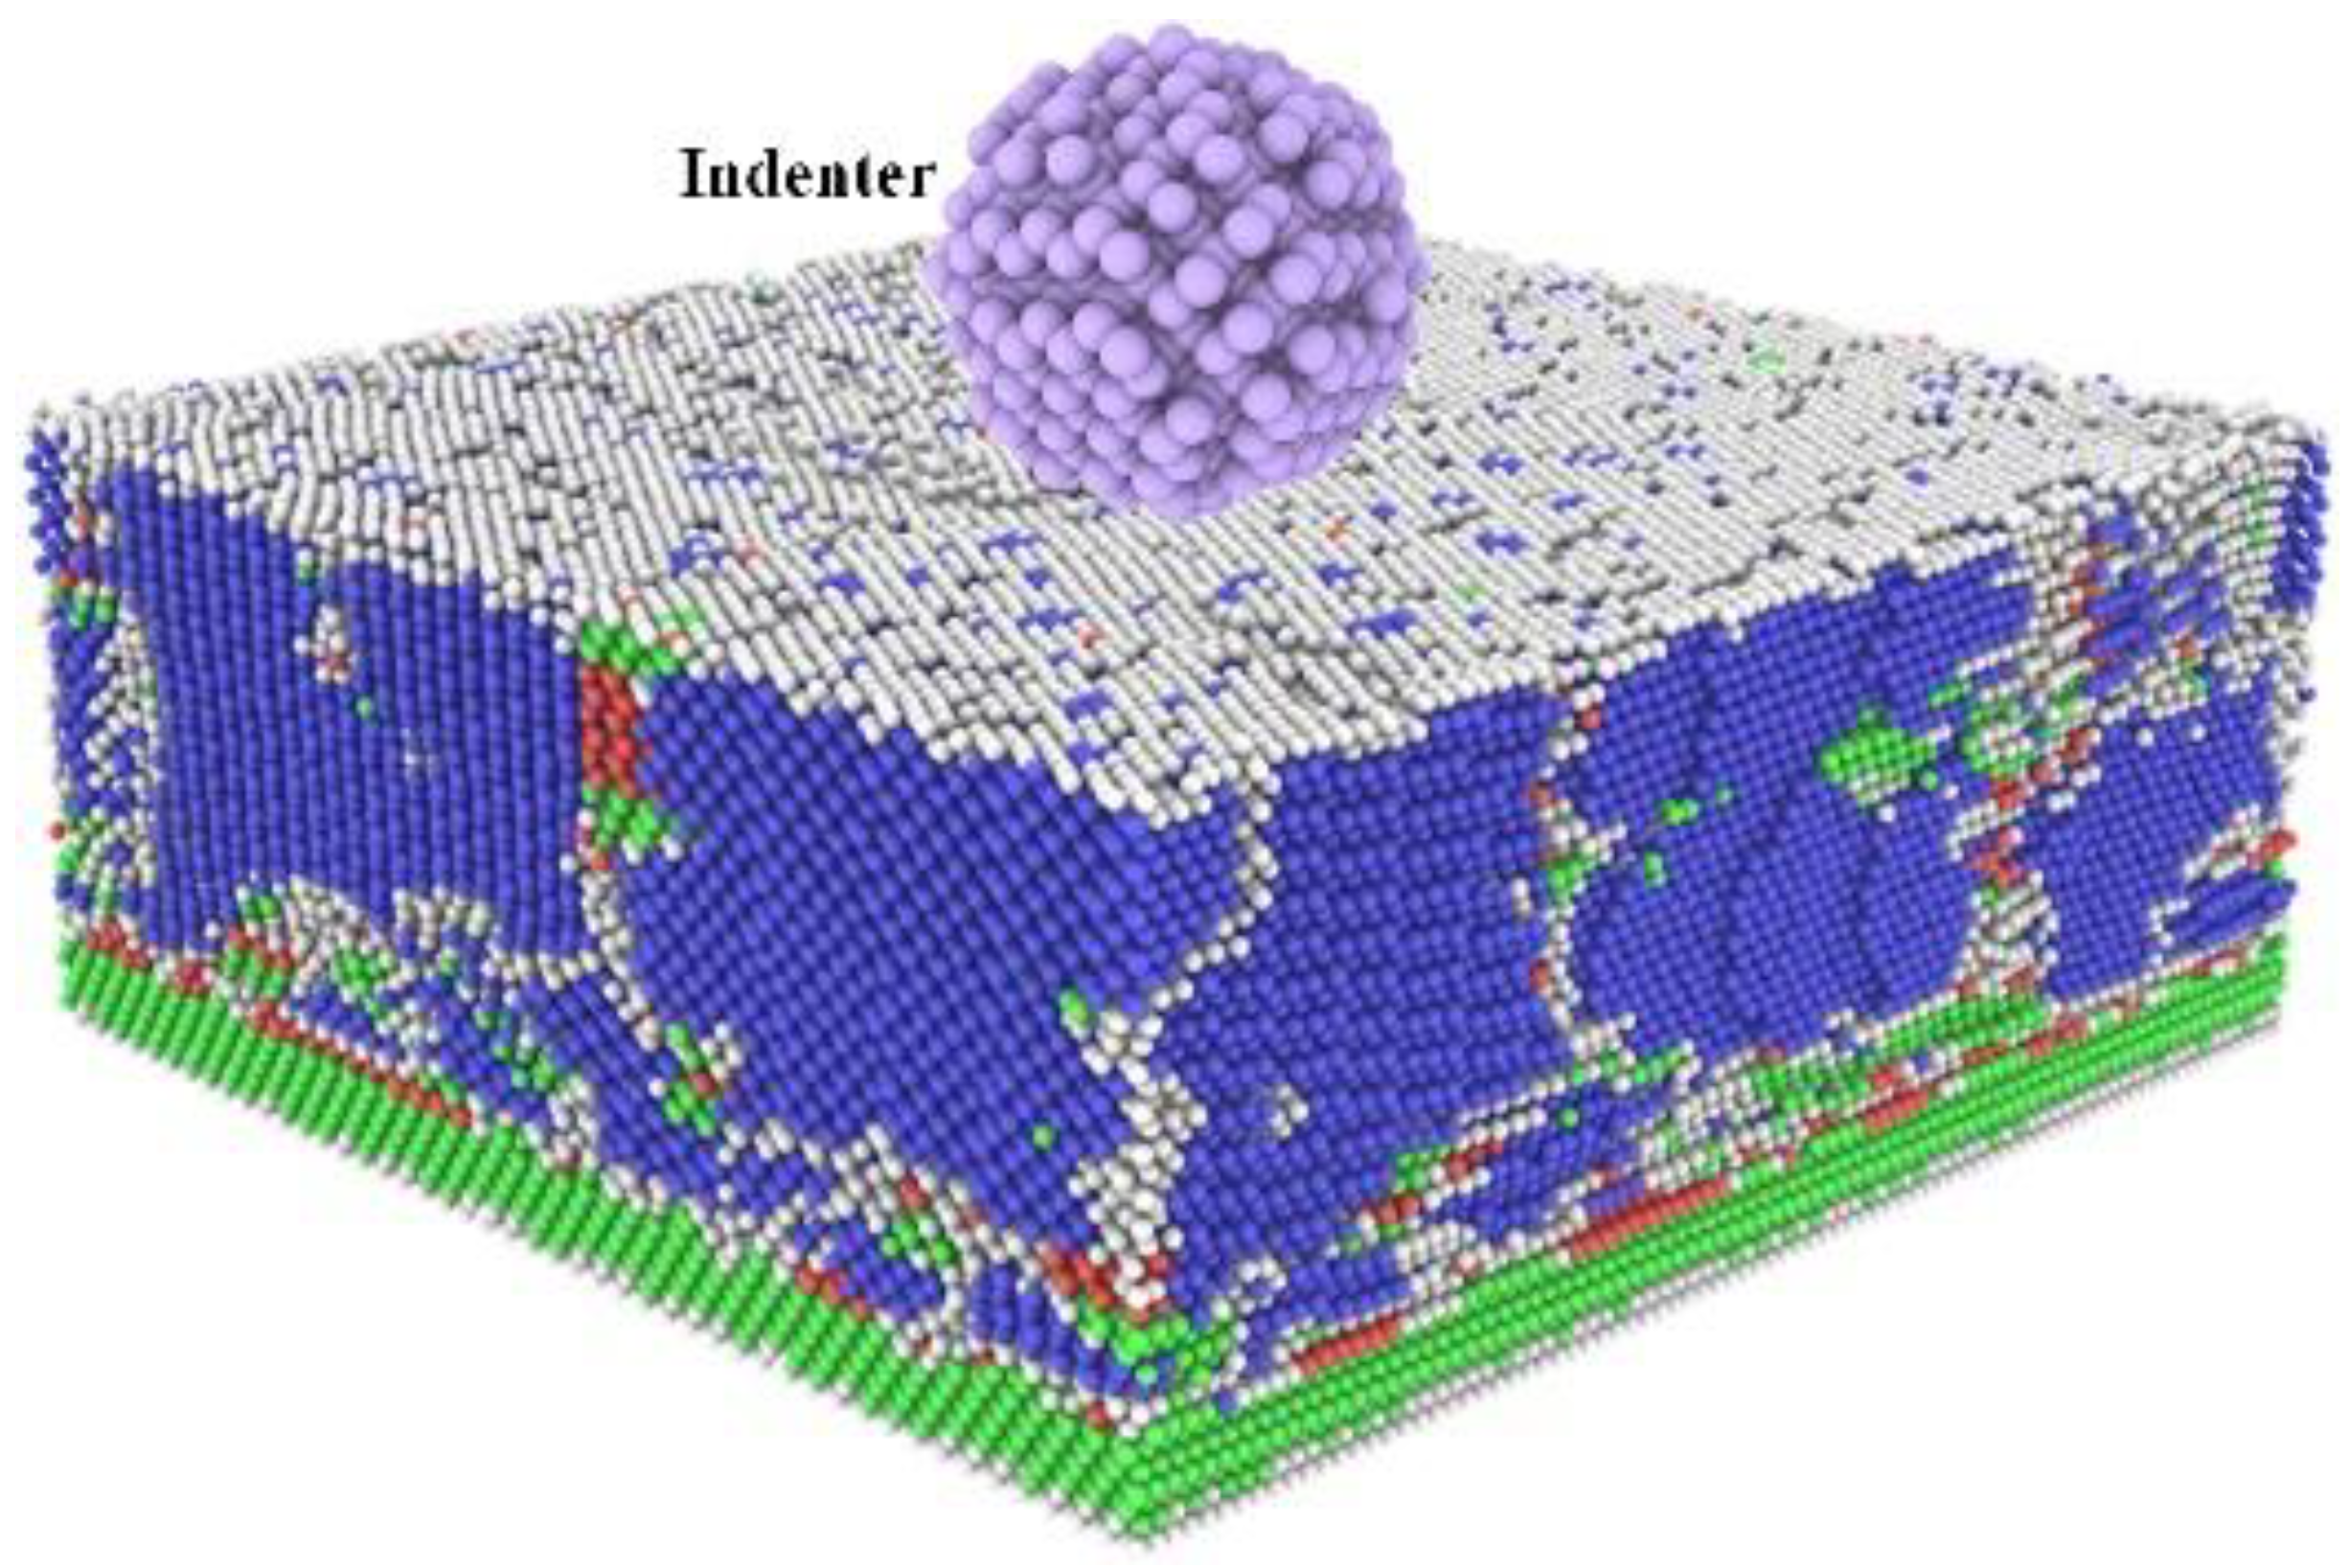
2.4.2. Simulation Model
3. Results and Discussion
3.1. Experimental Results
3.2. Atomic Simulation Results
3.2.1. Deposition Properties
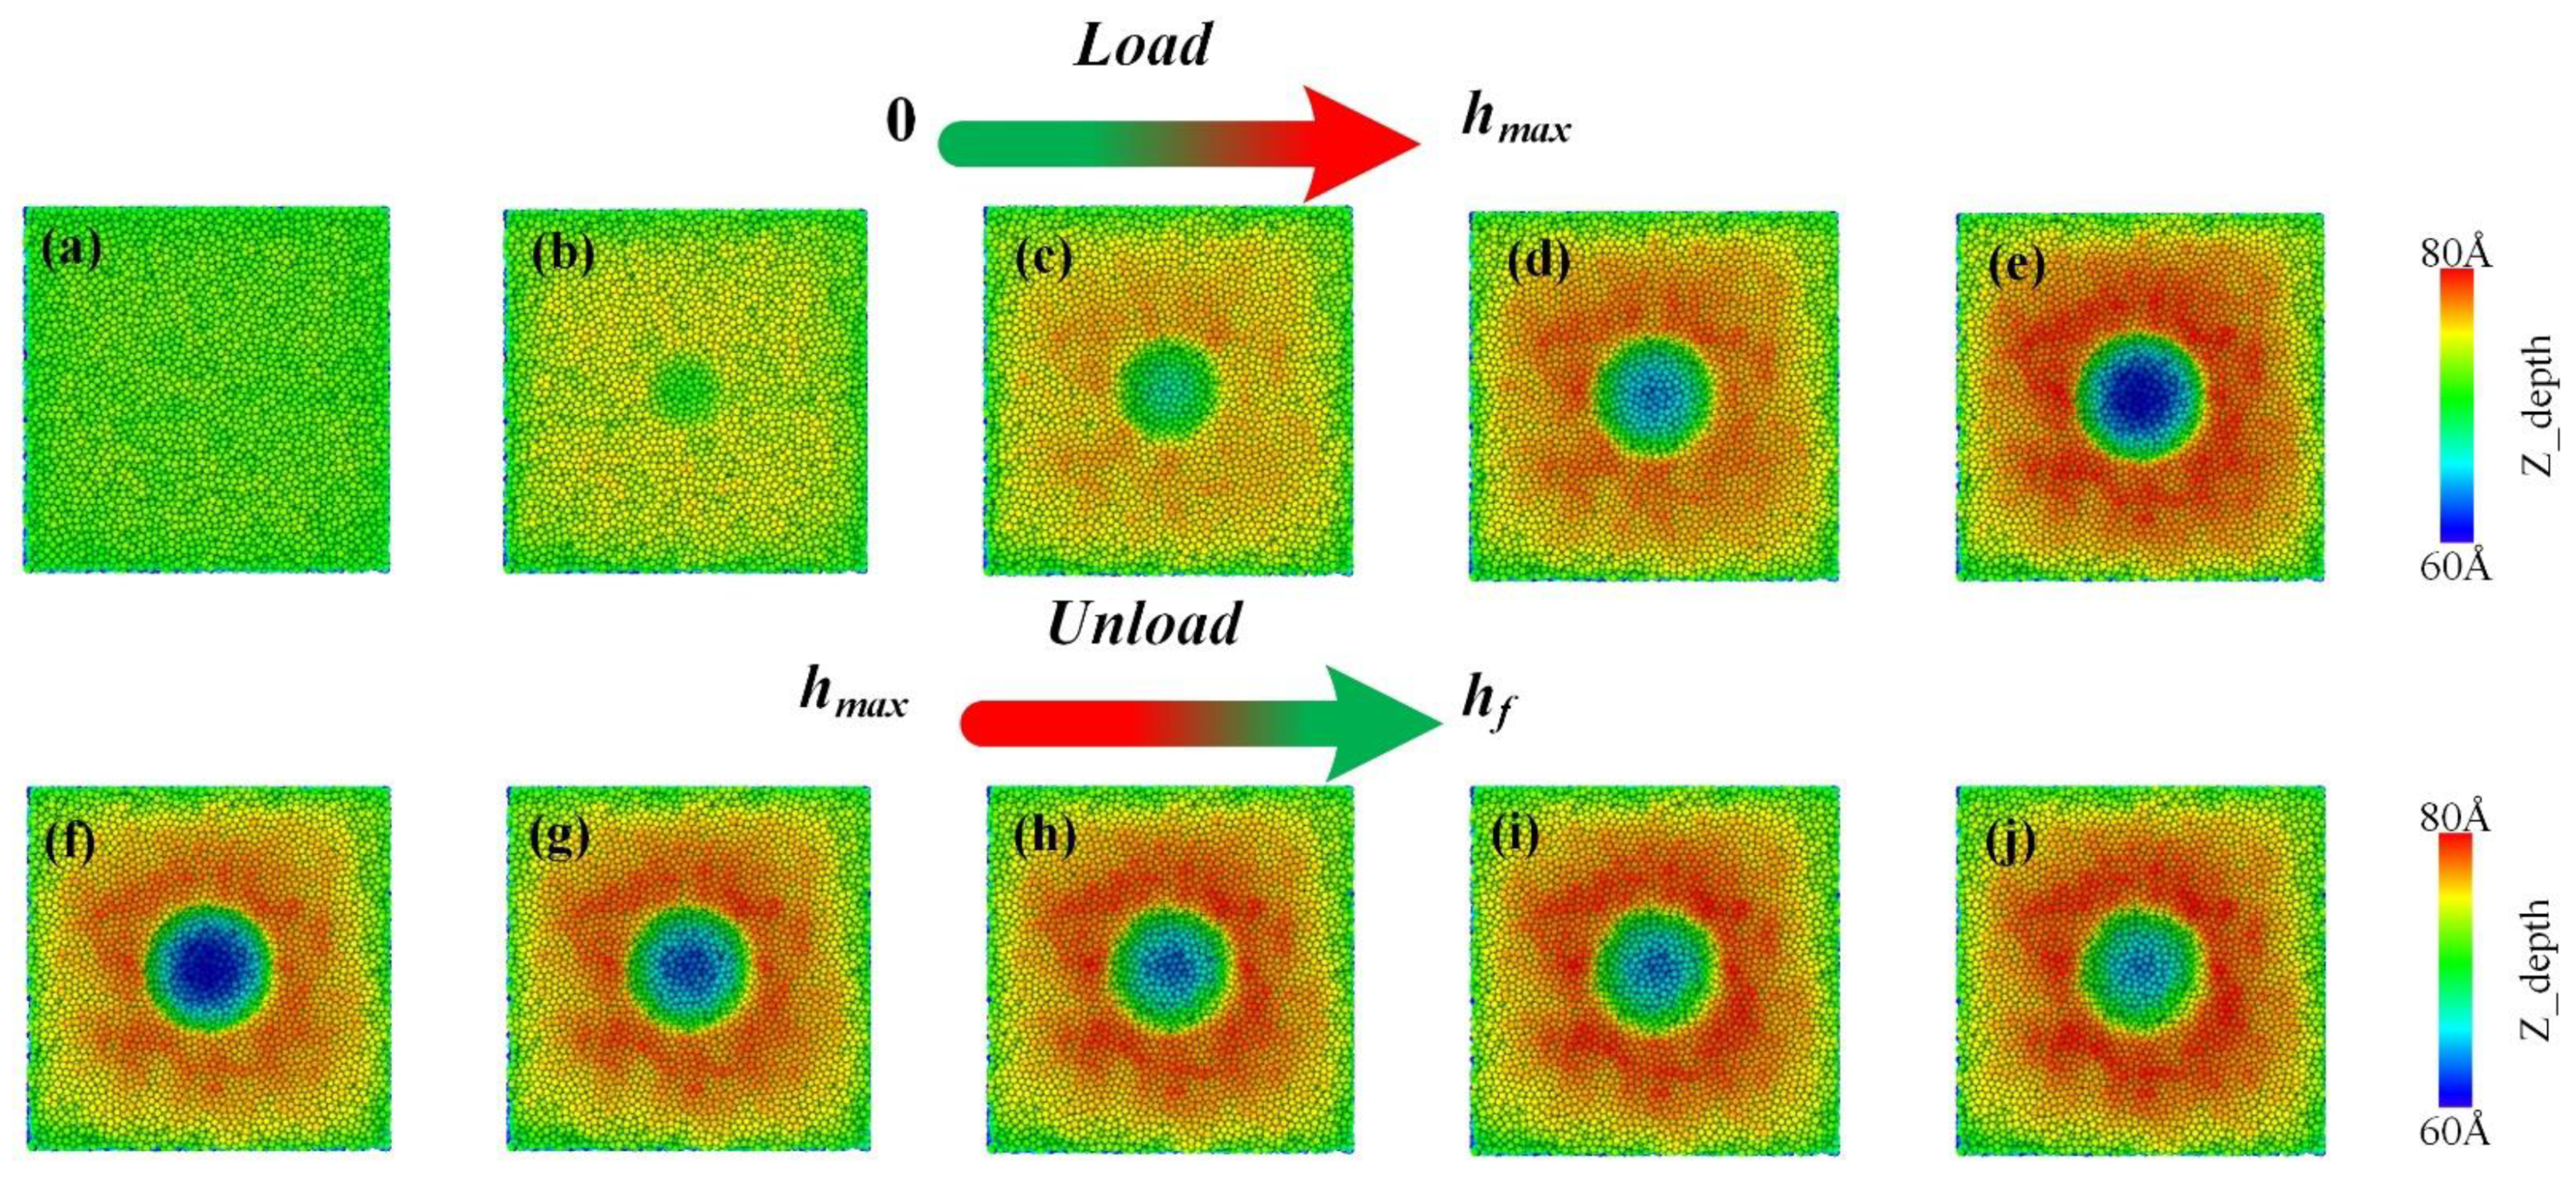
3.2.2. Indentation Properties
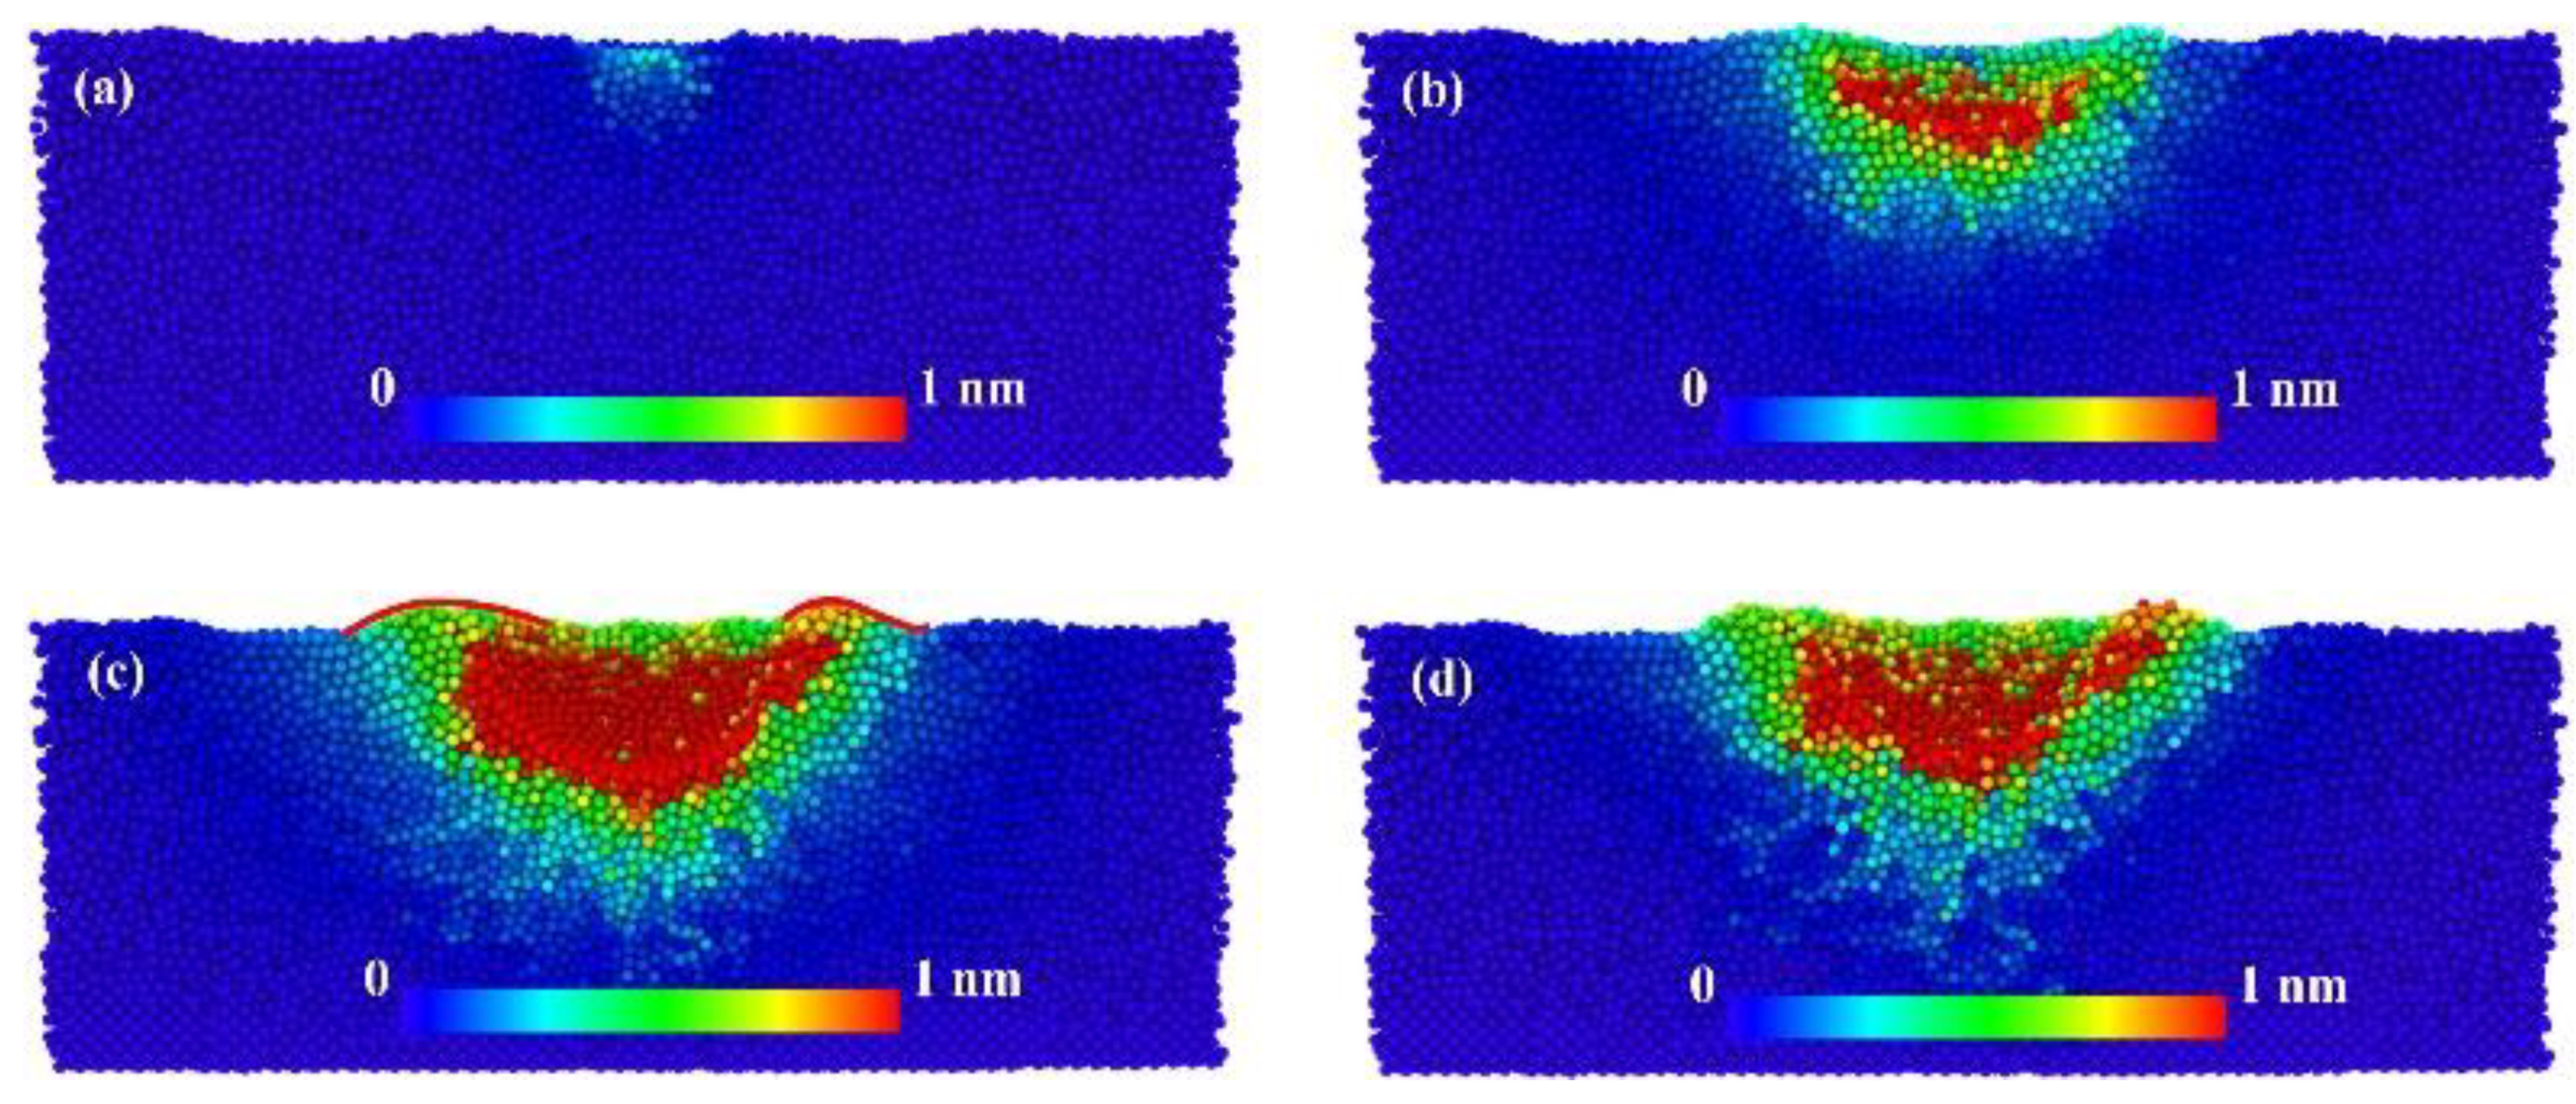
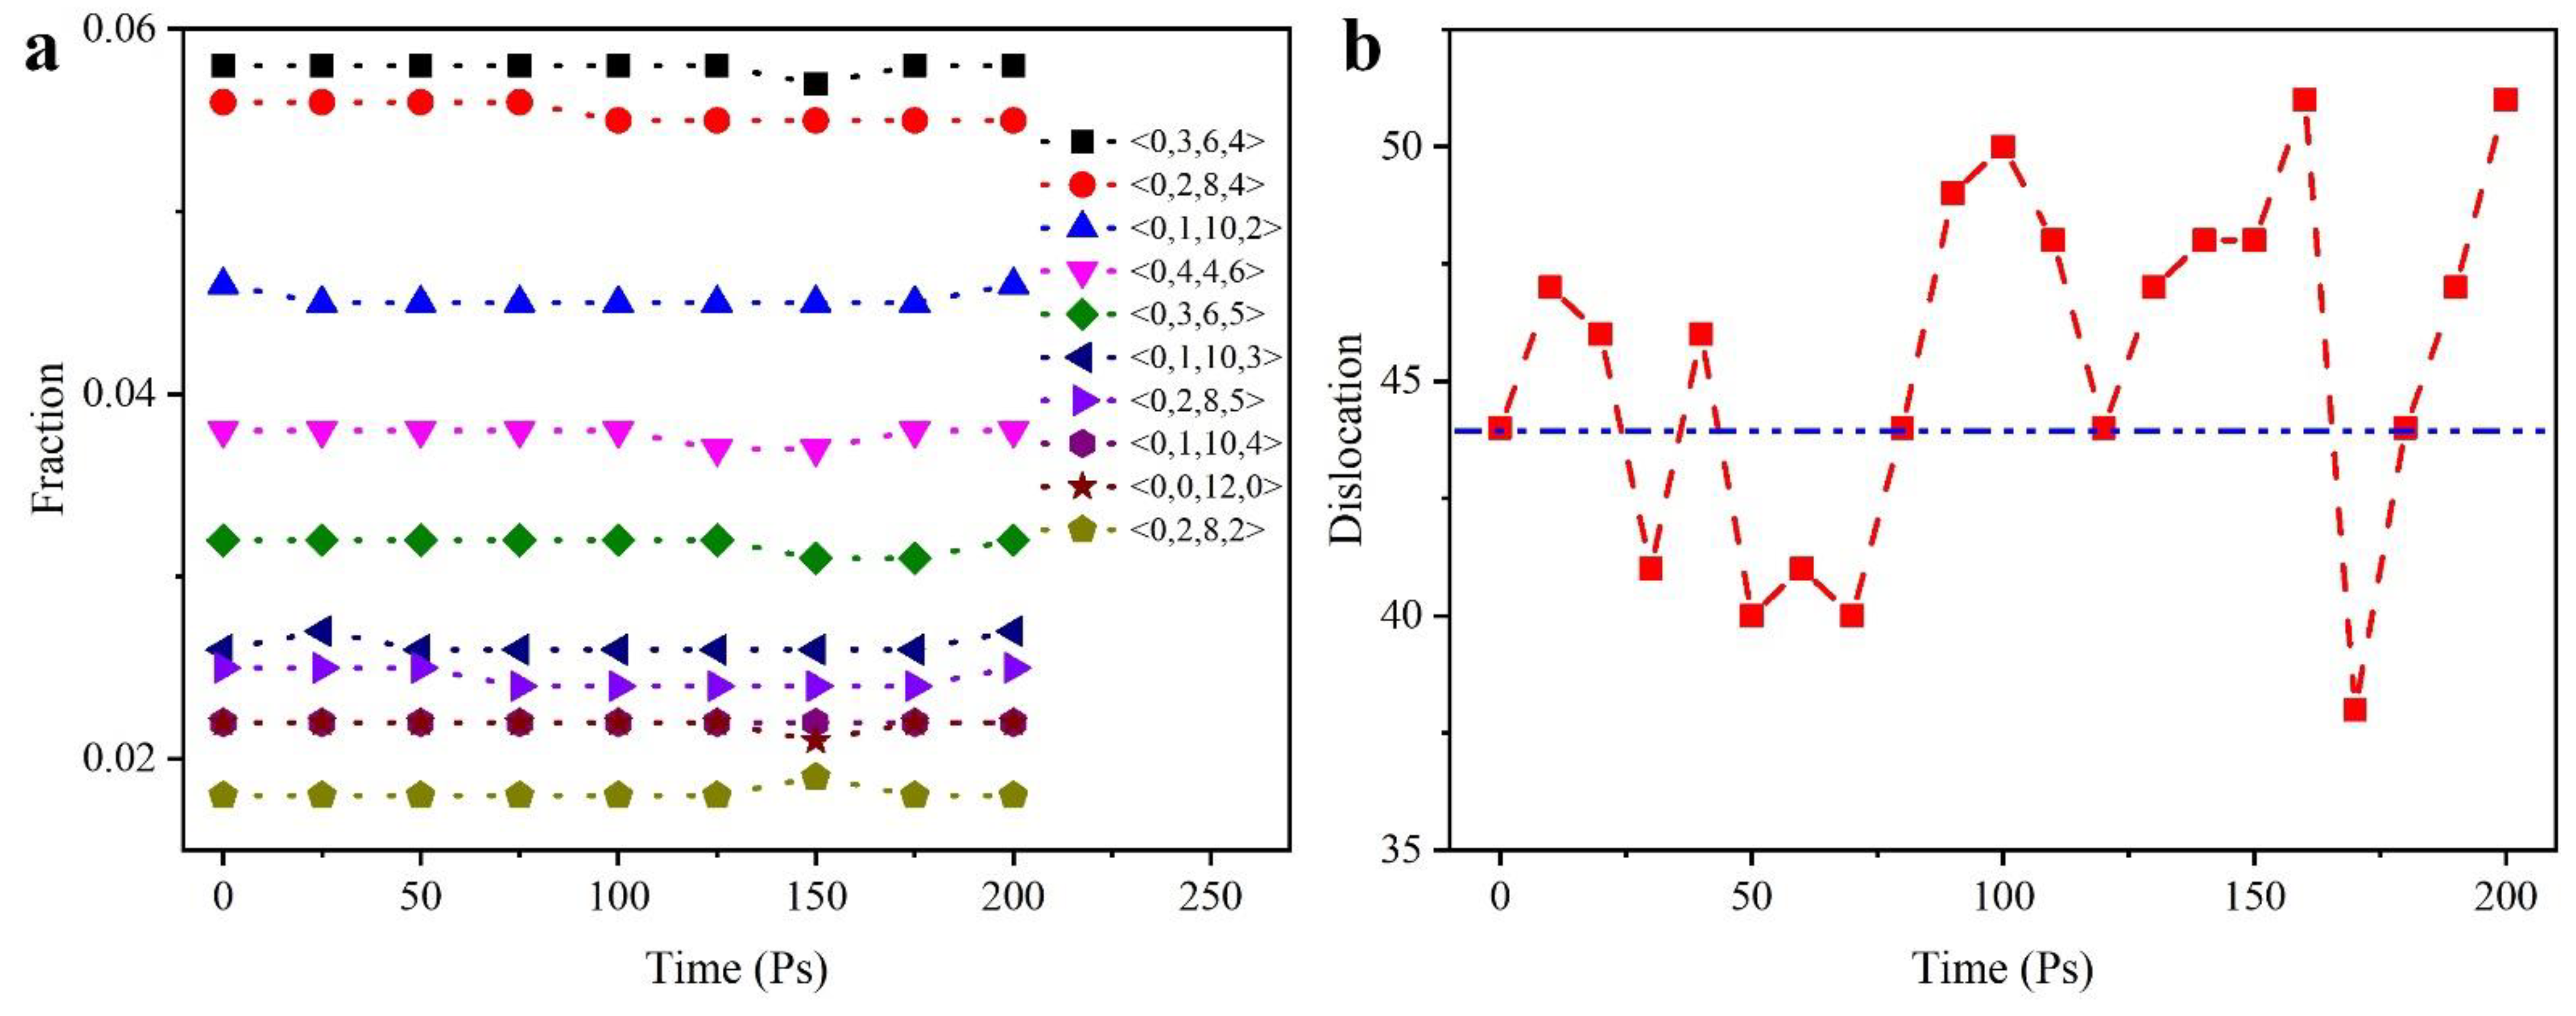
3.2.3. Deformation Mechanism
4. Conclusions
Author Contributions
Funding
Data Availability Statement
Conflicts of Interest
References
- Jun, W.K.; Willens, R.H.; Duwez, P. Non-crystalline structure in solidfied gold-silicon alloys. Nature 1960, 187, 869–870. [Google Scholar]
- Turnbull, C. Composition requirements for glass formation in metallic and ionic systems. Nature 1961, 189, 131–132. [Google Scholar]
- Chen, H.S.; Turnbull, D. Thermal evidence of a glass transition in gold-silicon-germanium alloy. Appl. Phys. Lett. 1967, 10, 284–286. [Google Scholar] [CrossRef]
- Drehman, A.J.; Greer, A.L.; Turnbull, D. Bulk formation of a metallic glass: Pd40Ni40P20. Appl. Phys. Lett. 1982, 41, 716–717. [Google Scholar] [CrossRef]
- Wang, A.; Zhao, C.; He, A.; Men, H.; Chang, C.; Wang, X. Composition design of high B-s Fe-based amorphous alloys with good amorphous-forming ability. J. Alloy. Compd. 2016, 656, 729–734. [Google Scholar] [CrossRef]
- Zhao, K.; Jiao, W.; Ma, J.; Gao, X.Q.; Wang, W.H. Formation and properties of Strontium-based bulk metallic glasses with ultralow glass transition temperature. J. Mater. Res. 2012, 27, 2593–2600. [Google Scholar] [CrossRef]
- Wang, Z.; Yu, H.-B.; Wen, P.; Bai, H.Y.; Wang, W.H. Pronounced slow β-relaxation in La-based bulk metallic glasses. J. Phys. Condens. Matter. 2011, 23, 142202. [Google Scholar] [CrossRef]
- Takcuchi, A.; Inoue, A. Development of metallic glasses by semi-empirical calculation method. J. Metastable Nanocrystalline Mater. 2005, 24–25, 283–286. [Google Scholar] [CrossRef]
- Subrananlan, P.R.; Laughlin, D.E. The Cu-Ta (copper-tantalum) system. Bull. Alloy. Phase Diagr. 1989, 10, 652–686. [Google Scholar] [CrossRef]
- Hashibon, A.; Lozovoi, A.Y.; Mishin, Y.; Elsässer, C.; Gumbsch, P. Interatomic potential for the Cu-Ta system and its application to surface wetting and dewetting. Phys. Rev. B 2008, 77, 4131. [Google Scholar] [CrossRef]
- Zhu, X.; Li, Y.; Zhang, G.; Zhu, S. On strain-localized damage in nanoscale Cu-Ta multilayers on a flexible substrate. Mater. Sci. Eng. A 2010, 527, 3279–3283. [Google Scholar] [CrossRef]
- Gong, H.R.; Kong, L.T.; Lai, W.S.; Liu, B.X. Atomistic modeling of solid-state amorphization in an immiscible Cu-Ta system. Phys. Rev. B 2002, 66, 4204. [Google Scholar] [CrossRef]
- Gong, H.R.; Liu, B.X. Interface stability and solid-state amorphization in an immiscible Cu-Ta system. Appl. Phys. Lett. 2003, 83, 4515. [Google Scholar] [CrossRef]
- Darling, K.A.; Roberts, A.J.; Mishin, Y.; Mathaudhu, S.N.; Kecskes, L.J. Grain size stabilization of nanocrystalline copper at high temperatures by alloying with tantalum. J. Alloy. Compd. 2013, 573, 142–150. [Google Scholar] [CrossRef]
- Ono, H.; Nakano, T.; Ohta, T. Diffusion barrier effects of transition metals for Cu/M/Si multilayers (M=Cr, Ti, Nb, Mo, Ta, W). Appl. Phys. Lett. 1994, 64, 1511–1513. [Google Scholar] [CrossRef]
- Latt, K.M.; Lee, Y.K.; Osipowicz, T.; Park, H.S. Interfacial reactions and failure mechanism of Cu/Ta/SaiO2/Si multilayer structure in thermal annealing. Mater. Sci. Eng. B 2002, 94, 111–120. [Google Scholar] [CrossRef]
- Li, S.; Dong, Z.L.; Latt, K.M.; Park, H.S.; White, T. Formation of Cu diffusion channels in Ta layer of a Cu/Ta/SiO2/Si structure. Appl. Phys. Lett. 2002, 80, 2296–2298. [Google Scholar]
- Francis, M.F.; Neurock, M.N.; Zhou, X.W.; Quan, J.J.; Wadley HN, G.; Webb, E.B., III. Atomic assembly of Cu/Ta multilayers: Surface roughness, grain structure, misfit dislocation and amorphization. J. Appl. Phys. 2008, 104, 4310. [Google Scholar] [CrossRef] [Green Version]
- Frolov, T.; Darling, K.A.; Kecskes, L.J.; Mishin, Y. Stablization and strengthening of nanocrystalline copper by alloying with tantalum. Acta Mater. 2012, 60, 2158–2168. [Google Scholar] [CrossRef]
- Li, W.B.; Wang, X.; Gao, L.B.; Lu, Y.; Wang, W.D. Atomic Study on Tension Behaviors of Sub-10 nm Nano-polycrystalline Cu-Ta Alloy. Materials 2019, 12, 3913. [Google Scholar] [CrossRef] [Green Version]
- Gu, C.; Wang, F.; Huang, P.; Xu, W.K.; Lu, T.J. Structure-dependent size effects in CuTa/Cu nanolaminates. Mater. Sci. Eng. A 2016, 658, 381–388. [Google Scholar] [CrossRef]
- Carpenter, J.S.; Misra, A.; Anderson, P.M. Achieving maximum hardness in semi-coherent multilayer thin films with unequal layer thickness. Acta Mater. 2012, 60, 2625–2636. [Google Scholar] [CrossRef]
- Ruestes, C.J.; Stukowski, A.; Tang, Y.; Tramontina, D.R.; Erhart, P.; Remington, B.A.; Bringa, E.M. Atomistic simulation of tantalum nanoindentation: Effects of indenter diameter, penetration velocity, and interatomic potentials on defect mechanisms and evolution. Mater. Sci. Eng. A 2014, 613, 390–403. [Google Scholar] [CrossRef]
- Zeng, F.; Gao, Y.; Li, L.; Li, D.; Pan, F. Elastic modulus and hardness of Cu-Ta amorphous films. J Alloy. Compd. 2005, 389, 75–79. [Google Scholar] [CrossRef]
- Fang, Q.; Yi, M.; Li, J.; Liu, B.; Huang, Z. Deformation behaviors of Cu29Zr2Ti15Al5Ni19 high entropy bulk metallic glass during nanoindentation. Appl. Surf. Sci. 2018, 443, 122–130. [Google Scholar] [CrossRef]
- Lee, Y.; Park, J.Y.; Kim, S.Y.; Jun, S.; Im, S. Atomistic simulations of incipient plasticity under Al(111) nanoindentation. Mech. Mater. 2005, 37, 1035–1048. [Google Scholar] [CrossRef]
- Lilleodden, E.T.; Zimmerman, J.A.; Foiles, S.M.; Nix, W.D. Atomistic simulations of elastic deformation and dislocation nucleation during nanoindentation. J. Mech. Phys. Solids 2003, 51, 901–920. [Google Scholar] [CrossRef]
- Mann, A.B.; D van Heerden Pethica, J.B.; Bowes, P.; Weihs, T.P. Contact resistance and phase transformations during nanoindentation of silicon. Philos. Mag. A 2002, 82, 1921–1929. [Google Scholar] [CrossRef]
- Komvopoulos, K.; Yang, J. Dynamic analysis of single and cyclic indentation of an elastic–plastic multi-layered medium by a rigid fractal surface. J. Mech. Phys. Solids 2006, 54, 927–950. [Google Scholar] [CrossRef]
- Lu, L.; Huang, C.; Pi, W.; Xiang, H.; Gao, F.; Fu, T.; Peng, X. Molecular dynamics simulation of effects of interface imperfections and modulation periods on Cu/Ta multilayers. Comput. Mater. Sci. 2018, 143, 63–70. [Google Scholar] [CrossRef]
- Zhang, H.; Song, H.; Kang, Y.; Huang, G.; Qu, C. Experimental Analysis on Deformation Evolution and Crack Propagation of Rock Under Cyclic Indentation. Rock Mech. Rock Eng. 2013, 46, 1053–1059. [Google Scholar] [CrossRef]
- Gerberich, W.W.; Stauffer, D.D.; Beaber, A.R.; Mook, W.M. Anomalous Plastic Deformation at Surfaces: Nanoindentation of Gold Single Crystals. Phys. Rev. B 1997, 55, 16057–16060. [Google Scholar]
- Zarudi, I.; Zhang, L.C.; Swain, M.V. Behavior of monocrystalline silicon under cyclic microindentations with a spherical indenter. Appl. Phys. Lett. 2003, 82, 1027–1029. [Google Scholar] [CrossRef] [Green Version]
- Cheng, Y.Q.; Ma, E. Atomic-level structure and structure–property relationship in metallic glasses. Prog. Mater. Sci. 2011, 56, 379–473. [Google Scholar] [CrossRef]
- Maruschak, P.O.; Okipnyi, I.B.; Poberezhnyi, L.Y.; Maruschak, E.V. Study of heat-resistant steel strain hardening by indentation. Metallurgist 2013, 56, 946–951. [Google Scholar] [CrossRef]
- Oliver, W.C.; Pharr, G.M. An improved technique for determining hardness and elastic modulus using load and displacement sensing indentation experiments. J. Mater. Res. 1992, 7, 1564–1583. [Google Scholar] [CrossRef]
- Saha, R.; Nix, W.D. Effects of the substrate on the determination of thin film mechanical properties by nanoindentation. Acta Mater. 2002, 50, 23–38. [Google Scholar] [CrossRef]
- Antunes, J.; Fernandes, J.; Sakharova, N.; Oliveira, M.; Menezes, L. On the determination of the Young’s modulus of thin films using indentation tests. Int. J. Solids Struct. 2007, 44, 8313–8334. [Google Scholar] [CrossRef] [Green Version]
- Jeng, Y.R.; Tan, C.M. Investigation into the nanoindentation size effect using static atomistic simulations. Appl. Phys. Lett. 2006, 89, 251901. [Google Scholar] [CrossRef]
- Hertz, H. On the contact of elastic solids. Z. Reine Angew. Mathematik 1881, 92, 156–171. [Google Scholar]
- Kontomaris, S.-V. The Hertz model in AFM nanoindentation experiments: Applications in biological samples and biomaterials. Micro Nanosyst. 2018, 10, 11–22. [Google Scholar] [CrossRef]
- Pathak, S.; Kalidindi, S.R. Spherical nanoindentation stress–strain curves. Mater. Sci. Eng. R Rep. 2015, 91, 1–36. [Google Scholar] [CrossRef] [Green Version]
- Plimpton, S. Fast Parallel Algorithms for Short-Range Molecular Dynamics. J. Comp. Phys. 1995, 117, 1–19. [Google Scholar] [CrossRef] [Green Version]
- Foiles, S.M.; Baskes, M.I.; Daw, M.S. Embedded-atom-method functions for the fcc metals Cu, Ag, Au, Ni, Pd, Pt and their alloys. Phys. Rev. B 1986, 33, 7983–7991. [Google Scholar] [CrossRef]
- Ravelo, R.; Germann, T.C.; Guerrero, O.; An, Q.; Holian, B.L. Shock-induced plasticity in tantalum single crystals: Interatomic potentials and large-scale molecular-dynamics simulations. Phys. Rev. B 2013, 88, 134101. [Google Scholar] [CrossRef] [Green Version]
- Pun, G.P.; Darling, K.; Kecskes, L.; Mishin, Y. Angular-dependent interatomic potential for the Cu-Ta system and its application to structural stability of nano-crystalline alloys. Acta Mater. 2015, 100, 377–391. [Google Scholar]
- Honeycutt, J.D.; Andersen, H.C. Molecular dynamics study of melting and freezing of small Lennard-Jones clusters. J. Phys. Chem. 1987, 91, 4950–4963. [Google Scholar] [CrossRef]
- Sheng, H.W.; Luo, W.K.; Alamgir, F.; Bai, J.M.; Ma, E. Atomic packing and short-to-medium-range order in metallic glasses. Nature 2006, 439, 419–425. [Google Scholar] [CrossRef]
- Stukowski, A.; Bulatov, V.V.; Arsenlis, A. Automated identification and indexing of dislocations in crystal interfaces. Model. Simul. Mater. Sci. Eng. 2012, 20, 085007. [Google Scholar] [CrossRef]


Publisher’s Note: MDPI stays neutral with regard to jurisdictional claims in published maps and institutional affiliations. |
© 2022 by the authors. Licensee MDPI, Basel, Switzerland. This article is an open access article distributed under the terms and conditions of the Creative Commons Attribution (CC BY) license (https://creativecommons.org/licenses/by/4.0/).
Share and Cite
Li, W.; Wang, X.; Feng, X.; Du, Y.; Zhang, X.; Xie, Y.; Chen, X.; Lu, Y.; Wang, W. Deformation Mechanism of Depositing Amorphous Cu-Ta Alloy Film via Nanoindentation Test. Nanomaterials 2022, 12, 1022. https://doi.org/10.3390/nano12061022
Li W, Wang X, Feng X, Du Y, Zhang X, Xie Y, Chen X, Lu Y, Wang W. Deformation Mechanism of Depositing Amorphous Cu-Ta Alloy Film via Nanoindentation Test. Nanomaterials. 2022; 12(6):1022. https://doi.org/10.3390/nano12061022
Chicago/Turabian StyleLi, Weibing, Xiao Wang, Xiaobin Feng, Yao Du, Xu Zhang, Yong Xie, Xiaoming Chen, Yang Lu, and Weidong Wang. 2022. "Deformation Mechanism of Depositing Amorphous Cu-Ta Alloy Film via Nanoindentation Test" Nanomaterials 12, no. 6: 1022. https://doi.org/10.3390/nano12061022