
High-Speed Erosion Behavior of Hydrophobic Micro/Nanostructured Titanium Surfaces

Abstract
:1. Introduction
2. Experimental Procedures
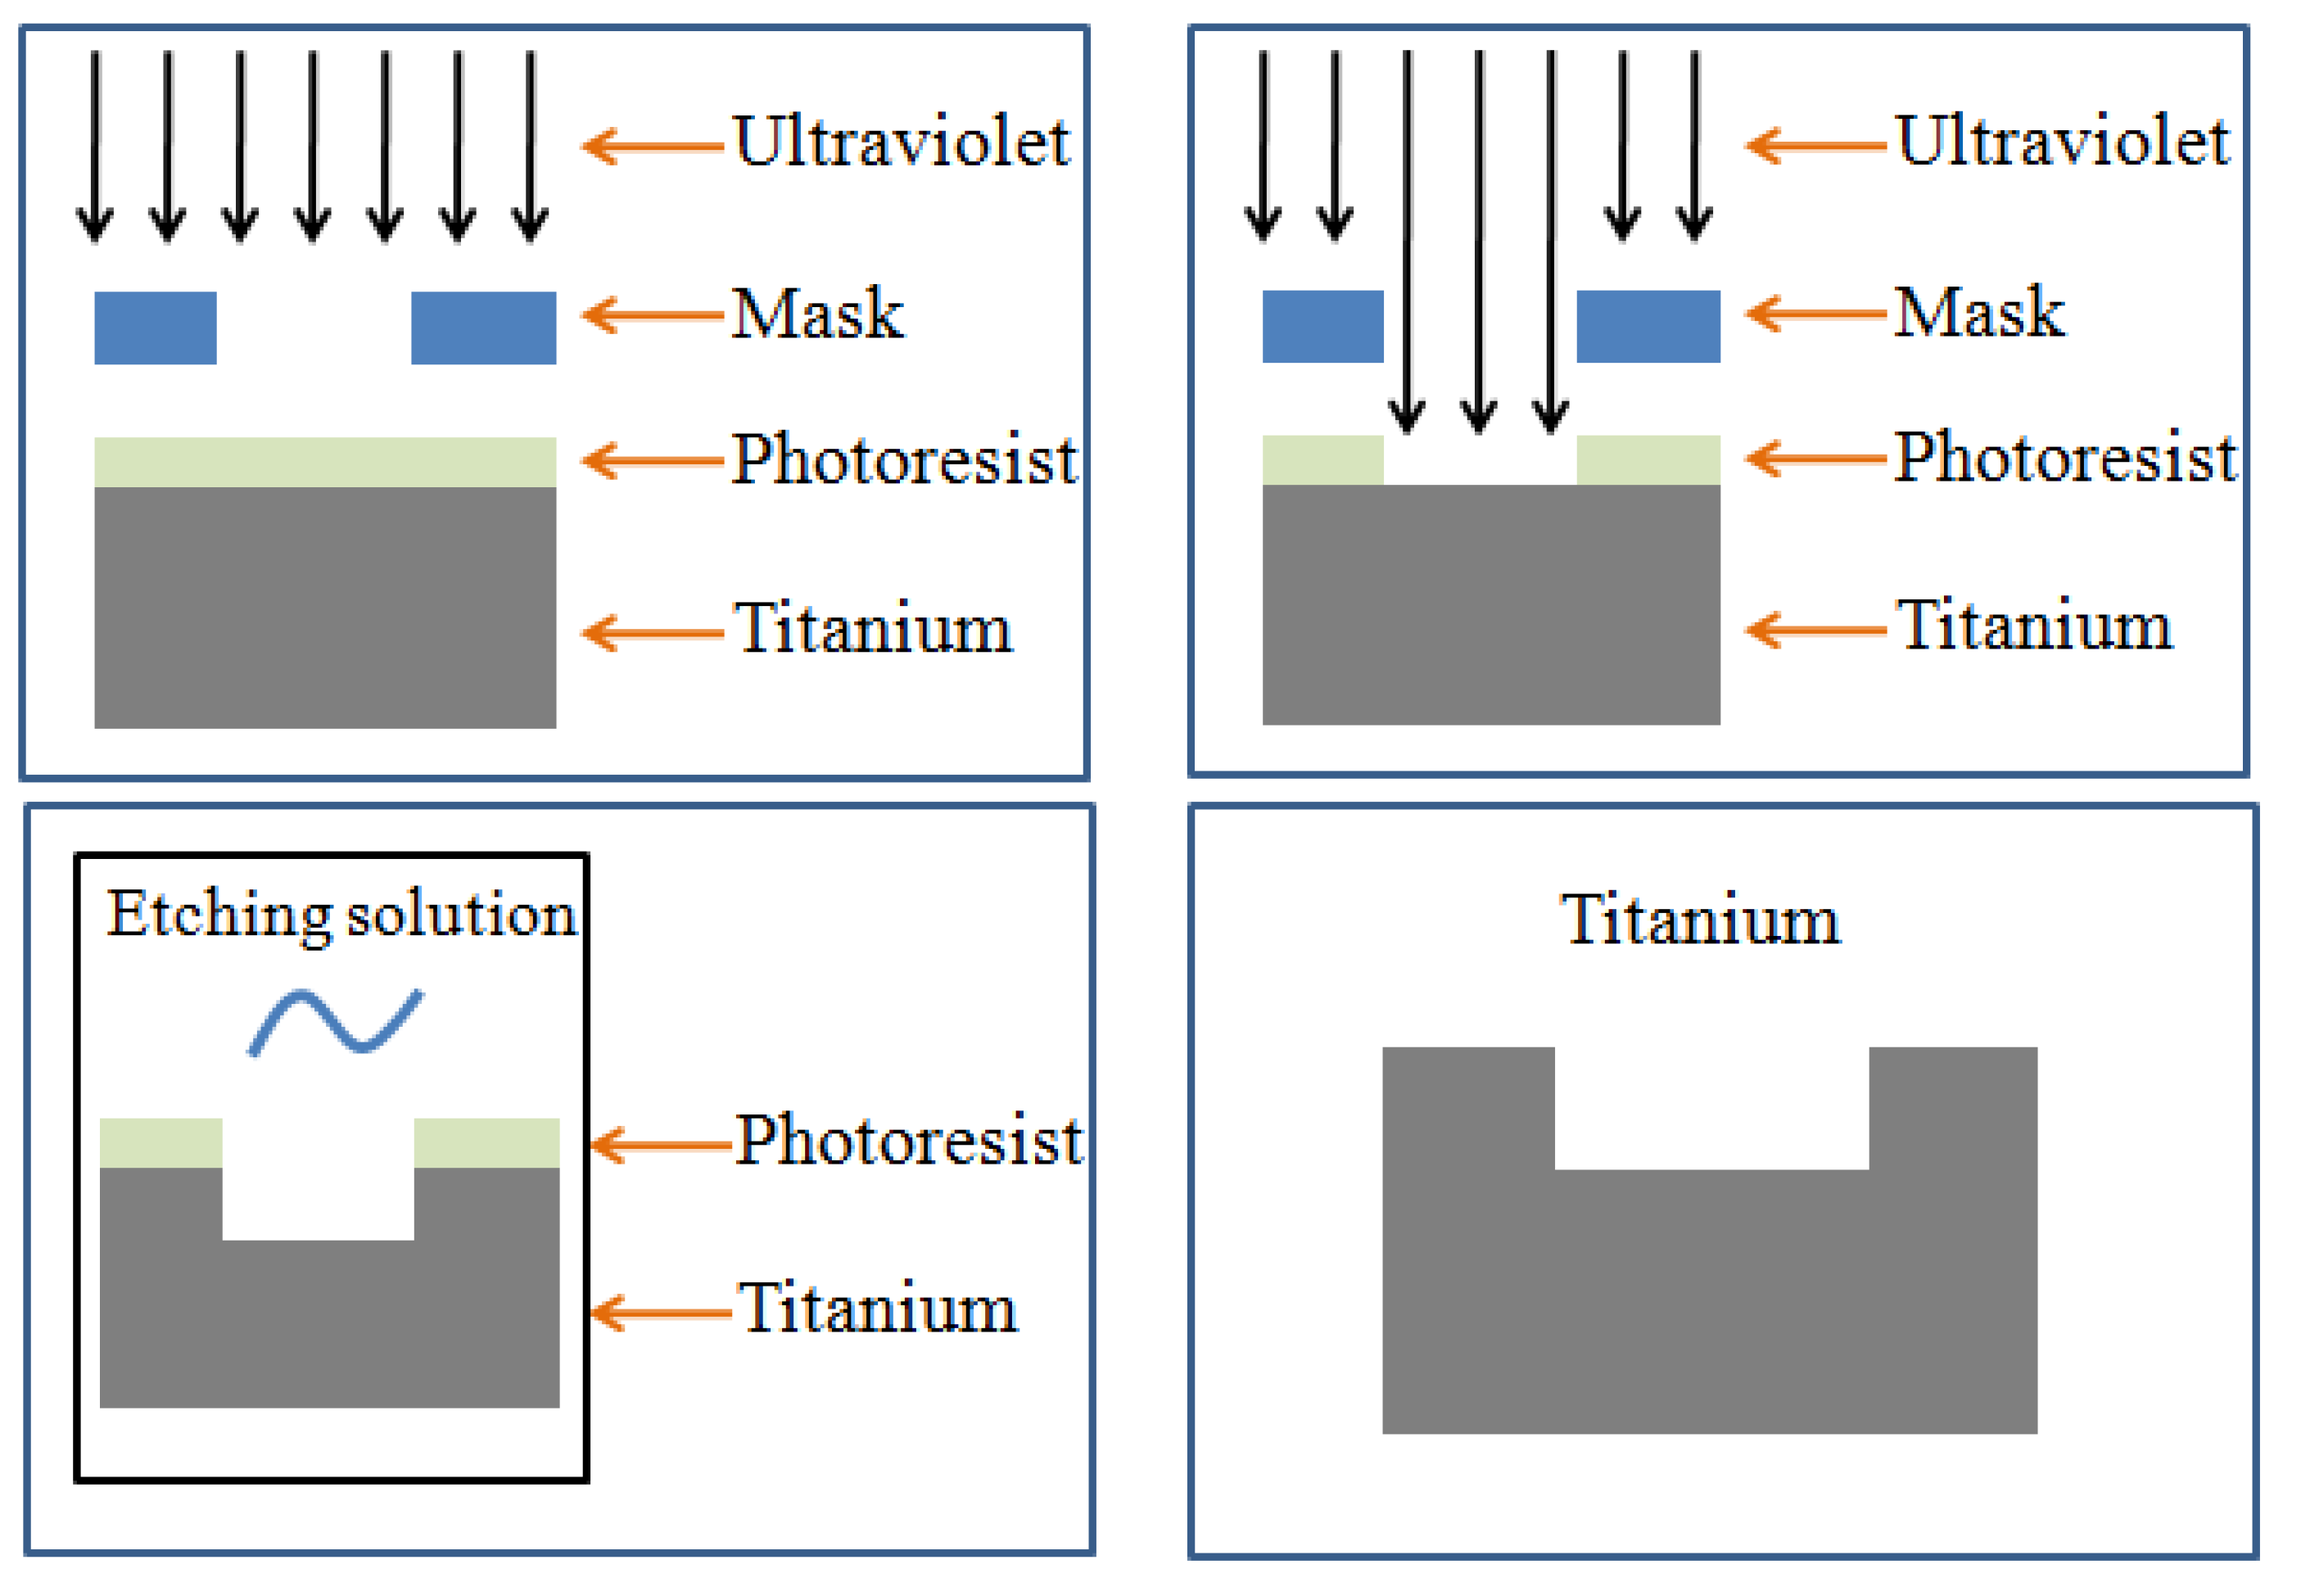
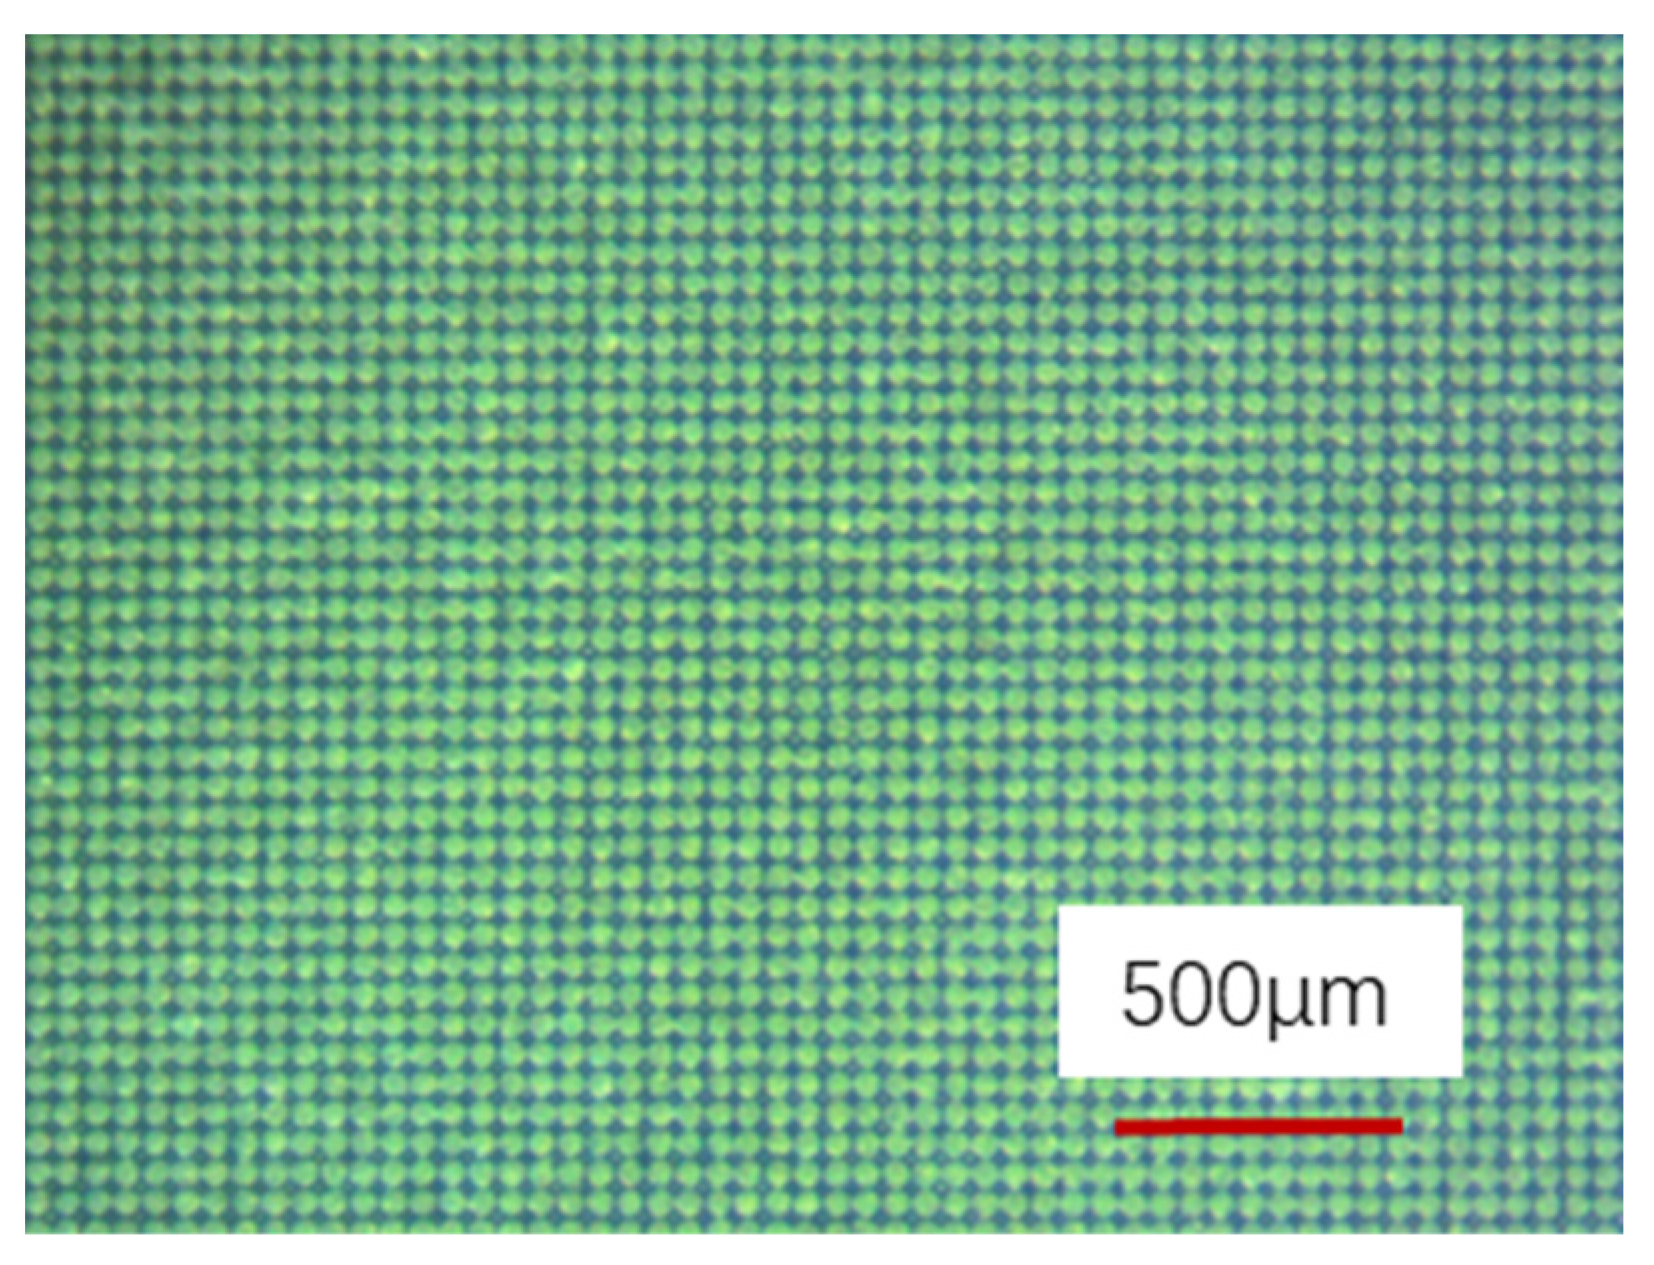
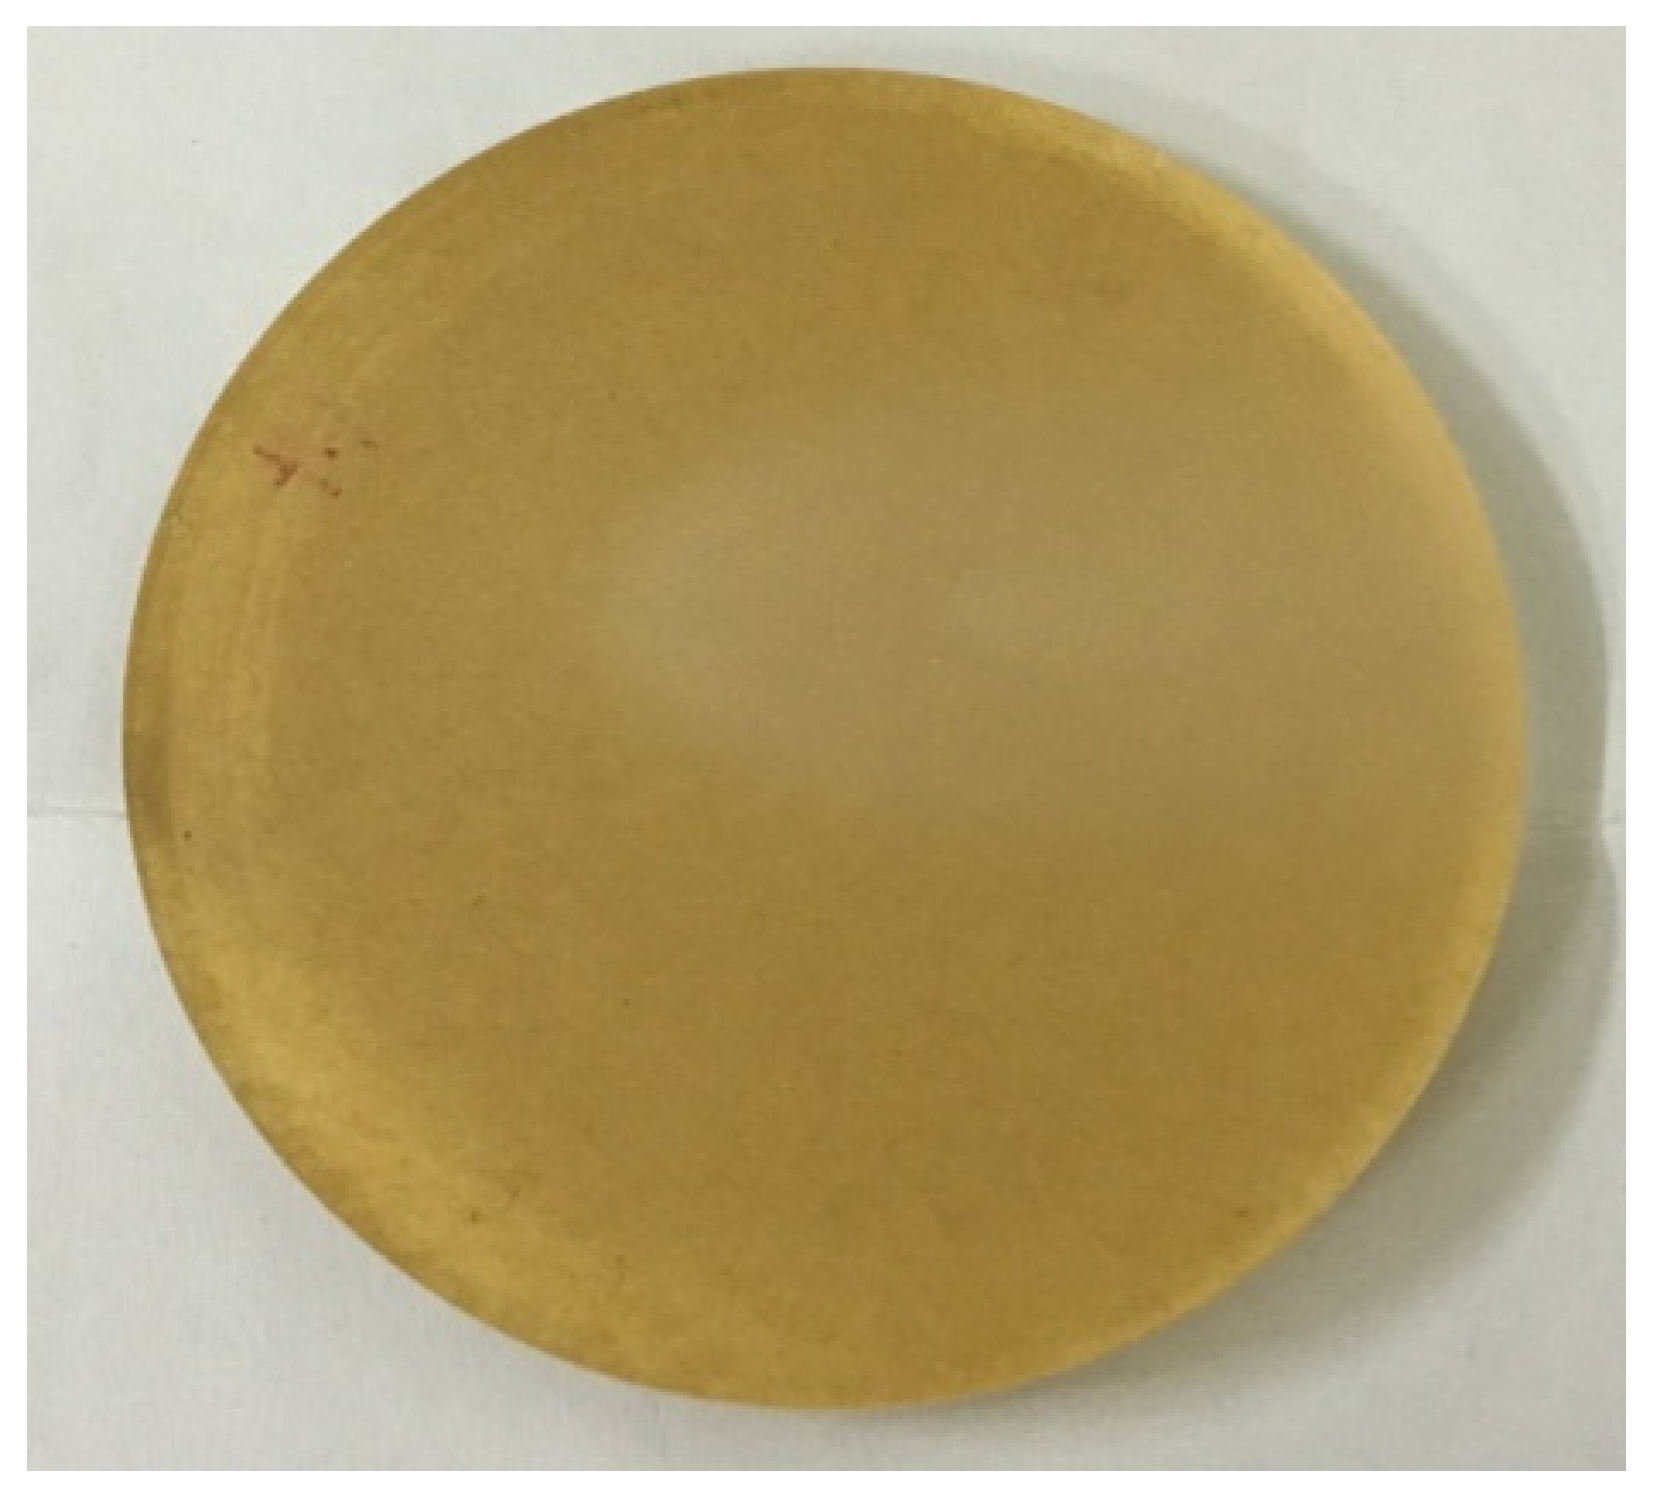
2.1. Fabrication of the Microscale Binary Hydrophobic Surfaces
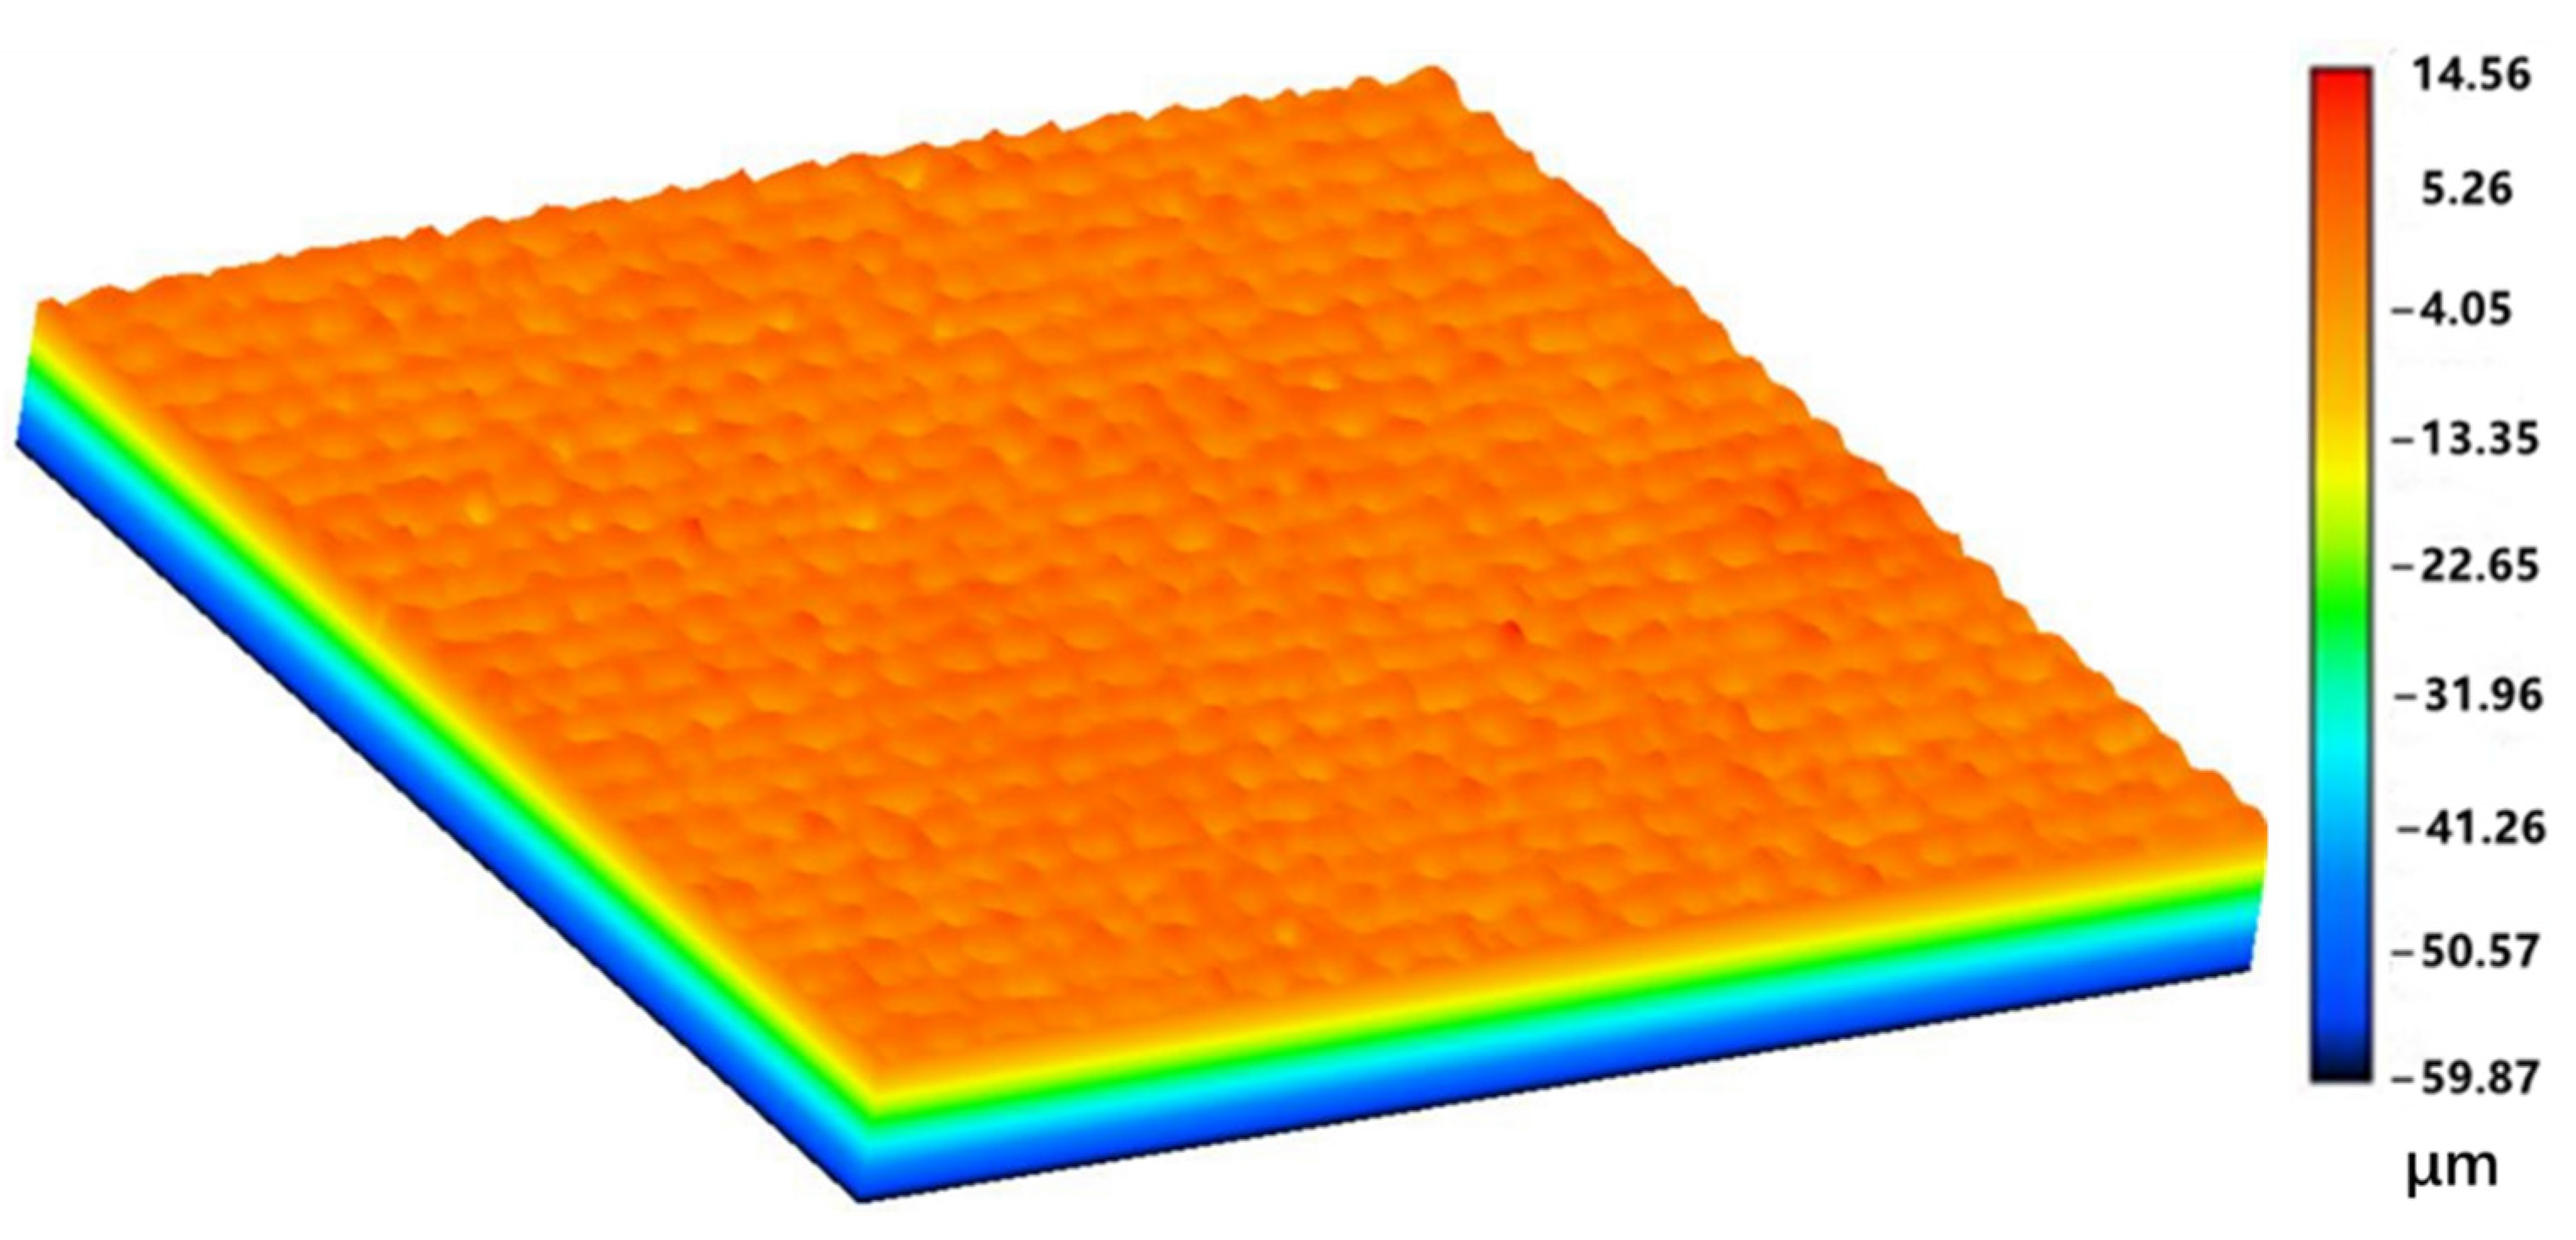
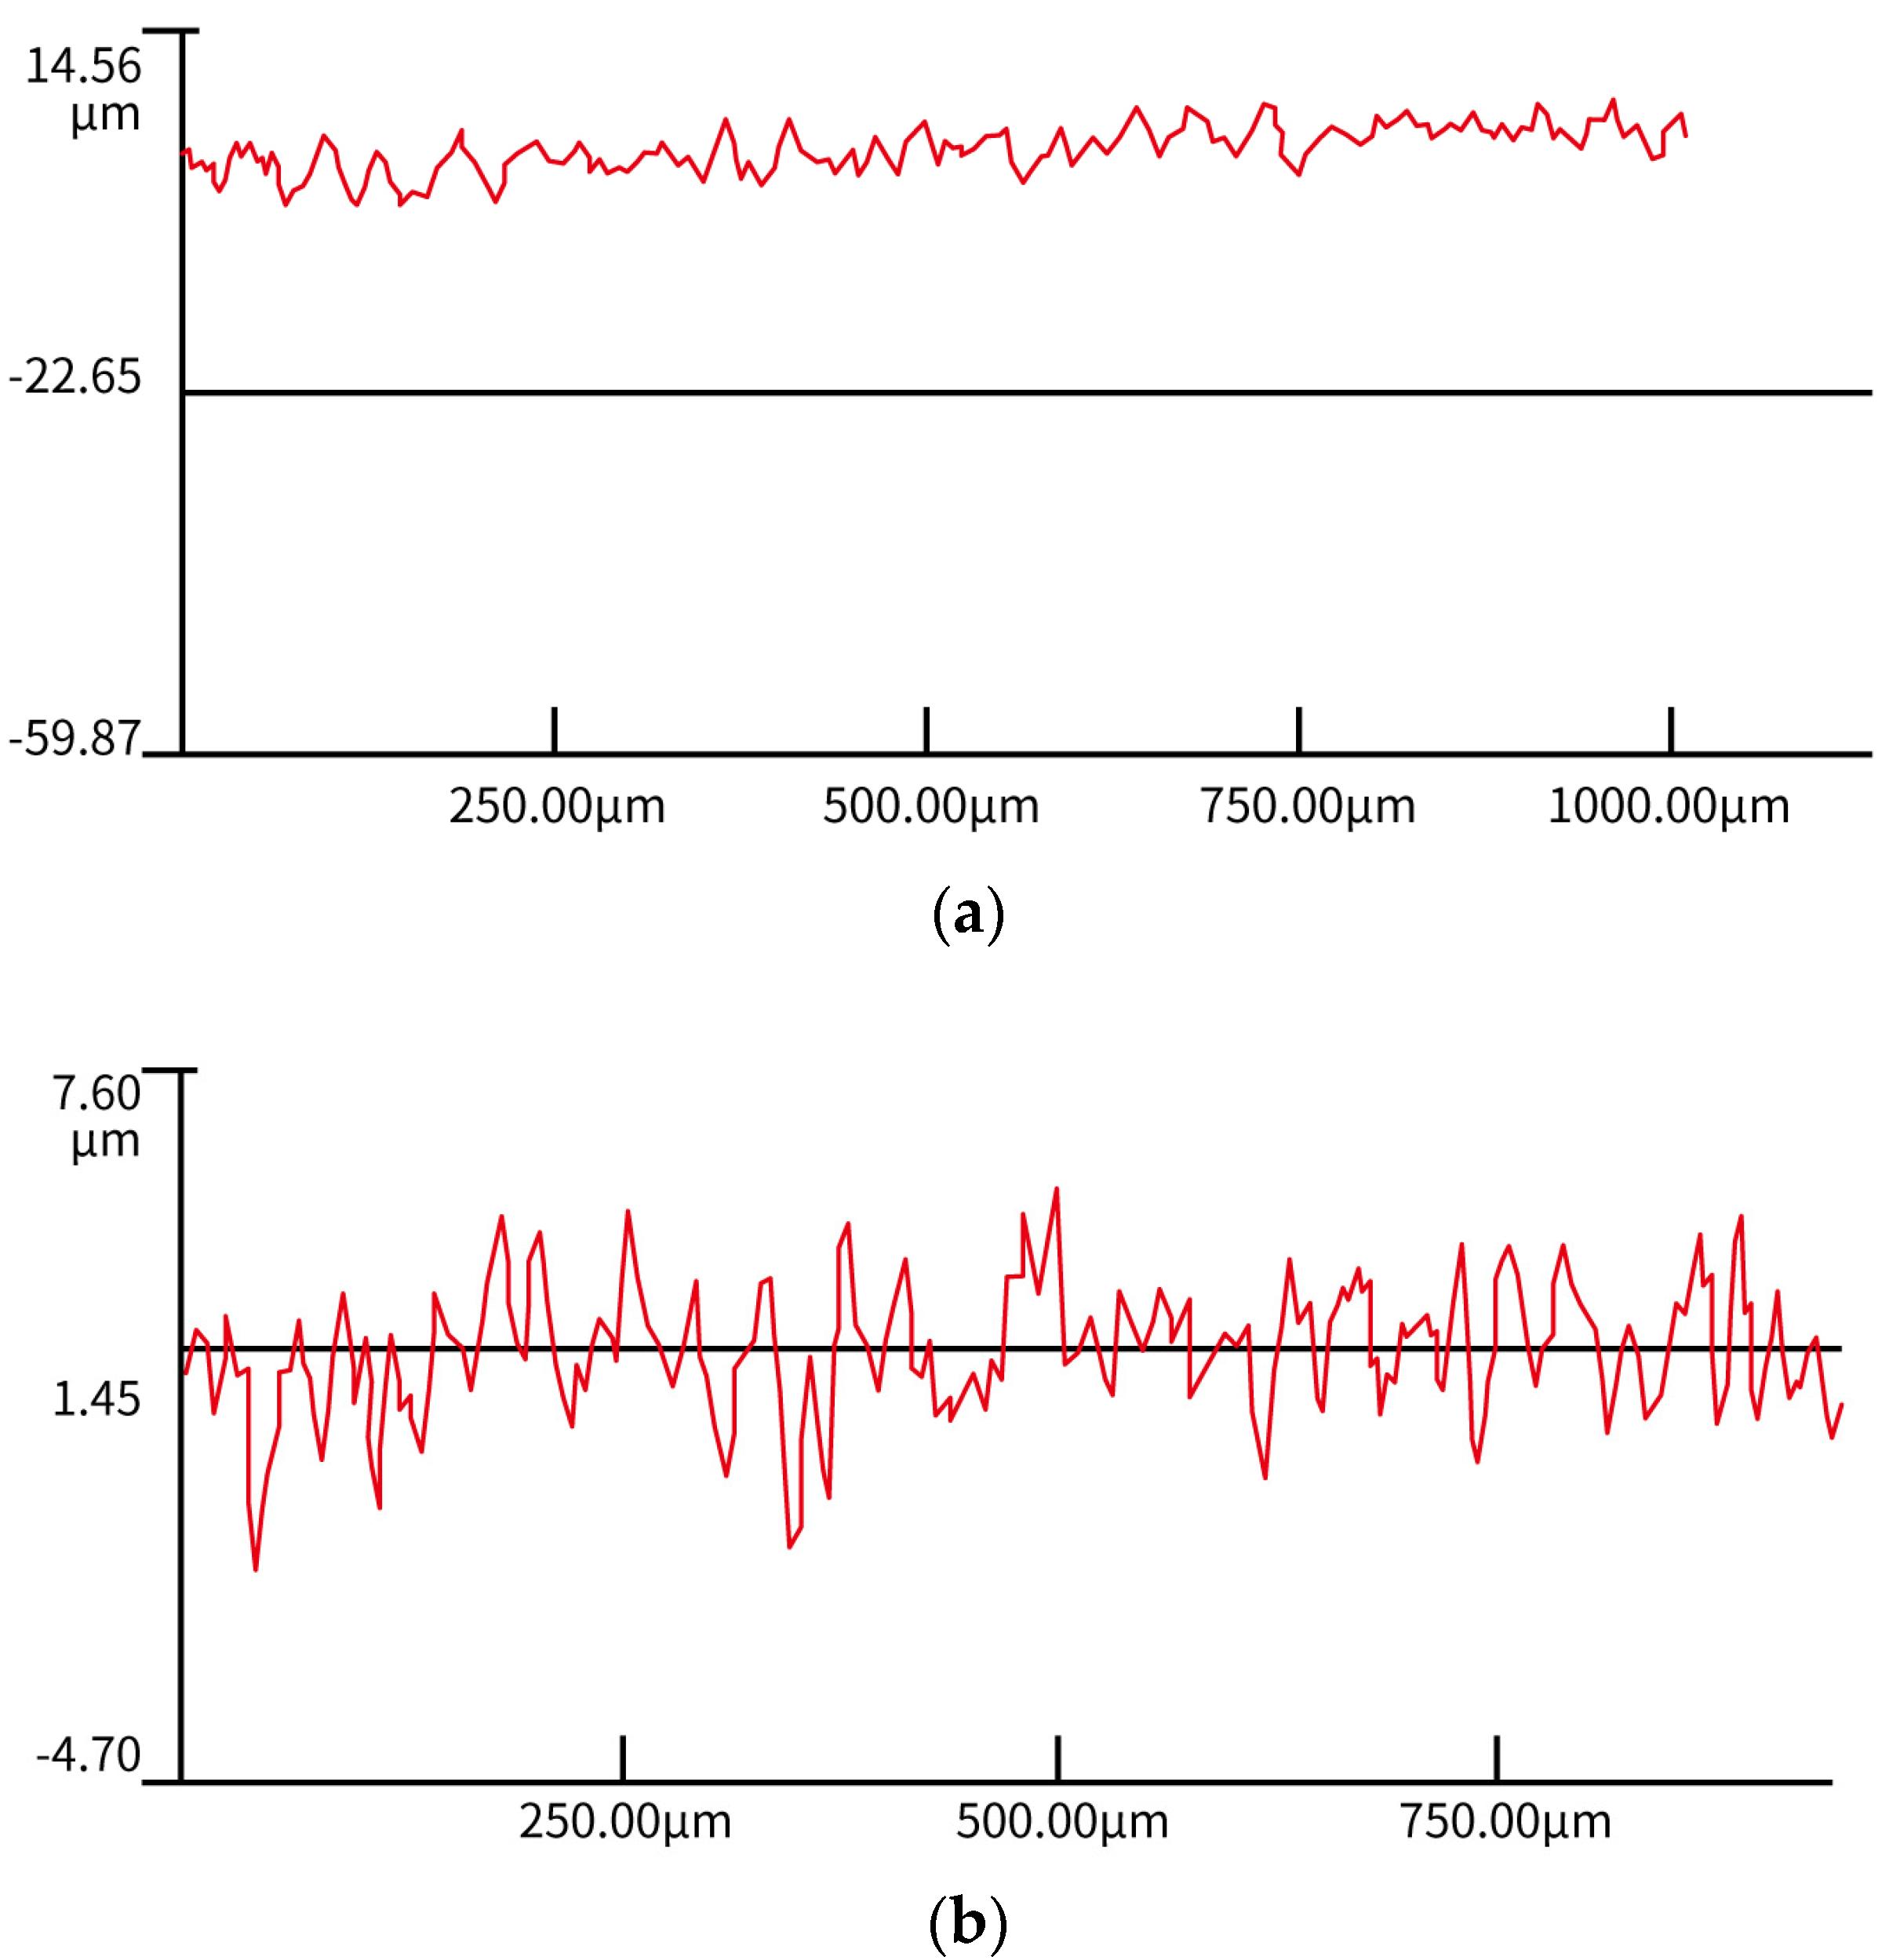
2.2. Roughness and Contact Angle Measurements
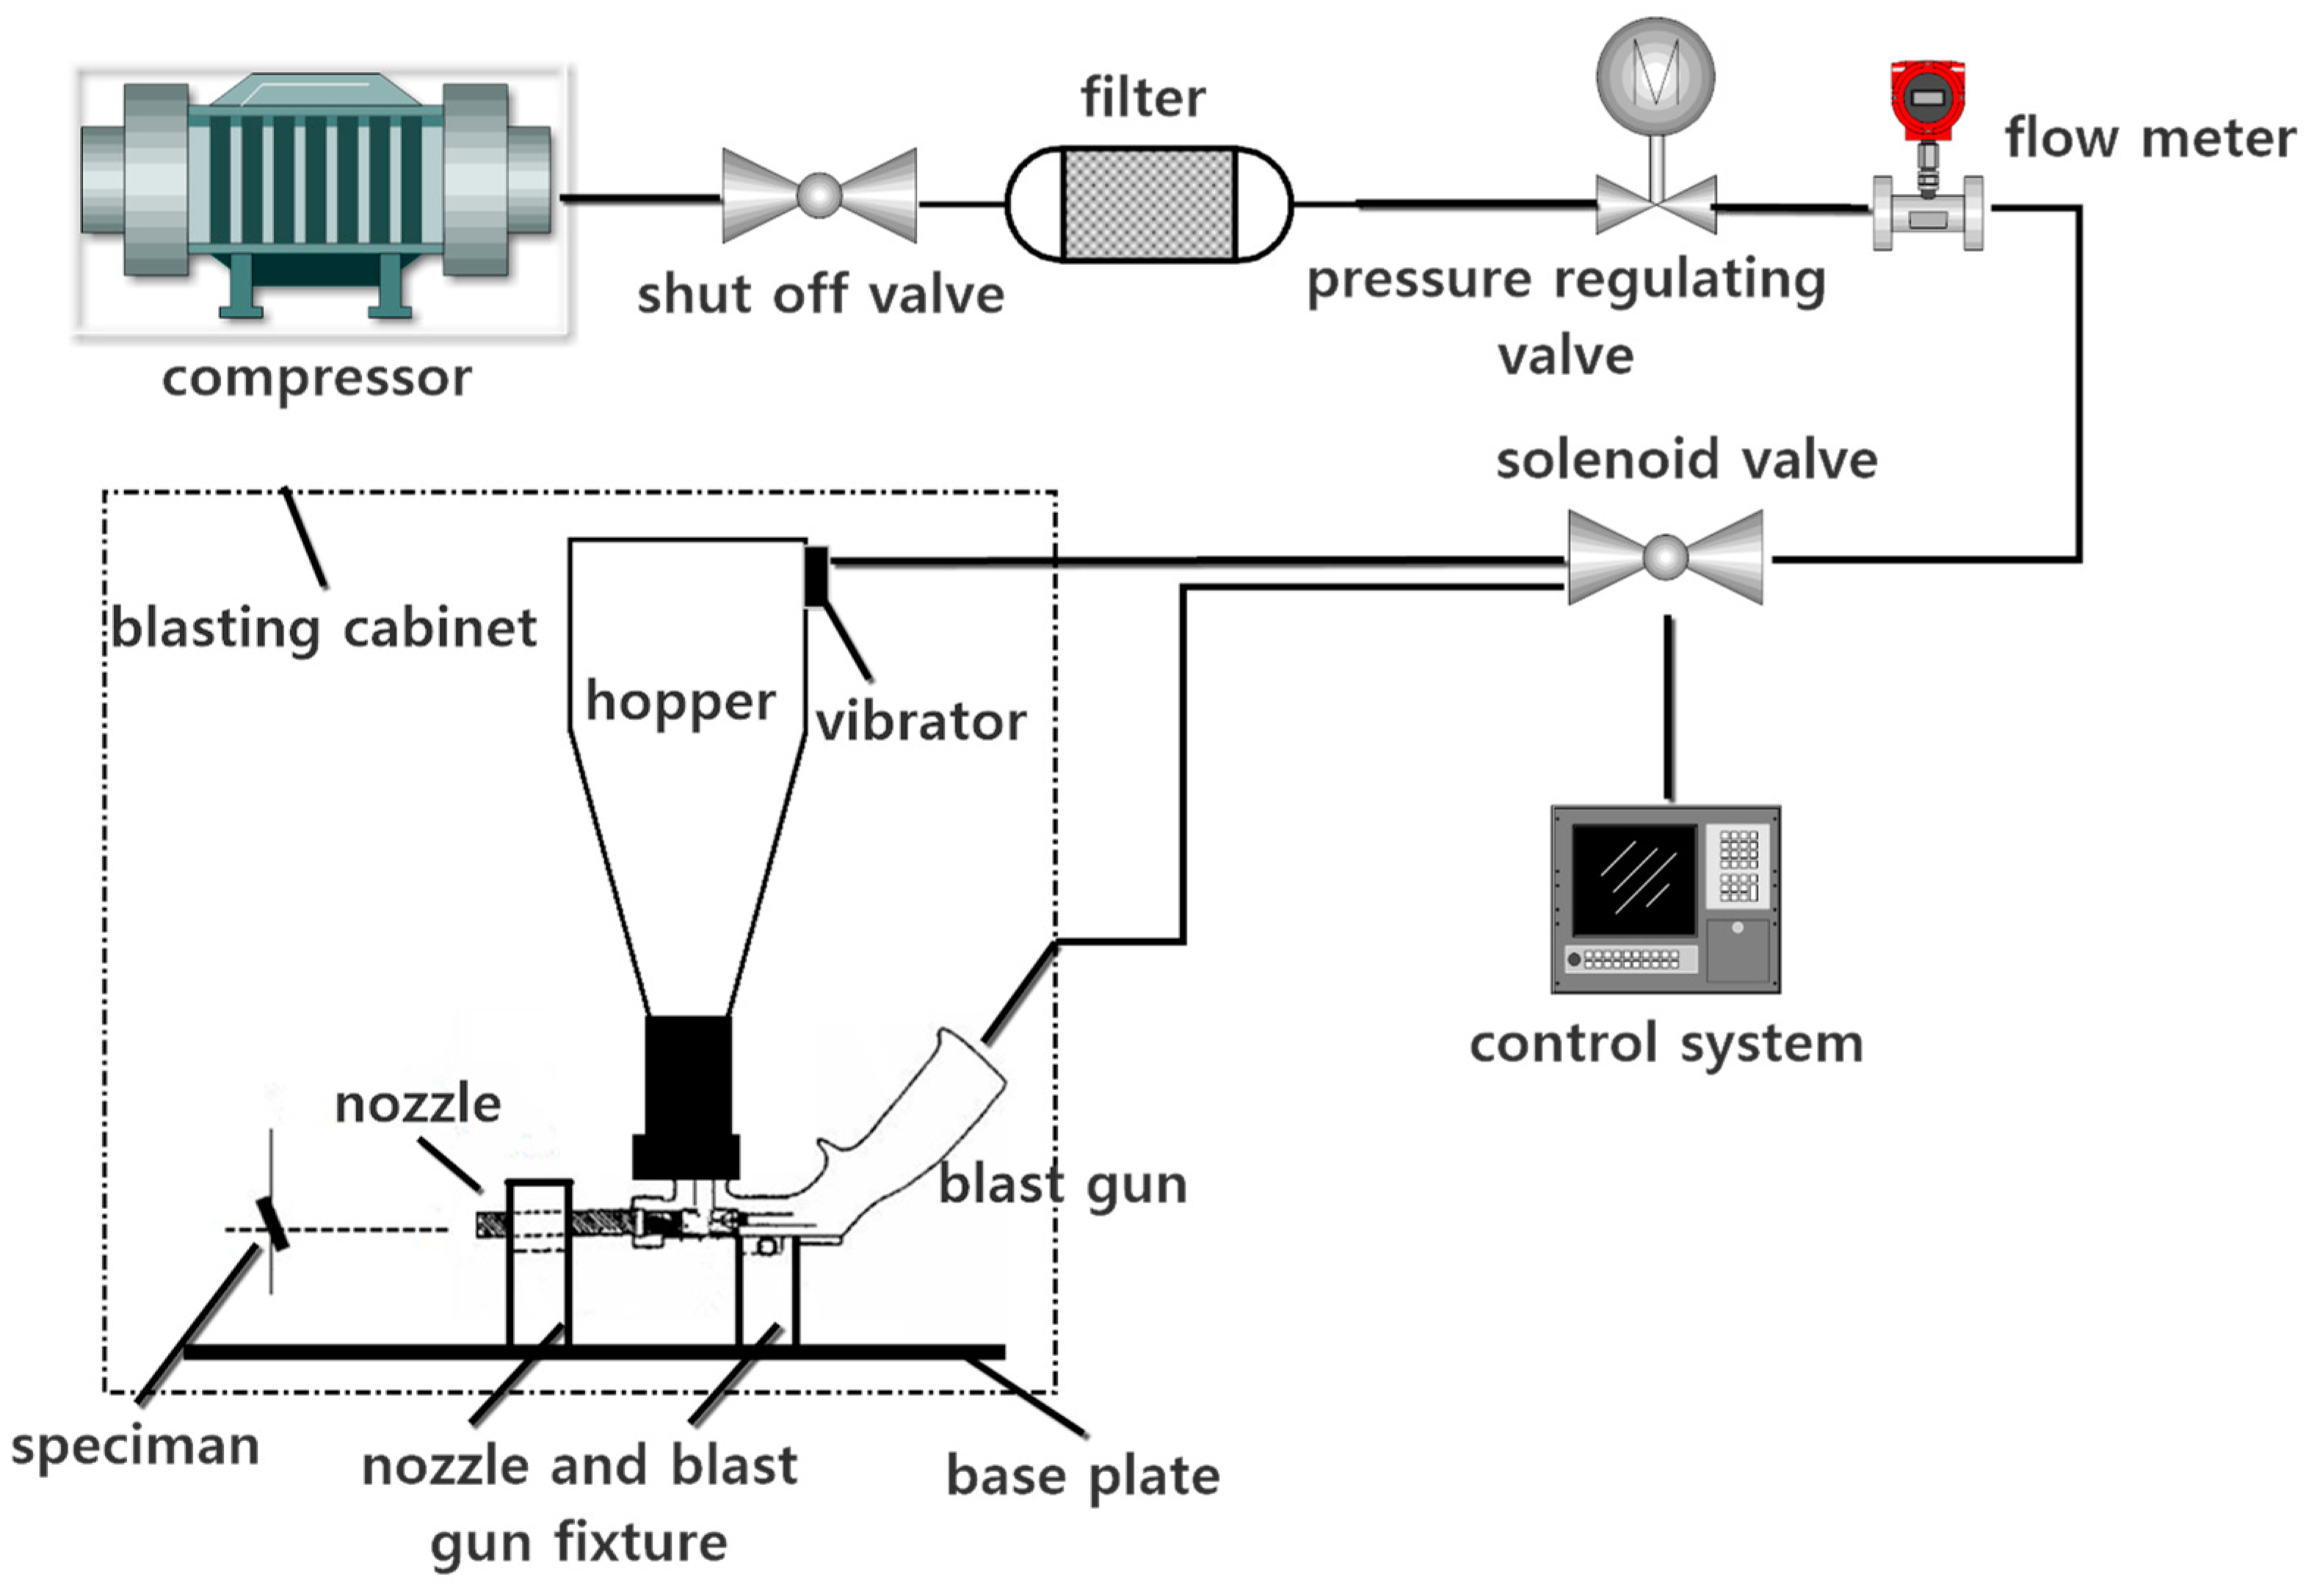
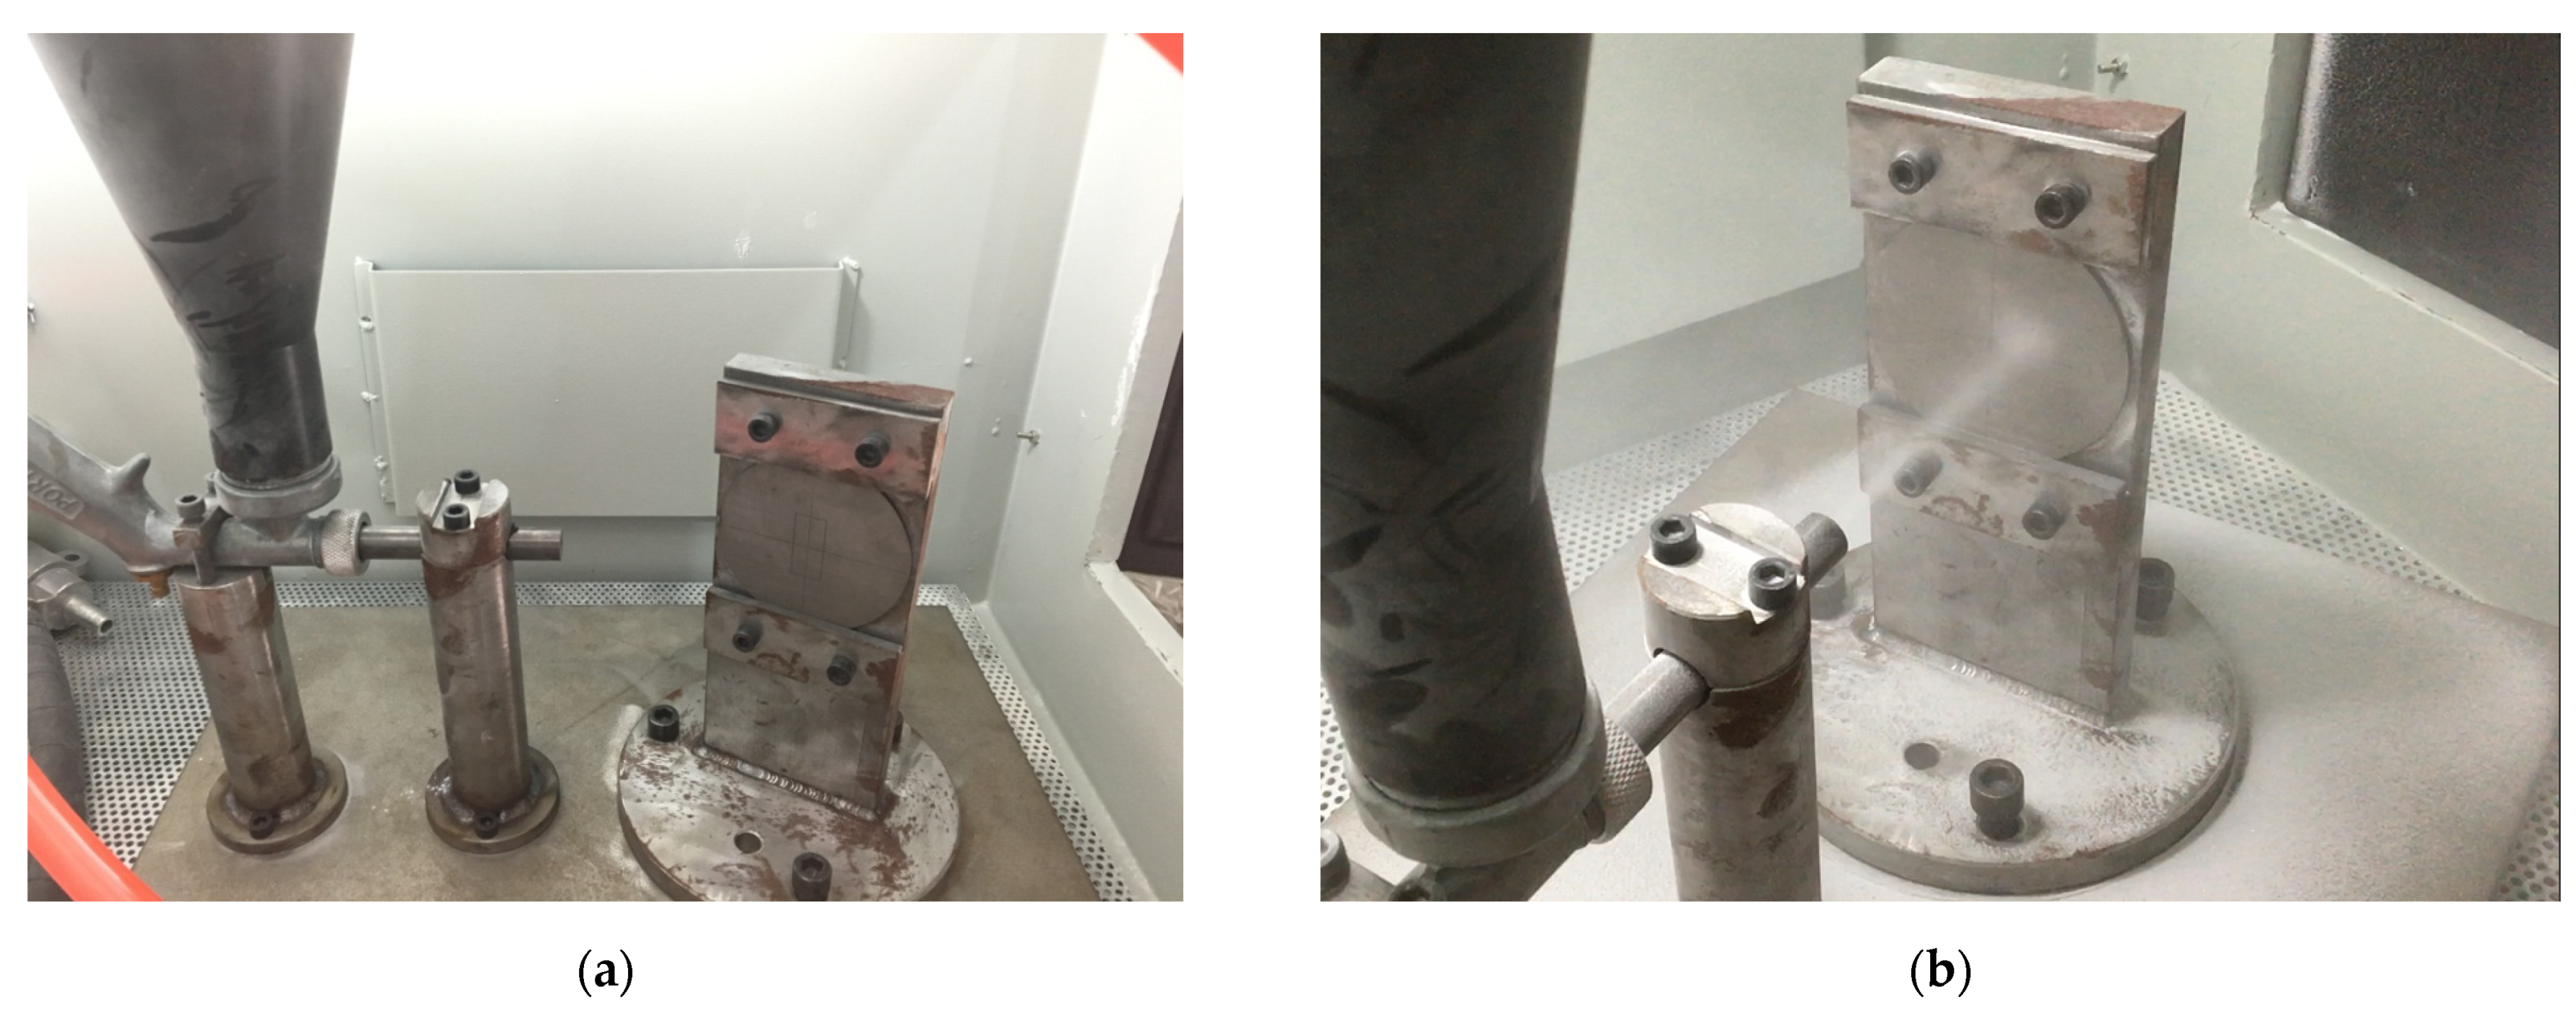
2.3. Sand Erosion Test
2.4. Pre-Experimental Erosion Test Bench Calibration
3. Results
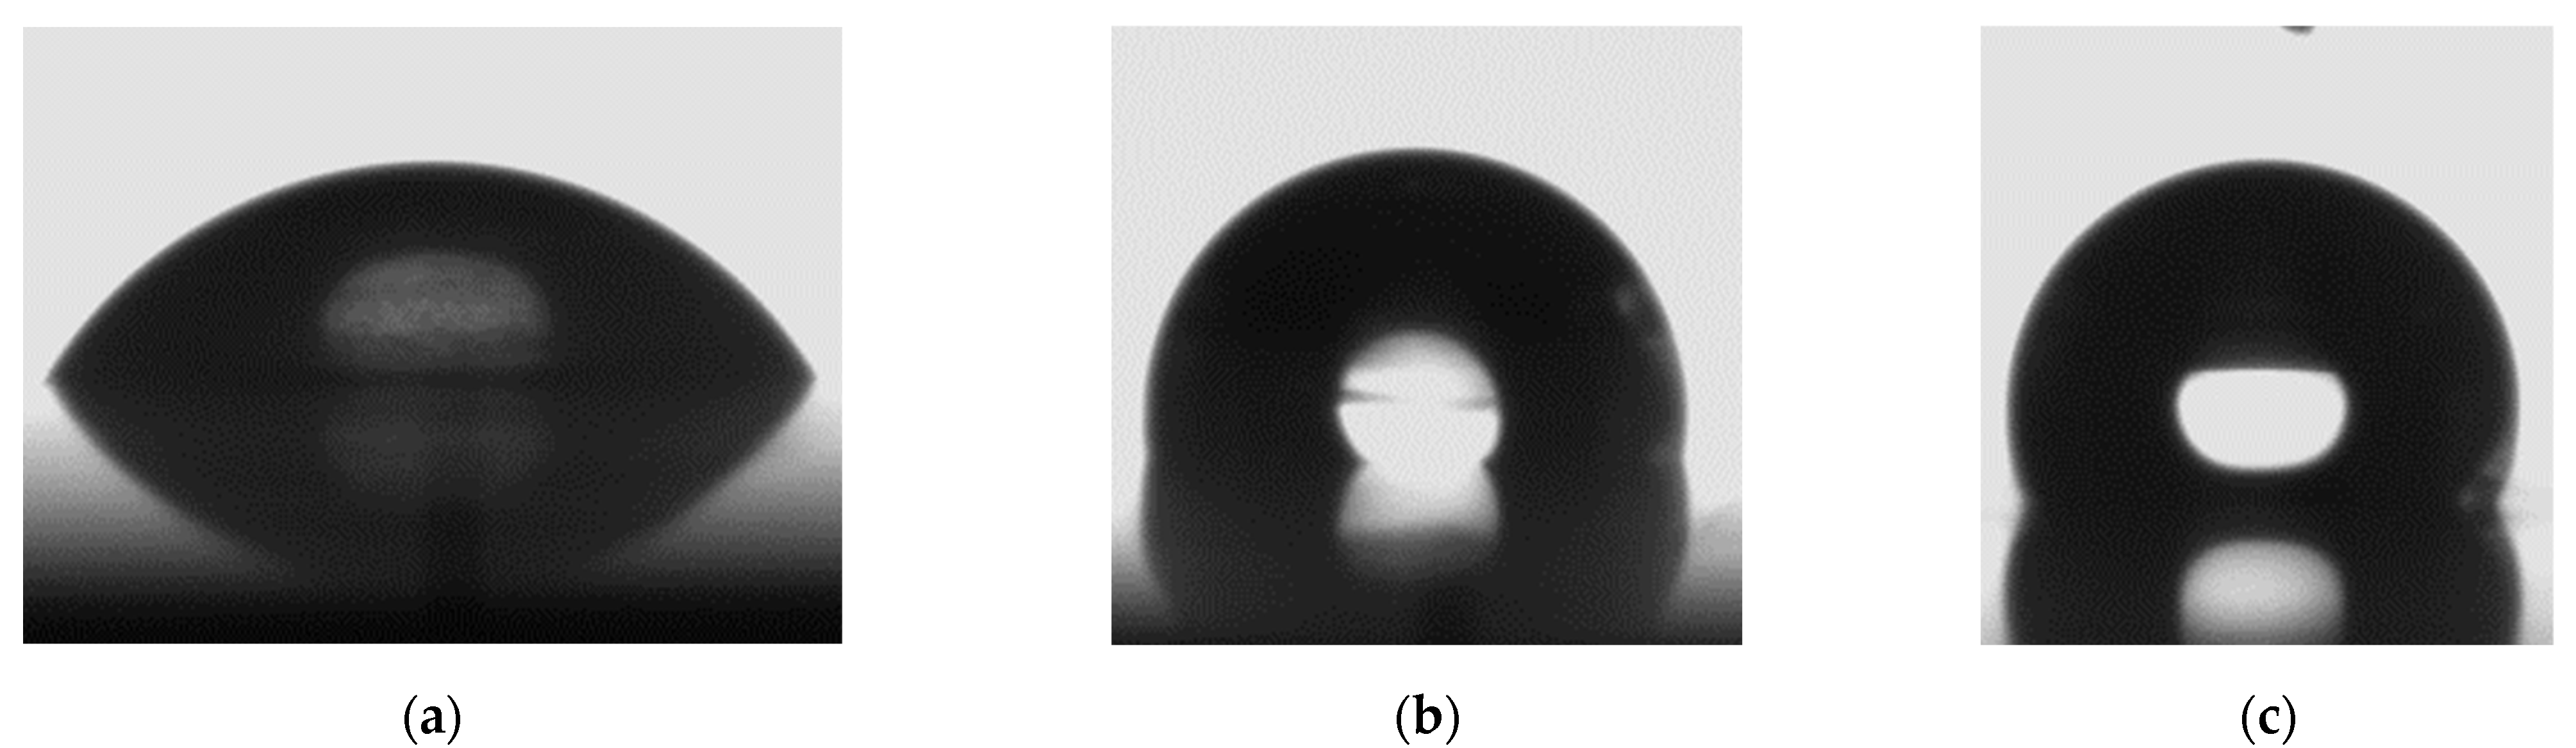
3.1. Surface Roughness and Contact Angle
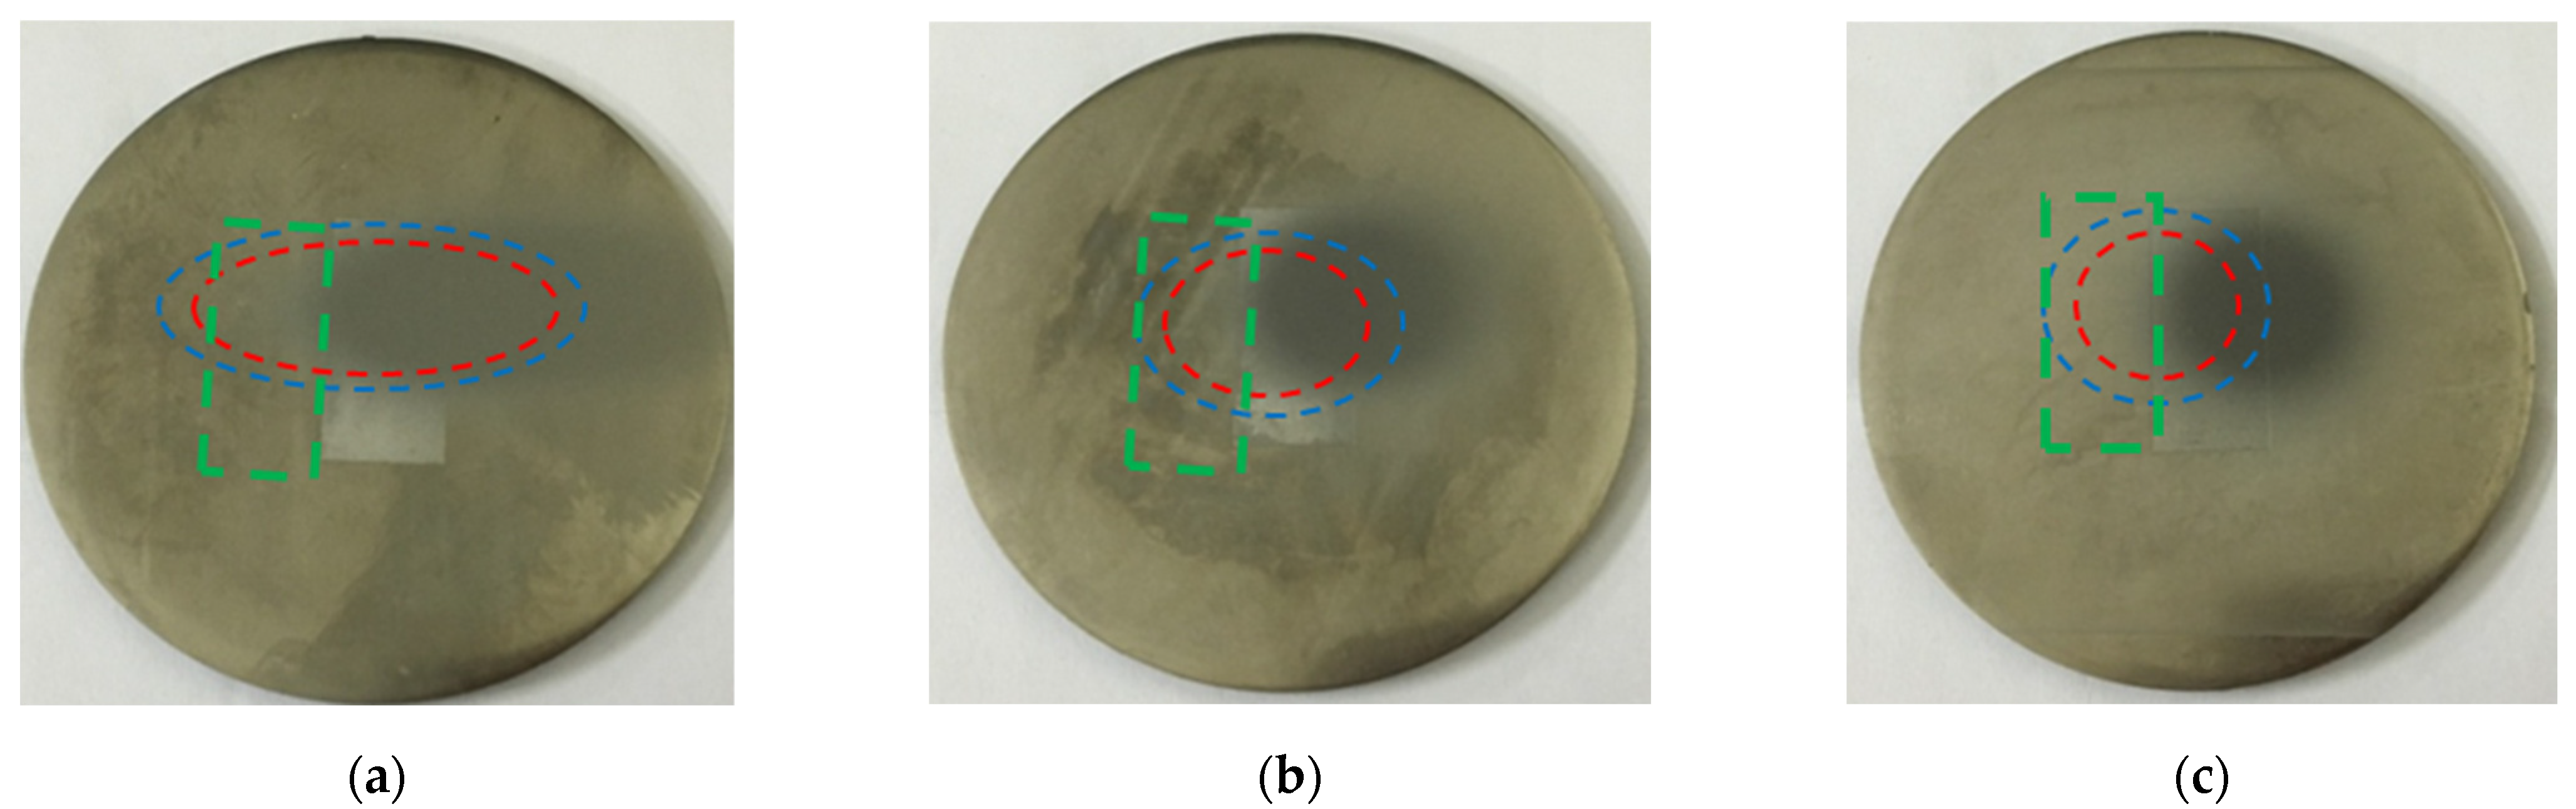
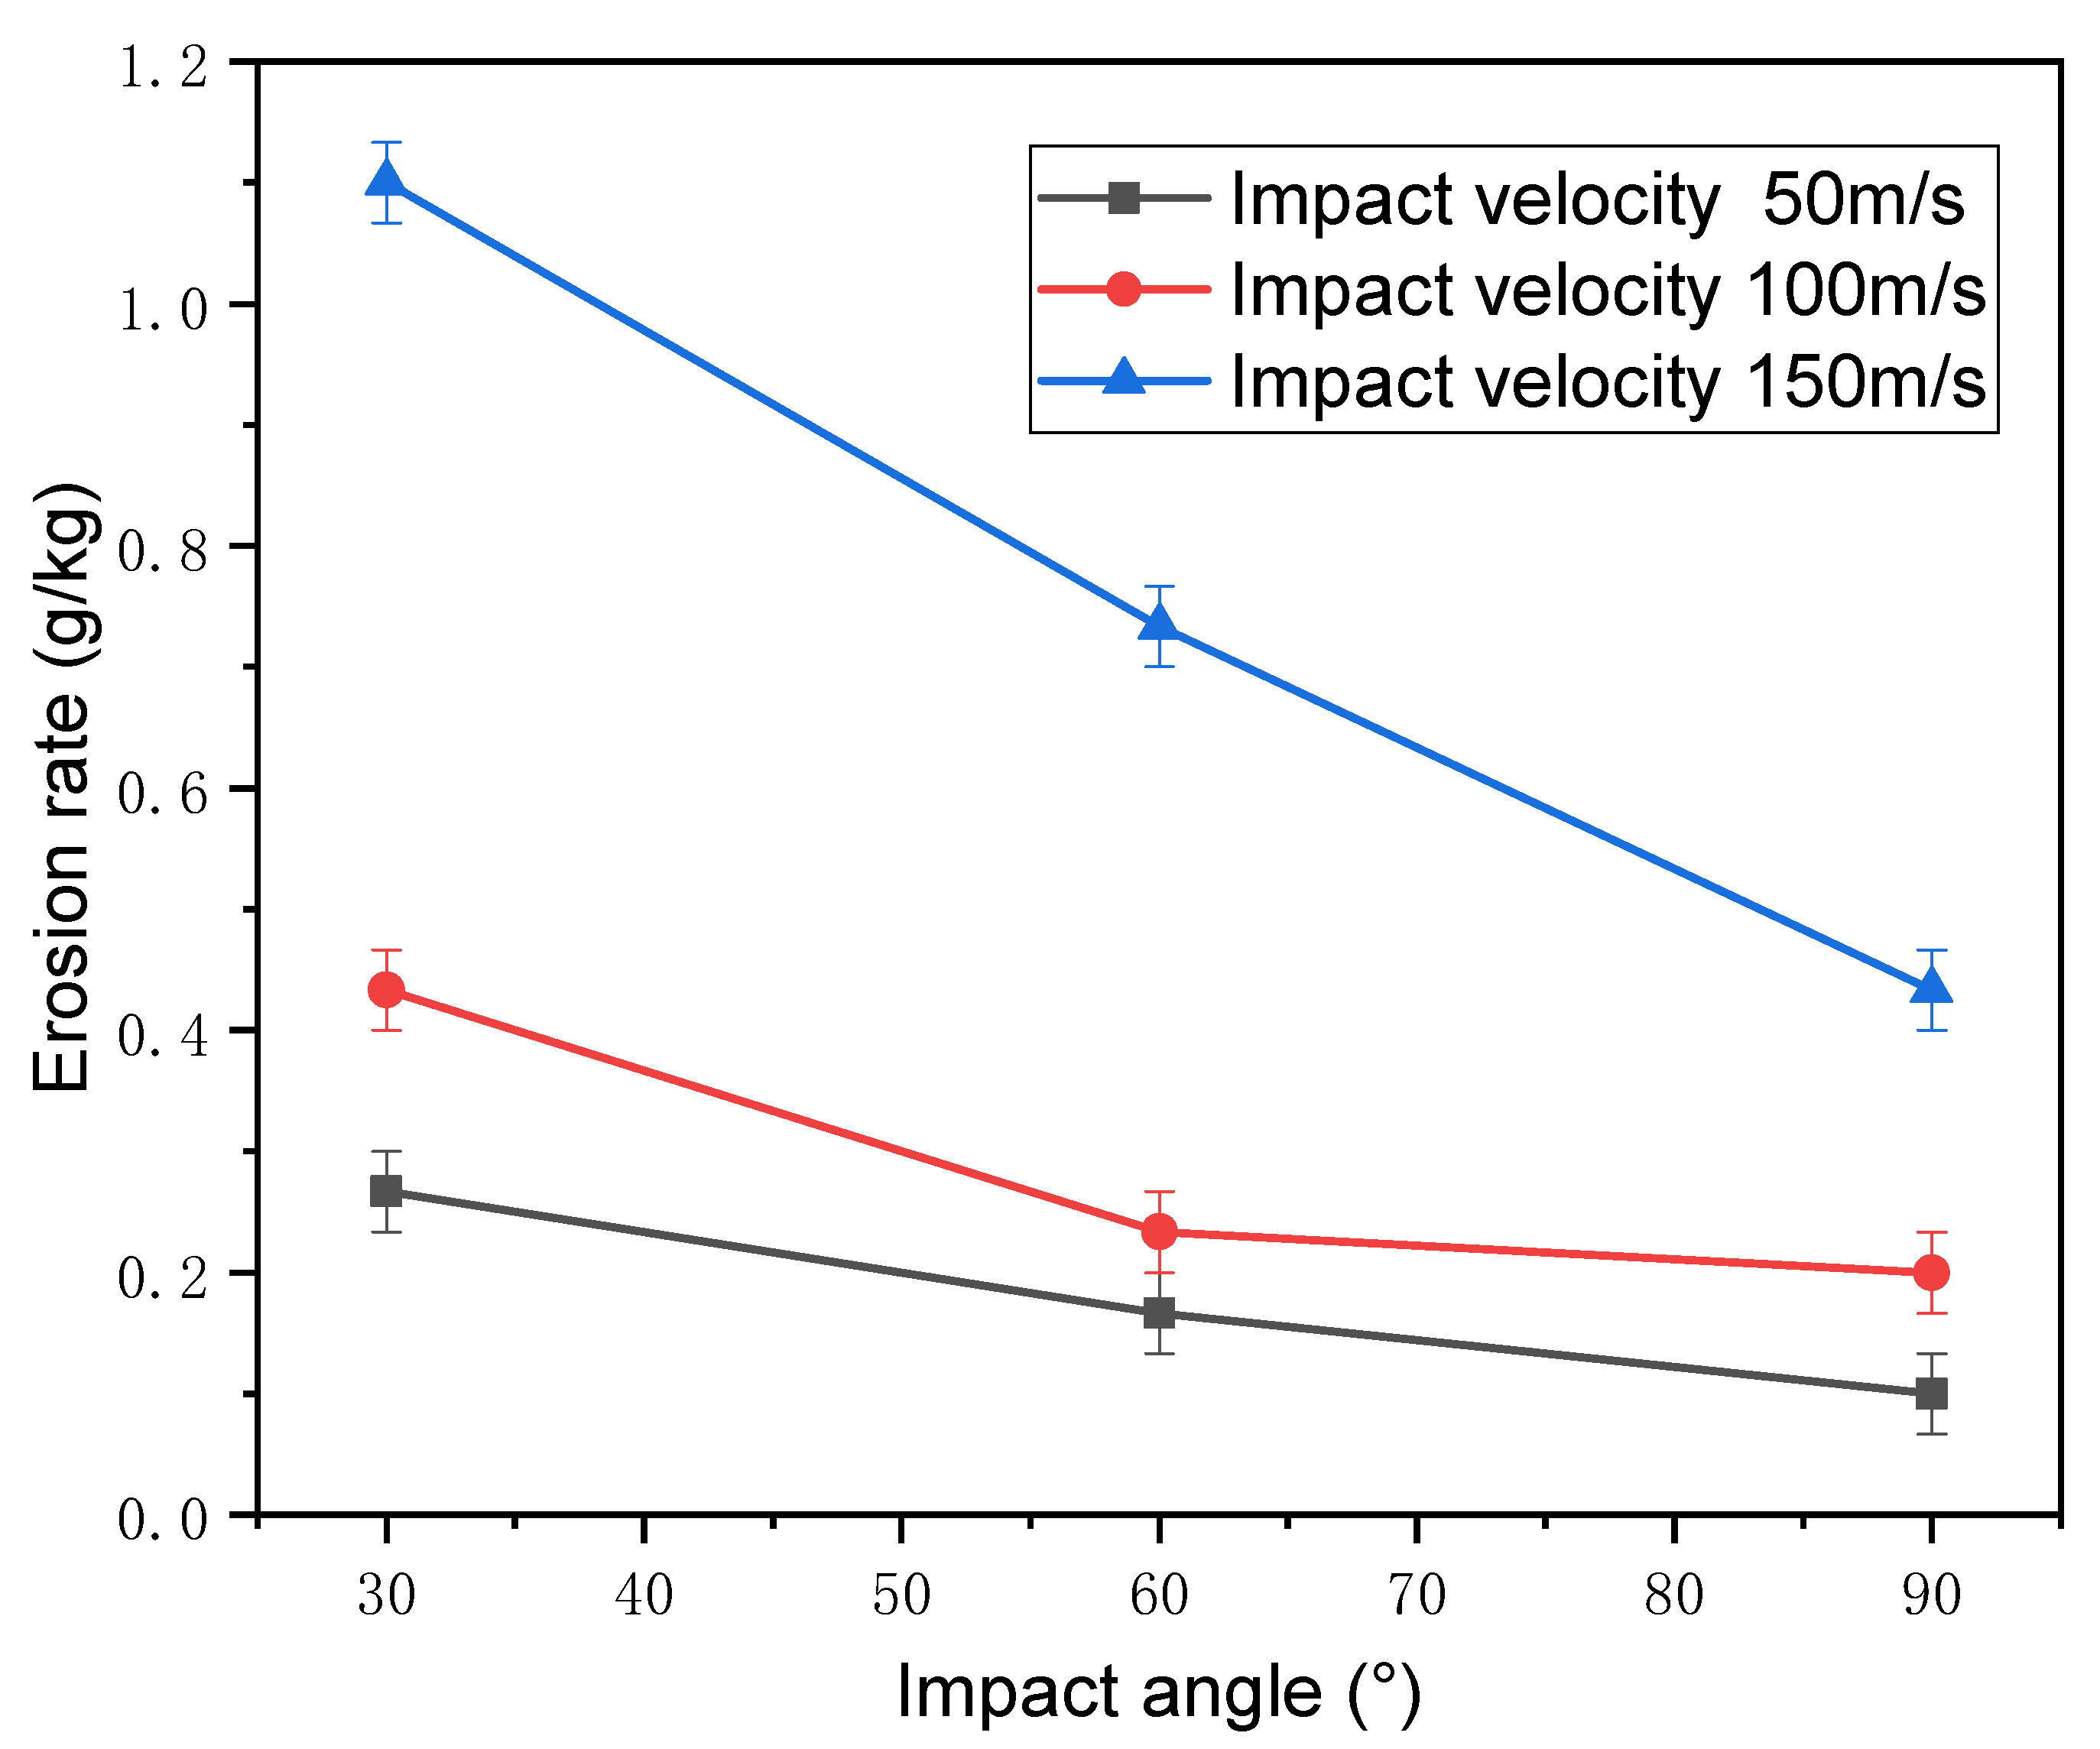
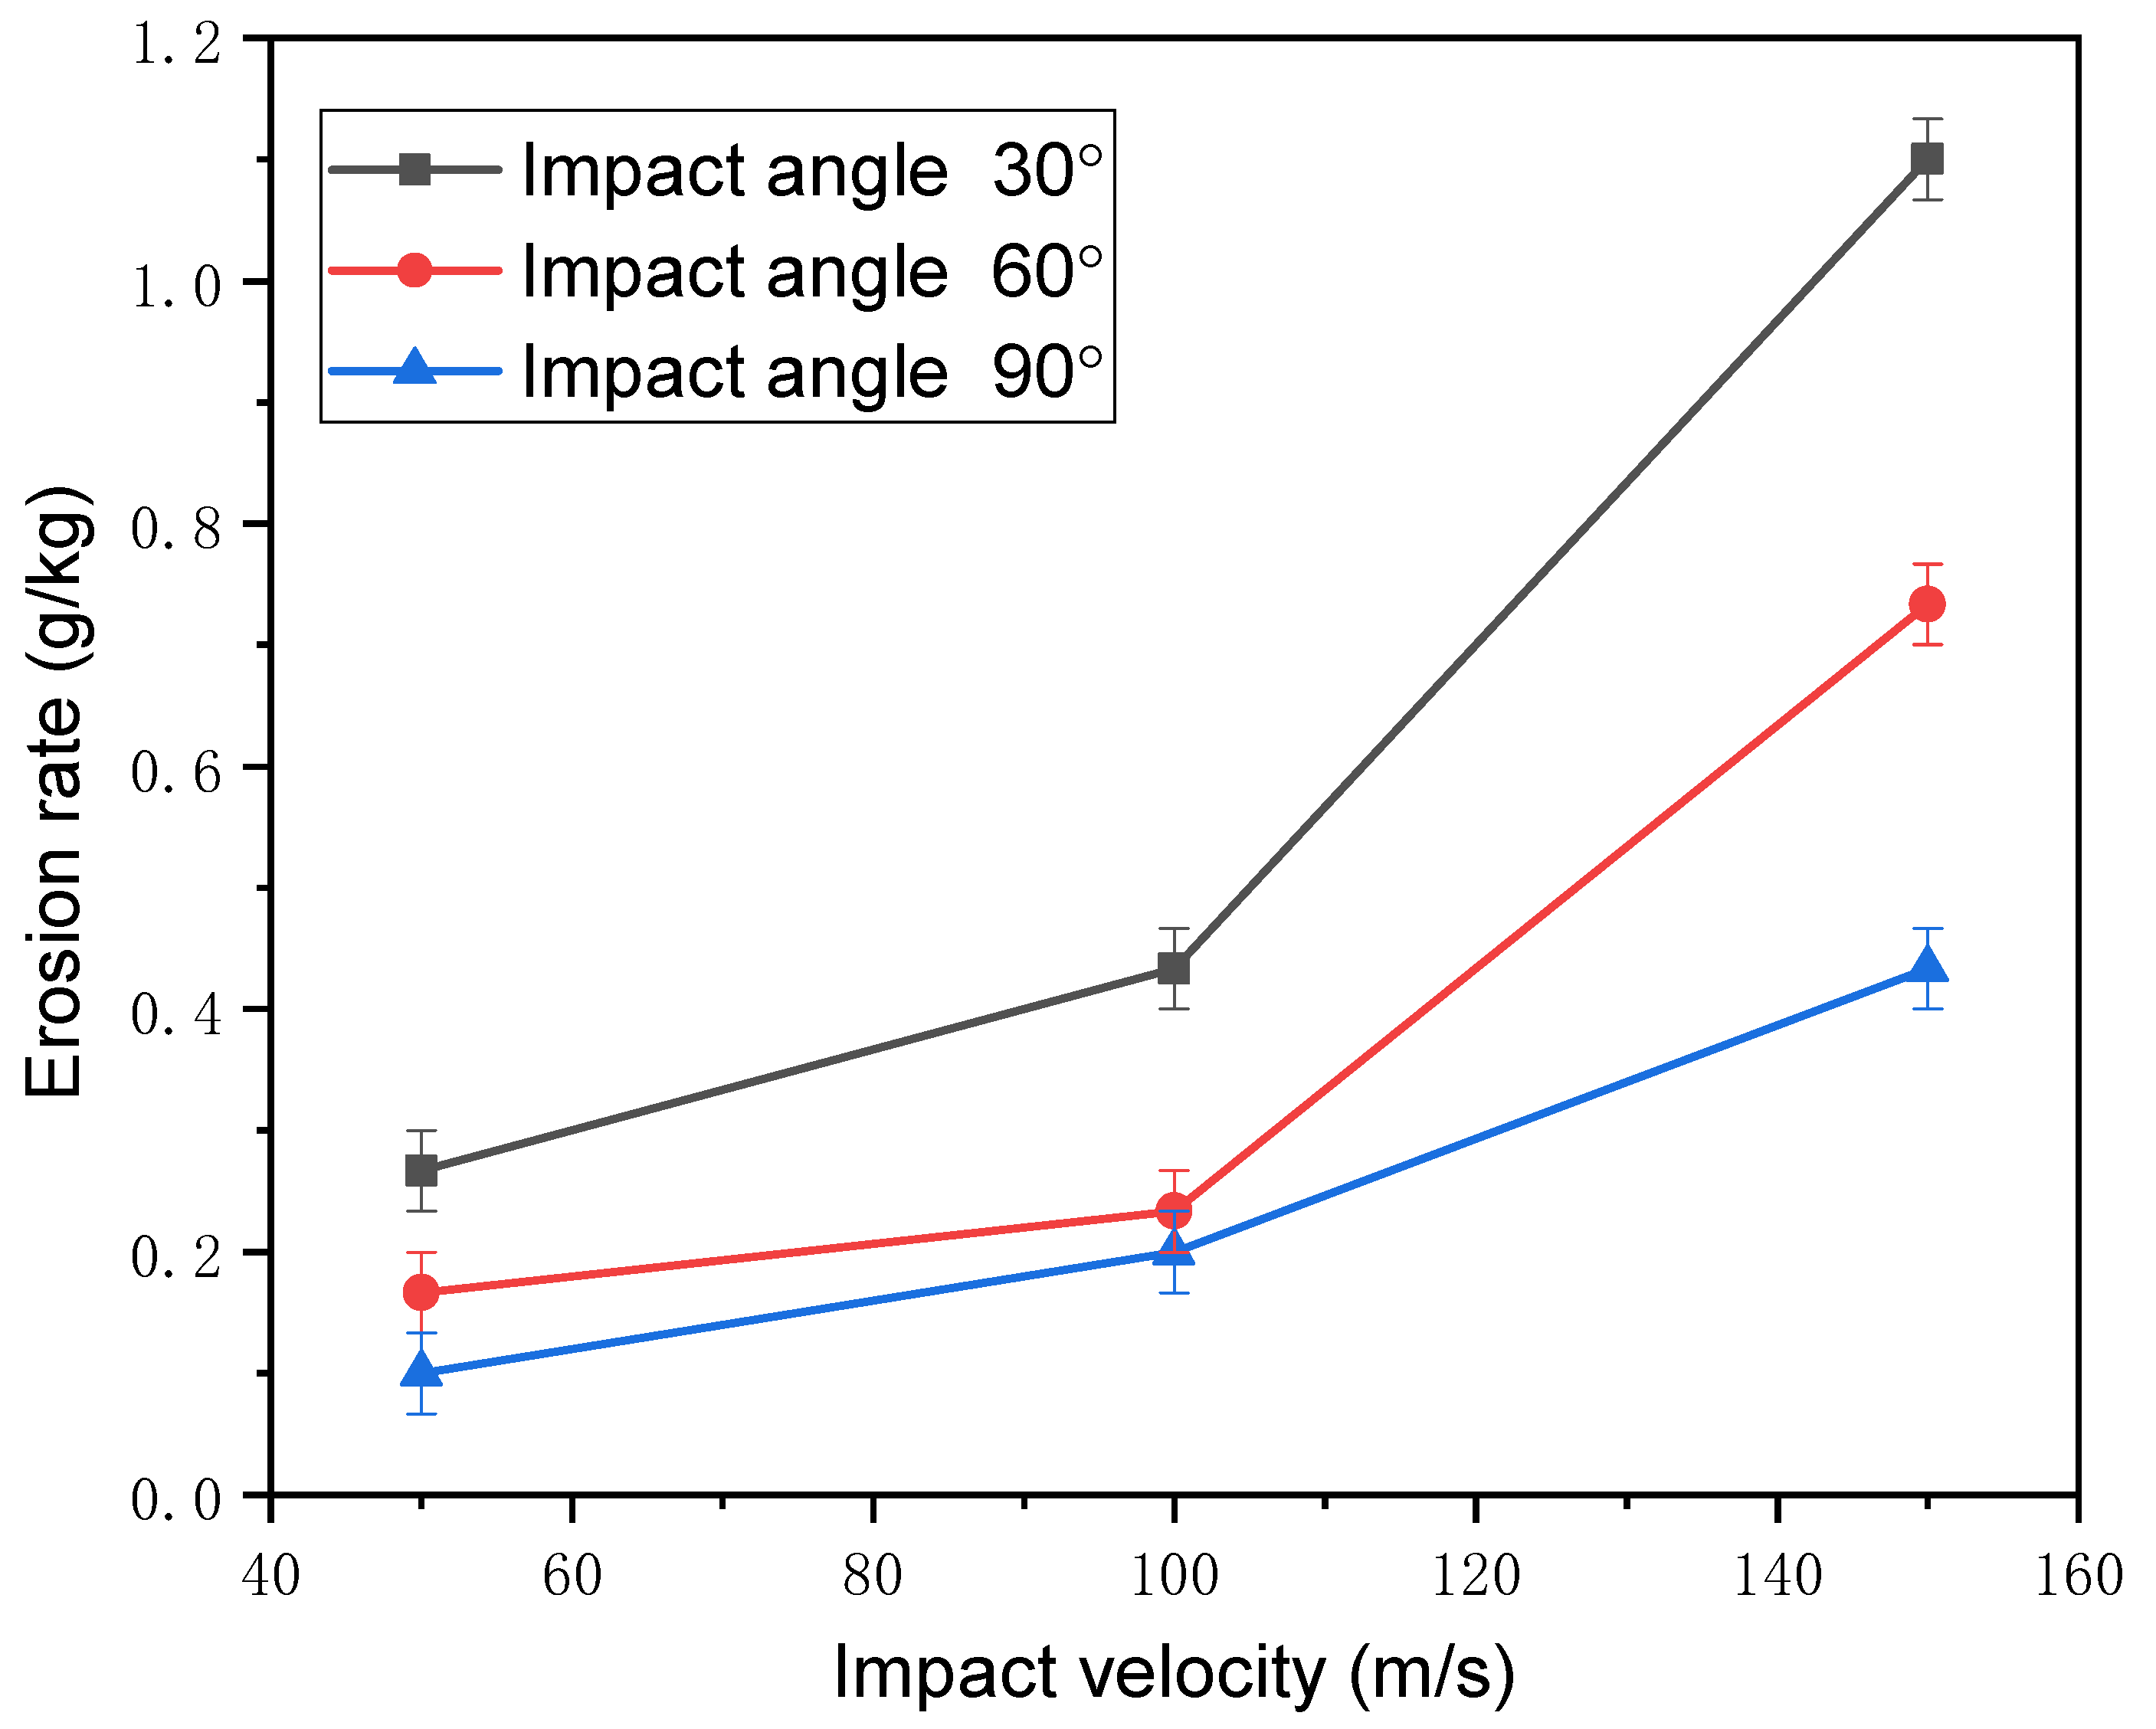
3.2. Macroscale Morphology and Erosion Rate
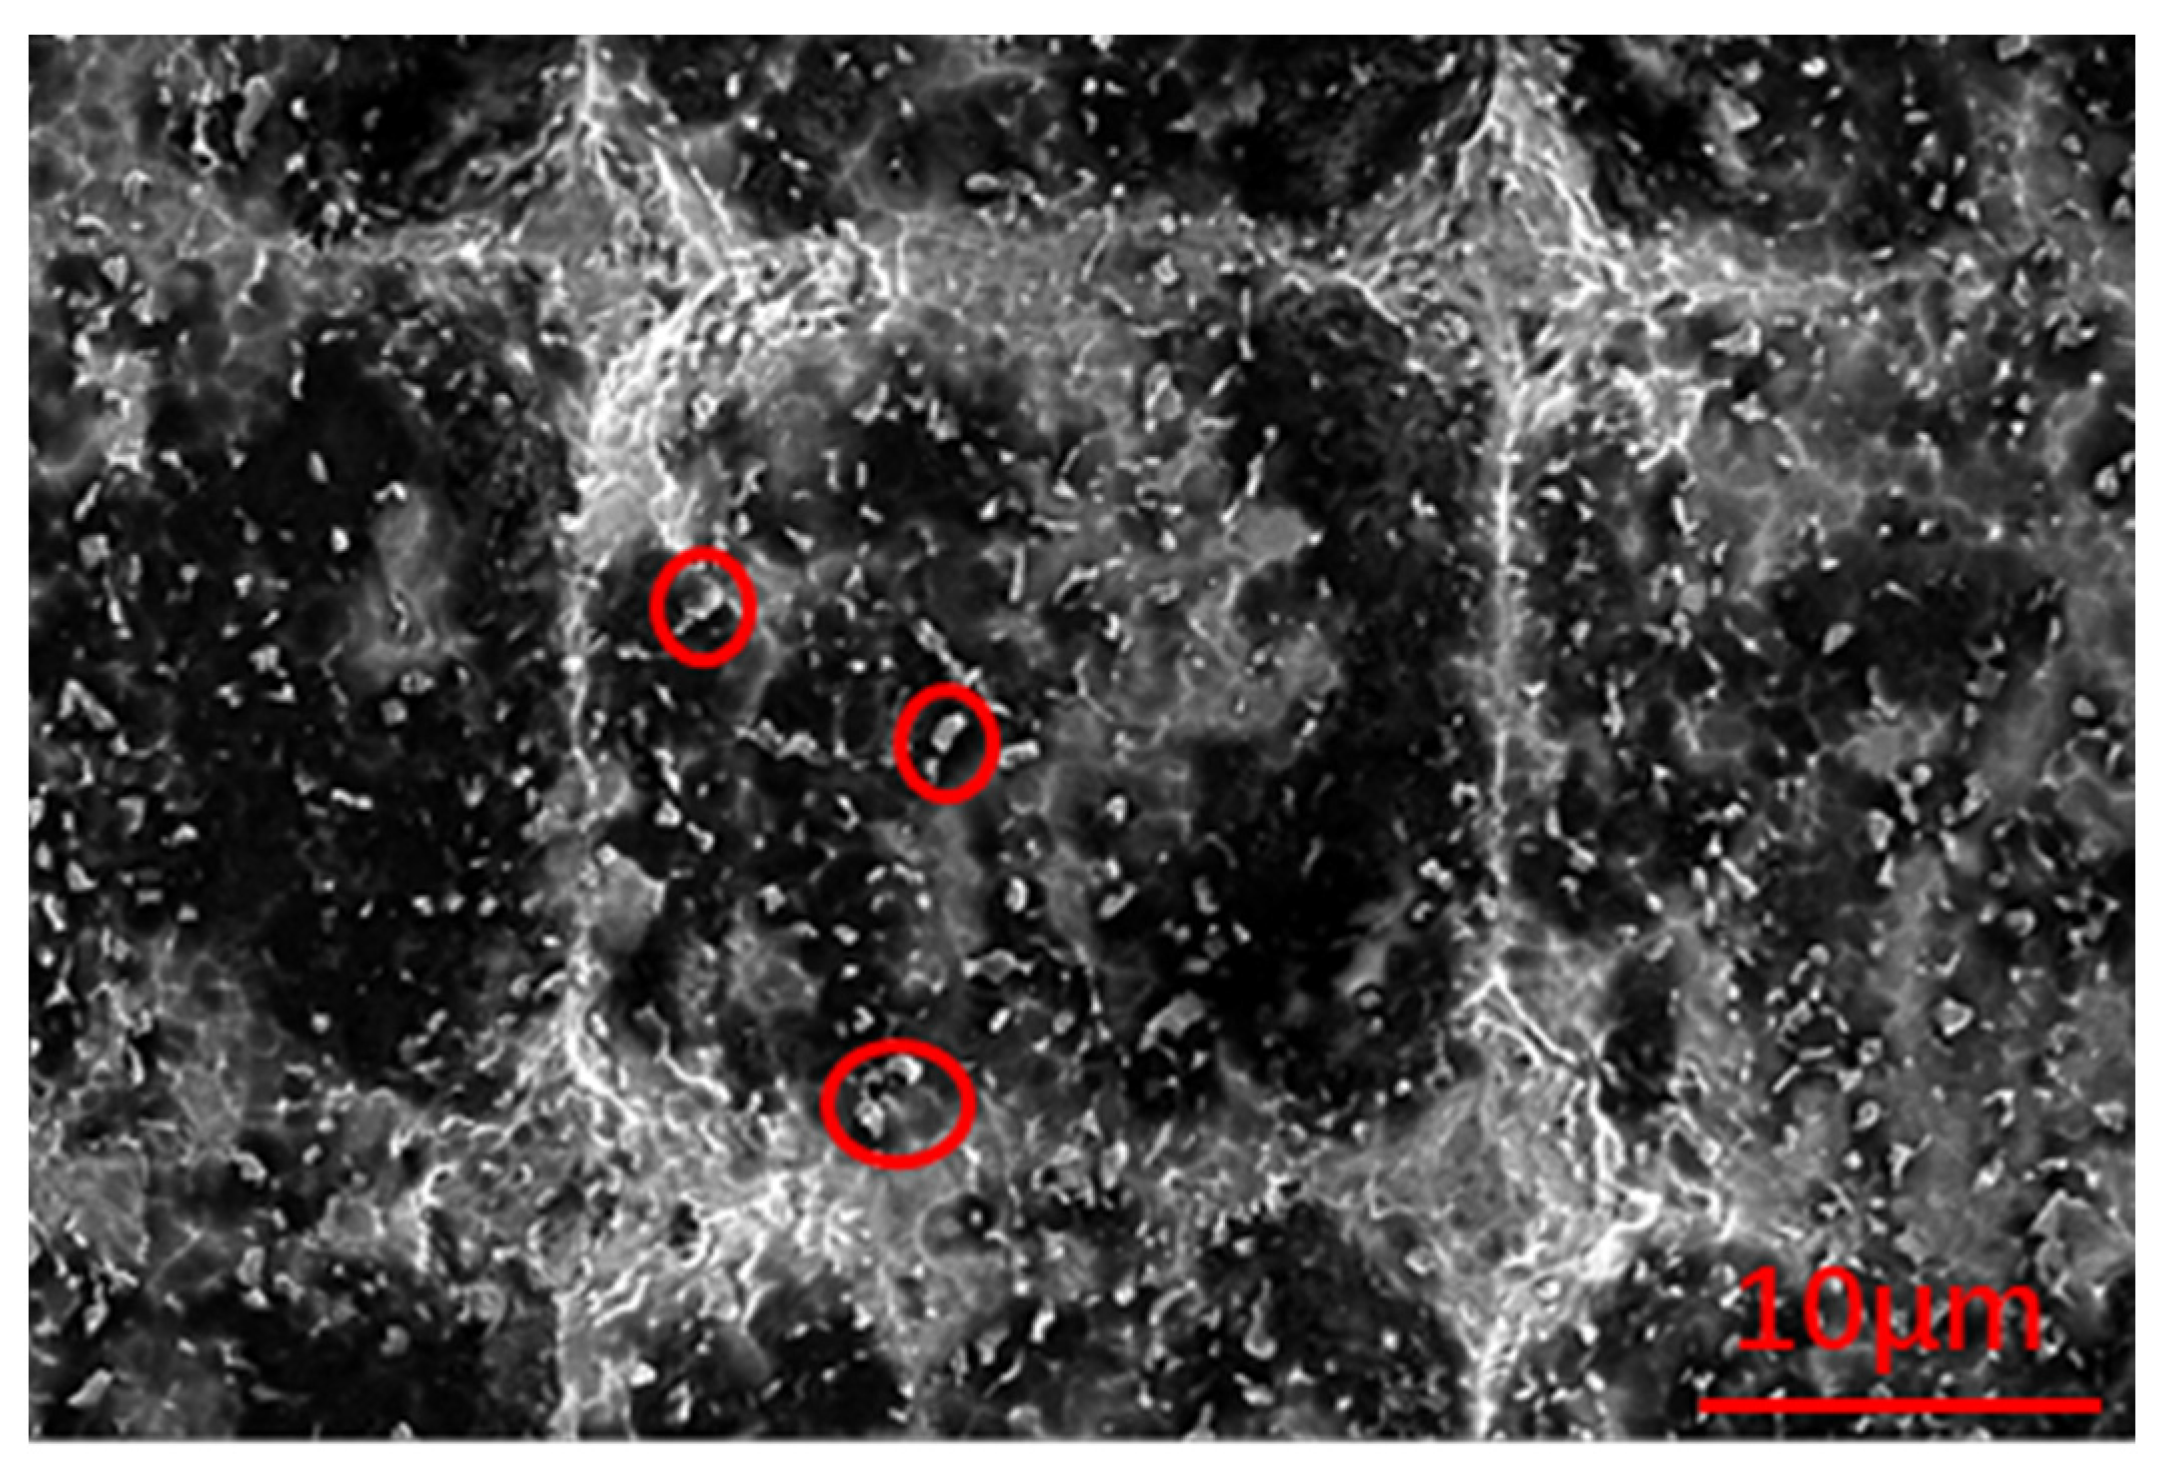
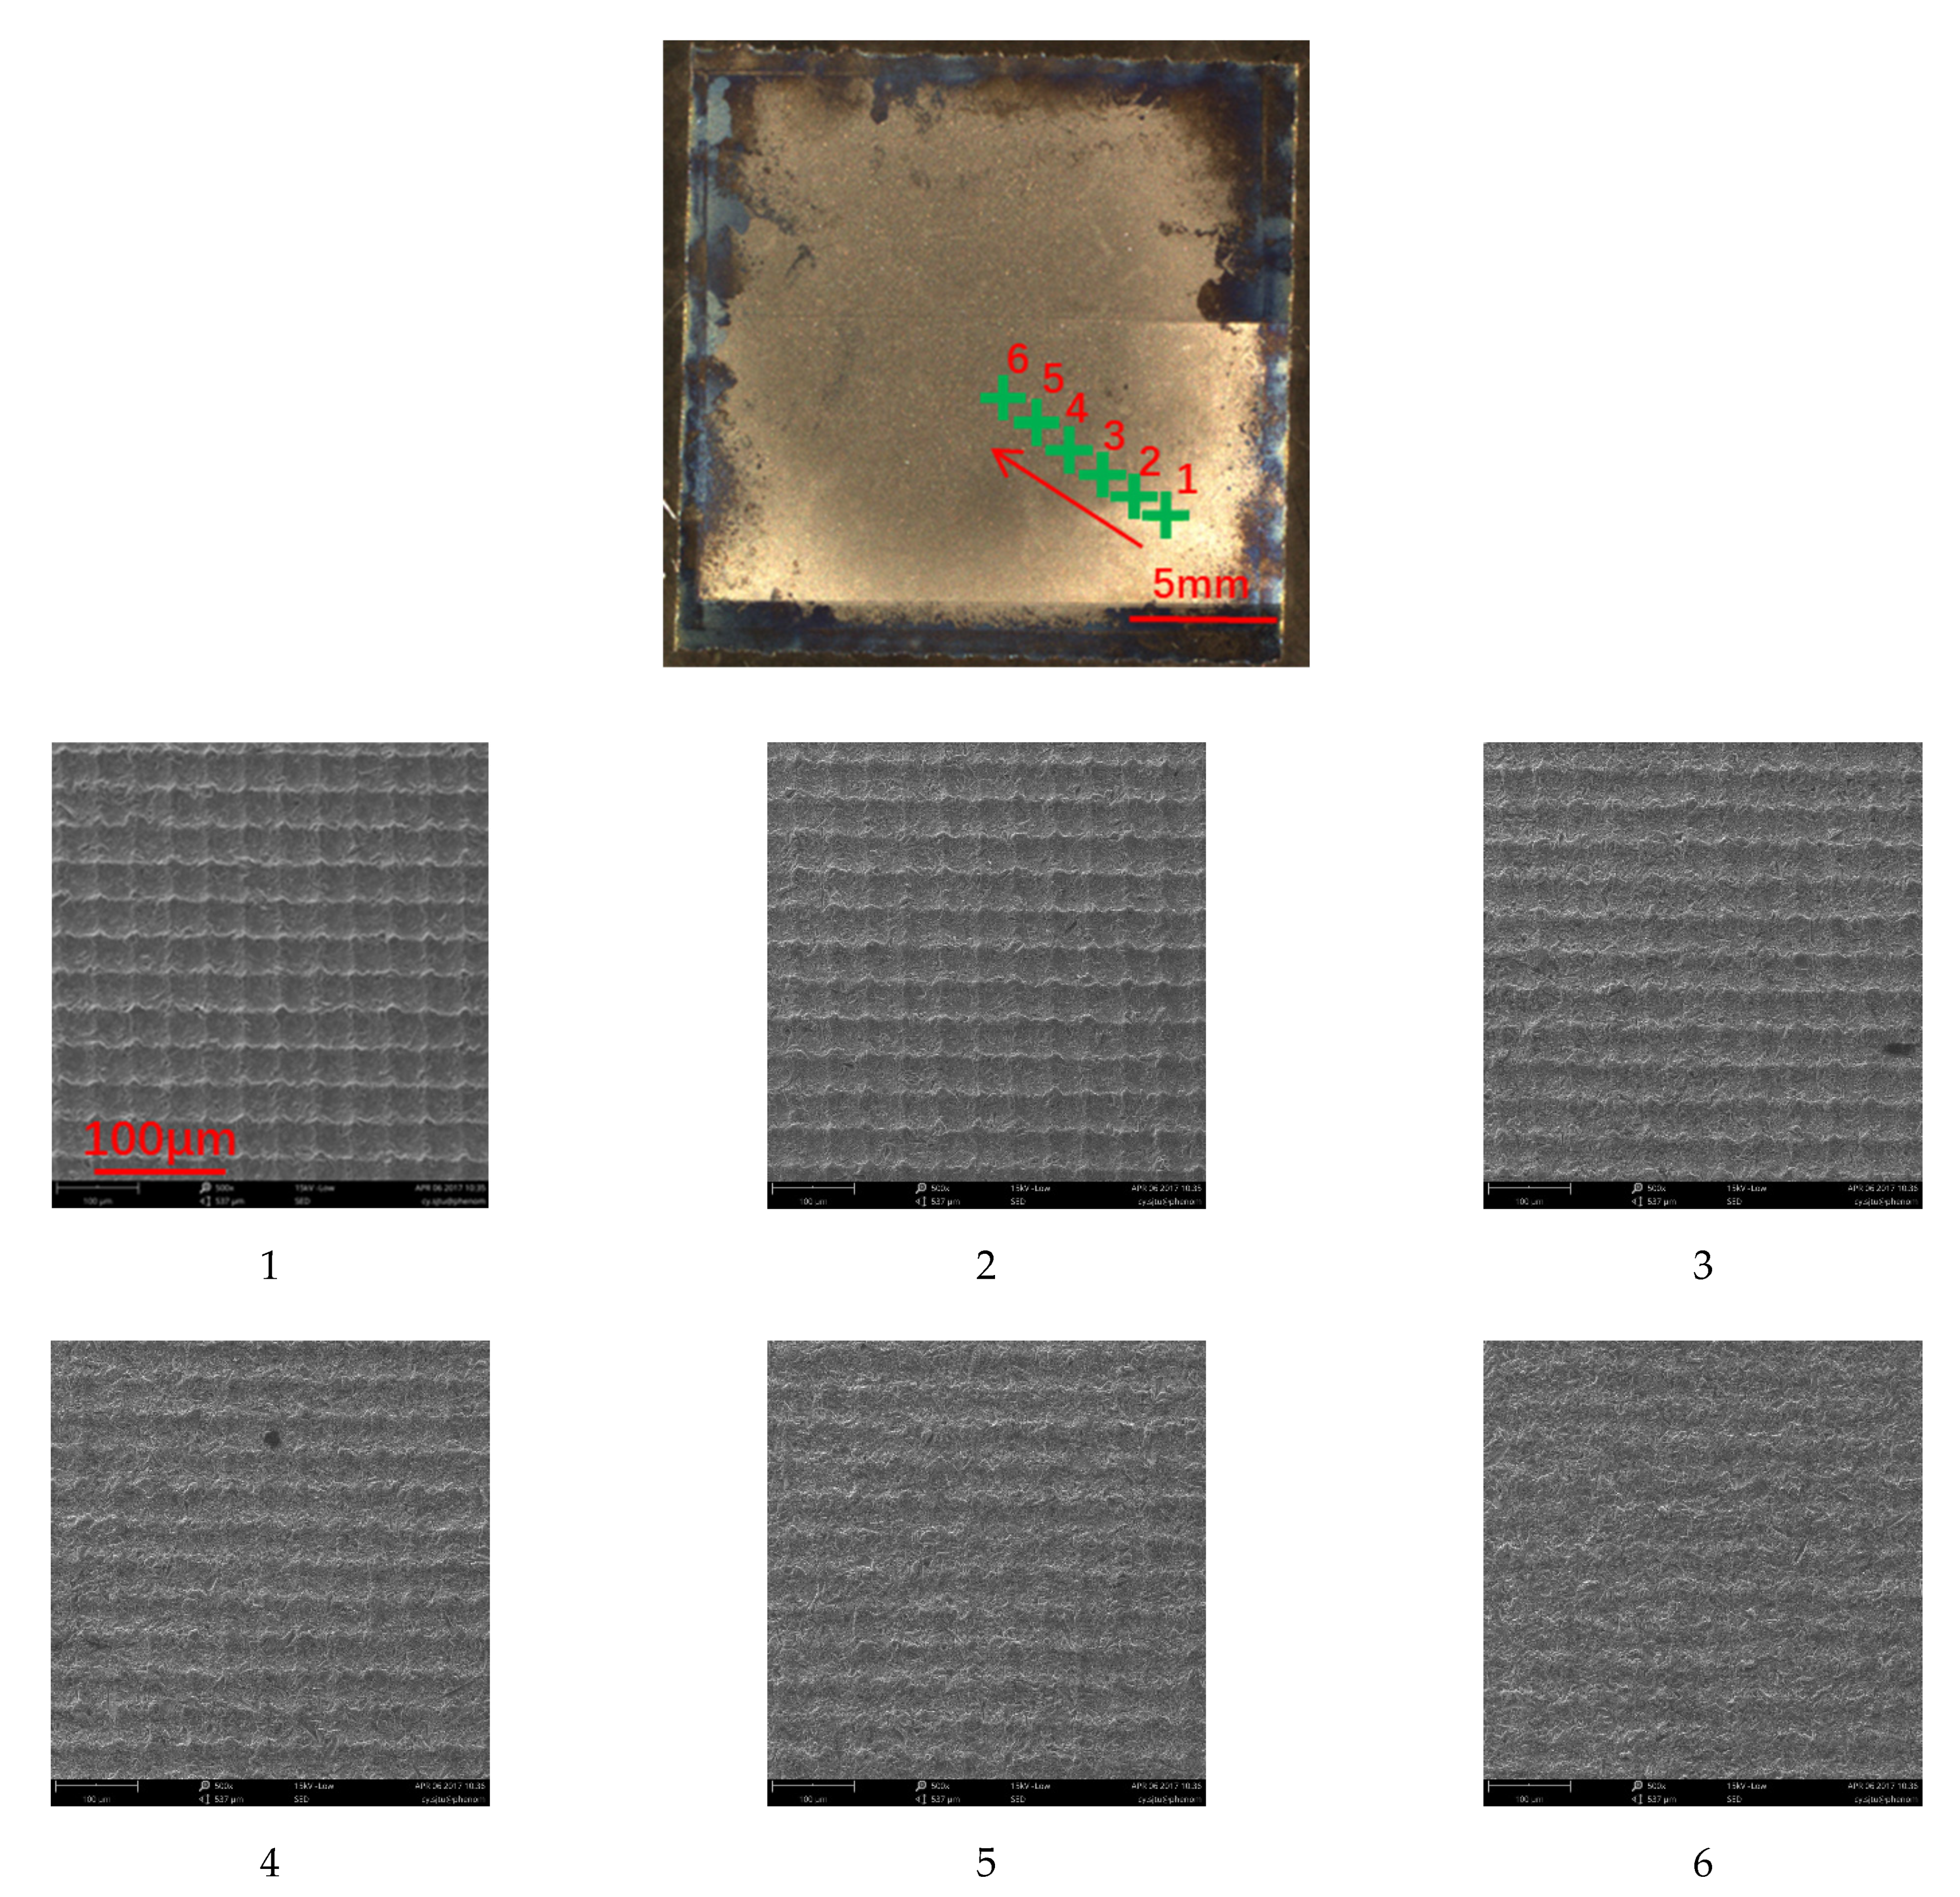
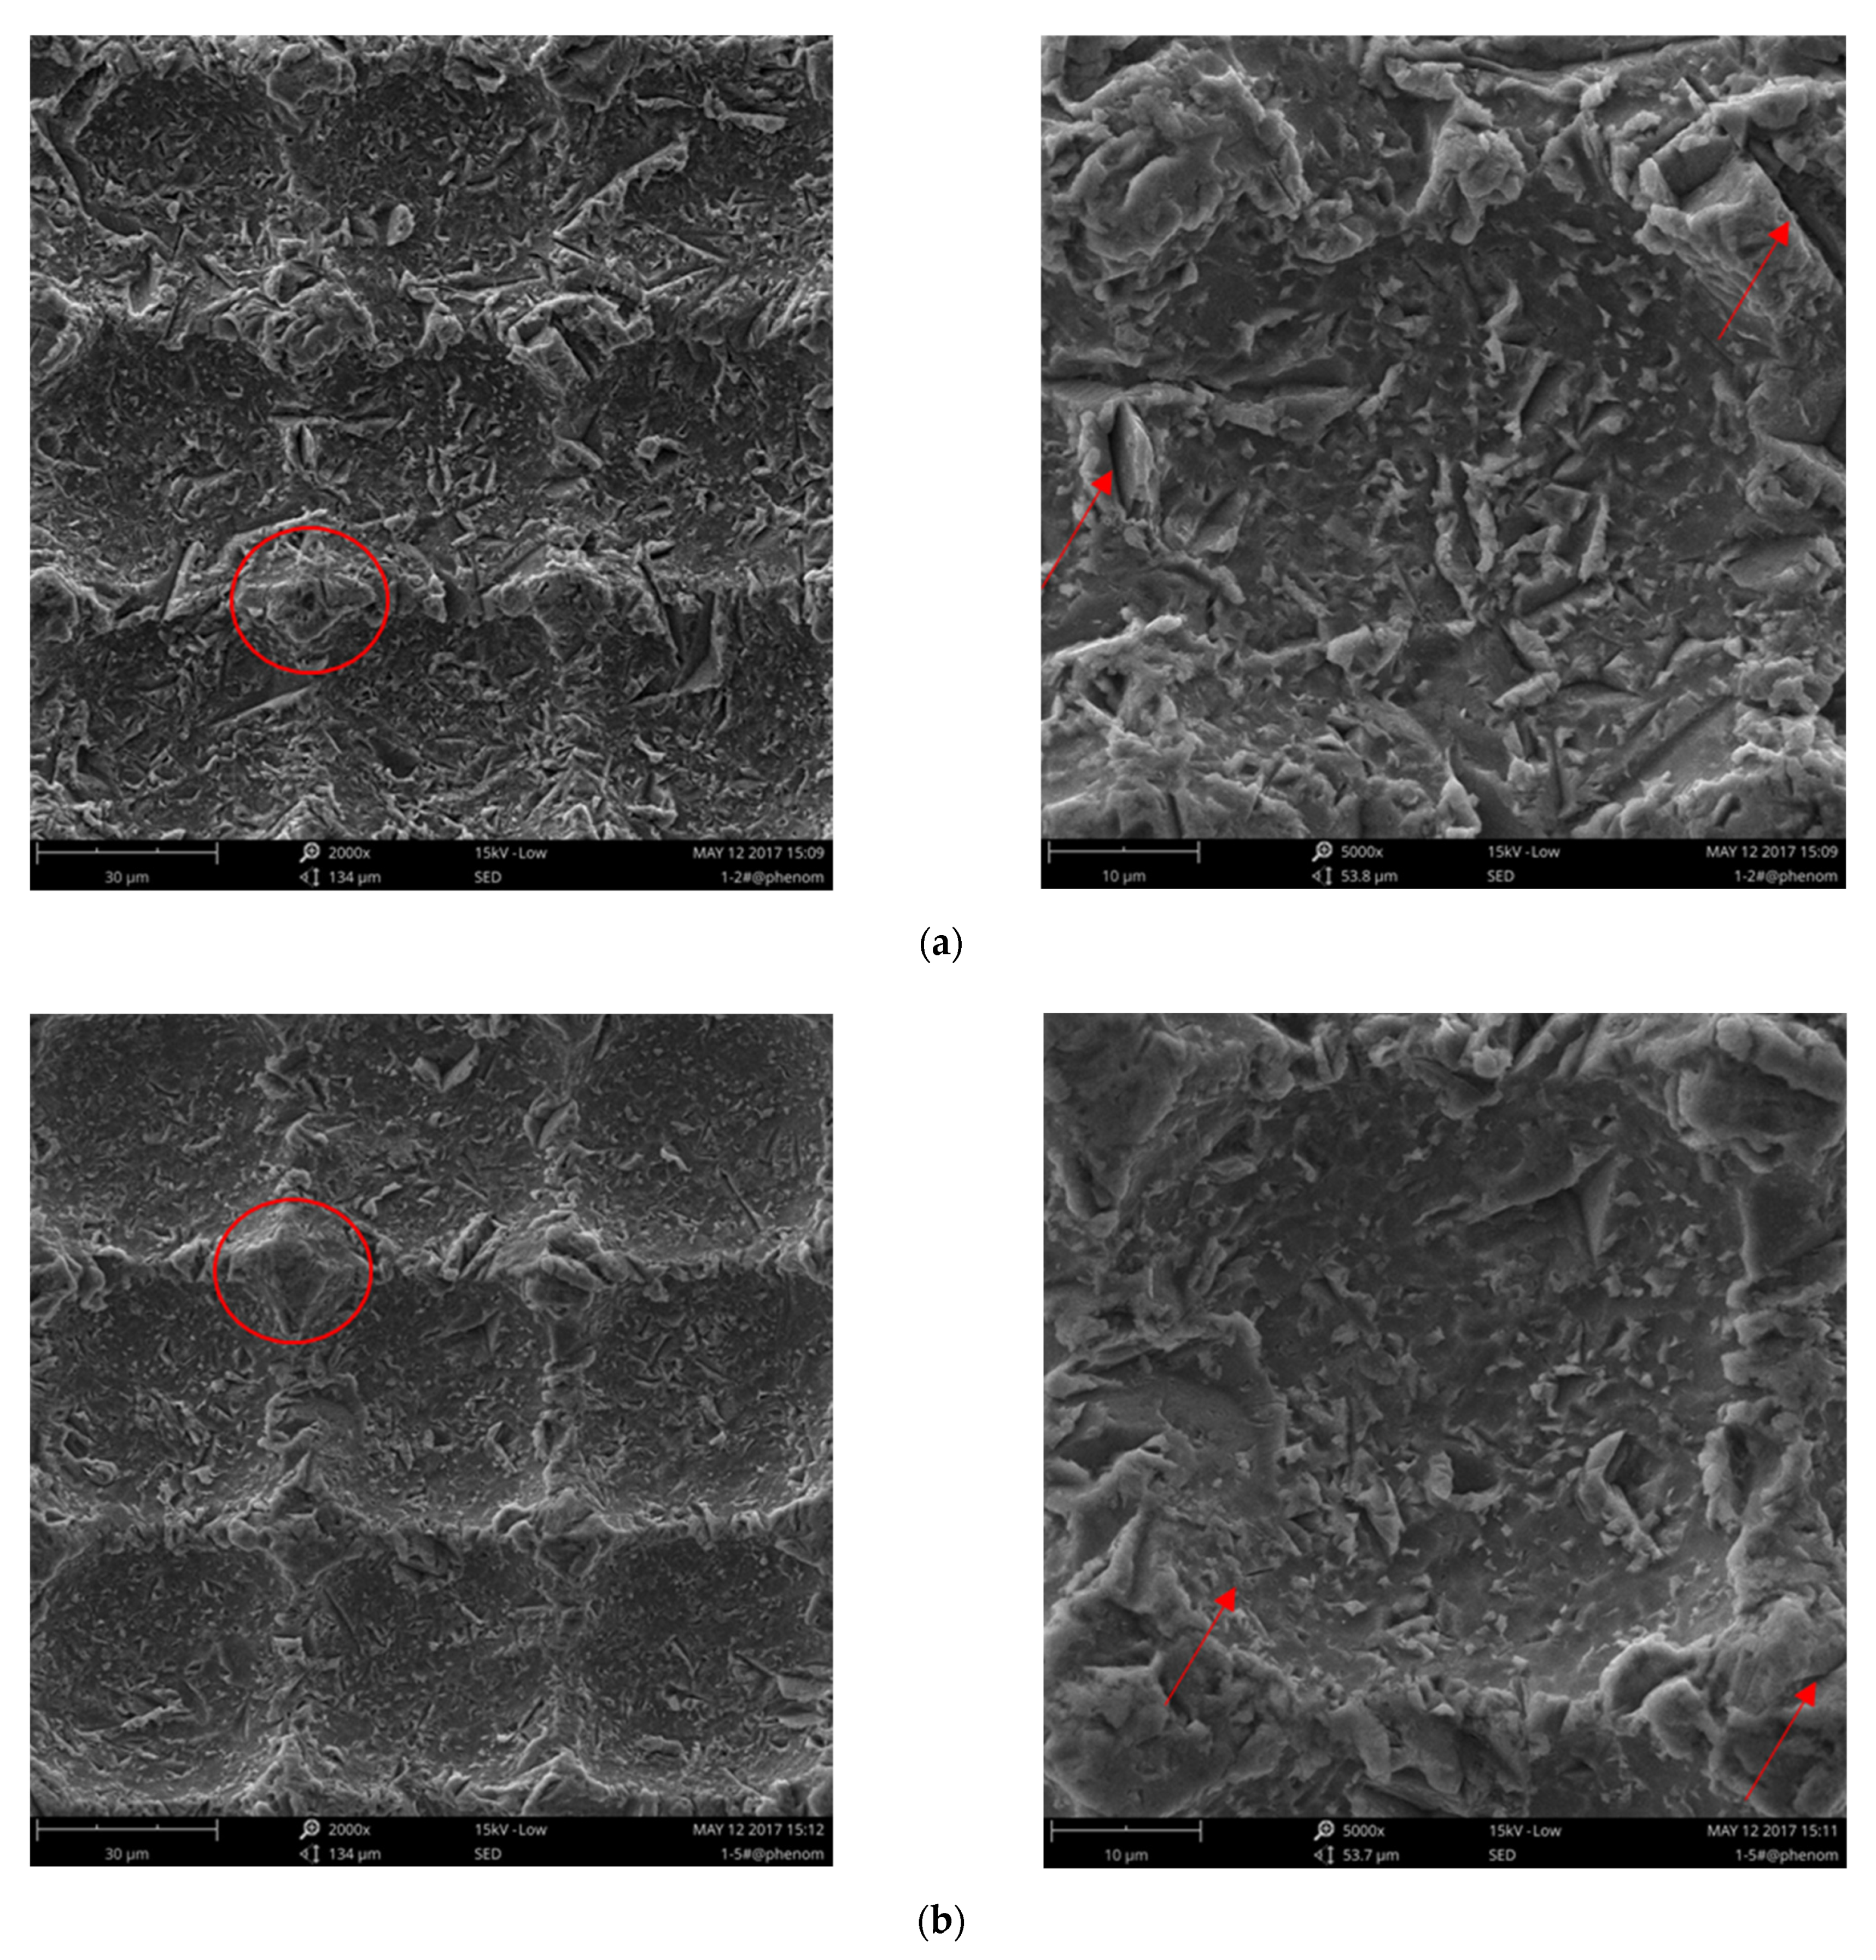
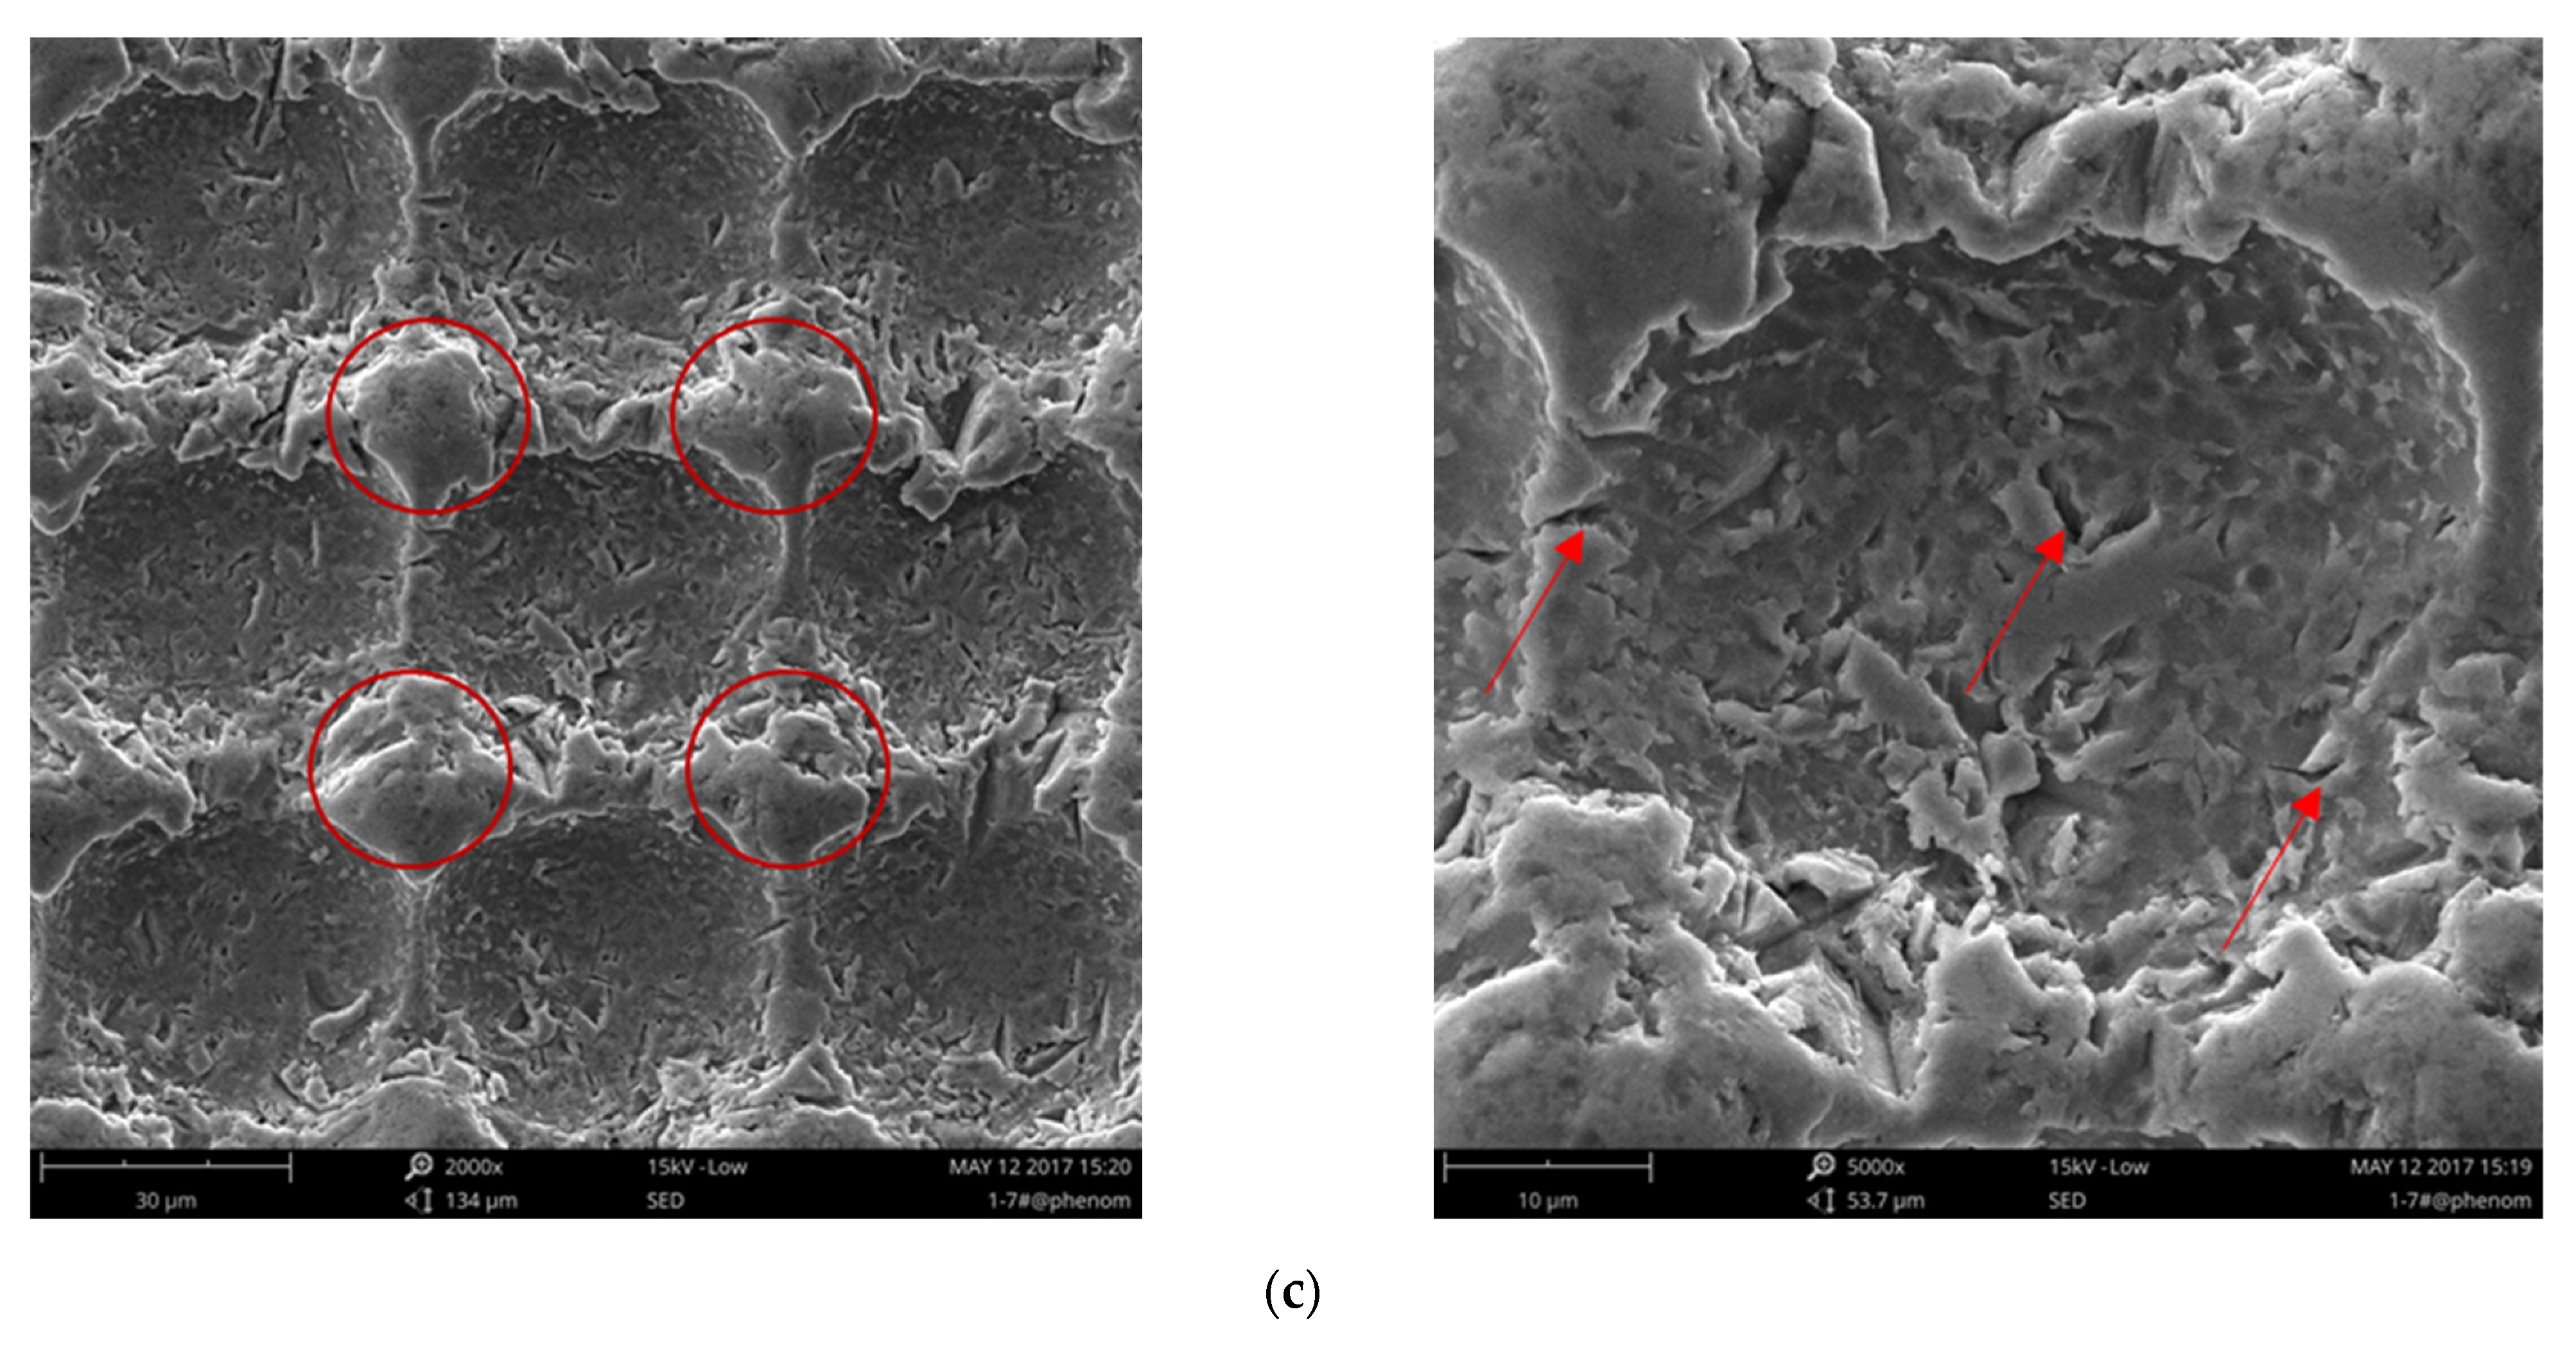
3.3. Microscale Morphology of the Eroded Surface
4. Conclusions
- (1)
- Cubic pit microstructures with small depth-to-width ratios fabricated by photoetching can improve the hydrophobicity of titanium alloy surfaces. The contact angle of smooth titanium alloy increased from 60.2° to 114.6° after photoetching. Photoetching can be used to conveniently produce hydrophobic surfaces with low cost and low residual stress, making it a good candidate for generating anti-icing and de-icing coatings.
- (2)
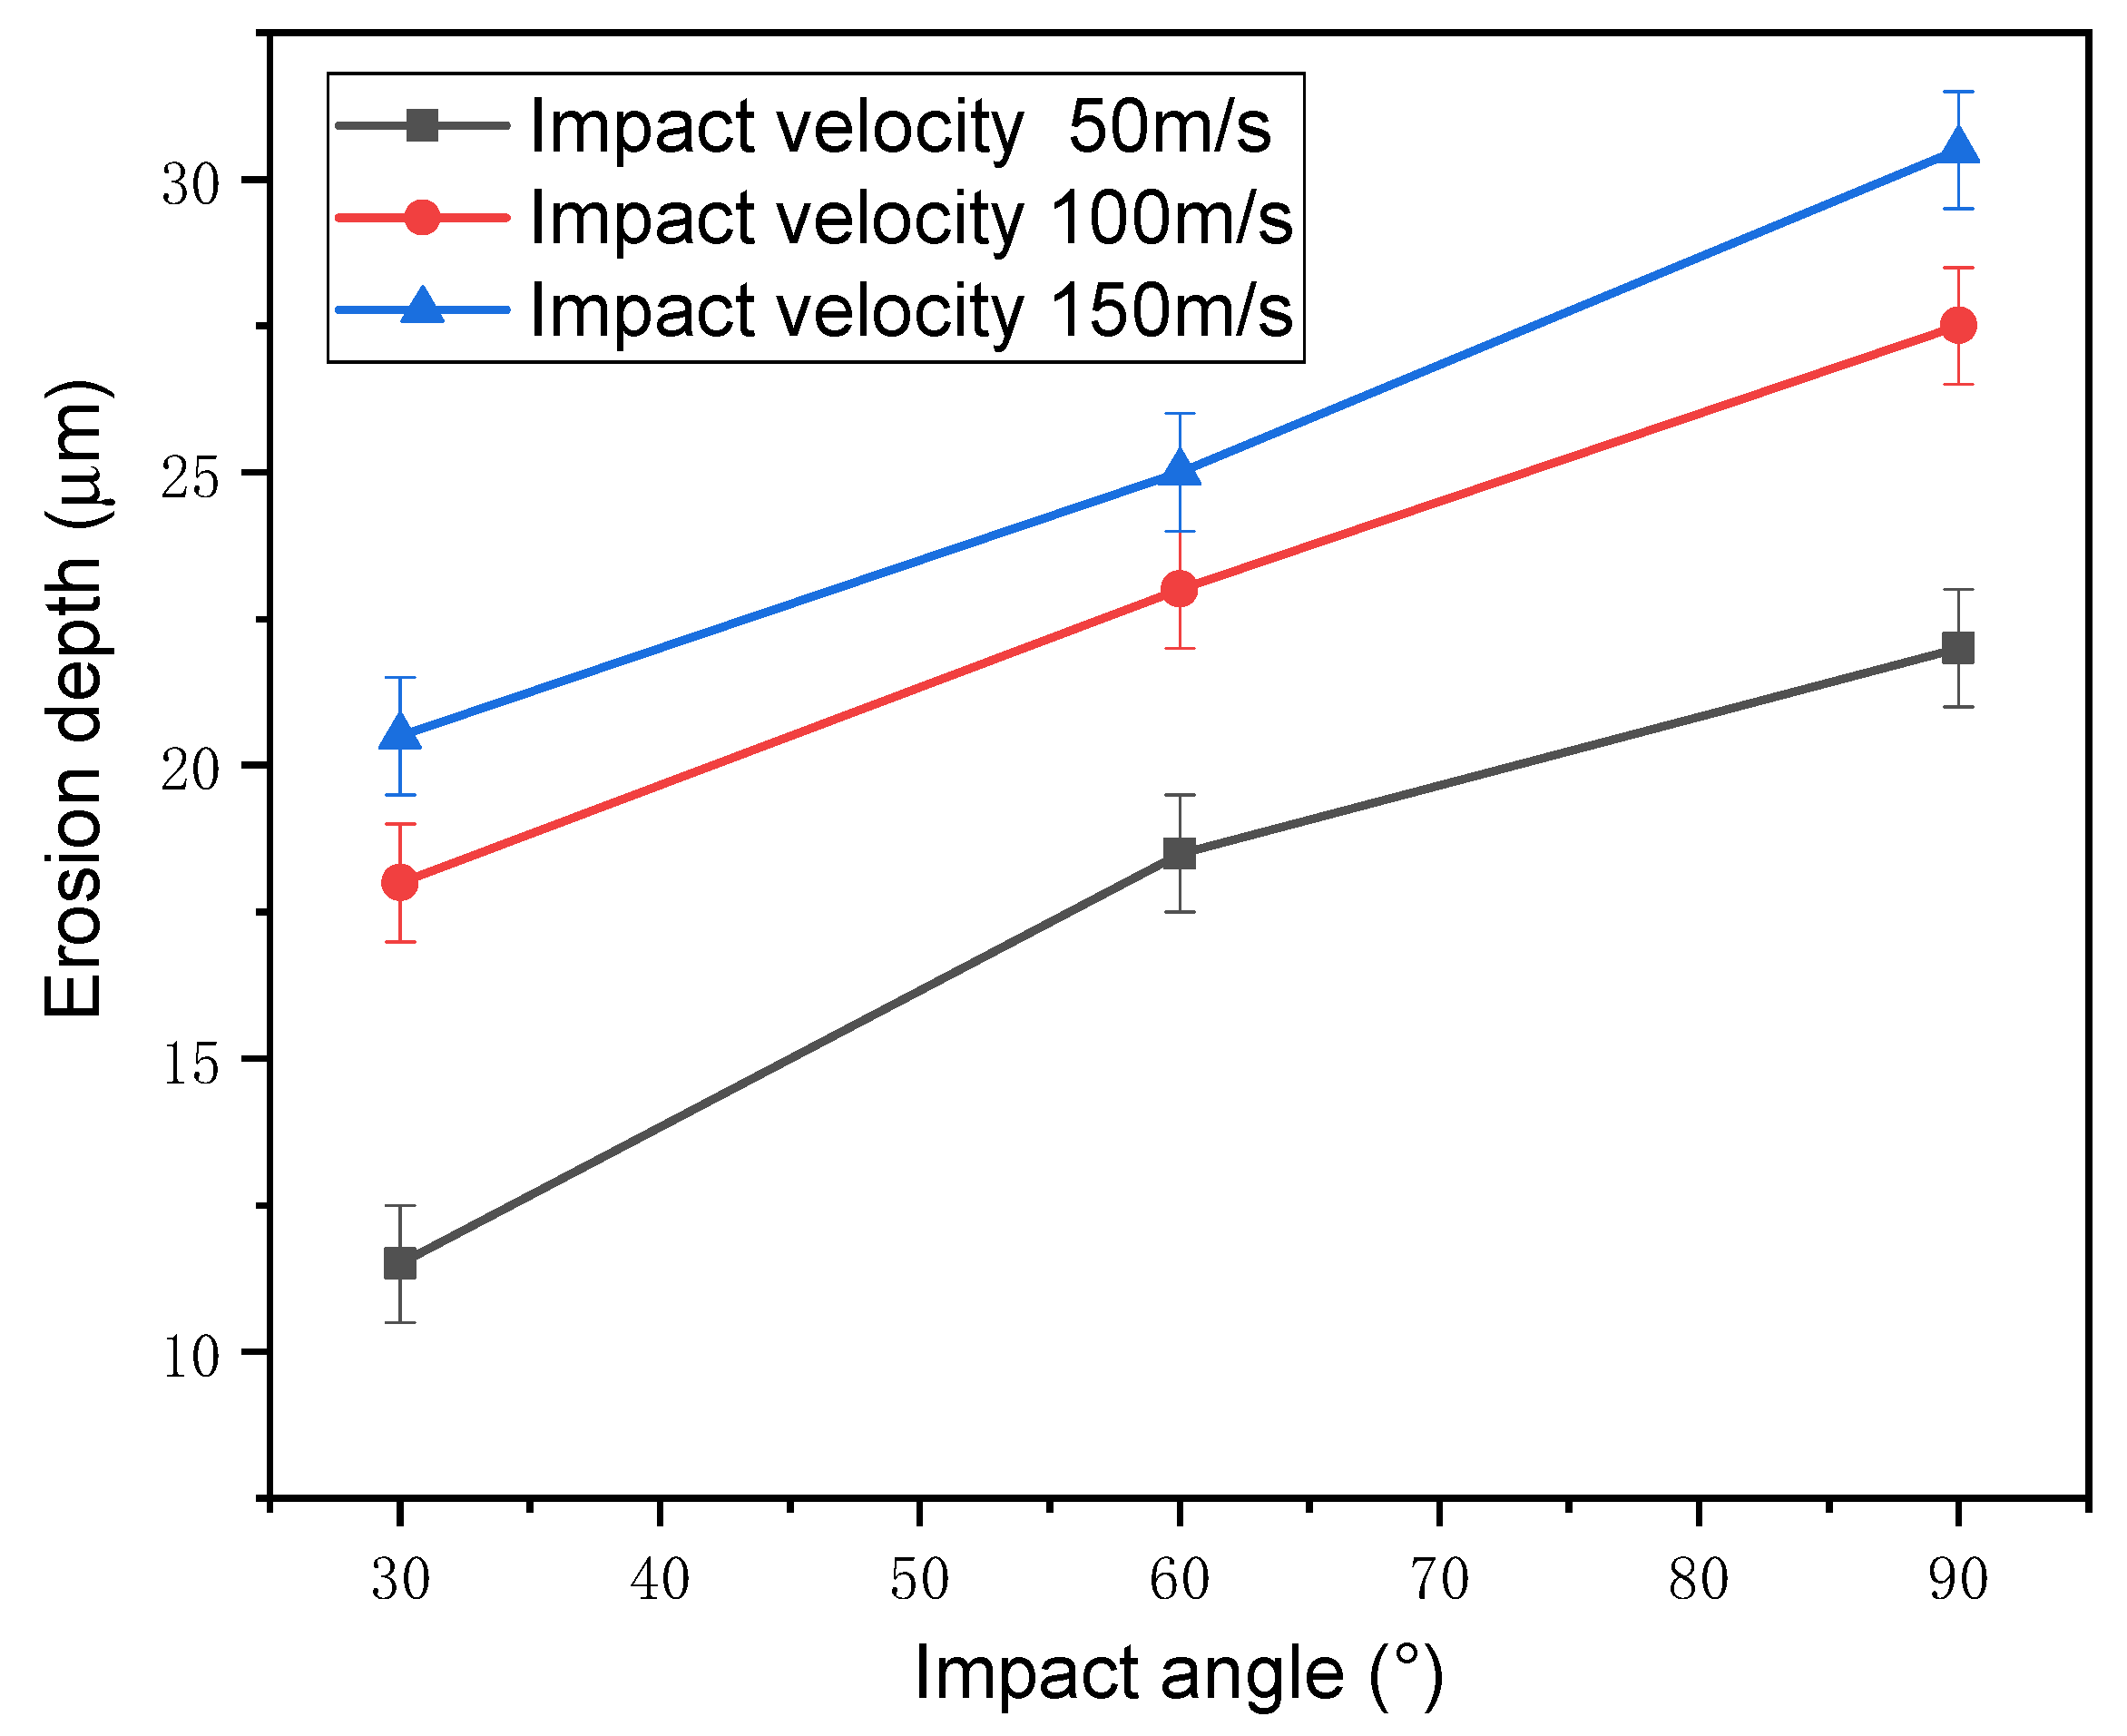
- A high-speed sand erosion rig was designed and calibrated to conduct high-speed erosion tests of the micro/nanostructured titanium surfaces. The erosion rate of the micro/nanostructured titanium surface depended strongly on the erosion angle and speed, and the relationship was the same as that observed for bulk titanium alloy.
- (3)
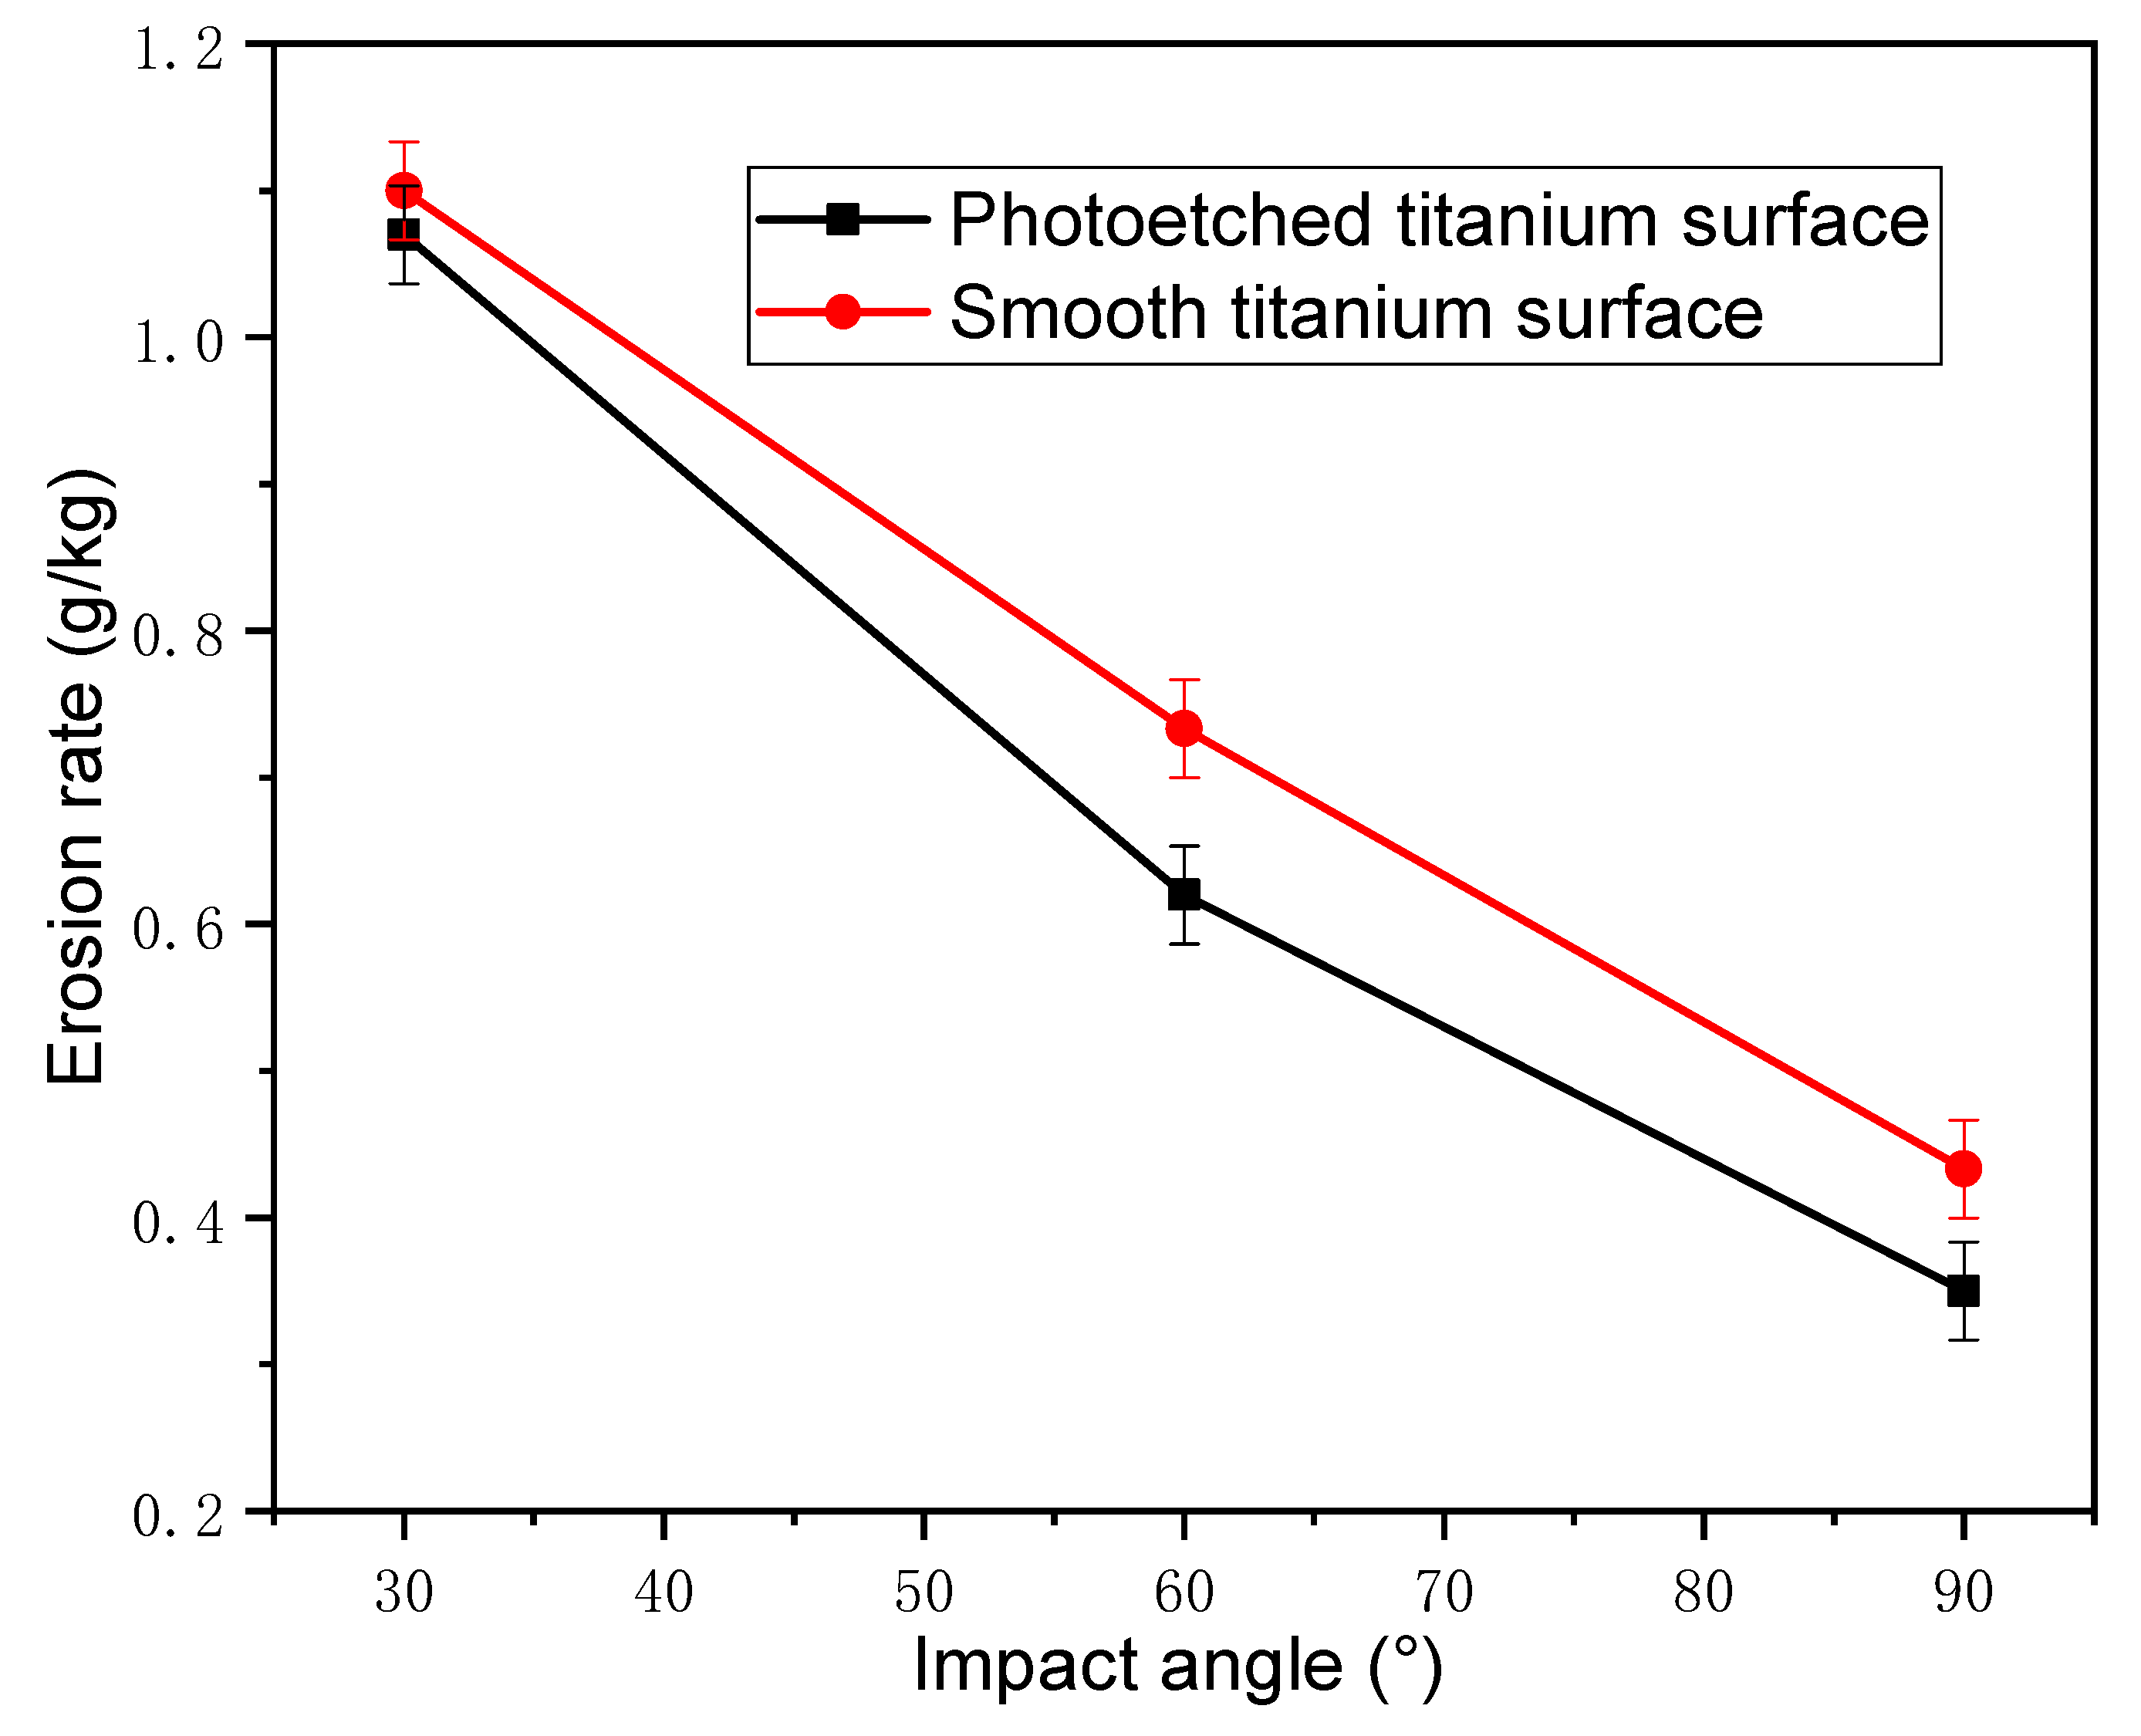
- Under the same impact conditions, the erosion rate of the micro/nanostructured titanium surface was similar to that of the smooth titanium alloy, indicating that the hydrophobic surface fabricated on the bulk material had erosion-resistant capability.
- (4)
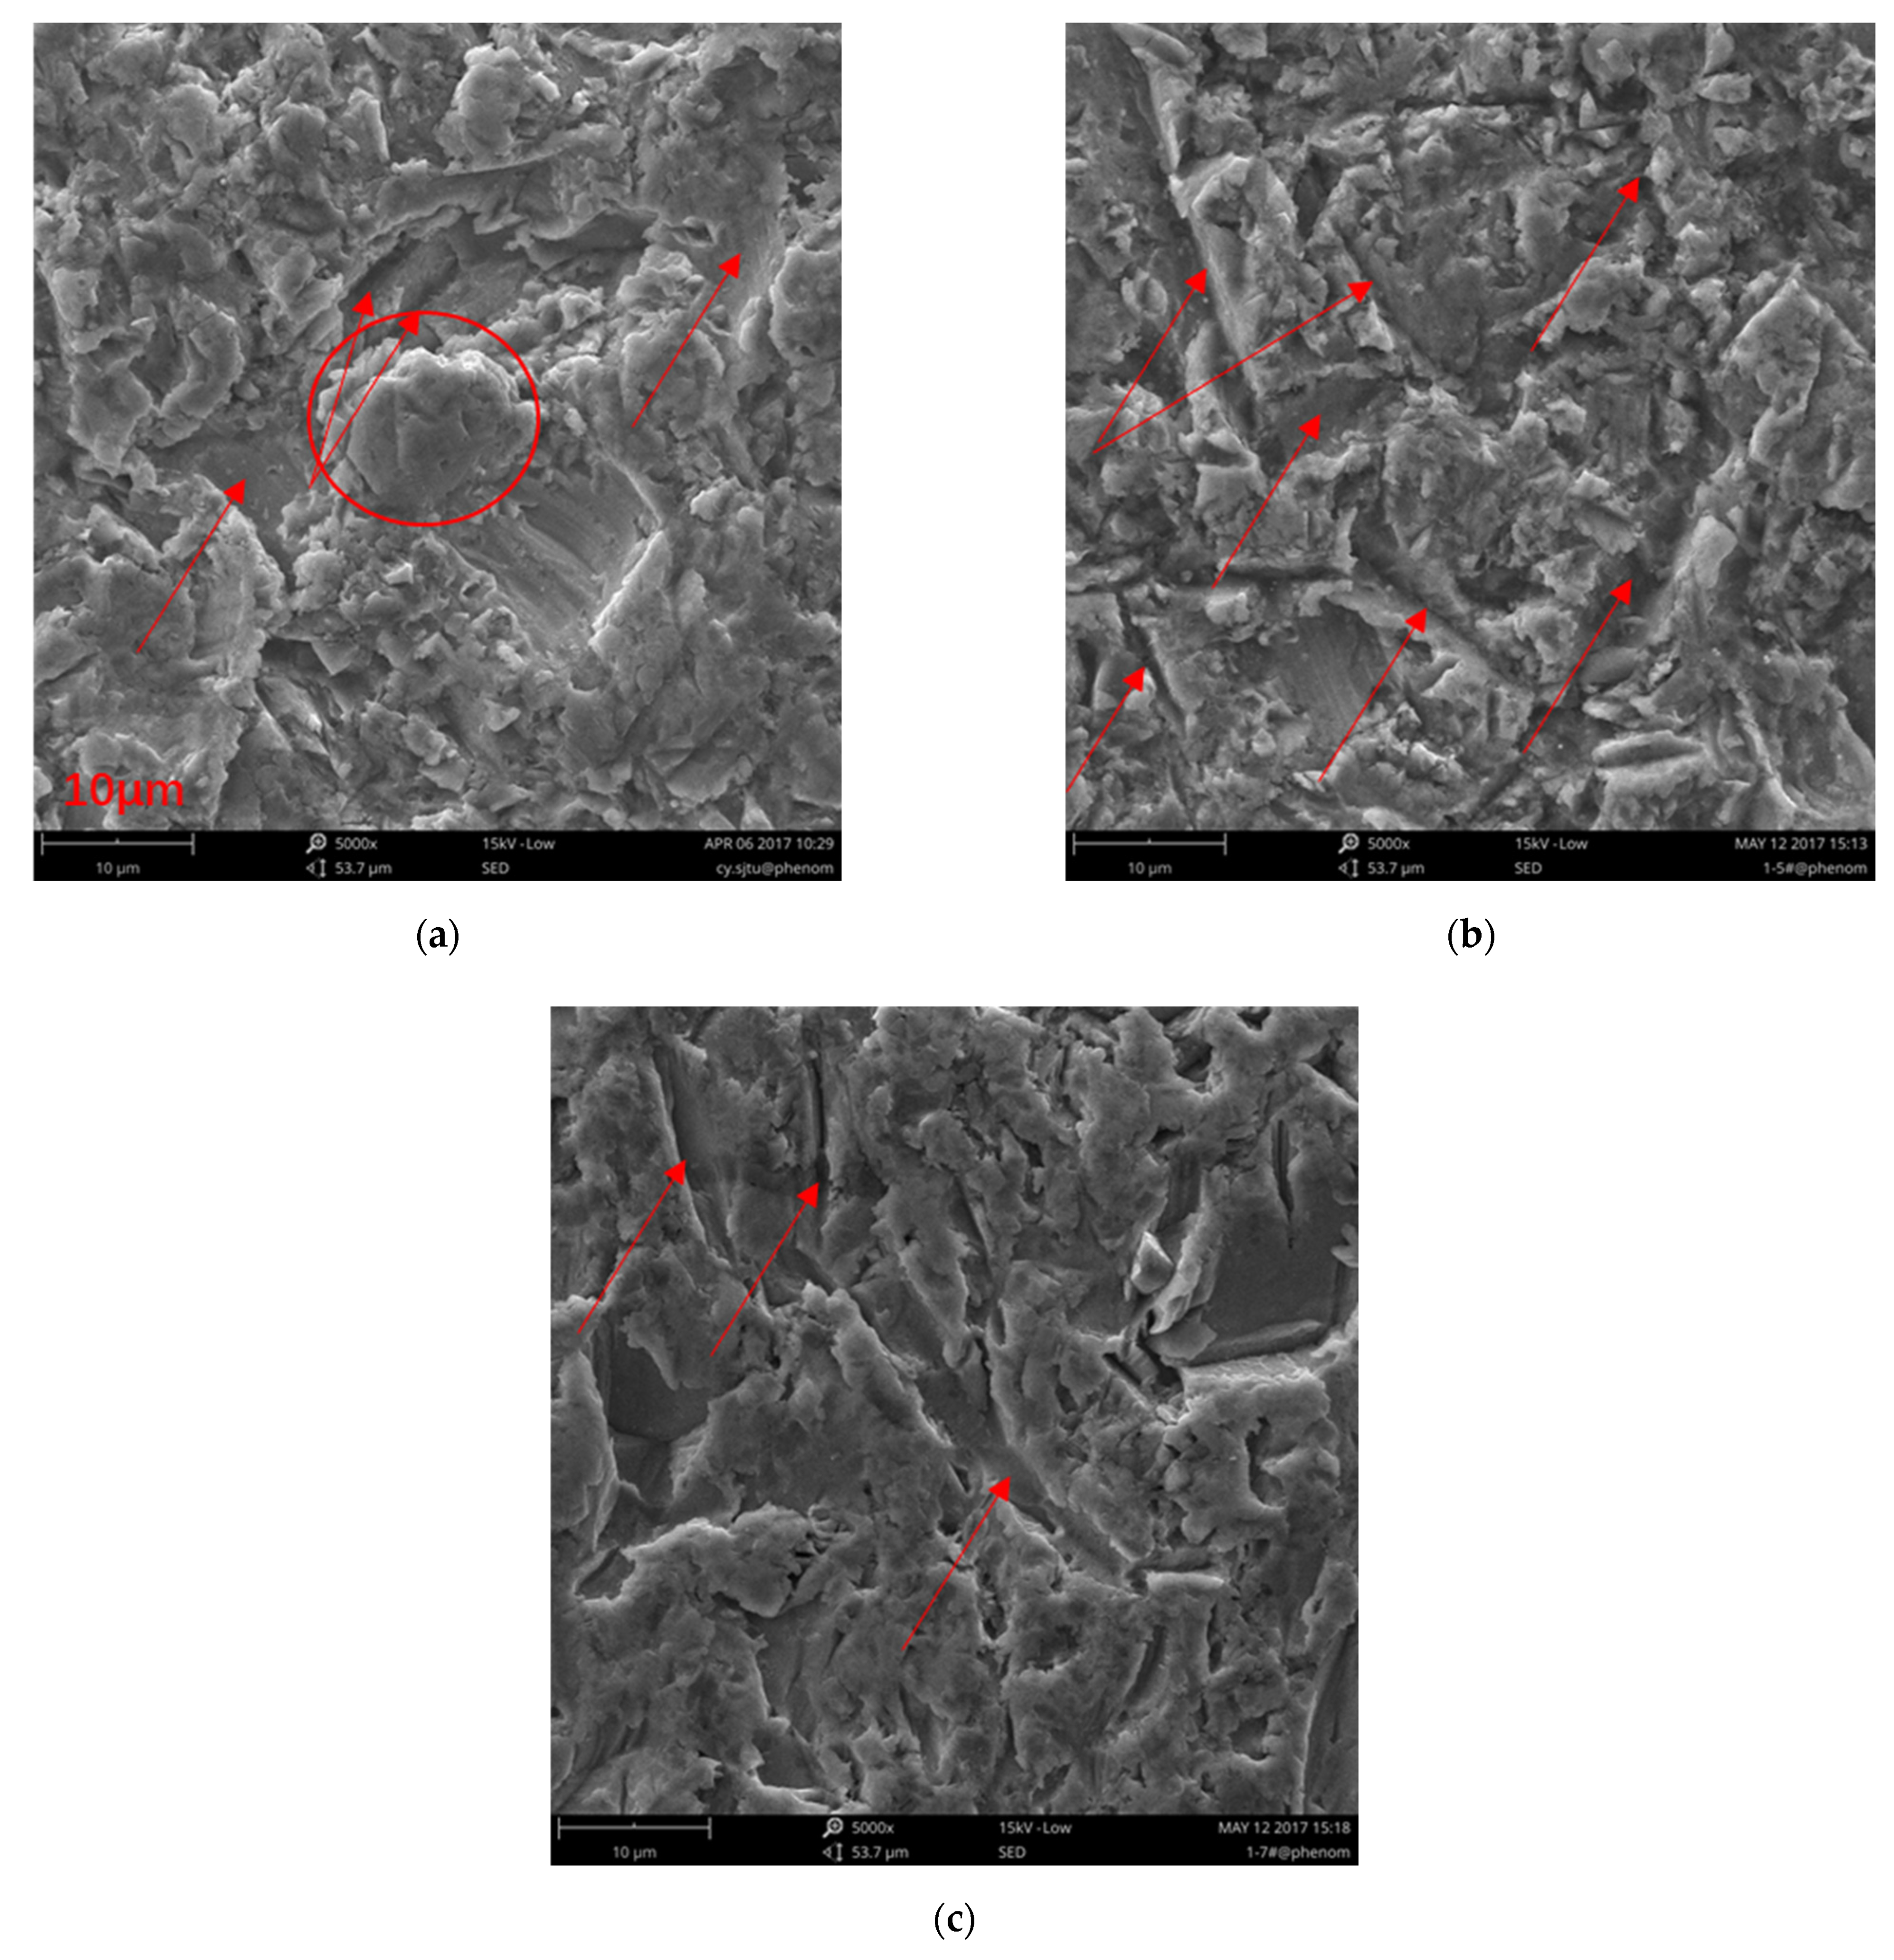
- The material loss mechanisms of the micro/nanostructures under different impact angles were compared. The findings provide useful information for the optimization of micro/nanostructures with the goal of improving erosion resistance.
Author Contributions
Funding
Data Availability Statement
Acknowledgments
Conflicts of Interest
References
- Bragg, M.B. Aerodynamics of Supercooled-Large-Droplet Ice Accretions and the Effect on Aircraft Control. In Proceedings of the FAA International Conference on Aircraft In-flight Icing, Springfield, IL, USA, 6–8 May 1996. [Google Scholar]
- Abdulhussein, A.T.; Kannarpady, G.K.; Wright, A.B.; Ghosh, A.; Biris, A.S. Current trend in fabrication of complex morphologically tunable superhydrophobic nano scale surfaces. Appl. Surf. Sci. 2016, 384, 311–332. [Google Scholar] [CrossRef] [Green Version]
- Zhang, P.; Lv, F.Y. A review of the recent advances in superhydrophobic surfaces and the emerging energy-related applications. Energy 2015, 82, 1068–1087. [Google Scholar] [CrossRef]
- Celia, E.; Darmanin, T.; de Givenchy, E.T.; Amigoni, S.; Guittard, F. Recent advances in designing superhydrophobic surfaces. J. Colloid Interface Sci. 2013, 402, 1–18. [Google Scholar] [CrossRef] [PubMed]
- Milionis, A.; Loth, E.; Bayer, I.S. Recent advances in the mechanical durability of superhydrophobic materials. Adv. Colloid Interface Sci. 2016, 229, 57–79. [Google Scholar] [CrossRef] [PubMed]
- Tang, M.; Shim, V.; Pan, Z.Y.; Choo, Y.S.; Hong, M.H. Laser ablation of metal substrates for super-hydrophobic effect. J. Laser Micro Nanoeng. 2011, 6, 6. [Google Scholar] [CrossRef]
- Hribar, L.; Gregorčič, P.; Senegačnik, M.; Jezeršek, M. The Influence of the Processing Parameters on the Laser-Ablation of Stainless Steel and Brass during the Engraving by Nanosecond Fiber Laser. Nanomaterials 2022, 12, 232. [Google Scholar] [CrossRef] [PubMed]
- Yang, Z.; Tian, Y.; Zhao, Y.; Yang, C. Study on the Fabrication of Super-Hydrophobic Surface on Inconel Alloy via Nanosecond Laser Ablation. Materials 2019, 12, 278. [Google Scholar] [CrossRef] [PubMed] [Green Version]
- Mohazzab, B.F.; Jaleh, B.; Kakuee, O.; Fattah-Alhosseini, A. Formation of titanium carbide on the titanium surface using laser ablation in n-heptane and investigating its corrosion resistance. Appl. Surf. Sci. 2019, 478, 623–635. [Google Scholar] [CrossRef]
- Zhai, Z.Y.; Wang, W.J.; Mei, X.S.; Li, M.; Cui, J.L.; Wang, F.C.; Pan, A.F. Effect of the surface microstructure ablated by femtosecond laser on the bonding strength of EBCs for SiC/SiC composites. Opt. Commun. 2018, 424, 137–144. [Google Scholar] [CrossRef]
- Ruan, M.; Li, W.; Wang, B.; Luo, Q.; Ma, F.; Yu, Z. Optimal conditions for the preparation of superhydrophobic surfaces on al substrates using a simple etching approach. Appl. Surf. Sci. 2012, 258, 7031–7035. [Google Scholar] [CrossRef]
- Lu, Y.; Xu, W.; Song, J.; Liu, X.; Xing, Y.; Sun, J. Preparation of superhydrophobic titanium surfaces via electrochemical etching and fluorosilane modification. Appl. Surf. Sci. 2012, 263, 297–301. [Google Scholar] [CrossRef]
- Ghalmi, Z.; Farzaneh, M. Experimental investigation to evaluate the effect of PTFE nanostructured roughness on ice adhesion strength. Cold Reg. Sci. Technol. 2015, 115, 42–47. [Google Scholar] [CrossRef]
- Susoff, M.; Siegmann, K.; Pfaffenroth, C.; Hirayama, M. Evaluation of icephobic coatings—Screening of different coatings and influence of roughness. Appl. Surf. Sci. 2013, 282, 870–879. [Google Scholar] [CrossRef] [Green Version]
- Fortin, G.; Beisswenger, A.; Perron, J. Centrifuge Adhesion Test to Evaluate Icephobic Coatings. In Proceedings of the AIAA Atmospheric and Space Environments Conference, Toronto, ON, Canada, 2–5 August 2010; p. 7837. [Google Scholar]
- Kreeger, R.E.; Vargas, M.; Tran, A.; Wang, Y.; Palacios, J.; Hadley, K. Multi-Scale Materials Design for Inflight Icing Mitigation. In Proceedings of the Adhesion Society Annual Meeting, San Antonio, TX, USA, 21–24 February 2016. [Google Scholar]
- Laforte, C.; Blackburn, C.; Perron, J.; Aubert, R. Icephobic Coating Evaluation for Aerospace Application. In Proceedings of the 55th AIAA/ASMe/ASCE/AHS/SC Structures, Structural Dynamics, and Materials Conference, National Harbor, Maryland, 13–17 January 2014; p. 1327. [Google Scholar]
- Janjua, Z.A.; Turnbull, B.; Choy, K.L.; Pandis, C.; Liu, J.; Hou, X.; Choi, K.S. Performance and durability tests of smart icephobic coatings to reduce ice adhesion. Appl. Surf. Sci. 2017, 407, 555–564. [Google Scholar] [CrossRef]
- Golovin, K.; Kobaku, S.P.; Lee, D.H.; Di Loreto, E.T.; Mabry, J.M.; Tuteja, A. Designing durable icephobic surfaces. Sci. Adv. 2016, 2, e1501496. [Google Scholar] [CrossRef] [PubMed] [Green Version]
- Del Cerro, D.A.; Römer, G.; Huis, A.J. Erosion resistant anti-ice surfaces generated by ultra short laser pulses. Phys. Procedia 2010, 5, 231–235. [Google Scholar] [CrossRef] [Green Version]
- Gutiérrez-Fernández, E.; Ezquerra, T.A.; Nogales, A.; Rebollar, E. Straightforward Patterning of Functional Polymers by Sequential Nanosecond Pulsed Laser Irradiation. Nanomaterials 2021, 11, 1123. [Google Scholar] [CrossRef] [PubMed]
- Raimondo, M.; Blosi, M.; Caldarelli, A.; Guarini, G.; Veronesi, F. Wetting behavior and remarkable durability of amphiphobic aluminum alloys surfaces in a wide range of environmental conditions. Chem. Eng. J. 2014, 258, 101–109. [Google Scholar] [CrossRef]
- Zhang, Z.; Ma, L.; Liu, Y.; Hu, H. An Experimental Study on the Durability of a Hydro-/Ice-Phobic Surface Coating for Aircraft Icing Mitigation. In Proceedings of the 2018 Atmospheric and Space Environments Conference, Atlanta, Georgia, 25–29 June 2018; p. 3655. [Google Scholar]


| Researchers | Main Research Content |
|---|---|
| Ghalmi et al. [13] | The effects of polytetrafluoroethylene (PTFE) nanostructural roughness on ice adhesion strength. |
| Susoff et al. [14] | Adhesion strengths between different coatings and ice, and the effect of surface roughness. |
| Fortin et al. [15] | Development of the centrifuge adhesion test to measure the icephobicities of icephobic coatings. |
| Kreeger et al. [16] | Basic requirements for icephobic coating and material. |
| Caroline et al. [17] | Properties of icephobic coatings for aerospace applications. |
| Golovin et al. [19] | The mechanisms for the extremely low ice adhesion between coatings and ice. |
| Cerro et al. [20] | The anti-ice properties of plasma-deposited hard coatings in combination with laser-machined patterns. |
| Zhang et al. [23] | Droplet erosion durability of a commercially available superhydrophobic coating. |
| Parameter | Units | Value |
|---|---|---|
| Impact speed | m/s | 30–250 |
| Impact angle | ° | 20, 30, 60, 90 |
| Nozzle diameter | mm | 4.8 |
| Specimen diameter | mm | 76.2 |
| Hopper volume | liter | 1.5 |
Publisher’s Note: MDPI stays neutral with regard to jurisdictional claims in published maps and institutional affiliations. |
© 2022 by the authors. Licensee MDPI, Basel, Switzerland. This article is an open access article distributed under the terms and conditions of the Creative Commons Attribution (CC BY) license (https://creativecommons.org/licenses/by/4.0/).
Share and Cite
Chen, Y.; Zhang, J. High-Speed Erosion Behavior of Hydrophobic Micro/Nanostructured Titanium Surfaces. Nanomaterials 2022, 12, 880. https://doi.org/10.3390/nano12050880
Chen Y, Zhang J. High-Speed Erosion Behavior of Hydrophobic Micro/Nanostructured Titanium Surfaces. Nanomaterials. 2022; 12(5):880. https://doi.org/10.3390/nano12050880
Chicago/Turabian StyleChen, Yong, and Jiguo Zhang. 2022. "High-Speed Erosion Behavior of Hydrophobic Micro/Nanostructured Titanium Surfaces" Nanomaterials 12, no. 5: 880. https://doi.org/10.3390/nano12050880