1. Introduction
Emissions of various toxic pollutants from drug residues to dyes from textile industry and communal wastewater to the environment coupled to the emerging global challenges in energy consumption and generation, have led to an exponentially increasing demand for cheap and environmentally harmless ways of water remediation.
Solar energy is a sustainable and de facto inexhaustible energy source for mankind with no environmental concerns. There are several major routes to harness solar energy: photothermal [
1], photovoltaic [
2,
3], and photocatalytic methods [
4]. Nanostructures and nanocomposites are frequently used to enhance solar energy conversion [
5,
6,
7,
8]. For example, plasmonics allow extraordinary control of light, making it attractive for application in solar energy harvesting. In metal−semiconductor heterojunctions, plasmons can enhance photoconversion in the semiconductor via three mechanisms, including light trapping, hot electron/hole transfer, and plasmon-induced resonance energy transfer (PIRET) [
5]. Photonic crystals can enhance the interaction of light with a semiconductor. Integrated photonic crystals and the plasmonic effects of nanostructured materials may have an enhancing superposition effect in controlling light [
6].
Photocatalysts and photovoltaics represent two major approaches sharing similar processes (including light absorption, charge carrier generation, and separation) for solar energy conversion with semiconductors. Integrating semiconductors with plasmonic nanostructures was proven as an effective way to greatly enhance the performance in photocatalysis and photovoltaic devices [
8]. Adding photonic crystals—capable of controlling light propagation—can further enhance this process. Inverse opal type photonic crystal (PhC) nanoarchitectures were used to host various catalytic nanoparticles (NPs) [
9]. Slow light effects [
10] and vibrational strong coupling of molecules inside a cavity [
11,
12] have much potential for molecular and materials sciences that is just beginning to be explored. The hybrid nanoarchitectures (PhC + NP) exhibit a vast potential for harnessing solar radiation for catalytic purposes and offer a further advantage as the PhC component may provide a supporting substrate with a large specific surface for the catalytic NPs [
13]. The solar spectrum reaching the Earth’s surface is attenuated by atmospheric absorption; the peak power output is in the visible range; therefore, materials suitable for this spectral range are the most useful for potential applications. UV-transparent materials may have prohibitive prices for wastewater treatment, for example.
The cheap fabrication of large area and good quality three-dimensional (3D) PhCs is still very challenging [
14]. On the other hand, biological evolution offers a rich “library” of PhC-type nanoarchitectures on the wings of butterflies exhibiting structural coloration [
15,
16,
17,
18,
19,
20,
21,
22]. These are nanocomposites of chitin and air producing color in the near UV and visible spectral range. Usually, they have air-filled nanocavities that can host metallic or semiconducting NPs. Here, it is worth emphasizing that moths, such as the domesticated mulberry moth (
Bombyx mori), have been used for thousands of years [
23] to produce natural silk. The production of natural silk amounts to approximately 80,000 tons/year [
24]. It was shown recently that it is possible to obtain more than 600 exemplars of
Polyommatus icarus from a single breeding pair [
13,
25] in laboratory conditions. In the experiments reported in the present paper, we used wings of male
P. icarus butterflies resulting from this type of breeding. Therefore, the wings of butterflies exhibiting structural color may constitute a cheap and ready-made “library” to experiment with biotemplating and the effects of spectral engineering on the biotemplated photonic nanoarchitectures.
We were interested in exploring the possibilities offered by using standard materials science methods for the spectral engineering of the photonic/photocatalytic nanoarchitectures, such as NP sol preparation and drop-drying on the biologic photonic nanoarchitectures, atomic layer deposition (ALD), and their combinations, to tune the structural color of butterfly wings in a controlled way and to explore the effects of this tuning on the photocatalytic properties of the biotemplated hybrid nanoarchitectures. As test materials, we chose octahedral Cu
2O nanoparticles and ZnO coating by ALD. Cu
2O NPs are intensely investigated p-type semiconductor NPs with characteristic absorption in the visible light spectrum [
26], while ZnO is also a well-studied n-type photocatalytic semiconductor [
27], but unfortunately, its absorption edge is at the limit of the UV to visible light range [
28]. Various Cu
2O and ZnO heterojunctions were also investigated [
29,
30,
31], including self-powered sensing devices [
30,
32]. The Cu
2O-ZnO heterojunction extends the absorption of the nanocomposite to the visible range and provides efficient charge separation [
33,
34,
35,
36]. Both materials are cheap, abundant, and nontoxic.
Recently, it was reported that the photocatalytic enhancement obtained with TiO
2 coated nanoporous anodic alumina distributed Bragg reflectors is at the maximum when the red edge of the photonic stop band is spectrally close to the red or blue boundary of the absorption band of methylene blue (MB) and dramatically decreases within the absorbance maximum of MB due to light screening by dye molecules [
37]. This, together with our recent finding that the overlap between the reflectance peak of the photonic nanoarchitecture and the dye absorption determines the efficiency of rhodamine B (RhB) decomposition on biotemplated ZnO photonic nanoarchitectures [
38], clearly shows the importance of spectral engineering [
39,
40,
41] in photocatalytic applications.
In the present work, we explored the possibilities of enhancing the decomposition of the RhB dye by the spectral engineering of the optical properties of composite photocatalytic surfaces. For this purpose, hierarchical, hybrid biotemplated photonic nanoarchitectures were constructed from butterfly wings—ZnO conformal coating—Cu2O nanoparticles. To exploit the slow light effect, we aimed at achieving a good overlap between the red edge of the reflectance peak of the photonic nanoarchitecture and the absorption peak of the dye. The methods of spectral engineering using various combinations of the different elements and the resulting photocatalytic performances of the samples are discussed.
2. Materials and Methods
The wings of the Palearctic Blue butterfly,
Polyommatus icarus (Rottemburg, 1775) (Arthropoda: Insecta: Lepidoptera: Lycaenidae) were used. This butterfly species is not subjected to any restrictions. The range of the species covers the entire Palearctic region [
42,
43], and recently, their presence was reported in the Nearctic, too [
44,
45]. Limited color differences exist between Europe and Asia (of the order of 20 nm in the spectral position of the blue reflectance maximum) [
46], and the color variations in the blue dorsal color of the males within a given population are of the order of only ±10 nm in the spectral position of the reflectance maximum [
47]. The color is stable on time scales of the order of hundreds of years [
46]. Wings of butterflies reared in an insectarium with controlled light and environmental conditions [
13,
25] were used. After drying their wings, the butterflies were frozen and dried for several months separately in small plastic boxes.
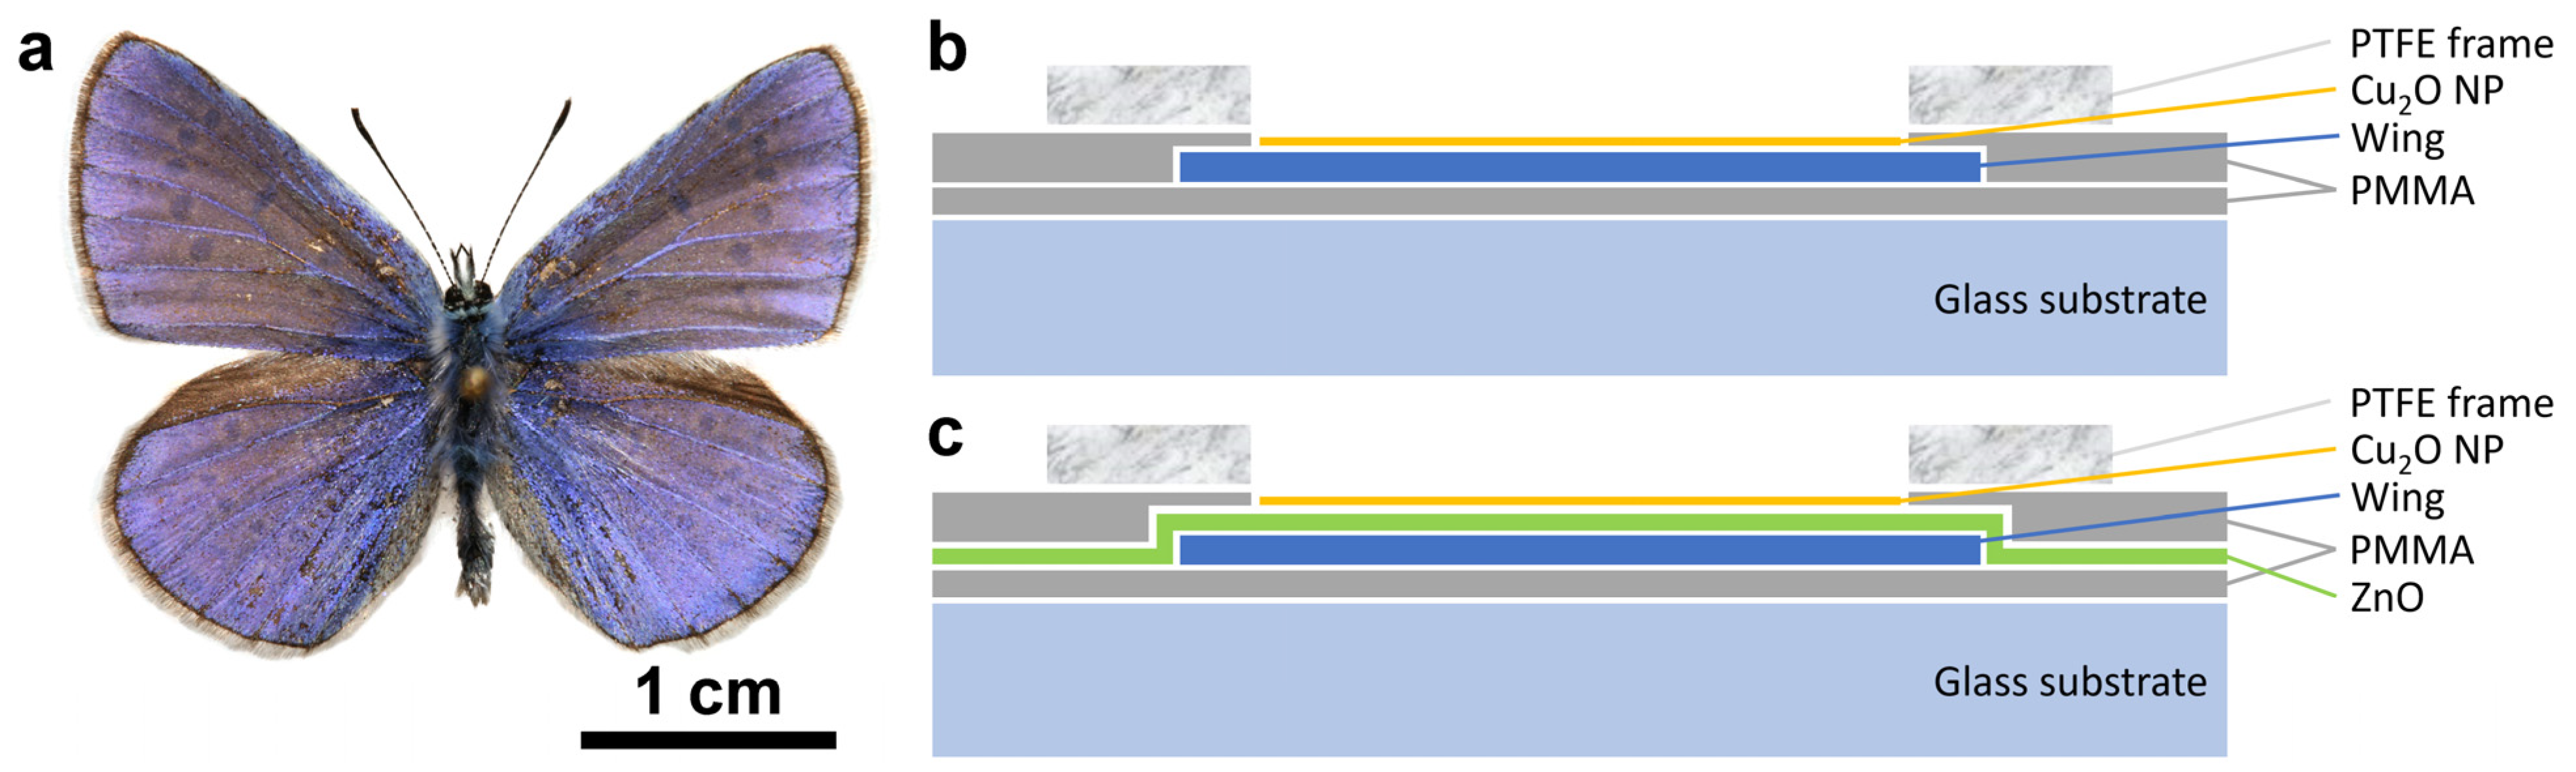
The dorsal wing surfaces of male
P. icarus butterflies (
Figure 1a) were used as biological photonic nanoarchitectures colored by structural color. Two different groups of sample structures were used: type-1 samples without (
Figure 1b), and type-2 samples with (
Figure 1c) 15 nm of conformally deposited ZnO layer [
38].
For octahedral Cu
2O nanoparticles, slight modifications and upscaling were applied on a recently published protocol [
48]. Briefly, 1 mL Cu(NO
3)
2 solution (0.1 M) was added to 91.28 mL ultrapure water in a Schott glass and stirred for several minutes. Upon introducing the base solution (200 μL of 1 M NaOH), the solution turned light blue due to the formation of Cu(OH)
2, which was reduced by the swift addition of hydrazine solution (3 mL, 0.2 M) under vigorous stirring. The solution turned orange within the first minute, and the growth proceeded for 10 min. The particles were collected and washed via centrifugation and redispersion with ethanol–water mixtures (50:50
V/
V%), and finally, the Cu
2O nanoparticles were redispersed in 105 mL of absolute ethanol to prepare the solution for deposition experiments.
Type-1 samples were prepared according to the following sequence: all four wings were detached from the body of the butterfly. The wings were glued onto glass slides using a very thin layer of polymethyl methacrylate (PMMA). After the gluing, the samples were left to dry overnight; reflectance spectra were measured the next day. An integrating sphere was used for the reflectance measurements to reduce the effects arising from wing scale orientation with respect to the wing plane (see Figure 10 in [
47]). After the measurement, three of the glass-mounted samples were left overnight in ethanol and gently washed with fresh ethanol before drying. A third sample was kept for comparison. To avoid the uncontrolled spreading of the Cu
2O sol, 1 mm thick polytetrafluoroethylene (PTFE) frames with a circular opening of 8 mm in diameter (
Figure 1b) were glued carefully—also using PMMA—onto the glass mounted wings in such a way to avoid the flowing out of the PMMA solution into the circular opening. The samples were left to dry overnight, and reflectance measurements were carried out the next day, placing the sample port of the integrating sphere onto the PTFE frame. After the reflectance measurement, the Cu
2O sol in ethanol was carefully added into the circular opening of the PTFE frames in doses of 40 µL. Samples with 40, 80, and 120 µL were prepared. After adding the amount of 40 µL, the next dose was added only after the complete drying of the sample.
Type-2 samples were prepared according to the following sequence: all four wings were detached from the body of the butterfly. For one butterfly, two wings were kept in pristine state as comparison samples, the other two wings were used to prepare samples for further processing, these wings were fixed onto a Si wafer and loaded in the ALD apparatus. Next, a 15 nm conformal ZnO layer was deposited onto the wings. The homogeneity of the deposition was checked using a photo-processing procedure reported earlier [
49] based on the transformation from the RGB color space to HSB through the parameters of hue, saturation, and brightness, which provides a more straightforward and objective way to analyze such photographs. The processed wing images are shown in
Figure S1. After the ALD, the samples were glued with PMMA onto glass substrate and left to dry overnight; reflectance spectra with the integrating sphere were measured the next day. After measuring the spectra, the same procedure was used for the type-2 as for the type-1 samples, starting from the gluing of the 1 mm thick PTFE frames.
Similar samples were prepared only using bare glass slides with the PTFE frames with the 8 mm circular opening. These samples were used to test the spreading of the sol and the uniform distribution or clustering of the Cu2O.
Another type of samples was prepared on filter paper. A small piece of filter paper was fixed horizontally to the tip of a tweezer and the Cu2O sol was added in amounts of 40 µL.
The atomic layer deposition of the ZnO films took place in a Picosun Sunale R-100 (Espoo, Finland) ALD reactor at 100 °C with an 8 hPa background nitrogen pressure. The precursors were diethylzinc (DEZ) from Strem Chemicals (Bischheim, France) and 18 MΩ high purity DI water. The pulse lengths were chosen long enough so that the precursors may have time to diffuse into and homogeneously cover the pores of the structure (0.5 s pulses, with 15 s purging after the DEZ pulse and 20 s after the water pulse).
Optical reflectance and transmittance measurements were carried out by means of an Avantes (Apeldoorn, The Netherlands) modular fiber-optic system. We used an AvaSpec-HERO spectrometer, an AvaLight-DH-S-BAL stabilized UV–visible light source, an AvaSphere-30-REFL integrating sphere, and for reference, a WS-2 white diffuse tile. When necessary, a 5-point smoothing with FFT filter was applied, and the datasets were plotted with OriginPro 2021 (OriginLab Corporation, Northampton, MA, USA).
The presented optical micrographs and the images with extended depth of focus (EDF) were obtained using a Zeiss Axio Imager A1 (Jena, Germany) and a Nikon Eclipse LV150N (Nikon Instruments, Tokyo, Japan), respectively.
For scanning electron microscope inspection, a few mm2 wing pieces were cut and fixed on metallic sample holder stubs with conductive tape. In order to maintain the original state of the samples, no other treatment was applied. Images were taken using Thermo Fisher Scientific Scios 2 DualBeam (Waltham, MA, USA) device.
To test the effects of spectral engineering on the photocatalytic activity of the samples, rhodamine B (RhB) was used. The photocatalytic decomposition experiments were carried out in a glass cuvette 5 × 5 × 1 cm3 containing 20 cm3 of 15 μM RhB dissolved in water. A heat-free Asahi Spectra MAX-301 (Torrance, CA, USA) Xe lamp (300 W) with fiber optics was applied as a light source supplying a square-shaped beam (1.5 cm × 1.5 cm). The lamp-to-catalytic surface distance was 6 cm (corresponding to ca. 100 mW cm−2 light power). The conversion of RhB was followed by detecting the change in the characteristic absorption band at 554 nm vs. time using an Agilent Cary 60 (Santa Clara, CA, USA) UV–Vis spectrophotometer equipped with an immersion probe (l = 1 cm) that was placed inside the solution out of the illumination area. The conversion was calculated as (A0 − Ai)/A0, where A0 is the initial absorbance of RhB at 554 nm, and Ai is the absorbance at a given point in the reaction. The solution was continuously stirred during the reaction. The cuvette wall reached 80% transmittance at the wavelength of 360 nm. The active photocatalytic surface was a circle of 8 mm in diameter. The experimental conditions were chosen in a way that the ratio of the volume of RhB solution to the photocatalytic surface provided quasi-stationary reaction conditions throughout each experimental run for a better comparison of the initial rates. Soaking tests in RhB solution ruled out any detectable role of initial adsorption of the dye in the change in absorbance (note the high reaction volume over catalytic surface area ratio).
3. Results
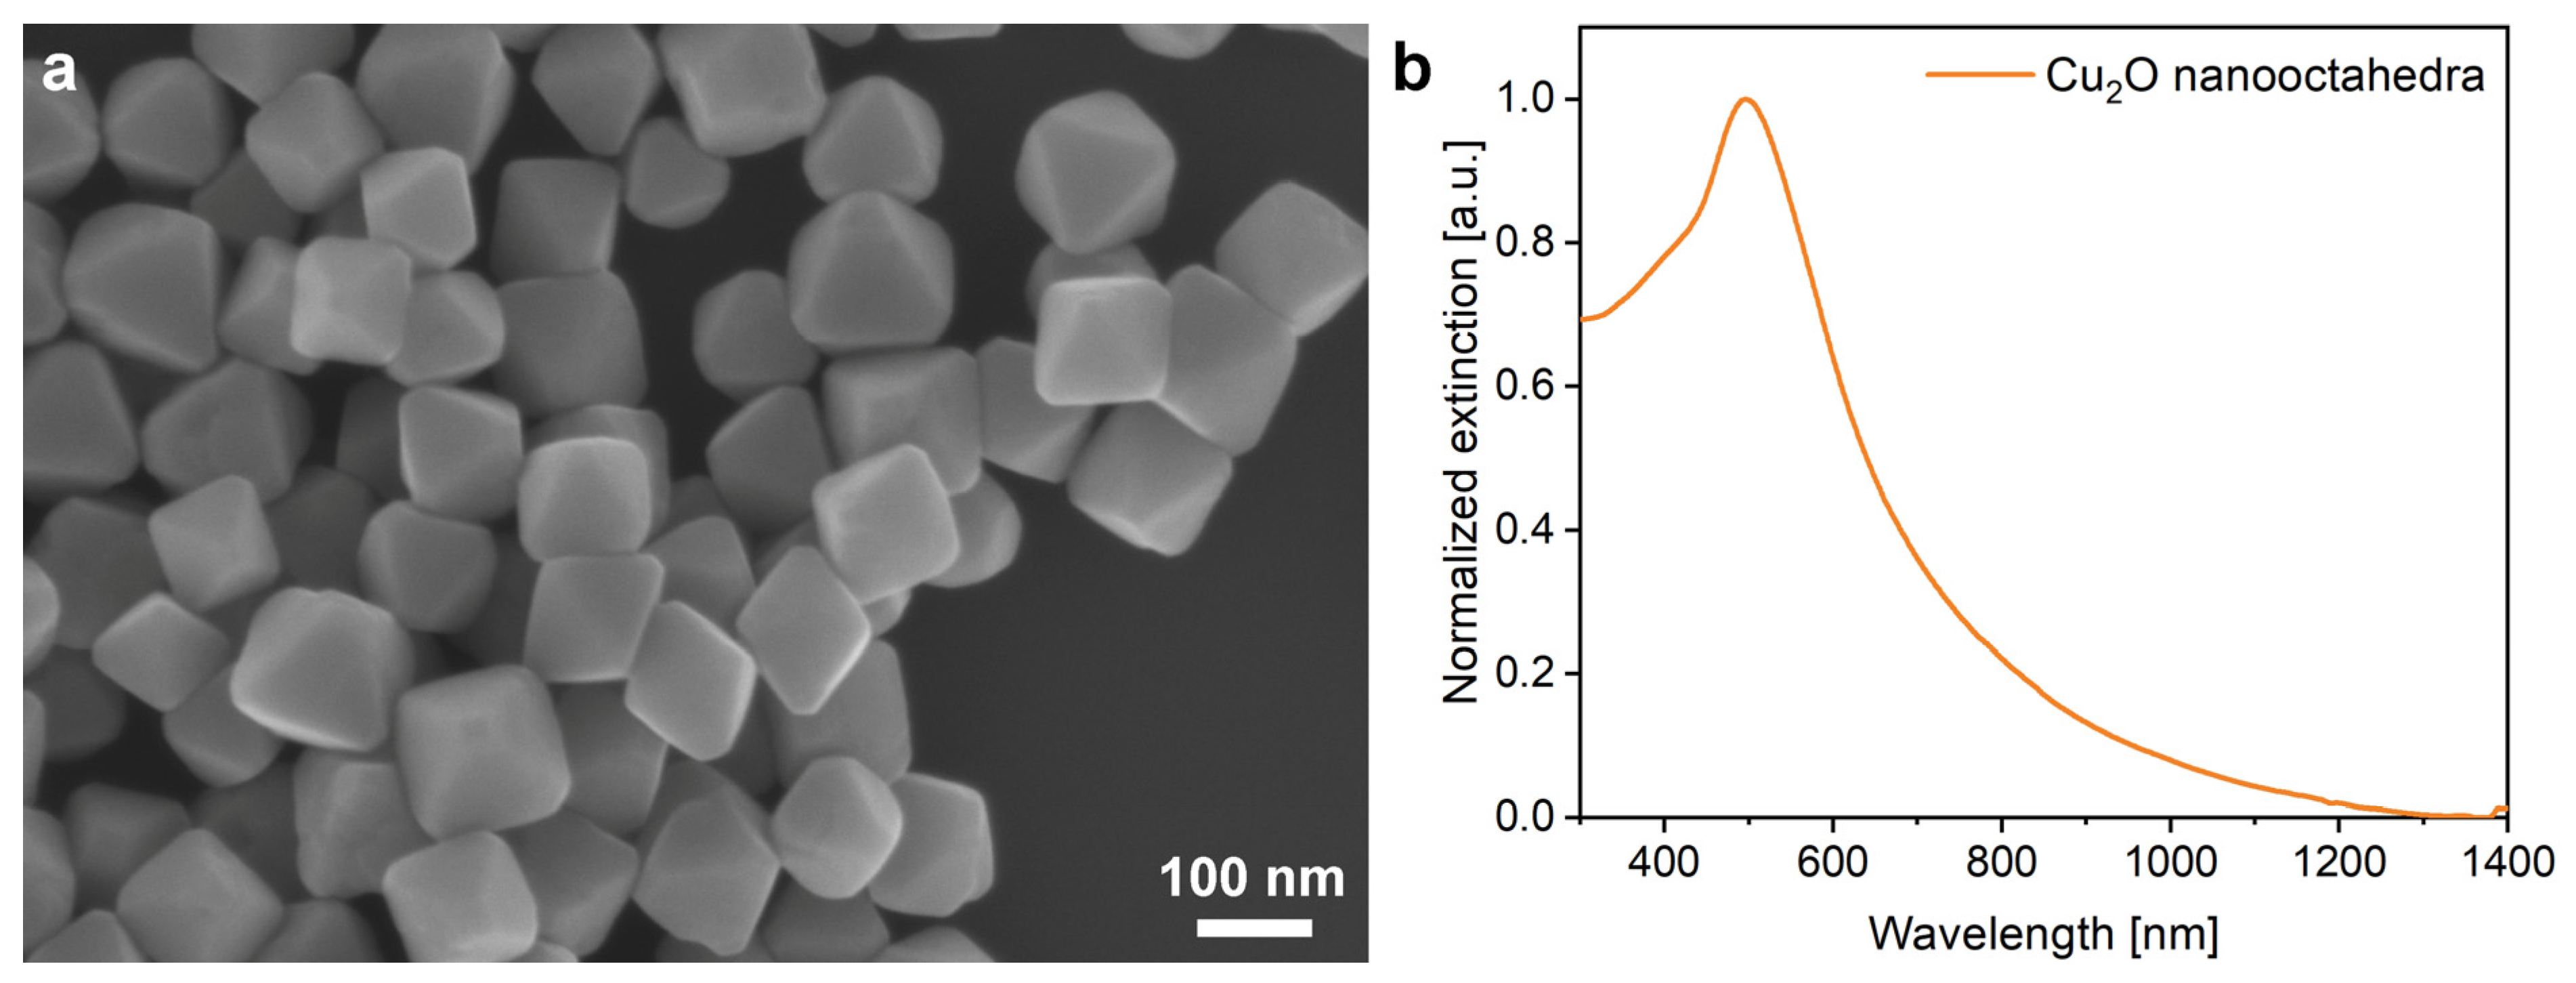
The Cu
2O nanoparticles were of octahedral shape and uniform size (
Figure 2), with the base edge length in the range of 136 (±12) nm and the maximum of their extinction is at 505 nm, which corresponds to their collective scattering and the band-edge absorption. Due to the smooth facets of the nano-octahedra, the extinction spectrum consists of a single narrow peak.
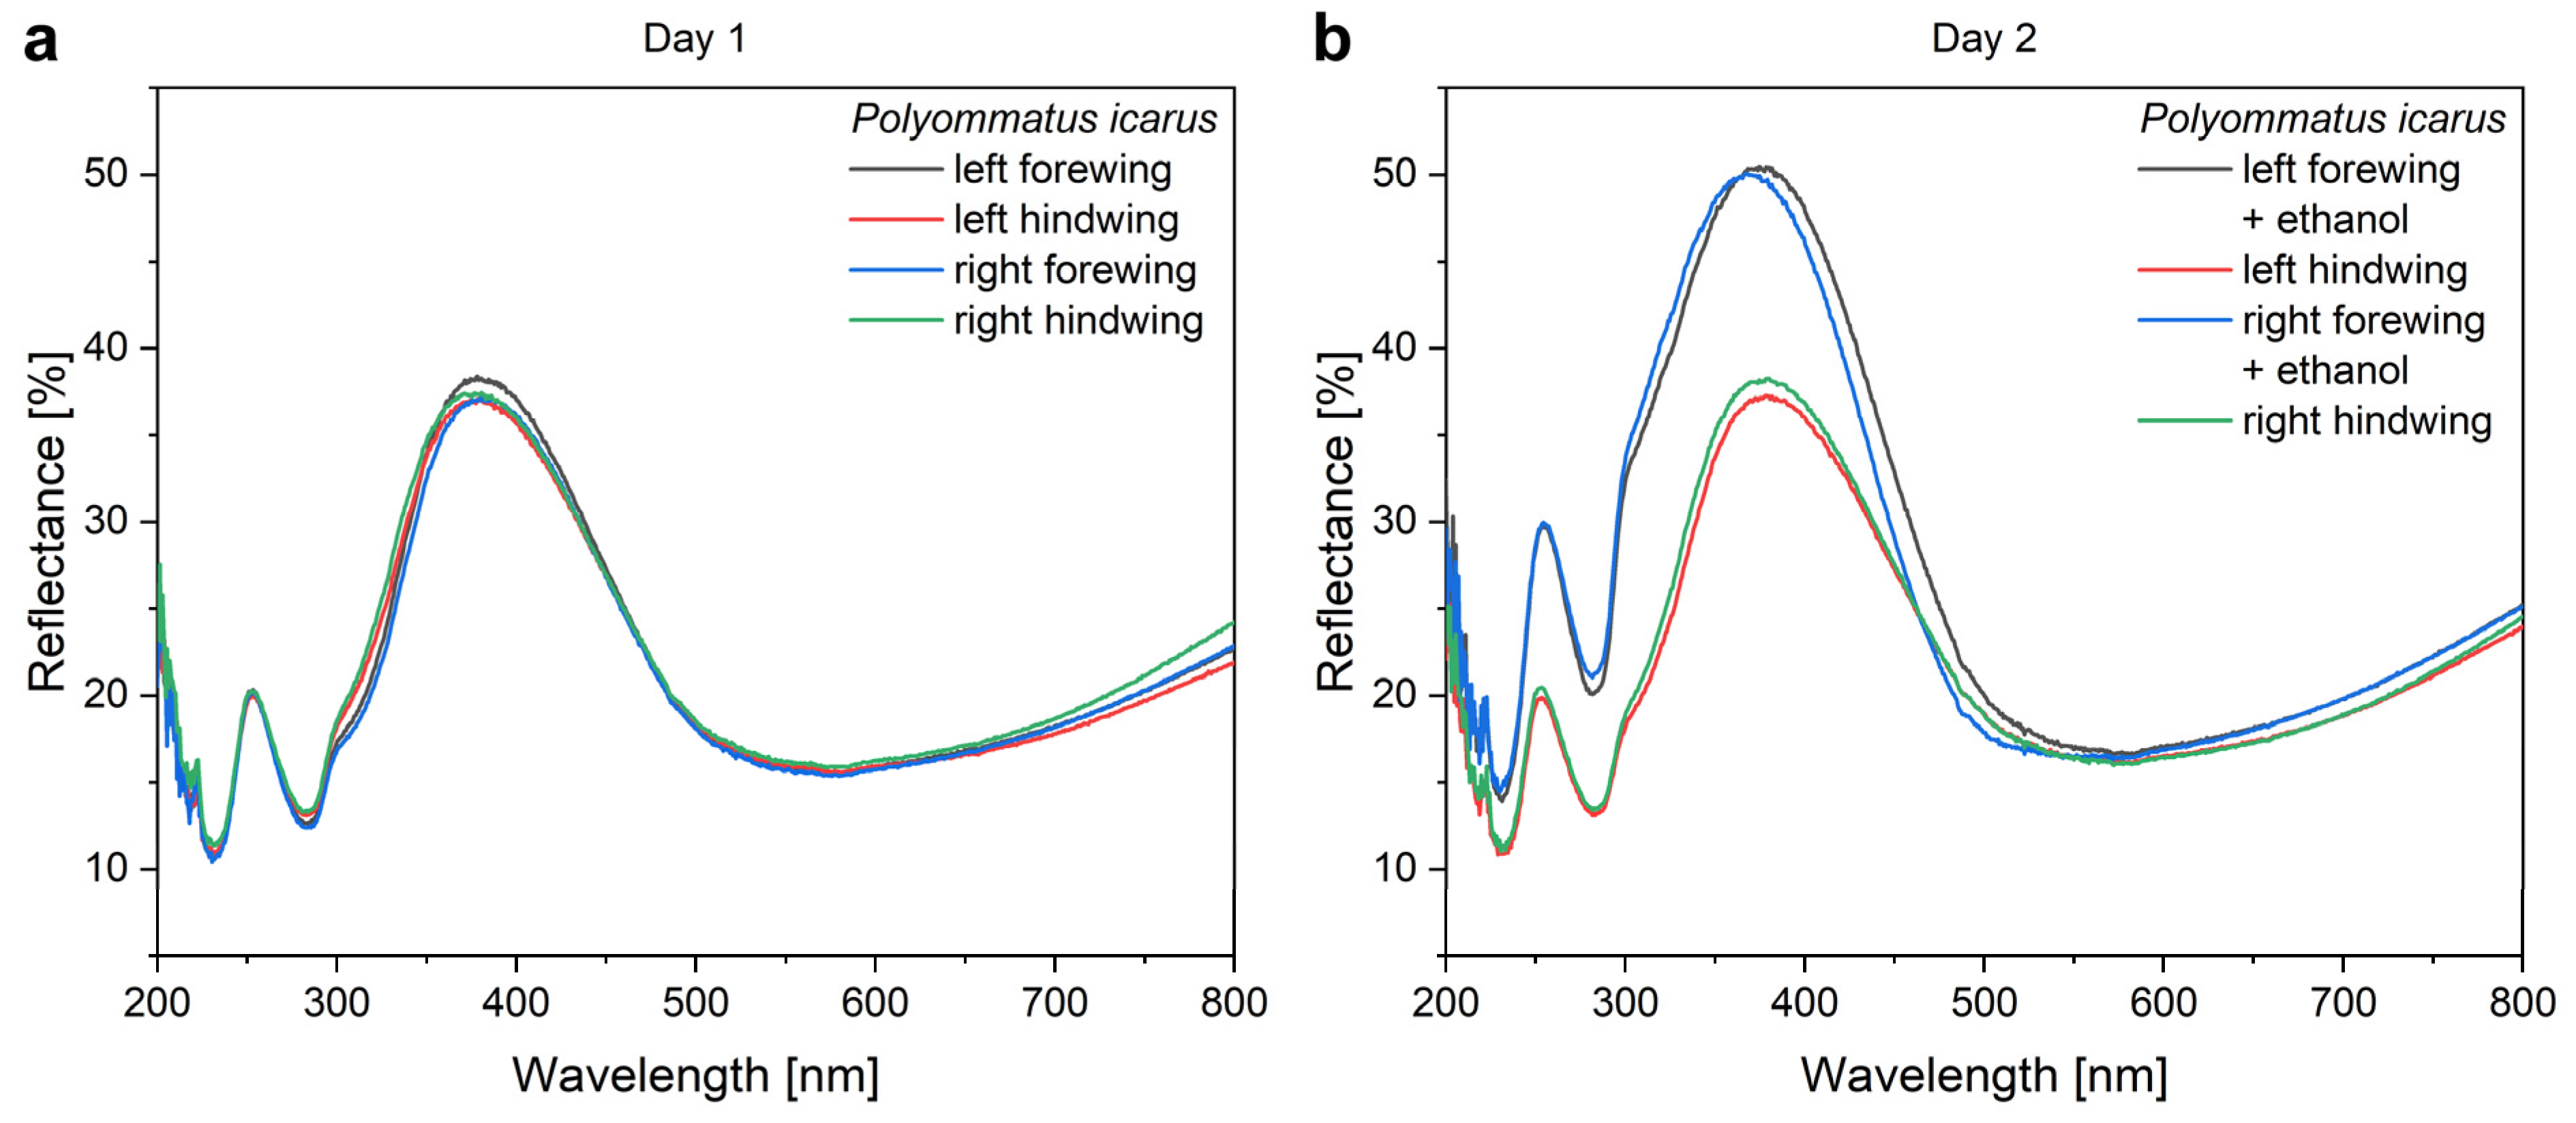
The ethanol pretreatment of the wings was applied to avoid the uncertainty that a certain modification in the optical properties is caused by the ethanol or the nanoparticles. The effect of the ethanol pretreatment is shown in
Figure 3.
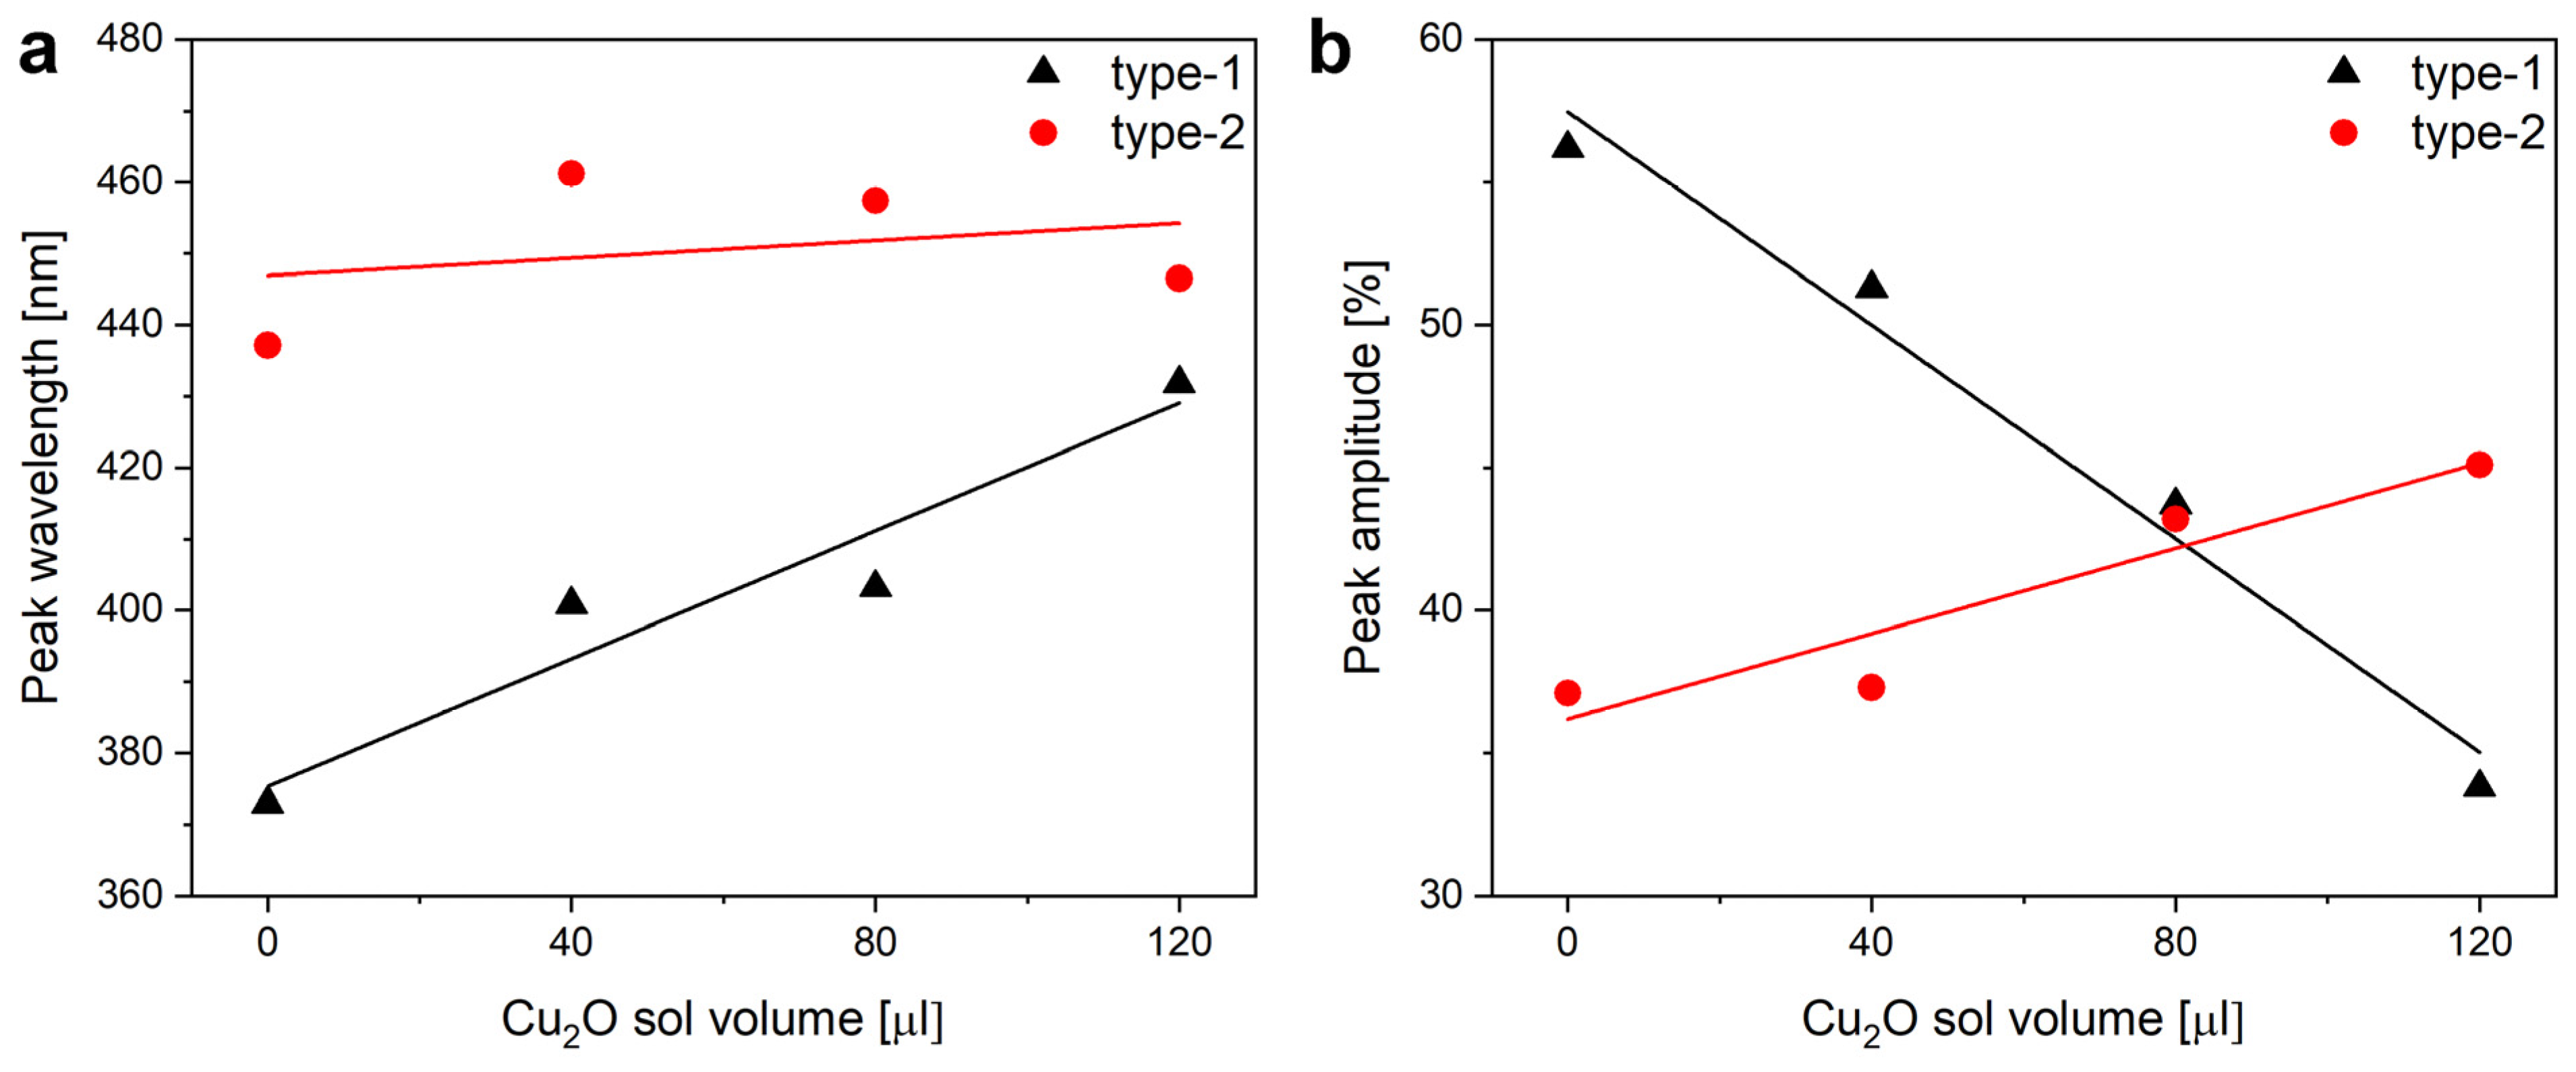
The application of increasing amounts of Cu
2O sol on the wings when preparing type-1 samples produced monotonic changes in the optical properties of the wings. The nanoparticles always redshifted the reflectance maximum of the wings. The magnitude of the redshift increased with the increasing amount of nanoparticles on the wing. The redshift was associated with the decrease in the intensity of the reflectance maximum (
Figure 4). The modifications of the optical properties of the type-1 and of the type-2 samples upon the application of the Cu
2O sol are summarized in
Figure 5.
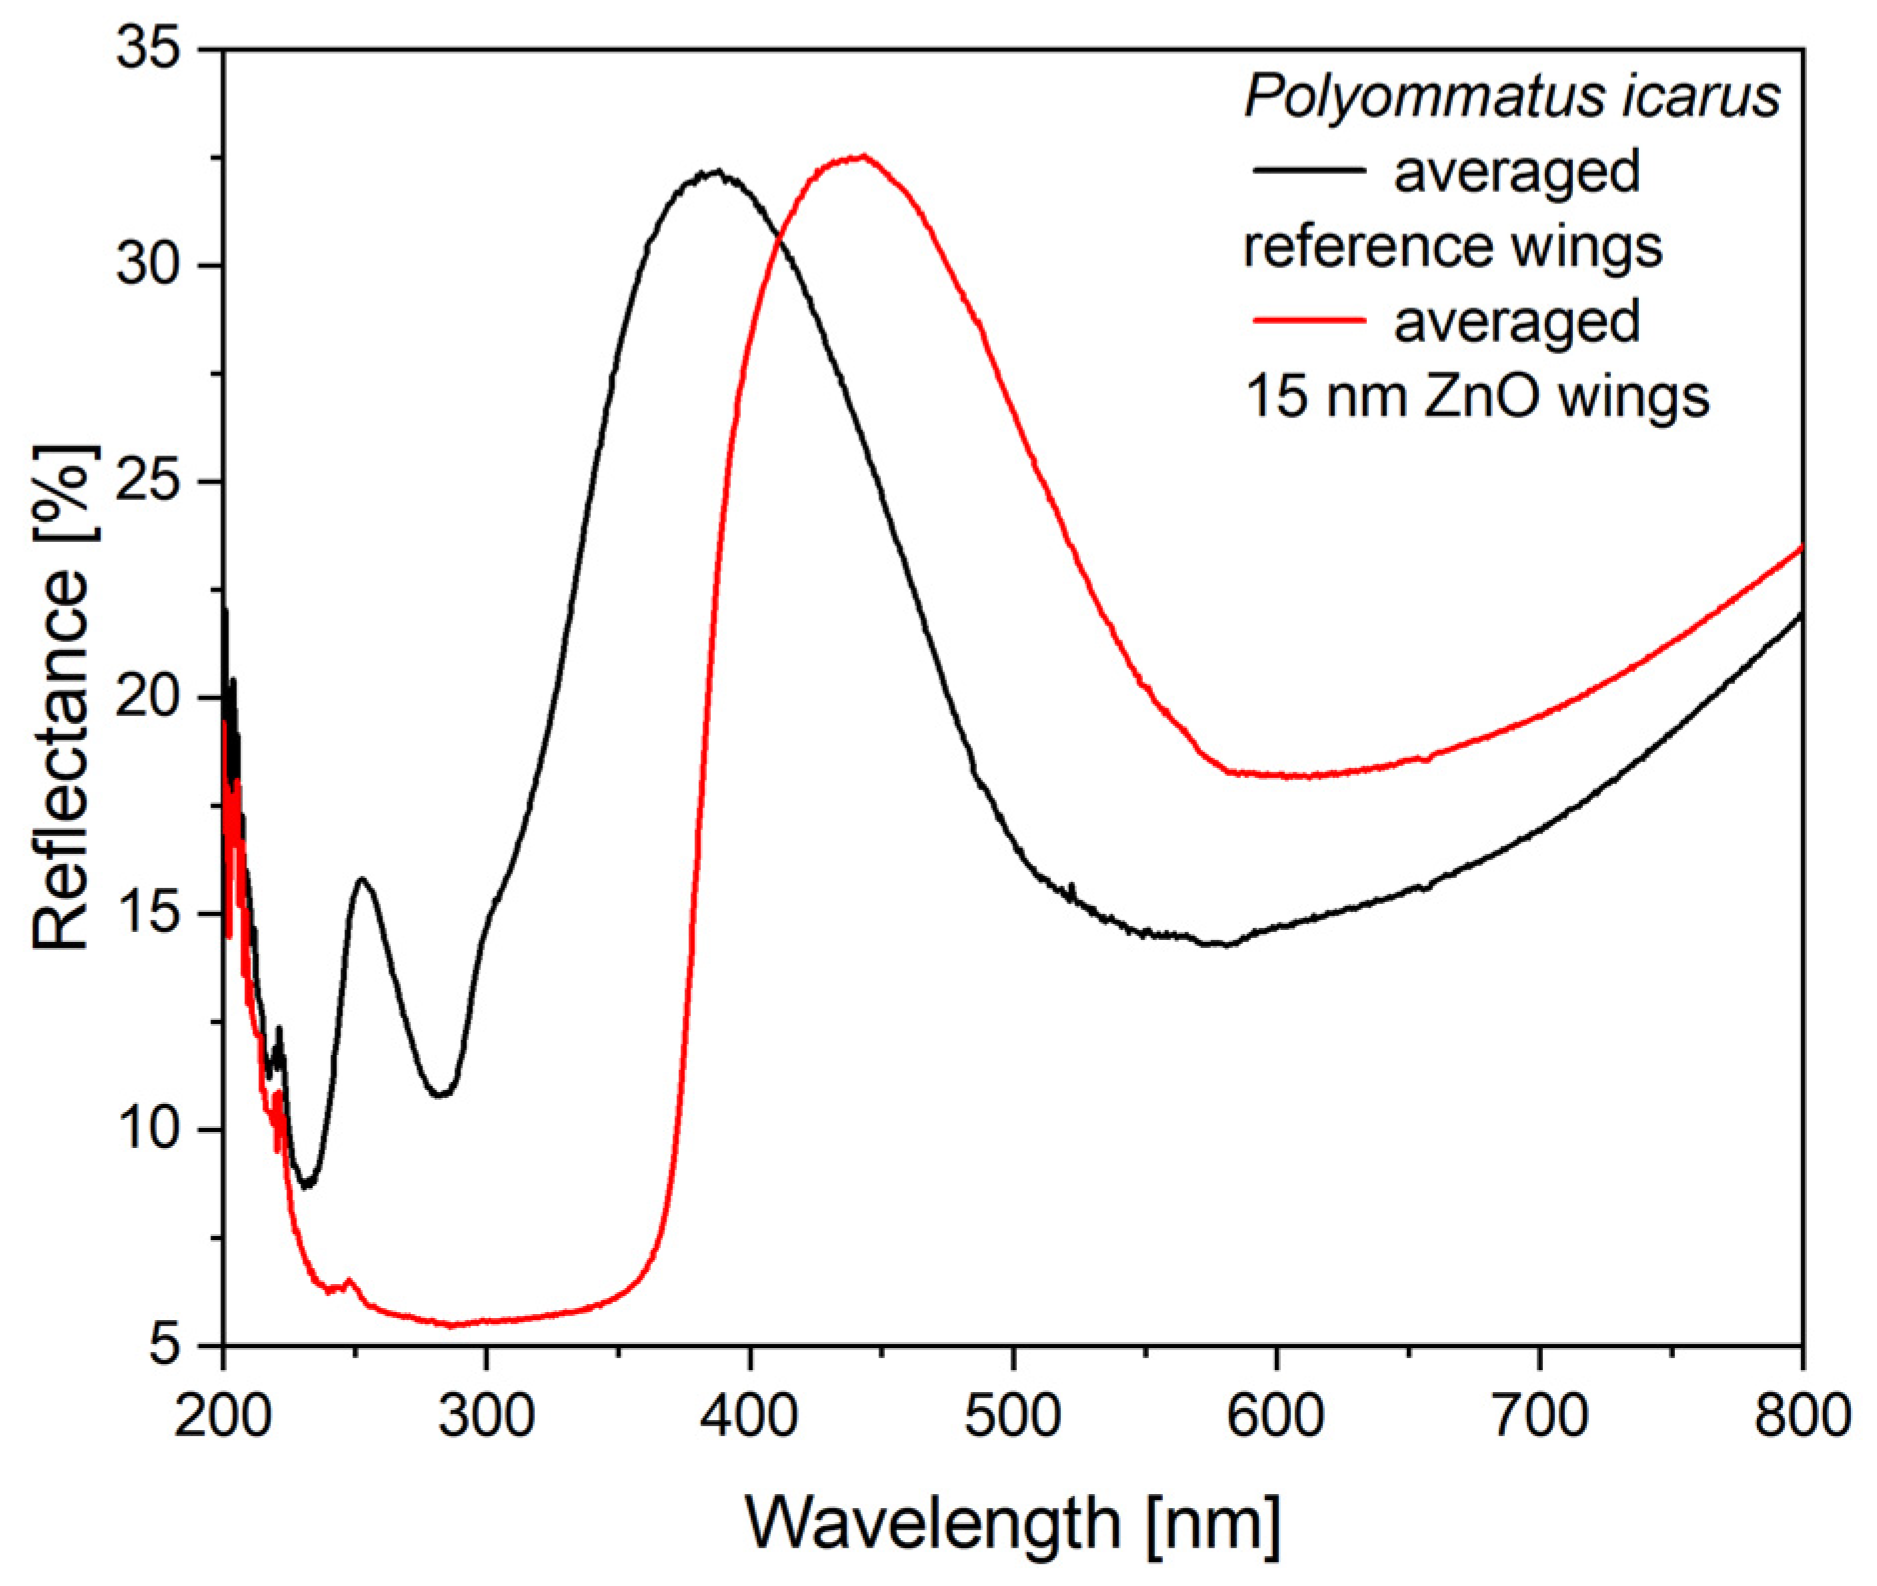
In the case of the type-2 samples, the Cu
2O sol was applied on wings conformally covered by 15 nm ZnO layer deposited by ALD. The ZnO deposition modified the optical properties of the wing as shown in
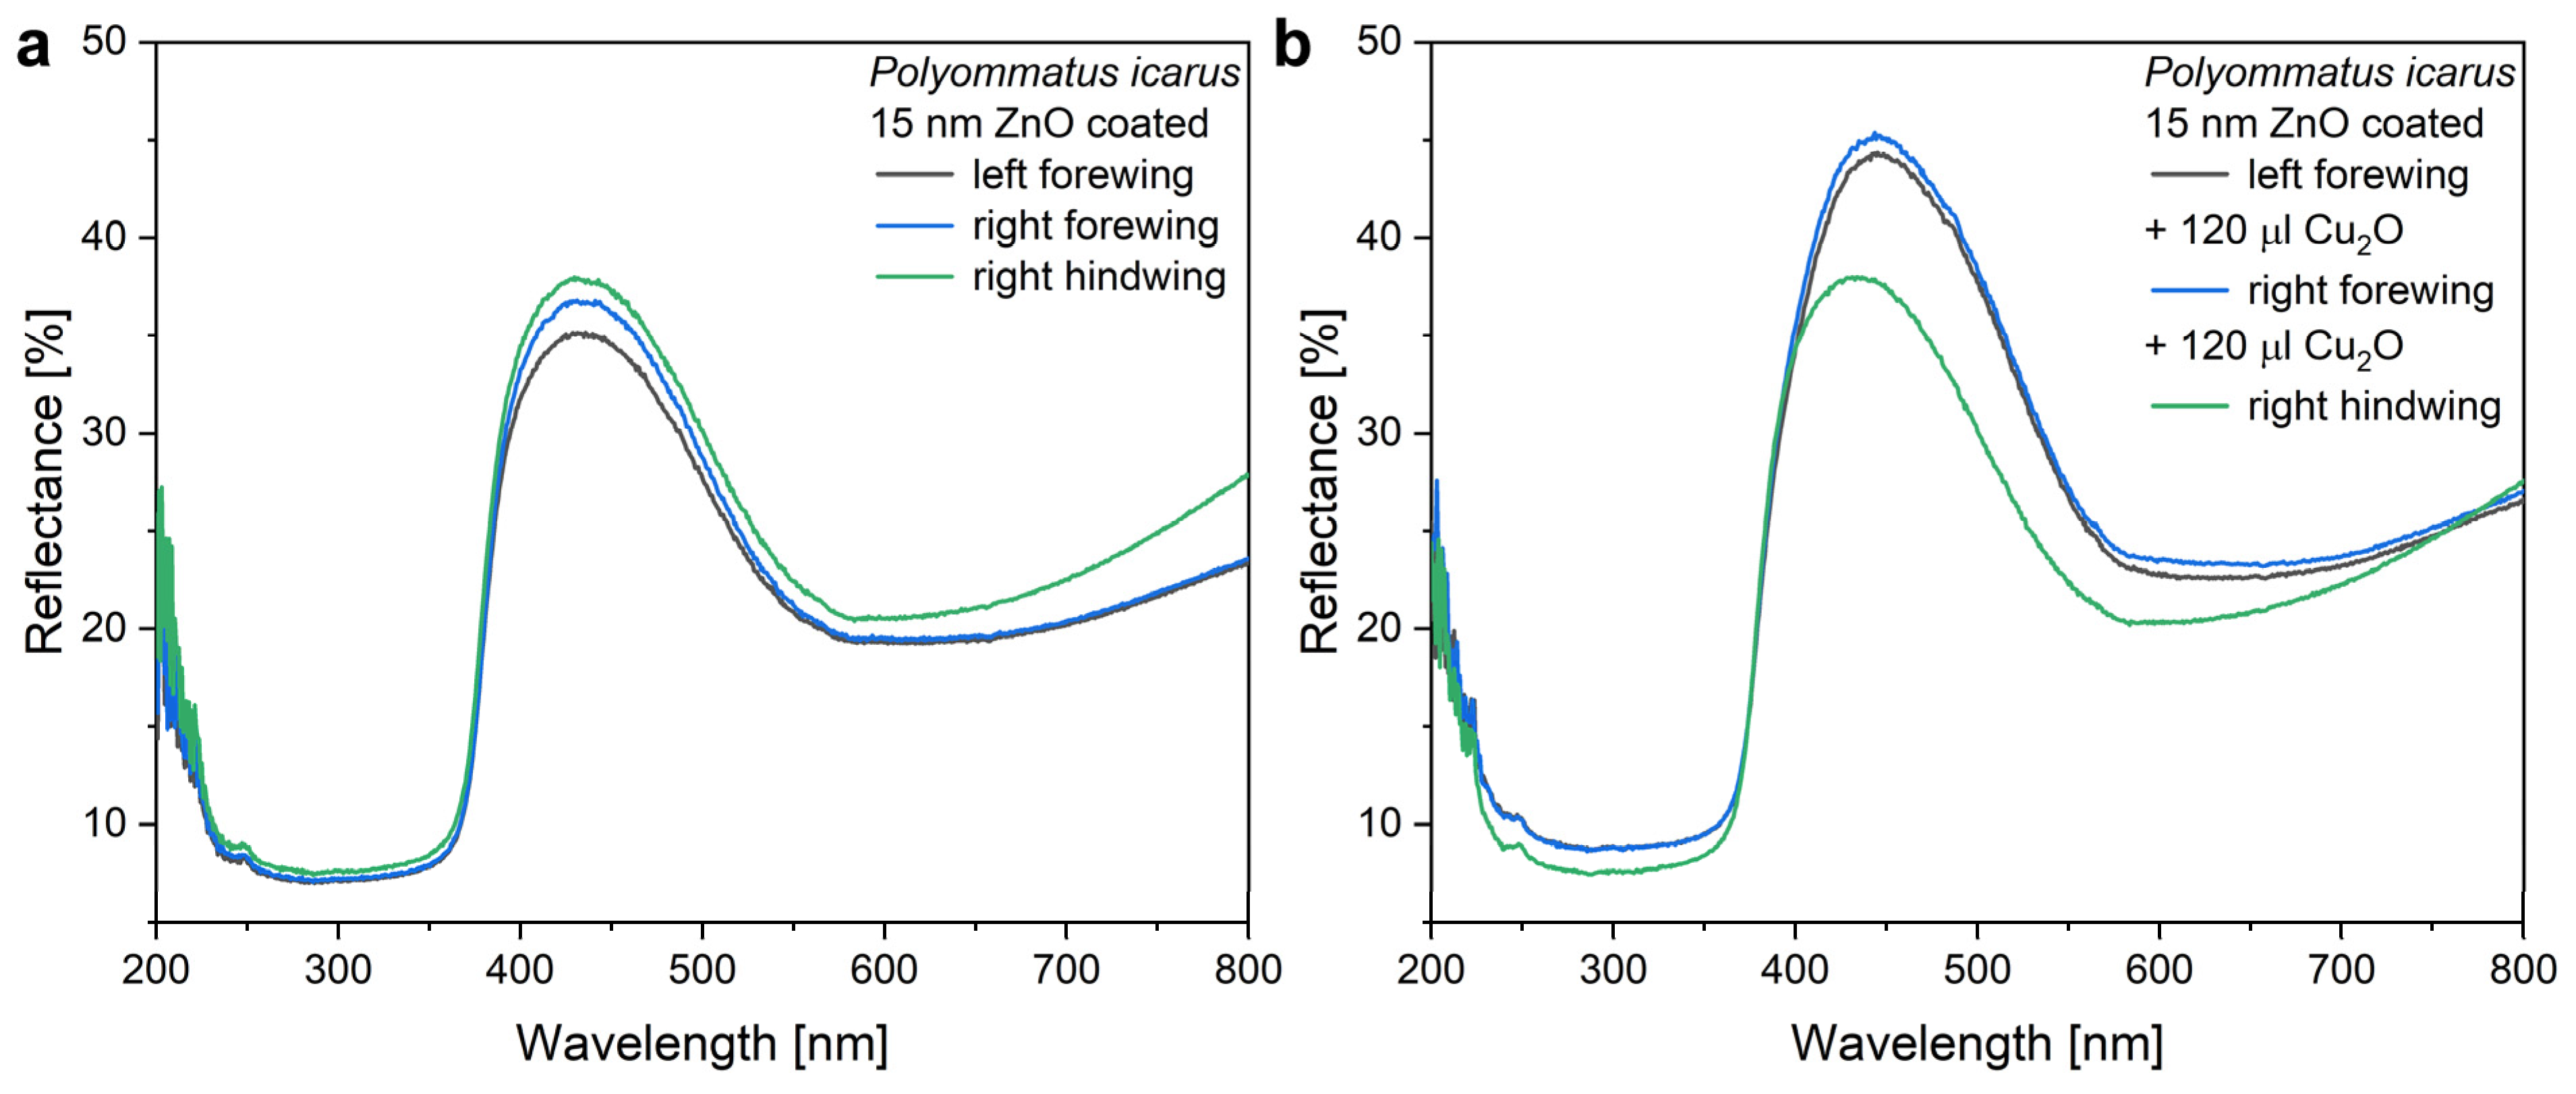
Figure 6. The most relevant modifications are: (i) the spectral position of the reflectance maximum is redshifted by 50 nm to 438 nm; (ii) due to the absorption of the ZnO layer, the samples have a very low reflectance below 380 nm.
The modifying effect of 120 µL of Cu
2O on the reflectance of a wing with the 15 nm ZnO coating is shown in
Figure 7, while in
Figure 5, the modifications induced by the application of 40, 80, and 120 µL of Cu
2O sol on type-1 and type-2 samples are compared. One may observe that the application of the increasing amounts of Cu
2O sol onto the type-2 samples has a smaller effect on the optical properties of these samples than was found for type-1 samples.
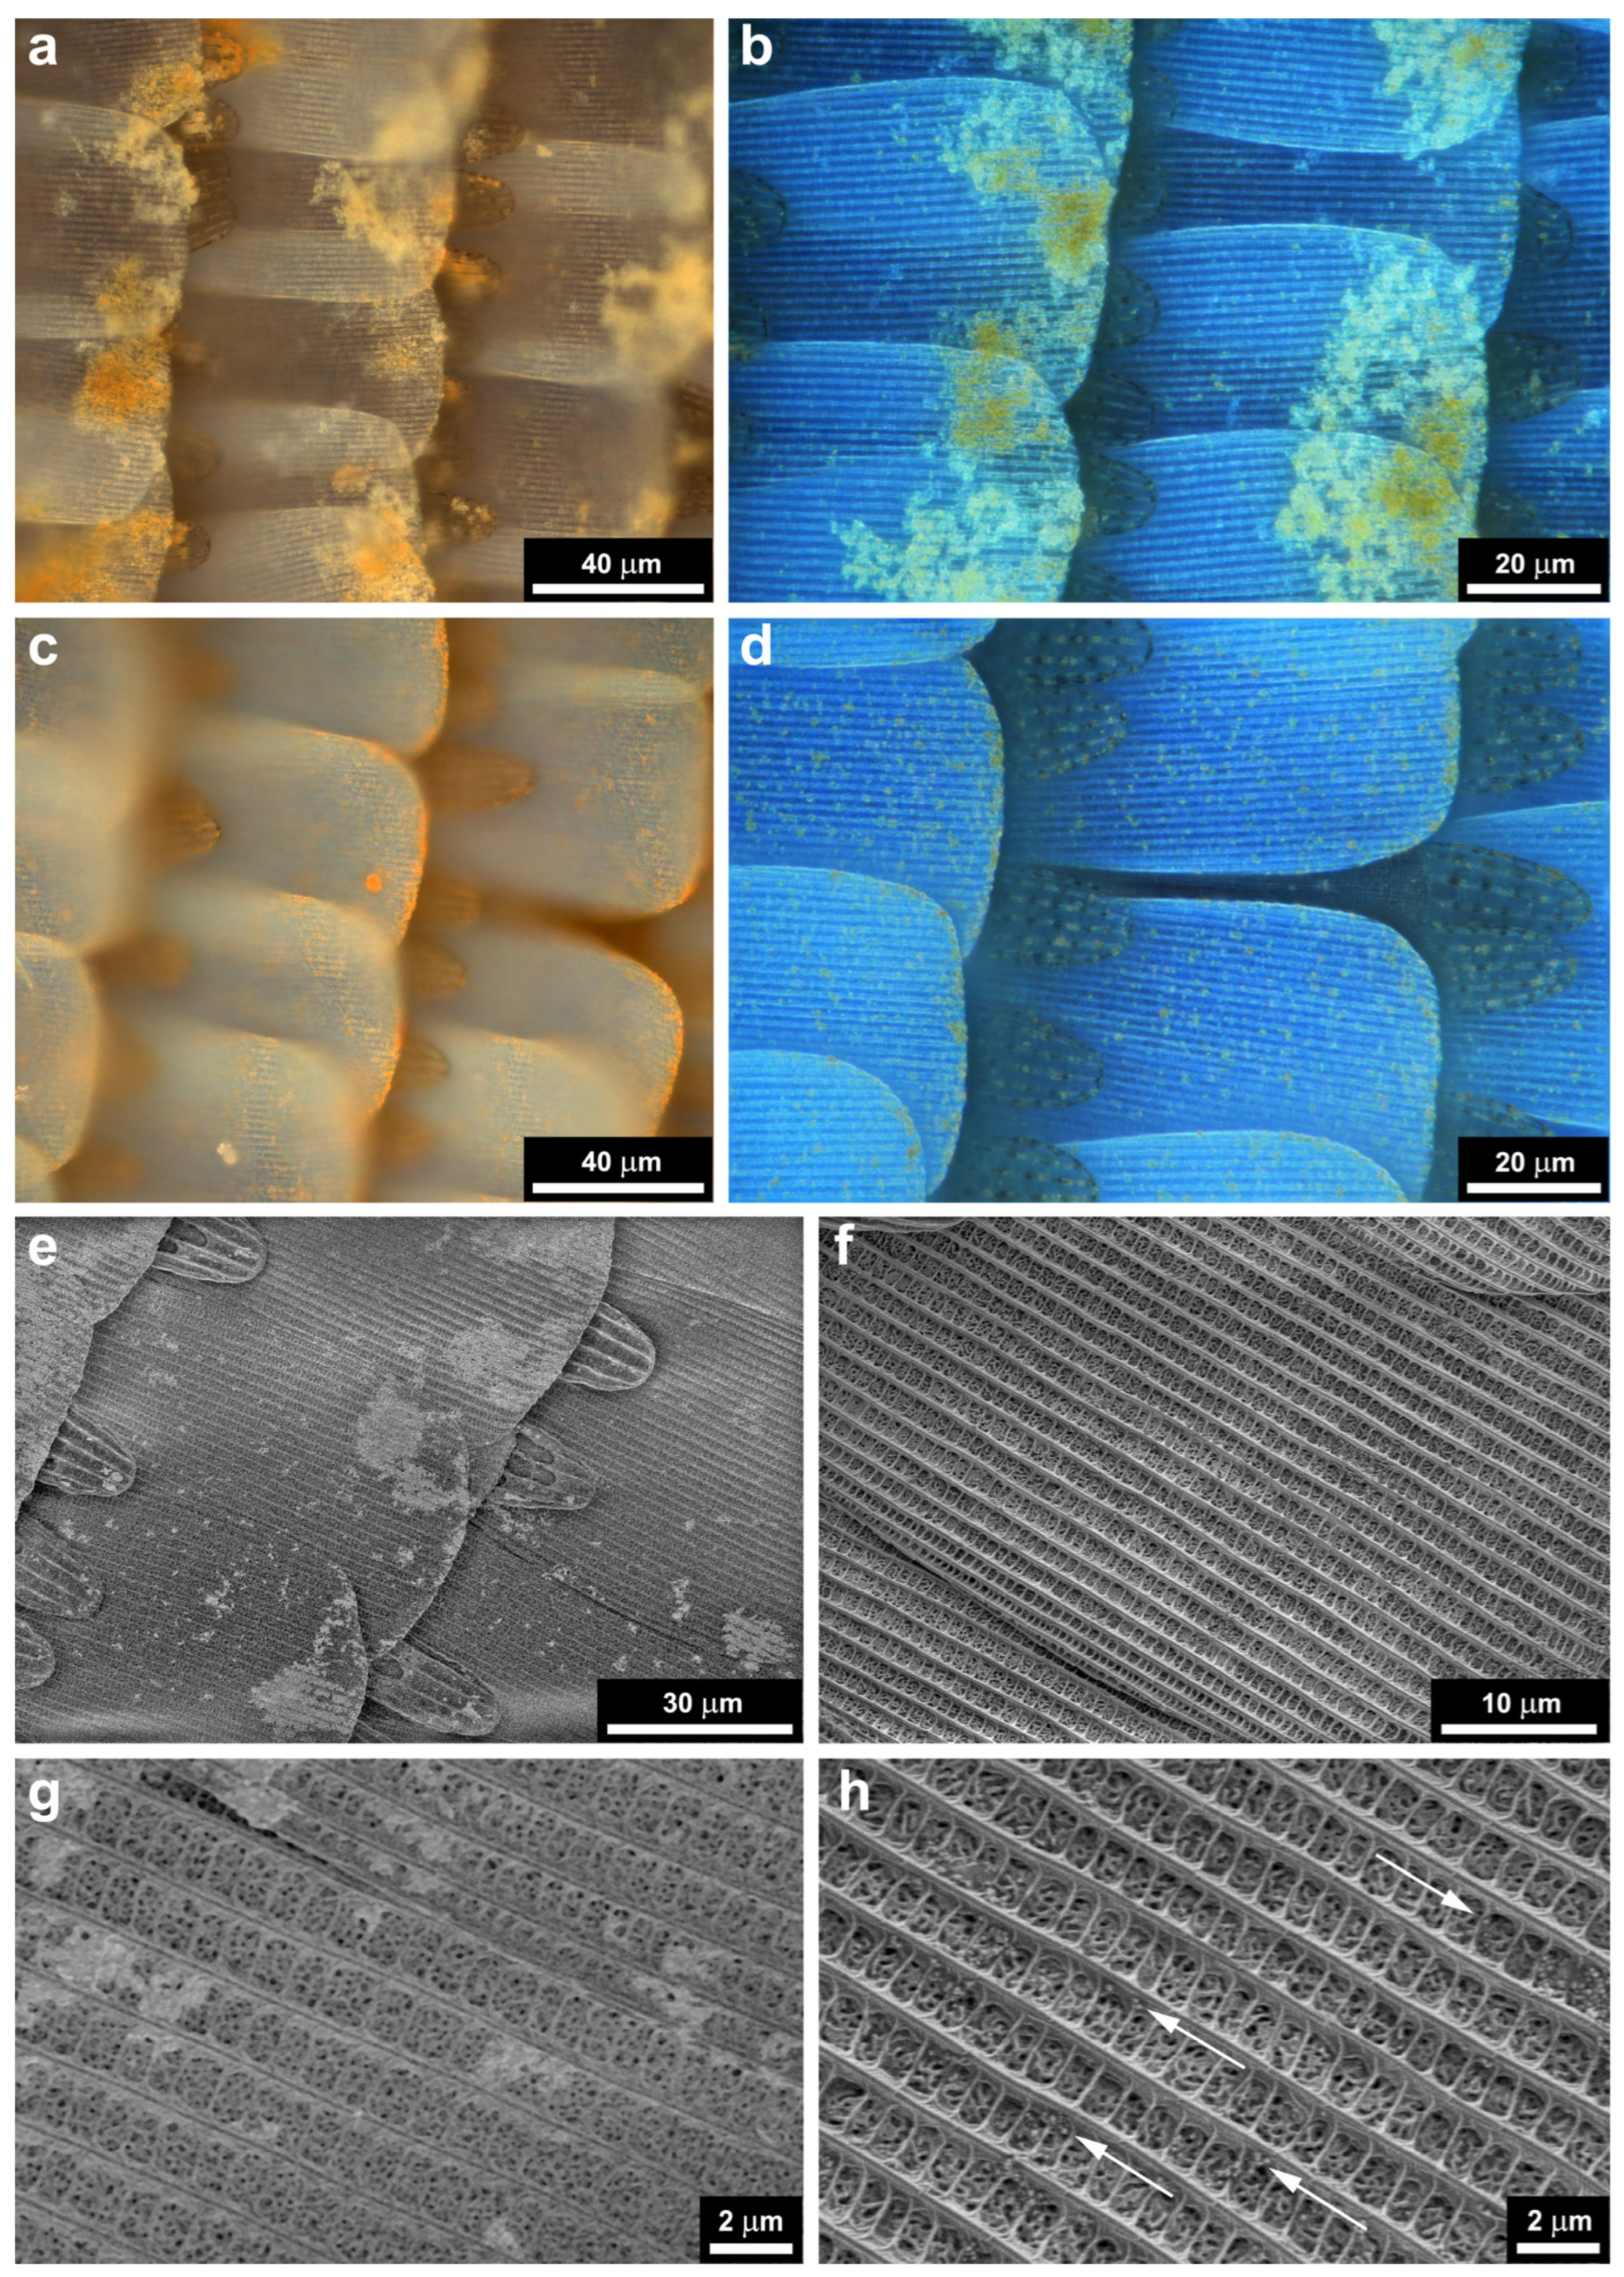
The optical microscopy images and the SEM micrographs of type-1 and type-2 samples are shown in
Figure 8. The major difference is that on the type-1 samples, the Cu
2O nanoparticles presented a much stronger tendency of clustering compared with the type-2 samples, where a much more uniform distribution of individual nanoparticles is found.
In
Figure 9, the digital photographs of the wing region seen through the circular opening of the PTFE frame are shown for type-1 and type-2 samples before the first photocatalysis experiment. Color differences are in agreement with the reflectance spectra shown in
Figure 9. The color of the samples and the corresponding spectra after the first photocatalytic experiments followed by gentle washing to remove RhB are presented in
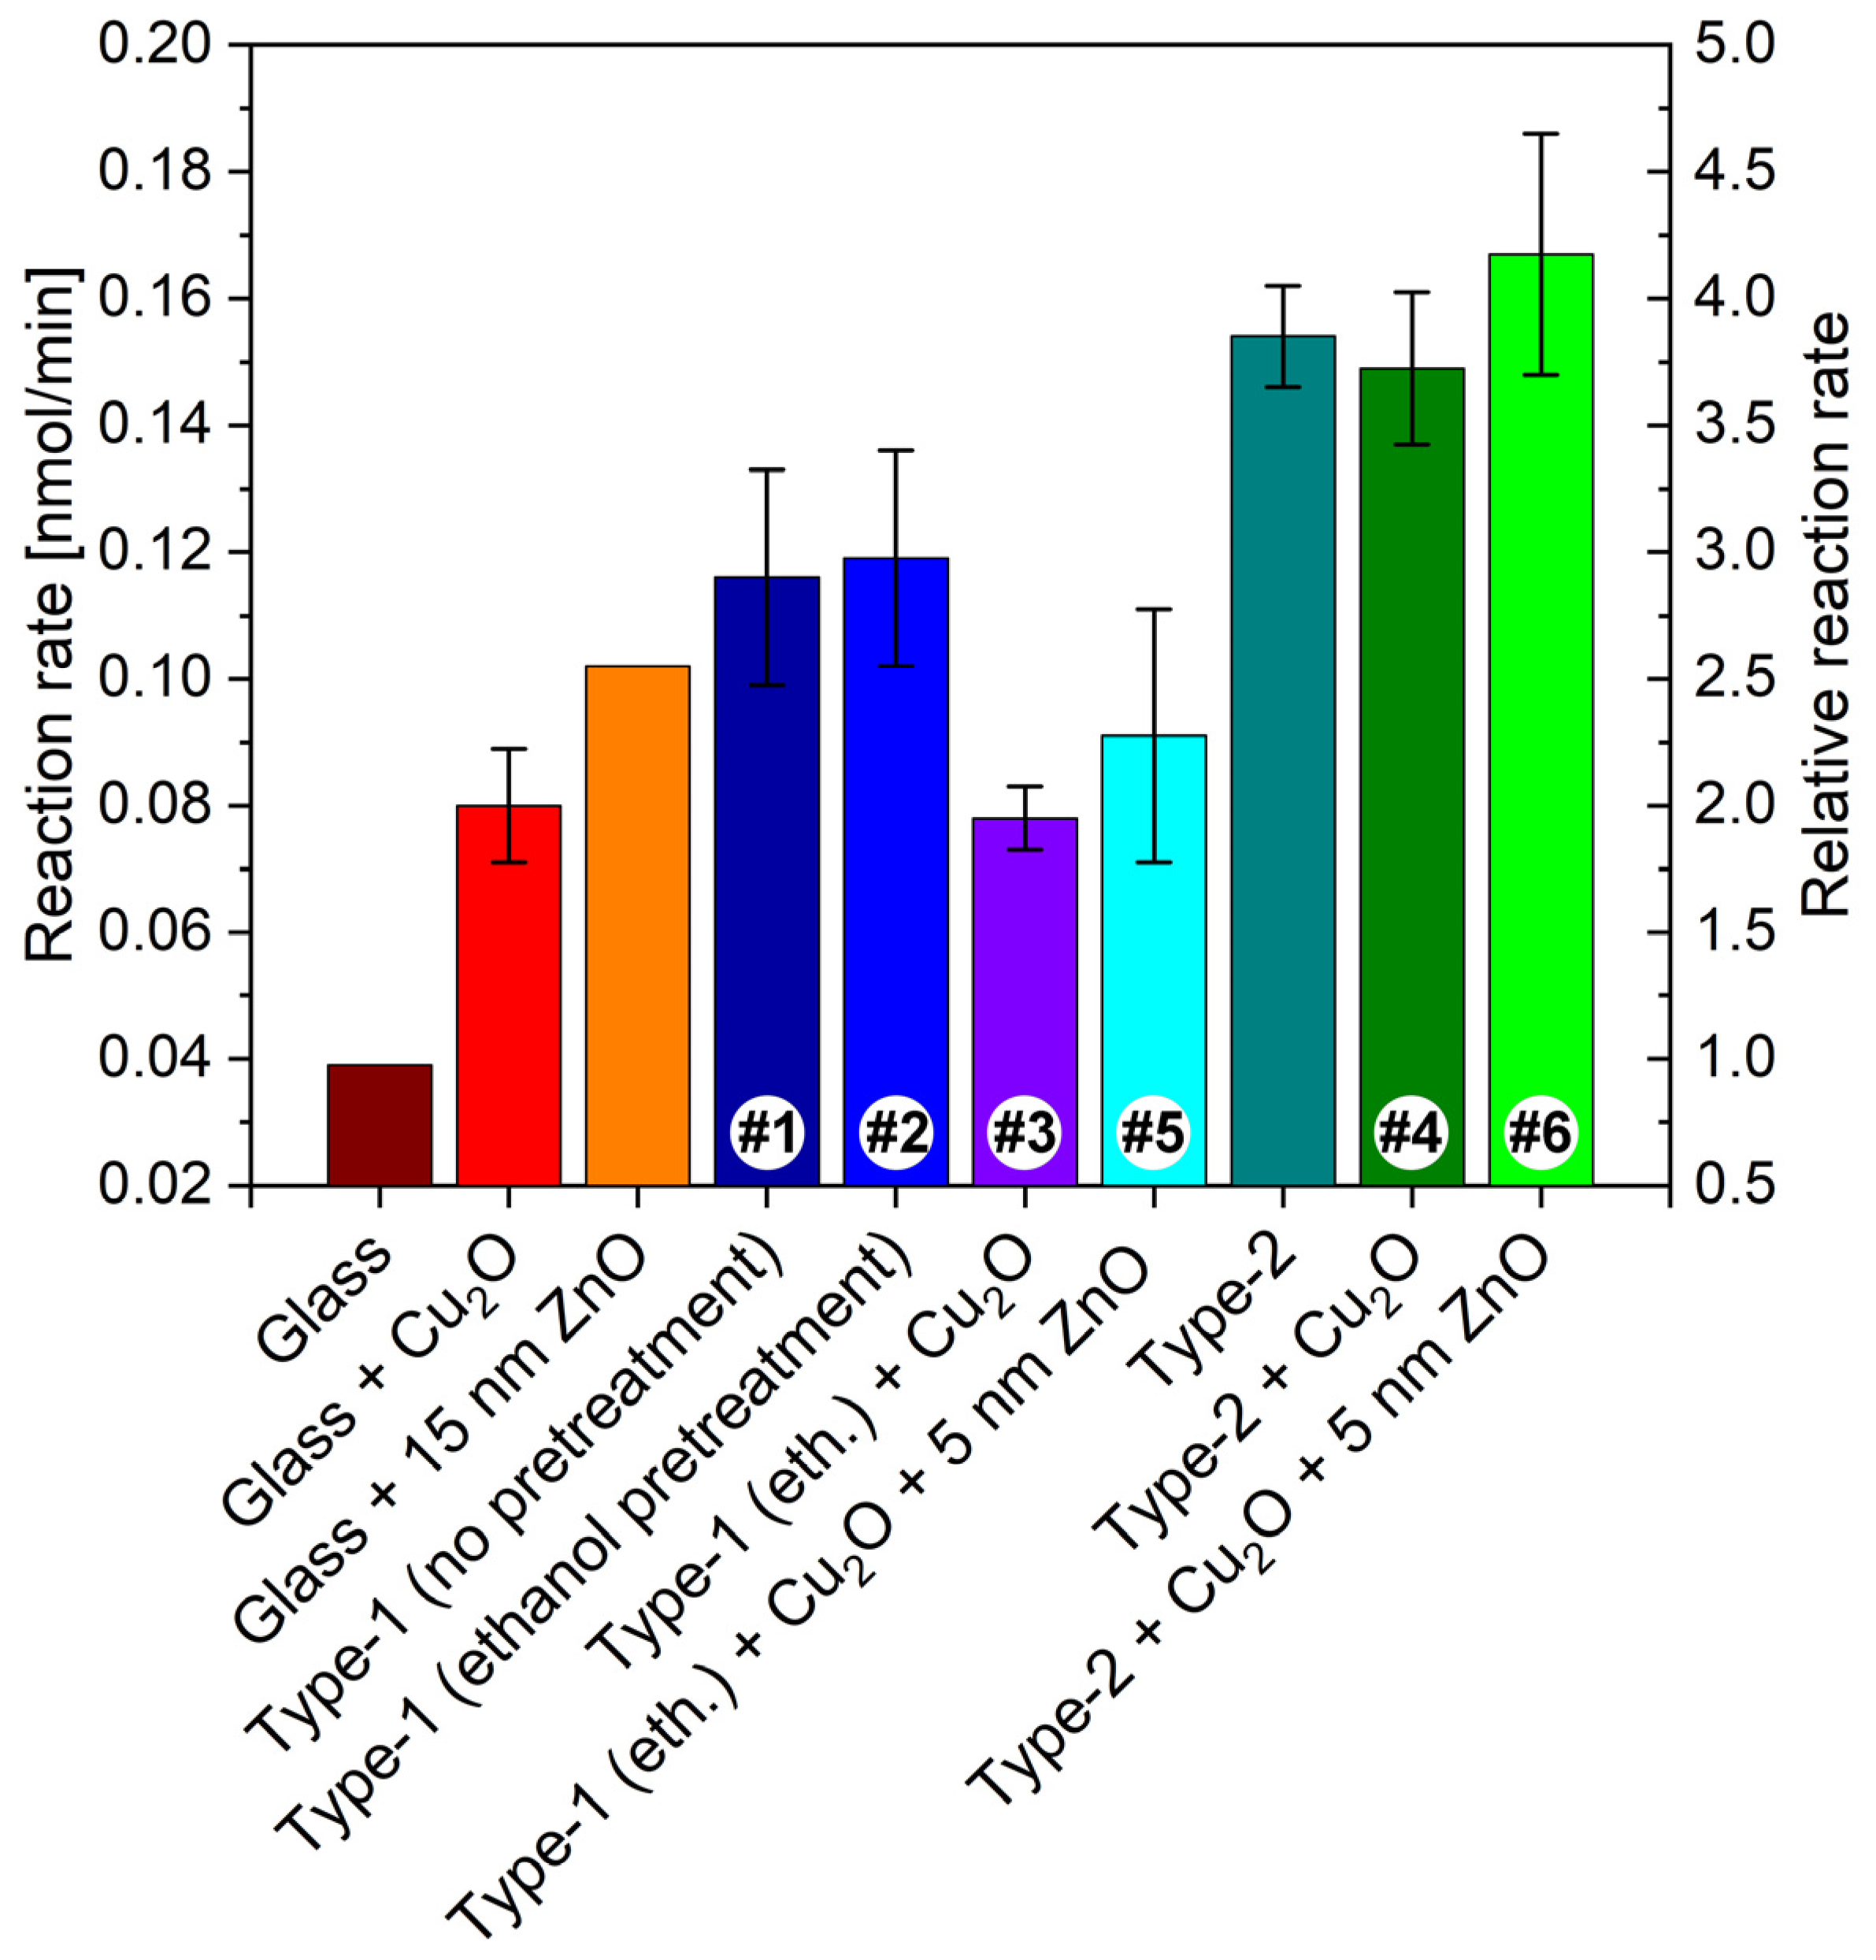
Figure S4. All samples exhibit modified color after the photocatalytic testing. The modifications are associated with the presence of adsorbed RhB. The averaged reaction rates of RhB photodegradation are summarized in
Table 1, and the relative reaction rates are compared in
Figure 10.
The distribution of Cu
2O nanoparticles on glass slides and glass slides covered by 15 nm ZnO masked with similar PTFE frames to avoid the uncontrolled spreading of the sol was investigated by optical microscopy and by spectral measurements, as in
Figure S2. The effect of particle concentration on the light scattering was also investigated by combining integrating sphere and standard transmittance measurements, seen in
Figure S2. From these measurements, one may observe that the Cu
2O NPs both on glass and ZnO-covered glass exhibit absorption extended into the visible range to 600 nm with the maximum in the range of 450 nm and are responsible for increasing light scattering as the number of NPs increases.
To examine if the optical properties of the Cu
2O nanoparticles in a dry state in air correspond with the extinction measured in ethanol (
Figure 2), a nanoparticle loaded filter paper was measured (
Figure S3). Filter paper was chosen because its major component, cellulose, has a chemical formula close to chitin, the major component of butterfly wings. Furthermore, in the filter paper, the NPs are arranged in a 3D fiber network not on a flat surface. A piece of filter paper was placed in the Cu
2O sol and stirred magnetically. By dividing the reflectance of the Cu
2O loaded filter paper by the reflectance of a pristine piece of filter paper, the reflectance minimum was obtained at 450 nm, slightly blue-shifted due to the different medium surrounding the NPs, as compared with the extinction maximum at 500 nm obtained for the NPs suspended in ethanol. In
Figure S3, the gradual decrease in the reflectance in the range of 200 to 600 nm with the increase in the amount of the Cu
2O NPs loaded on the filter paper is shown. In this experiment, the same piece of filter paper with a size comparable with the window in the PTFE frame was kept horizontally and increasing amounts of sol were loaded onto it. After each loading–drying cycle, spectra were taken. In agreement with the data of
Figure S2, absorption extended into the visible light spectrum to 600 nm was found, with the maximum in the range of 450 nm.
4. Discussion
Heterogenous photocatalysis is a light driven process that enables transformation of the abundant and environmentally safe sunlight into much needed chemical processes to achieve, for example, water purification. For this purpose, supported catalysts are needed, which can be used in a continuous-flow regime. To enhance the efficiency of the purification process, the properties of the used catalysts have to be tunable in a way to fit the characteristics of the pollutant to be removed. For this type of application, the photocatalyst has to be cheap and, in order to allow avoidance of the use of UV transparent materials with prohibitive prices, preferably, able to operate with visible light [
50,
51].
Due to their nanostructure, butterfly wings offer a support with a large specific surface that can be produced in a cheap and environmentally safe way, onto which different NPs can be immobilized and eventually coated by a few nanometers of different materials to enhance their catalytic effect. An additional benefit may arise from the photonic-crystal-type structures in the butterfly wings. To reveal these possibilities, we used the
P. icarus wing—Cu
2O NPs—ZnO coating system. In
Figure 3 and
Figure 4, the “spectral history” of the same four butterfly wings is presented during a period of four days of processing for type-1 samples. All the samples were re-measured each day. This clearly shows the reproducibility of the measurements and the modifications induced by each processing step. Initially, all four wings possessed overlapping reflectances. The ethanol pretreatment increased the reflectance and induced a slight blueshift of the reflectance maximum together with the broadening towards the UV. This is attributed to the dissolution of a thin layer of waxy material that coats the chitinous scales conformally [
52,
53,
54]. The wax is present to make the wings superhydrophobic [
55]. The pretreatment in ethanol removes a few nanometers of the wax layer, therefore, inducing a modification similar to that produced by oxygen plasma treatment [
56].
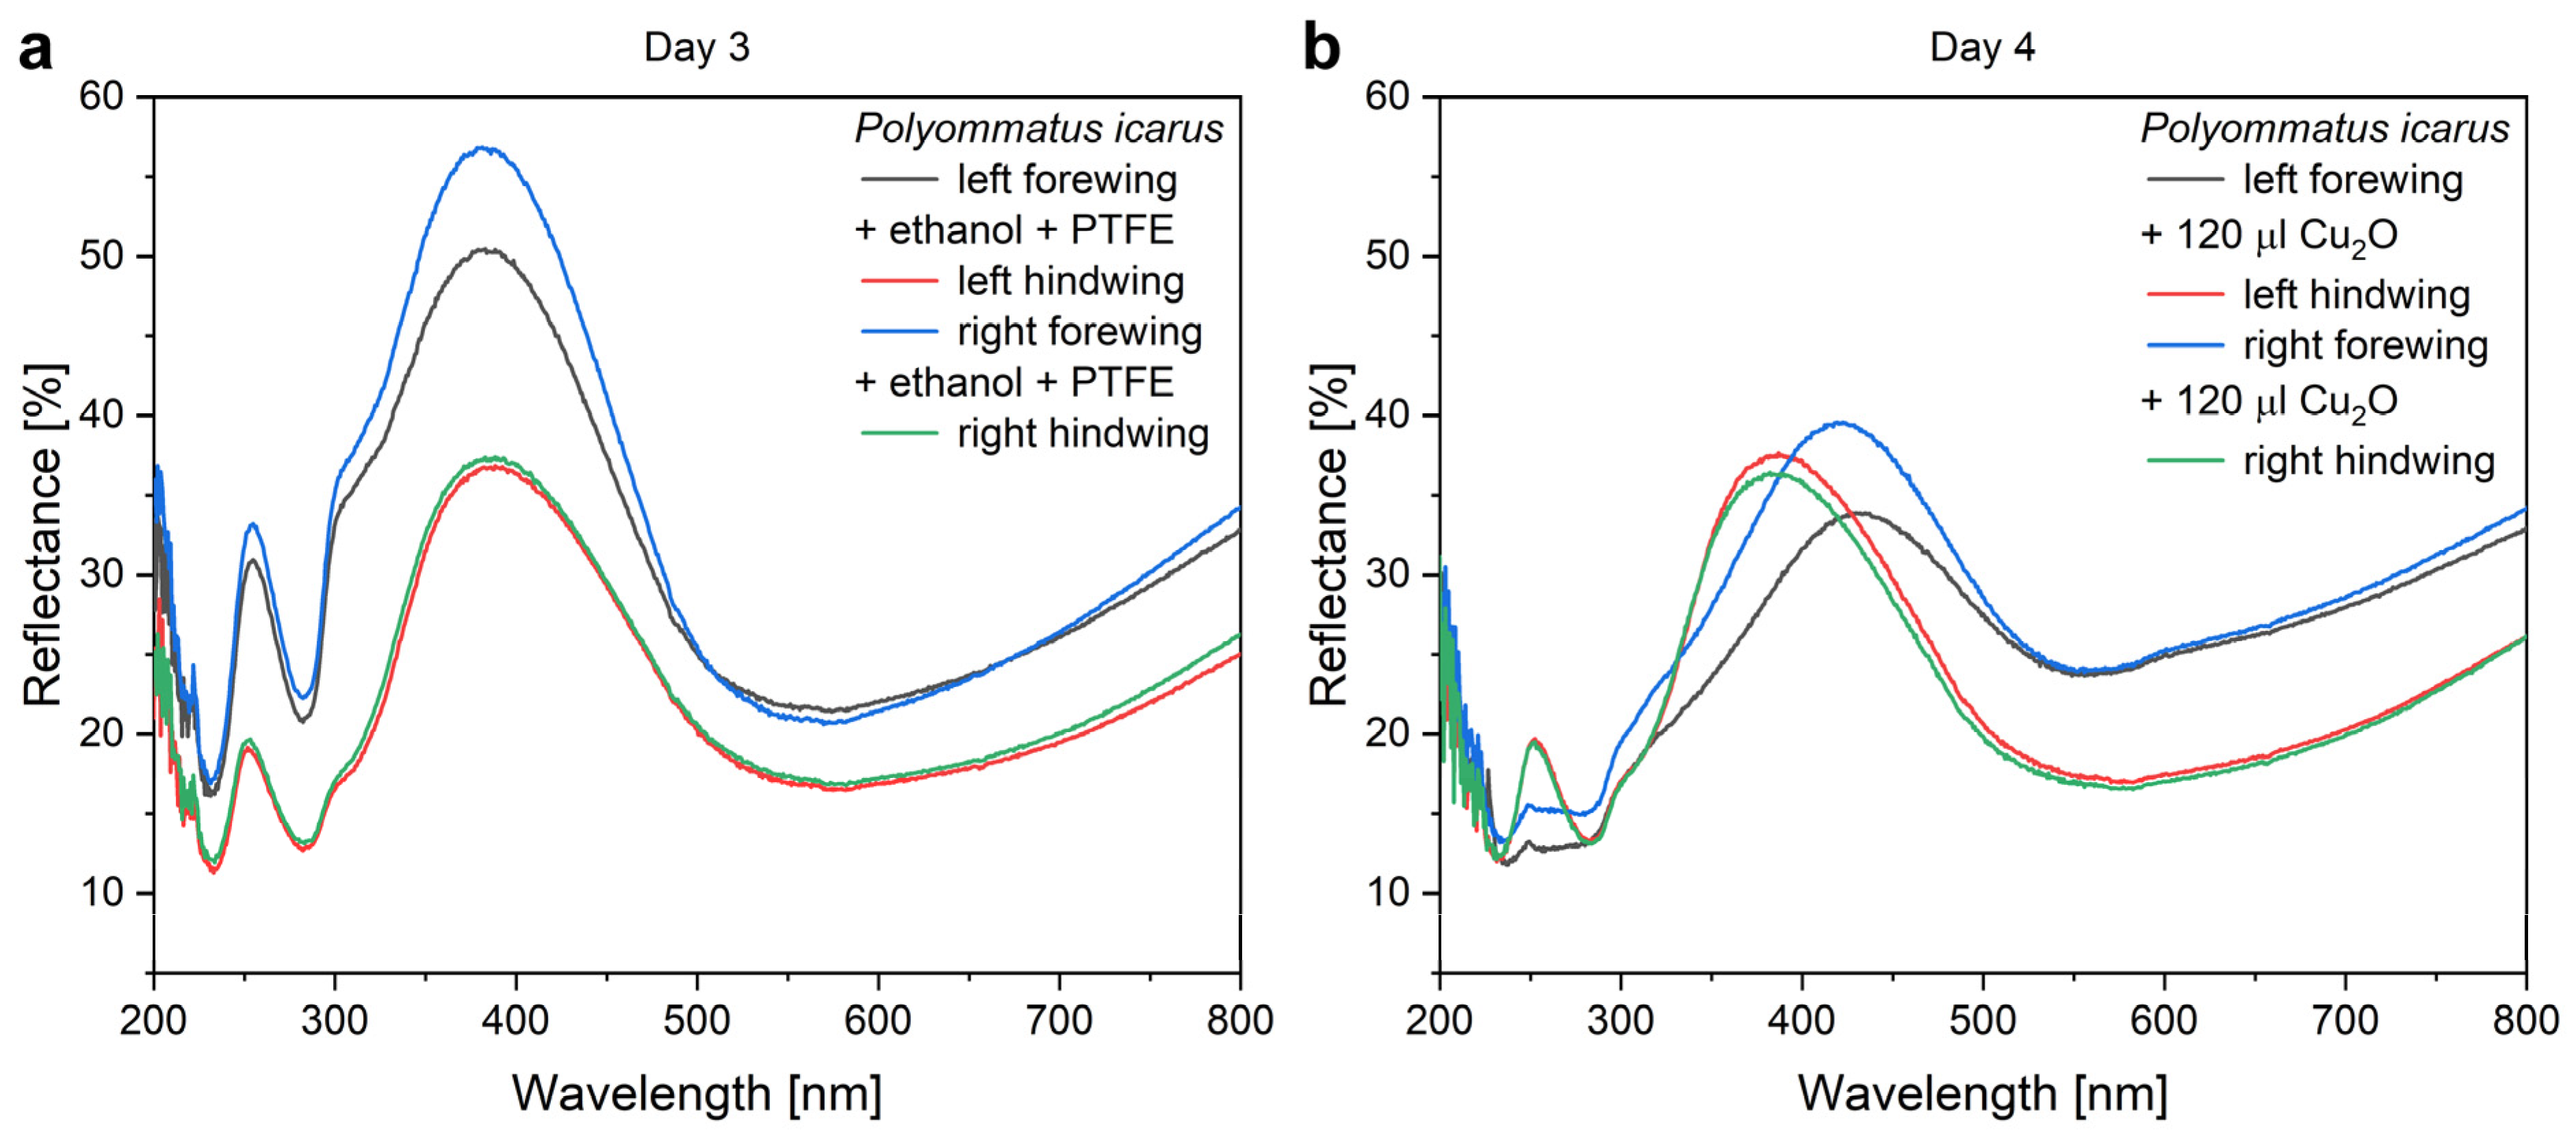
The mounting of the PTFE frames (
Figure 4) induces some differences in the intensity of the reflectance of the pretreated wings but without any spectral shift. The application of 120 µL of Cu
2O sol onto the wings shifts the position of the reflectance maximum towards the red and reduces the intensity of the reflectance maximum. The reduction in the intensity is of a similar magnitude to that found on the filter paper in
Figure S3 and is attributed, on one hand, to the absorption of the Cu
2O and to the addition of a high refractive index component to the photonic nanoarchitectures, as it was found for Al
2O
3 deposition on
P. icarus wings [
56]. The shift towards the red side of the visible range is opposite to the modification induced by the ethanol pretreatment, indicating that the NPs do not act as a “filter” but constitute, together with chitinous photonic nanoarchitecture, a new, hybrid photonic nanoarchitecture with modified optical properties [
13]. Opposite to the ethanol pretreatment, the application of the Cu
2O NPs onto the butterfly wing broadens the reflectance maximum towards the red. Due to the increased absorption, there is a tradeoff between the spectral shift produced and the decrease in the reflectance intensity (
Figure 5). A good balance between this tradeoff and the desired spectral position can be easily found by choosing a butterfly species with color close to the desired spectral range.
When preparing type-2 samples, the first step was the conformal coating of the wing with 15 nm of ZnO by ALD. The effect of this coating on the reflectance spectrum is shown in
Figure 6 and the good uniformity in the color of the coated wings can be seen in
Figure S1. It is worth pointing out that the ZnO coating does not reduce the intensity of the reflectance maximum, only shifts its spectral position towards the red. Opposite to Cu
2O, the absorption edge of ZnO is close to 380 nm and it does not absorb energy from the visible light spectrum. Due to this absorption edge, the reflectance of the ZnO-deposited wings shows a sharp drop in the blue (
Figure 6). When the 120 µL of Cu
2O sol is drop-dried onto these wings, some redshift of the reflectance maximum is observed, but the magnitude of this redshift is reduced compared with the application of the same amount of sol on the uncoated wings (
Figure 7). The sharp cutoff in the blue is preserved. The reduced redshift for the type-2 samples is attributed to thickening already produced in the high refractive index component of the photonic nanoarchitecture by the 15 nm of conformal ZnO deposition [
56]. The second reason for the smaller effect is the non-uniform thickening on the initial ZnO layer by the addition of Cu
2O on type-2 samples. The Cu
2O nanoparticles locally increase the thickness of the high refractive index component. This way, the fraction of the high refractive index component will be shifted even further from the initial biological optimum determined by millennia of evolution. In extremis, this process can lead to the complete annihilation of the photonic crystal type reflectance.
In
Figure 7b, the samples treated with Cu
2O exhibit some increase in reflectance compared with the untreated sample. When looking at the data in
Figure 5 comparing the spectral and intensity modifications induced on samples of type-1 and type-2, one can observe that the conformal covering of the wings by the 15 nm thick ZnO layer reduces the modifications produced by the various amounts of Cu
2O sol to a great extent. For the type-2 sample, only a weak trend can be observed in the position of the reflectance maximum, while for the type-1 samples, the Cu
2O causes monotonic increase (spectral position) or monotonic decrease (intensity) of the spectral characteristics. The cause of this weak trend for the type-2 samples is the already induced modification by the ZnO conformal coating, which, for example, already shifted the spectral position of the reflectance maximum in the position where it will be shifted for a type-1 sample after the application of 120 µL of Cu
2O sol. The slight increase in the intensity of the reflectance in
Figure 5b for those type-2 samples, which received increasing amounts of the Cu
2O NPs, may be due to the increased light scattering (compare
Figure S2d and
Figure S2f) by the Cu
2O NPs uniformly distributed over the wing (
Figure 8). The integrating sphere picks up all the backscattered light towards the side from which the sample is illuminated.
After the application of 120 µL of Cu
2O, a group of type-1 and type-2 samples were subjected to the deposition of an additional layer of 5 nm of ZnO by ALD in the same deposition run. The purpose of this treatment was threefold: (i) to improve the adherence of the Cu
2O nanoparticles so that they can withstand the stirring of the test reaction medium, or flow—having in mind real life applications; (ii) to improve the electrical contact between the Cu
2O nanoparticles and the 15 nm ZnO layer if this was present (type-2); (iii) to test if this thin ZnO layer is sufficient to enhance the charge transfer at the Cu
2O–ZnO junction, when no previous deposition of 15 nm ZnO onto the wings was performed (type-1). The effects of the deposition of 5 nm of ZnO on the reflectance can be seen in
Figure 9. This additional ZnO deposition had the opposite effect on type-1 and type-2 samples: the intensity of the reflectance decreased for type-1 and increased for type-2 samples, and a small blueshift was also present.
The careful investigation of type-1 and type-2 samples, which received 120 µL of Cu
2O NP sol deposition, revealed clear differences in the spreading of the NPs on the wing scales. In
Figure 8a,c, the type-1 and type-2 samples are shown under the optical microscope with crossed polarizers to enhance the visibility of the NPs. It can be clearly seen that on type-1 samples, a pronounced tendency for clustering of the NPs is observed towards the rounded end of the scales, while on type-2 samples, a more uniform distribution can be seen. These observations are supported by the images taken with a focus stacking microscope to compensate for the tilt of the scales with respect to wing membrane (the sample plane) (
Figure 8b,d). The differences in the distribution of the NPs on the type-1 and type-2 samples are attributed to the different surface chemistry of the two kinds of samples. The SEM images of
Figure 8 fully support the optical microscopy observations. In the detailed images in
Figure 8g,h, one can see that while on the type-1 sample, the smaller grouping of the NPs also shows clustering, on the type-2 sample, individual NPs can be seen.
In
Figure 9, the digital photographs of the samples used for the catalytic experiments and their corresponding spectra are shown. Even by the naked eye one can perceive the color differences in the samples. In decreasing order, samples #6, #2, and #4 have the highest value of reflectance at the blue edge of the RhB absorption. As was reported recently [
37,
57,
58], the blue and the red edge of the dye absorption are the most efficient for photocatalysis enhancement by the slow light effect, because in the central part of the absorption band, the screening by the dye itself greatly reduces the intensity of the light falling on the photonic nanoarchitecture. If comparing the catalytic performance of these samples (
Figure 10) with the ordering of the reflectance intensities, one can observe that despite the nearly identical intensity of sample #6 and #2 at the blue edge of the RhB absorption edge, their catalytic performance is different. This clearly shows that not only the optical properties but the type of the photocatalytic coating is also important for the faster reaction rate.
Three other samples worth comparing in
Figure 9 are #1, #3, and #5. Samples #1 and #5 have the same reflectance intensity at the blue edge of the dye absorption, but both samples #3 and #5 are less efficient in the photodecomposition of the RhB than the pristine butterfly wing. In other words, the application of Cu
2O NPs on the butterfly wing deteriorated the photocatalytic efficiency (
Figure 10). Some improvement is produced in sample #5 by coating the Cu
2O NPs on the wing by 5 nm of conformal ZnO (
Figure 10). A slight reduction in the reaction rate is observed on the type-2 sample, also, after the application of the Cu
2O NPs, but the reaction rate improves after the additional 5 nm ZnO was deposited on the sample (
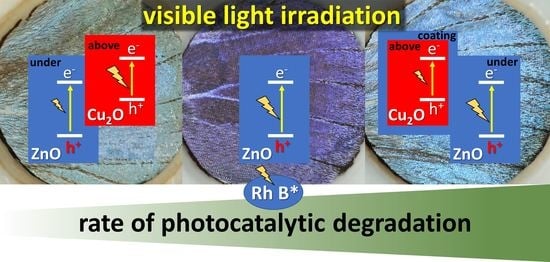
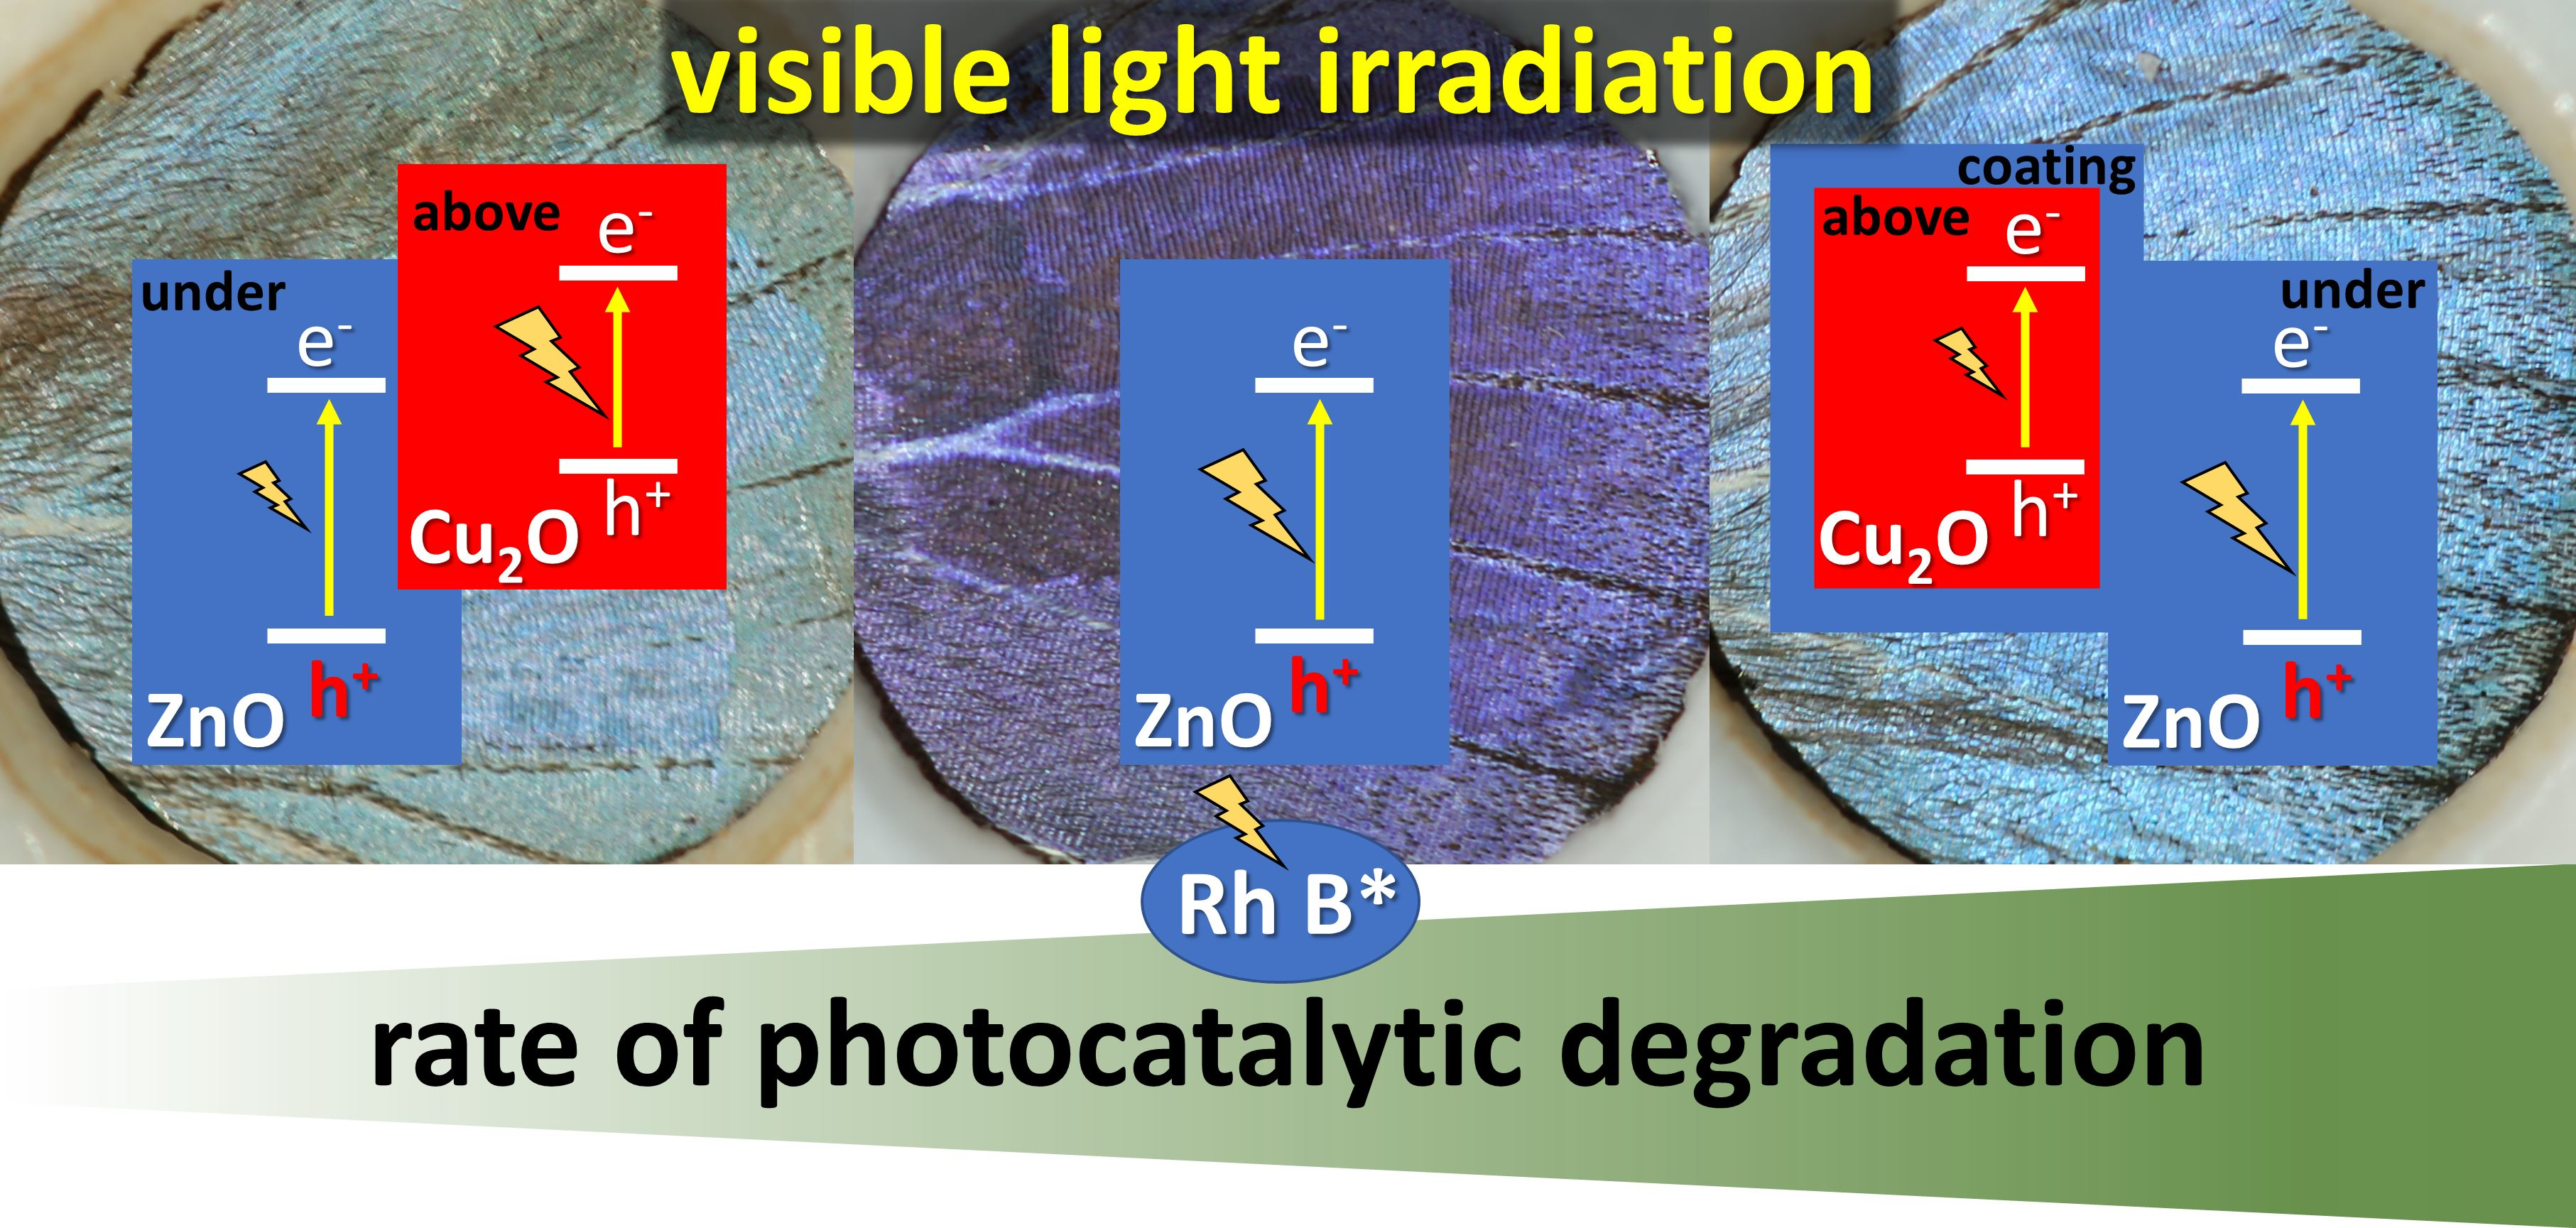
Figure 10). These observations underscore the importance of the type of the semiconductor, which is in contact with the dye, as Cu
2O is of p-type and ZnO is of n-type. In the case of similar, biotemplated ZnO surfaces, we concluded earlier that instead of hole capturing by water molecules to generate hydroxyl radicals (that in turn oxidize RhB) or electron capturing by the dissolved O
2 from the conduction band to form reactive superoxide radical anions, the contribution of dye sensitization by RhB to photocatalytic degradation [
37] was the likely scenario [
38]. In addition to this earlier conclusion, the present series of experiments implies that the major route of RhB photodecomposition should be the reaction between the photoexcited RhB molecule and the n-type ZnO, since the p-type—and thus, electron injecting—Cu
2O diminishes the photoreactivity against RhB.
The poor photocatalytic performance of pristine Cu
2O nanoparticles can be attributed to the relatively short lifetime of the photoexcited carriers, as well as the hindered carrier diffusion towards the interface (as a consequence of, e.g., crystal defects or Cu vacancies) [
59]. Thus, the effect of the direct contact with an n-type semiconductor (e.g., TiO
2) has been widely studied on the extension of the carrier lifetime and hence the photocatalytic activity can be significantly improved [
60,
61]. Moreover, the increasing photocatalytic activity upon covering the Cu
2O octahedra with ZnO can be explained based on the facet-dependent binding energy of the heterojunction: the (111) facet, which is dominant in an octahedral morphology, was found to be the highest in binding energy upon forming a heterojunction with an n-type semiconductor such as TiO
2 [
60]. The sufficiently formed Cu
2O/ZnO heterojunction, thus, prolongs the charge carrier lifetime and allows the separation of photoexcited carriers.
Furthermore, despite the absorption of the Cu
2O in the visible range, in contrast to the ZnO, it does not improve, but it decreases the photodecomposition of the dye by the butterfly wing. On the other hand, the right combination of wing–(15 nm ZnO)–Cu
2O or NPs–(5 nm ZnO) is the best performing sample. This good performance is attributed both to the right spectral position of the reflectance maximum and to the efficient charge carrier separation taking place at the Cu
2O–ZnO p-n junction [
29,
30,
31,
32,
33,
34,
35,
36]. The improvement in the reaction rate from sample #4 to sample #6 is attributed to the improvement in the electrical contact between Cu
2O NPs and the ZnO following the deposition of the 5 nm ZnO adlayer.
The relative reaction rates of
Figure 10 may be helpful in comparing the individual effects of the various components of the more complex biotemplated photonic nanoarchitectures that proved to have the best efficiency in the photodegradation of the dye. The reaction rate on bare glass is taken as unity. The ethanol pretreatment itself does not affect the photocatalytic behavior of the butterfly wing. The following sequence of the primary components: bare glass, Cu
2O NPs, 15 nm ZnO layer on glass, and butterfly wing can be established: Cu
2O NPs double the reaction rate compared to bare glass; the ZnO layer on glass increases the reaction rate to 2.5 times with respect to the glass, but the butterfly wings (both untreated and ethanol pretreated) exhibited a reaction rate approximately three times larger compared with glass. When comparing the biotemplated systems: (type-1 sample + Cu
2O NPs) and the type-2 sample, the latter has a reaction rate twice that of the former. The (type-1 sample + Cu
2O NPs) has a lower reaction rate than the butterfly wings. This decrease is attributed, on one hand, to the reduced reflectance by the spectral modifications induced by the Cu
2O NPs (
Figure 9, sample #3) and to the moderate catalytic compatibility between Cu
2O and rhodamine B. The application of Cu
2O on the type-2 sample does not produce an improvement in the reaction rate, likely because of the weak electric contact between the Cu
2O and the ZnO. After this is corrected by the deposition of 5 nm ZnO layer, the best performing sample is obtained, with a reaction rate almost 4.3 times that of bare glass.
In
Figure S4, the digital photographs and the measured reflectance of the samples after the first series of photocatalytic experiments are shown. The color shift of all the samples—visible to the naked eye—if compared with
Figure 10 clearly shows that the dye is well adsorbed on the treated butterfly wings and persists there even after the gentle washing of the samples. The reflectance spectra quantitatively support this observation. The spectra show that indeed, as already reported in [
37], the absorption of the dye in solution can significantly reduce the efficiency of the photocatalytic process. For this reason, the combination of the red edge of the photonic nanoarchitecture—to take advantage of the slow light effect—with the blue edge of the dye absorption can be the most advantageous spectral arrangement.
The above results demonstrate that properly chosen photonic nanoarchitectures of biologic origin—from the large “library” of such structures—in combination with well-chosen photocatalysts(s) can significantly enhance the efficiency of complex, hybrid biotemplated photonic/photocatalytic surfaces. Taken together, our findings suggest that the reason for the enhanced efficiency is complex; both the fast carrier separation at Cu
2O-ZnO p-n heterojunctions and the slow light effect of the photonic nanoarchitecture are contributors. As discussed earlier, an advantageous overlap between the red edge of the reflectance maximum of the wing surface and the absorption of the test dye (RhB) is a prerequisite for an improved photocatalytic performance [
37], and this can be achieved by a conformal ZnO coating in combination with Cu
2O nanoparticles. On the contrary, when only Cu
2O—an absorber in the visible light spectrum—was applied on a type-2 sample, no improvement in photocatalytic performance was observed. Only after this kind of sample was additionally coated by 5 nm of conformal ZnO was the improved photocatalytic performance observed. This supports that the main source of an improved photocatalytic performance by Cu
2O NPs vs. a ZnO coating is a fast charge carrier separation at Cu
2O–ZnO p-n junctions.

 ,
, 


