Article

One-Pot Facile Synthesis of CuO–CdWO4 Nanocomposite for Photocatalytic Hydrogen Production

by
Shaeel Ahmed Althabaiti
1,
Maqsood Ahmad Malik
1,
Manoj Kumar Khanna
2,
Salem Mohamed Bawaked
1,
Katabathini Narasimharao
1,*,
Soad Zahir Al-Sheheri
1,
Bushra Fatima
3 and
Sharf Ilahi Siddiqui
3,4,*
1
Chemistry Department, Faculty of Sciences, King Abdulaziz University, P.O. Box 80203, Jeddah 21589, Saudi Arabia
2
Department of Physics, Ramjas College, University of Delhi, Delhi 110007, India
3
Department of Chemistry, Jamia Millia Islamia, Delhi 110025, India
4
Department of Chemistry, Ramjas College, University of Delhi, Delhi 110007, India
*
Authors to whom correspondence should be addressed.
Nanomaterials 2022, 12(24), 4472; https://doi.org/10.3390/nano12244472
Submission received: 27 October 2022 / Revised: 6 December 2022 / Accepted: 8 December 2022 / Published: 16 December 2022
(This article belongs to the Special Issue Nanoscale Materials as Catalysts for the Hydrogen Evolution Reaction)

Abstract

:
Hydrogen (H2) is a well-known renewable energy source that produces water upon its burning, leaving no harmful emissions. Nanotechnology is utilized to increase hydrogen production using sacrificial reagents. It is an interesting task to develop photocatalysts that are effective, reliable, and affordable for producing H2 from methanol and acetic acid. In the present study, CuO, CdWO4, and CuO–CdWO4 nanocomposite heterostructures were prepared using a cost-efficient, enviro-friendly, and facile green chemistry-based approach. The prepared CuO, CdWO4, and CuO–CdWO4 nanocomposites were characterized using X-ray diffraction pattern, Fourier-transform infrared spectroscopy, diffuse reflectance ultraviolet–visible spectroscopy, scanning electron microscopy, transmission electron microscopy, selected area electron diffraction (SAED) pattern, N2 physisorption, photoluminescence, and X-ray photoelectron spectroscopy techniques. The synthesized photocatalysts were utilized for photocatalytic H2 production using aqueous methanol and acetic acid as the sacrificial reagents under visible light irradiation. The influence of different variables, including visible light irradiation time, catalyst dosage, concentration of sacrificial reagents, and reusability of catalysts, was studied. The maximum H2 was observed while using methanol as a sacrificial agent over CuO–CdWO4 nanocomposite. This enhancement was due to the faster charge separation, higher visible light absorption, and synergistic effect between the CuO–CdWO4 nanocomposite and methanol.

1. Introduction

As the world’s usage of fossil fuels increases at an alarming and unsustainable rate, the emission of greenhouse gases and other hazardous pollutants is rising to unacceptably high levels [1]. Oxides of nitrogen (NOx), sulfur (SOx), and suspended particulate matter that cannot be removed by filtration are the breath-taking poisons released by fuel combustion [2]. In addition, fossil fuels generate a large quantity of greenhouse gases, mostly carbon dioxide (CO2), and unfavorable byproducts in our ecosystem [3,4]. To overcome these disadvantages, alternative energy sources which are renewable and ecologically benign are essential for the long-term sustainable growth of society. Future energy sources must satisfy the requirements of releasing environmentally acceptable byproducts, renewability, and availability [1,4]. Nanotechnology is an emerging sophisticated technology in the realm of material science that could offer different options for the development of ecologically friendly renewable energy sources. Hydrogen (H2) is one of these attractive possible candidates, and the generation of H2 from renewable sources does not result in the emission of CO2. In this context, H2 can be considered a clean energy carrier that has the potential to solve currently existing problems in the areas of energy and environment [5,6,7]. H2 can be produced using renewable resources across the globe to minimize the need for fossil fuels. It is mostly used in the production of various chemicals, including ammonia and methanol, as well as in oil refineries to separate crude oil into lighter fractions [8].
A promising method for producing sustainable H2 is solar photocatalysis [6,7], which splits water into H2 gas [9,10]. Recently, Zn- and Ni-Co-doped hematite nanorods [5] and Ni2P–Co2P [6] photocatalysts were reported to be in use for the process of H2 production. It is also recognized that the photocatalysts based on semiconductor heterojunctions could enhance water splitting [10]. Many photocatalysts, including noble metal deposited oxides, metallic sulphides and oxynitrides, have also been utilized for H2 production, although these catalysts show poor stability [7]. Notably, water splitting is completed with two half-reactions (redox reaction), in which mainly four different steps are involved to tune the photocatalyst [10], including (i) light harvesting, (ii) charge excitation, (iii) charge separation and transfer, and (iv) surface electro-catalytic reaction. To make light harvesting smooth, surface modifications, such as anchoring functional groups, generating crystal defects, and enhancing surface area, could be performed [7,8,9,10]. In the second step, it is necessary to decrease the bandgap for the electron (e) to be easily excited from the valence band (VB) to the conduction band (CB). When an e is excited from VB, it forms a positive hole (h+) which can be easily recombined, suggesting that it is necessary to stop the recombination of the e and the h+. In the third step, it is essential to prevent the recombination or decrease the recombination rate, where the interfacial electric field can be used through the generation of a heterojunction photocatalyst. In the fourth step, the e and h+ move to the surface of the semiconductor and execute water splitting through two-half (redox) reactions. It should also be noted that the surface redox reaction takes place only when the reduction and oxidation potentials are more positive and negative than the CB and VB levels, respectively [10].
Numerous photocatalysts with suitable characteristics have been developed to produce H2 using aqueous solutions of sacrificing agents [11,12,13]. To improve the photocatalytic performance and stability, different synthetic strategies, such as doping with noble metals and heterojunctions of different metal and metal oxide nanomaterials, are commonly adopted [14,15,16,17]. Despite the advances in photon-responsive applications of heterojunction photocatalysts, the photocatalysts are still suffering from several drawbacks such as visible light harvesting, charge carrier excitation, and charge separation. New efforts are being made to overcome the drawbacks of photocatalytic production of H2 through water splitting. One of the interesting approaches is to develop a simple, inexpensive, and sustainable green method to develop a stable and highly efficient visible-light-active photocatalyst for H2 production.
CuO is a p-type semiconductor with a narrow bandgap (Eg = 1.2–1.6 eV), which offers a wide range of applications, including optical, electrical, catalytic, and photocatalytic degradation, as well as serves as an antioxidant and an adsorbent [18,19,20,21,22]. Due to the distinctive physical and chemical characteristics of CuO, CuO nanoparticles (NPs) have been used in catalytic processes, chemical sensors, antimicrobial textiles, and batteries [23,24,25]. On the other hand, cadmium tungstate (CdWO4) exhibits superior chemical, optical, structural, and thermal properties [26,27]. The broad bandgap (3.8 eV) of CdWO4 restricts its use in the solar spectral response range [28]. The advantages of combining CdWO4 nanomaterials into composites can be fully exploited by forming heterojunction [29,30]. The extract of the Brassica rapa plant was used for the synthesis of functionalized CuO and CdWO4 samples as the Brassica rapa plant extract contains several phytochemicals (such as quercetin, kaempferol, isorhamnetin, anthocyanins, and derivatives of cinnamic acid), which can act as capping, stabilizing, and functionalizing agents for nanocomposites [22]. This synthesis protocol could be considered as a sustainable green method due to the usage of water as a solvent, low energy requirement, cost effectiveness, and the offer of a high yield of products [22]. In addition to the above-mentioned advantages, Brassica rapa plant extract could introduce different functional groups, such as -COOH and -CHO, onto the surface of the metal oxides. These surface functional groups could assist to enhance the absorption of light and improve the photocatalytic activity [31]. Akhtar et al. [32] and Narayanan et al. [33] synthesized silver nanoparticles using Brassica rapa leaf extract and utilized the synthesized materials as antimicrobial agents.
In our previous reports, we synthesized CuO [22] and CdWO4 [27] by utilizing Brassica rapa leaf extract. In this contribution, bare CuO, CdWO4, and CuO–CdWO4 nanocomposite samples were synthesized by a cost-efficient, enviro-friendly, and facile green chemistry-based approach involving Brassica rapa leaf extract. The prepared CuO, CdWO4, and CuO–CdWO4 nanocomposite samples were characterized using X-ray diffraction pattern, Fourier-transform infrared spectroscopy, diffuse reflectance ultraviolet–visible spectroscopy, scanning electron microscopy, transmission electron microscopy, selected area electron diffraction (SAED) pattern, N2 physisorption, photoluminescence, and X-ray photoelectron spectroscopy techniques. The synthesized photocatalysts were utilized for photocatalytic H2 production using aqueous methanol and acetic acid as the sacrificial reagents under visible light irradiation.

2. Experimental Details

2.1. Materials

Analytical grade copper acetate monohydrate (199.6 g/mol), cadmium iodide (366.2 g/mol), and sodium tungstate dihydrate (329.8 g/mol) were obtained from Merck Ltd. (Rahway, NJ, USA) and utilized without purification for the preparation of the photocatalysts. Fresh Brassica rapa leaves were procured from the local market.

2.2. Preparation of Plant Extract

Fresh Brassica rapa leaves were washed initially with tap water and then with double distilled water several times. The leaves were then dried in an electric oven at 60 °C for 48 h. Then, the fine powder of the leaves was obtained by grinding the dried leaves. The collected powder was then used to prepare the aqueous extract by adding 20 g of powder in 200 mL of doubled distilled water, and then the water was heated at 70 °C for 90 min. Finally, the extract was separated from the soaked powder using vacuum filtration. The obtained extract was utilized for the synthesis of the nanocomposites.

2.3. One-Pot Synthesis of CuO–CdWO4 Nanocomposite

The parent metal oxides (CuO and CdWO4) were prepared by using aqueous Brassica rapa leaf extract following a previously reported method [22,27]; the detailed information is provided in the supplementary information. The CuO–CdWO4 nanocomposite was synthesized using aqueous Brassica rapa leaf extract through a one-pot facile route. Initially, a salt solution of Cu, Cd, and W was obtained by mixing 300 mL of 0.05 M Na2WO4 solution, 100 mL of 0.05 M CdI2 solution, and 100 mL of 0.4 M Cu(COOCH3)2 solution. The mixture was stirred for 30 min to obtain a clear homogeneous solution. Then, 160 mL of prepared Brassica rapa leaf extract and 200 mL of 1 M of NaOH solution were added and the mixture was stirred at 60 °C for 1 h. This led to the change in the color of the solution from brown to blue, which indicated the formation of a nanocomposite. The blue-colored solution was further continuously stirred at 100 °C for 3 h to achieve complete nanocomposite formation. The obtained precipitate was washed several times with distilled water, filtered, and dried in an oven at 60 °C for 24 h. The dried sample was grounded to make a powder and was calcined at 450 °C for 5 h.

2.4. Characterization of Materials

The X-ray diffraction (XRD) measurements were performed using a Philips PW-3710 diffractometer equipped with Cu Kα radiation. The diffuse reflectance ultraviolet-visible (UV-vis) spectrum of the powder sample was collected using a Lambda 950 PerkinElmer UV-vis spectrophotometer. The morphology of the materials was characterized using a scanning electron microscope (SEM, JSM-6510, Joel, Japan) equipped with an energy-dispersive X-ray spectroscope (EDX, Bruker 127 eV). A JEM-2100 transmission electron microscope (TEM) was used to obtain the TEM images and the particle size distribution of the prepared nanocomposites. Fourier-transform infrared spectroscopy (FT-IR) spectrum was measured by using a Perkin-Elmer full-range FTIR spectrometer in the range of 4000–400 cm−1. Selected area electron diffraction (SAED) pattern was also analyzed to investigate the crystal lattice and structure of the synthesized materials. The N2 physisorption analysis of the samples was performed using a Micromeretics Tristar 2000 instrument. The samples were degassed under helium gas at 300 °C for 2 h prior to analysis. The photoluminescence (PL) spectra of the samples were measured using a fluorescence spectrophotometer (F-4500, Hitachi). The X-ray photoelectron spectroscopy (XPS) patterns for the synthesized samples were obtained using a Thermo-Scientific Escalab 250 Xi XPS instrument with Al Kα X-ray having a spot size of 650 mm. The peak shift due to charge compensation was corrected using the C1s binding energy.

2.5. Hydrogen Production Activity

The photocatalytic H2 production experiments were performed in a photochemical reactor connected with a GC instrument. The reactor was a tightly closed glass reactor (total volume of 1000 mL) equipped with a cold-water circulation pump to reduce the heat generated during the photocatalytic reaction process. For each photocatalytic experiment, 100 mg of the synthesized catalyst powder was dispersed in a mixed solution of 400 mL DI water and sacrificial reagent (20 vol.% of methanol). Then, the solution was transferred into the reactor and purged with argon gas for 30 min in order to flush all the atmospheric gases. The empty headspace was kept constant at 500 mL for all reactions. When all gases were completely purged, the reactor was irradiated using a 300 W Xenon arc lamp without any UV cutoff filter. The amount of hydrogen from the reaction was determined by flowing argon as a gas carrier through the reactor in order to carry the generated gases for gas chromatography analysis (GC-1000). The measurement was performed every 30 min at a 5 h span of photoreaction. The photocatalytic reaction setup is shown schematically in Scheme 1.

3. Results and Discussions

3.1. FT-IR Spectroscopy

The FT-IR spectra of the CuO NPs, CdWO4 NPs, and CuO–CdWO4 NC samples are shown in Figure 1. The spectra show the presence of characteristic bands of functional groups (due to the plant extract) as well as metal-oxygen vibrations. The bands observed for the CuO NPs, CdWO4 NPs, and CuO–CdWO4 NC are listed in Table 1. Similar FT-IR spectra for CuO and CdWO4 samples were reported in the literature [22,27], which is explained in Appendix A. The characteristic IR absorption bands due to both CuO and CdWO4 phases are presented in the CuO–CdWO4 nanocomposite (Figure 1c). However, the position of the bands appears to be shifted because of the interaction between these two semiconductors compared to the individual spectra of CuO (Figure 1a) and CdWO4 (Figure 1b). The FT-IR spectrum of the CuO–CdWO4 nanocomposite reveals the bands around 3400 cm−1, pertaining to the stretching vibration of the O–H groups of adsorbed water or hydroxyl groups due to plant extract. The Cu–O bond has two bands at 604 cm−1and 714 cm−1 [34]. The other bands between 400–1000 cm−1 are the characteristics of the intrinsic vibrations from CdWO4 [35,36]. The stretching bands between 1700–1000 cm−1 are ascribed to various functional groups, such as -C=O, -NH, aromatic C=C, aromatic C−C, and -C−O groups, that came from the plant extract [22,27,32,37]. These results are in agreement with the previously reported literature [22,27,32,38].

3.2. XRD Diffraction

Powder X-ray diffraction technique was employed to confirm the crystal structure and phase purity of the bare CuO, CdWO4 oxides, and CuO–CdWO4 nanocomposite. The XRD pattern for bare CuO shows major reflections at 2θ values of 36°, 38°, 48°, 56°, and 64° corresponding to the (002), (111), (202), (020), and (113) planes of the monoclinic CuO phase [JCPDS file no. 45-0937]. Minor reflections due to the metallic Cu phase can also be seen in the XRD pattern that are assigned by the corresponding planes (111), (200), and (220) at 26.4°, 34.1°, and 70.10°, respectively. A similar results were observed in our previous publication [22].
The XRD pattern of the bare CdWO4 sample exhibits the characteristic reflections for the tetragonal CdWO4 crystal system with (101), (−111), (111), (002), (020), (112), (121), (103), (212), (−131), (311), (123), (213), and (014) planes [JCPDS card no. 80-0138], as shown in Figure 2. A similar result was reported for our previous publication [27]. The diffraction pattern of the CuO–CdWO4 nanocomposite (Figure 2) shows the characteristic reflections of both CuO (red marking) and CdWO4 (blue marking) NPs. The presence of intense sharp reflections indicates that the obtained nanocomposite is highly crystalline in nature. It has previously been reported that the CuO–CdWO4 composite contains a CuO (tenorite) crystal system with the monoclinic structure having cell dimensions, a = 4.6776 Å, b = 3.4593 Å, c = 5.1264 Å, and β = 98.965°, C12/c1 space group. (COD data Entry No. 96-901-5823) [39,40]. While the Scheelite CdWO4 crystal system with a tetragonal structure has cell dimensions, a = 5.1590 Å and c = 11.1690 Å (space group I41/a) (COD data Entry No. 96-154-9133) [40,41]. No deviation can be observed in the lattice parameters of the CuO–CdWO4 nanocomposite sample, indicating that the doping of any foreign metals into the crystal system did not occur. The average crystallite size of the CuO–CdWO4 nanocomposite was calculated using Scherrer’s formula, D = Kλ/βCosθ, where ‘D’ is the average crystal size, ‘K’ is the constant (0.89), ‘λ’ is the wavelength of the CuKα radiation, ‘β’ is the full width at half maximum, and ‘θ’ is the diffraction angle. The crystallite size of the CuO–CdWO4 nanocomposite was found to be around 25 nm higher than the bare CuO (10 nm) and CdWO4 (20 nm).

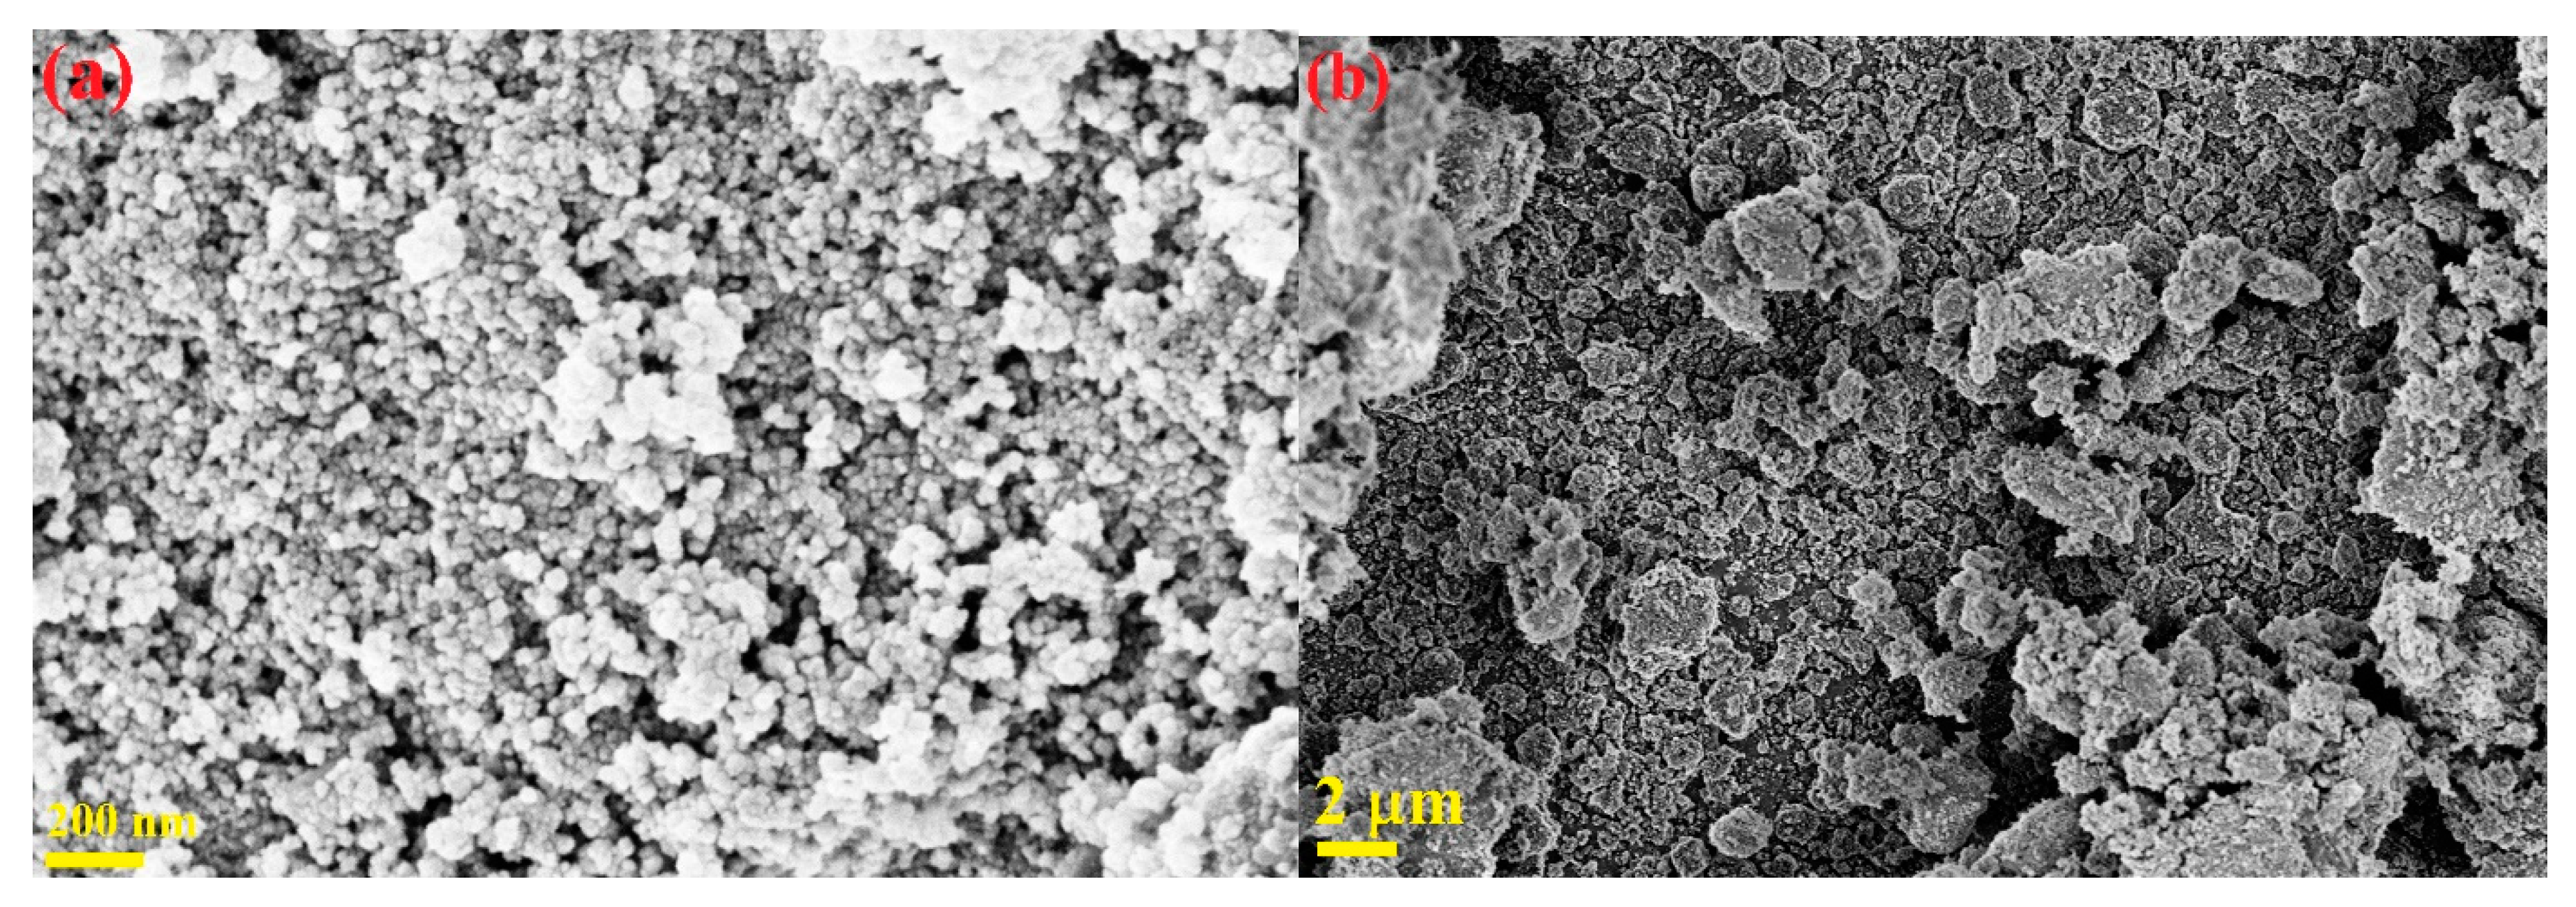
3.3. Morphological Studies

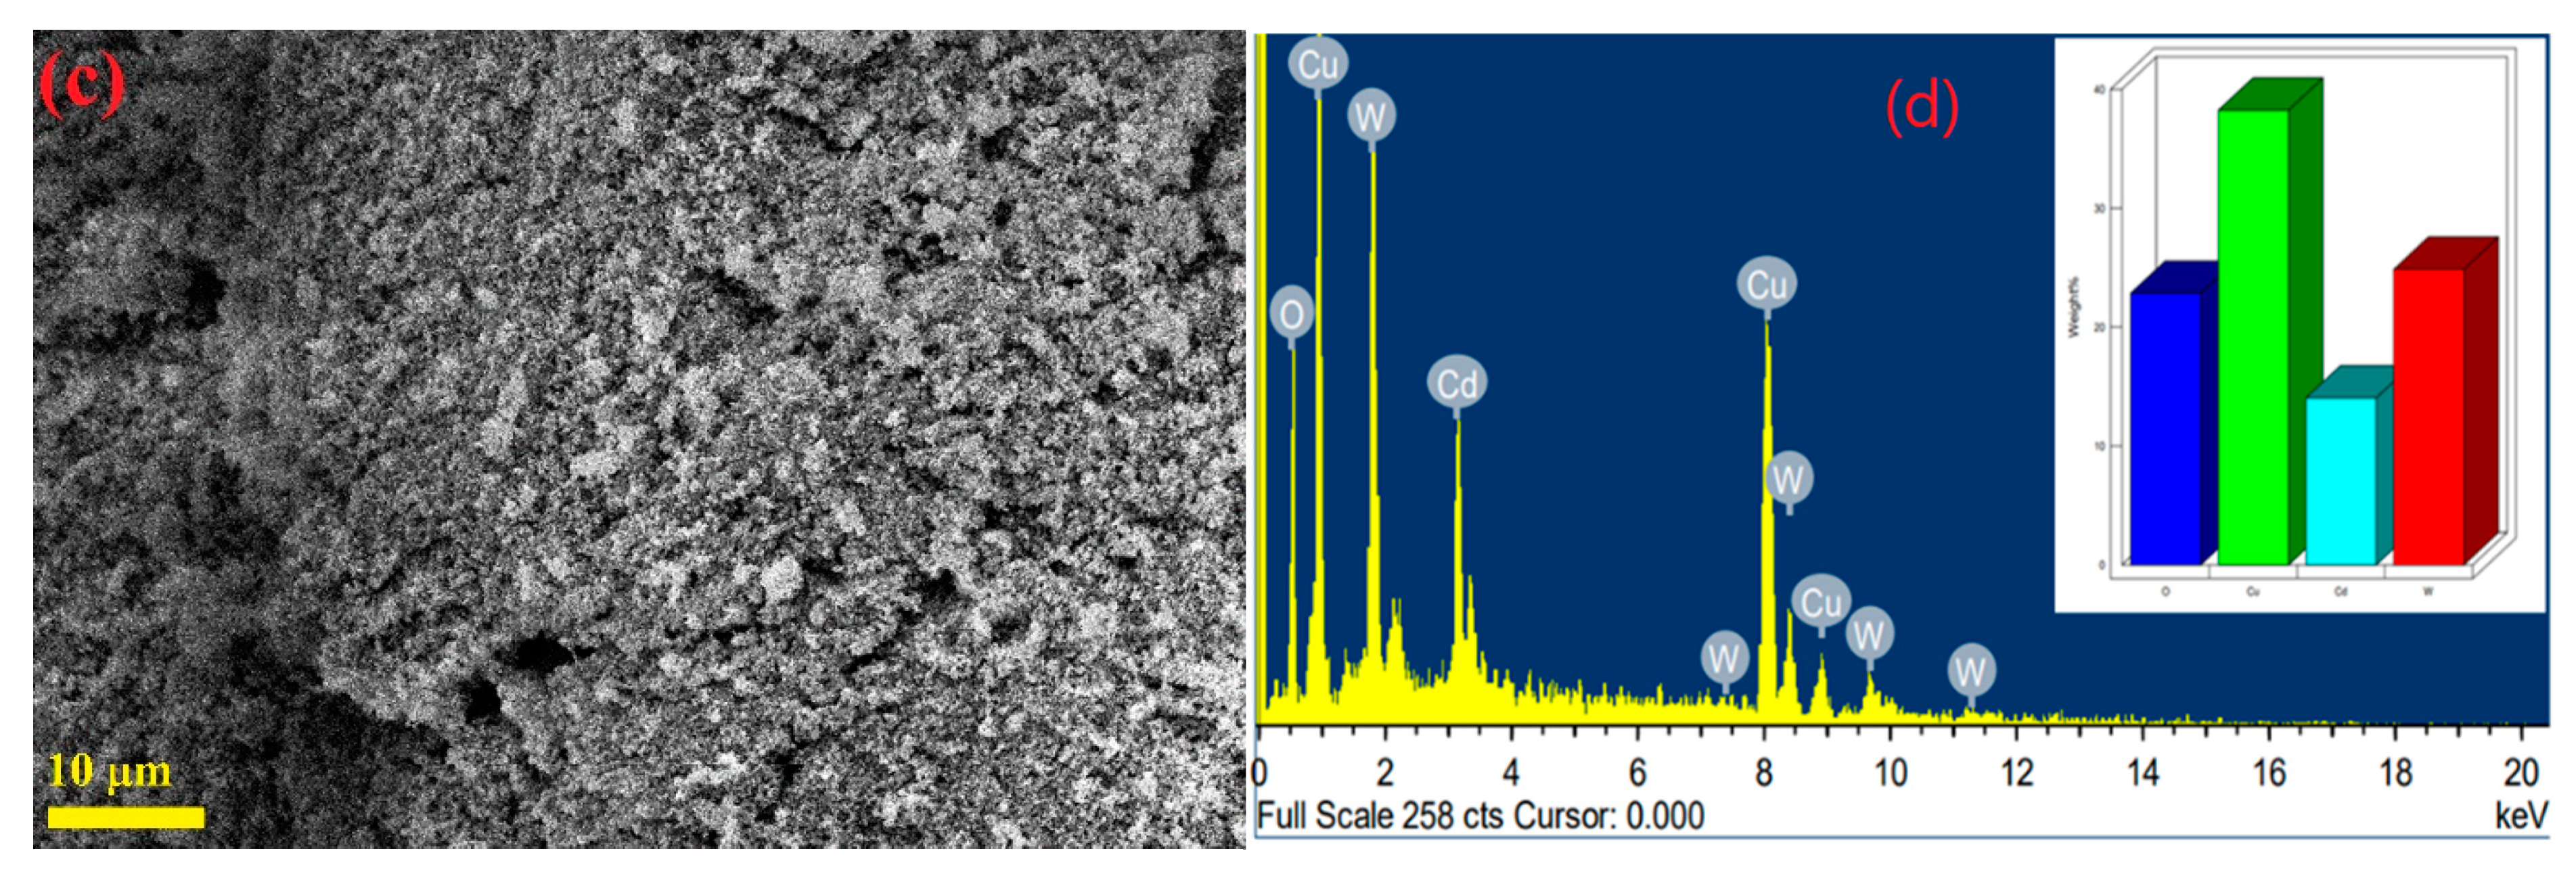
3.3.1. SEM and EDX Analyses

The SEM images of the CuO, CdWO4, and CuO–CdWO4 nanocomposite samples indicate the presence of irregularly shaped aggregated particles of various sizes with rough texture (Figure 3). The presence of macro-size pore channels in between the particle aggregates can be observed in the SEM image of the nanocomposite. The EDX analytical results for the CuO–CdWO4 nanocomposite are presented in Figure 3d and Table 2. The changes in the elemental composition in the CuO–CdWO4 composite from the parent CuO and CdWO4 can be clearly observed from the EDX analysis of the previously reported bare CuO [22] and CdWO4 [27] (Table 2). These elemental composition of the CuO–CdWO4 composite was found to be 22.85% O, 38.24% Cu, 14.05% Cd, and 24.85% W. These results suggest that successful one-pot synthesis of a CuO–CdWO4 composite is possible via the green method.

3.3.2. TEM and SEAD Analyses

The TEM analysis was performed to a get better understanding of the morphology and particle size of the synthesized samples. It is clear from the TEM images that the CuO crystals are grown with irregular shapes with small-size particles (Figure 4a), while the CdWO4 sample exhibits the presence of relatively large-size, rod-shaped particles (Figure 4b). Interestingly, the TEM image of the CuO–CdWO4 composite shows the presence of nanocapsules along with irregularly shaped agglomerated NPs, as shown in Figure 4c. The existence of an interaction between CuO and CdWO4 is confirmed by the oriented attachment between the metal oxides (rod-shaped CdWO4 and irregular CuO) [40,41]. The SEAD pattern for the CuO–CdWO4 sample is shown in Figure 4d; the image shows several diffraction rings corresponding to the planes for the CuO and CdWO4 crystal structures [41,42].

3.4. Nitrogen Physisorption Studies

The textural properties for the synthesized CuO, CdWO4 and CuO–CdWO4 nanocomposite samples was investigated using N2 physisorption analysis (Figure 5). The N2 adsorption-desorption isotherms for the CuO, CdWO4, and CuO–CdWO4 samples adopt type-III isotherm with apparent H3 hysteresis loop as per IUPAC classification [43]. The occurrence of type-III adsorption-desorption isotherm reflects the interaction of the adsorbate on the surface of the adsorbent. The observed H3 hysteresis reflects N2 adsorption owing to the capillary condensation, and it is possibly due to the uneven distribution of aggregates in the sample with complex pore channels. The pore size distribution patterns for the synthesized samples were obtained using the NLDFT model. The results indicated the appearance of PSD peaks corresponding to macropores in the CuO–CdWO4 sample, probably due to the aggregation between CuO and CdWO4 particles forming large-size voids. The analysis reflected the specific surface area of the CuO–CdWO4, which was calculated to be 18.9 m2/g with a pore volume of 0.032 cc/g and a half pore width of 8.440 Å, respectively.

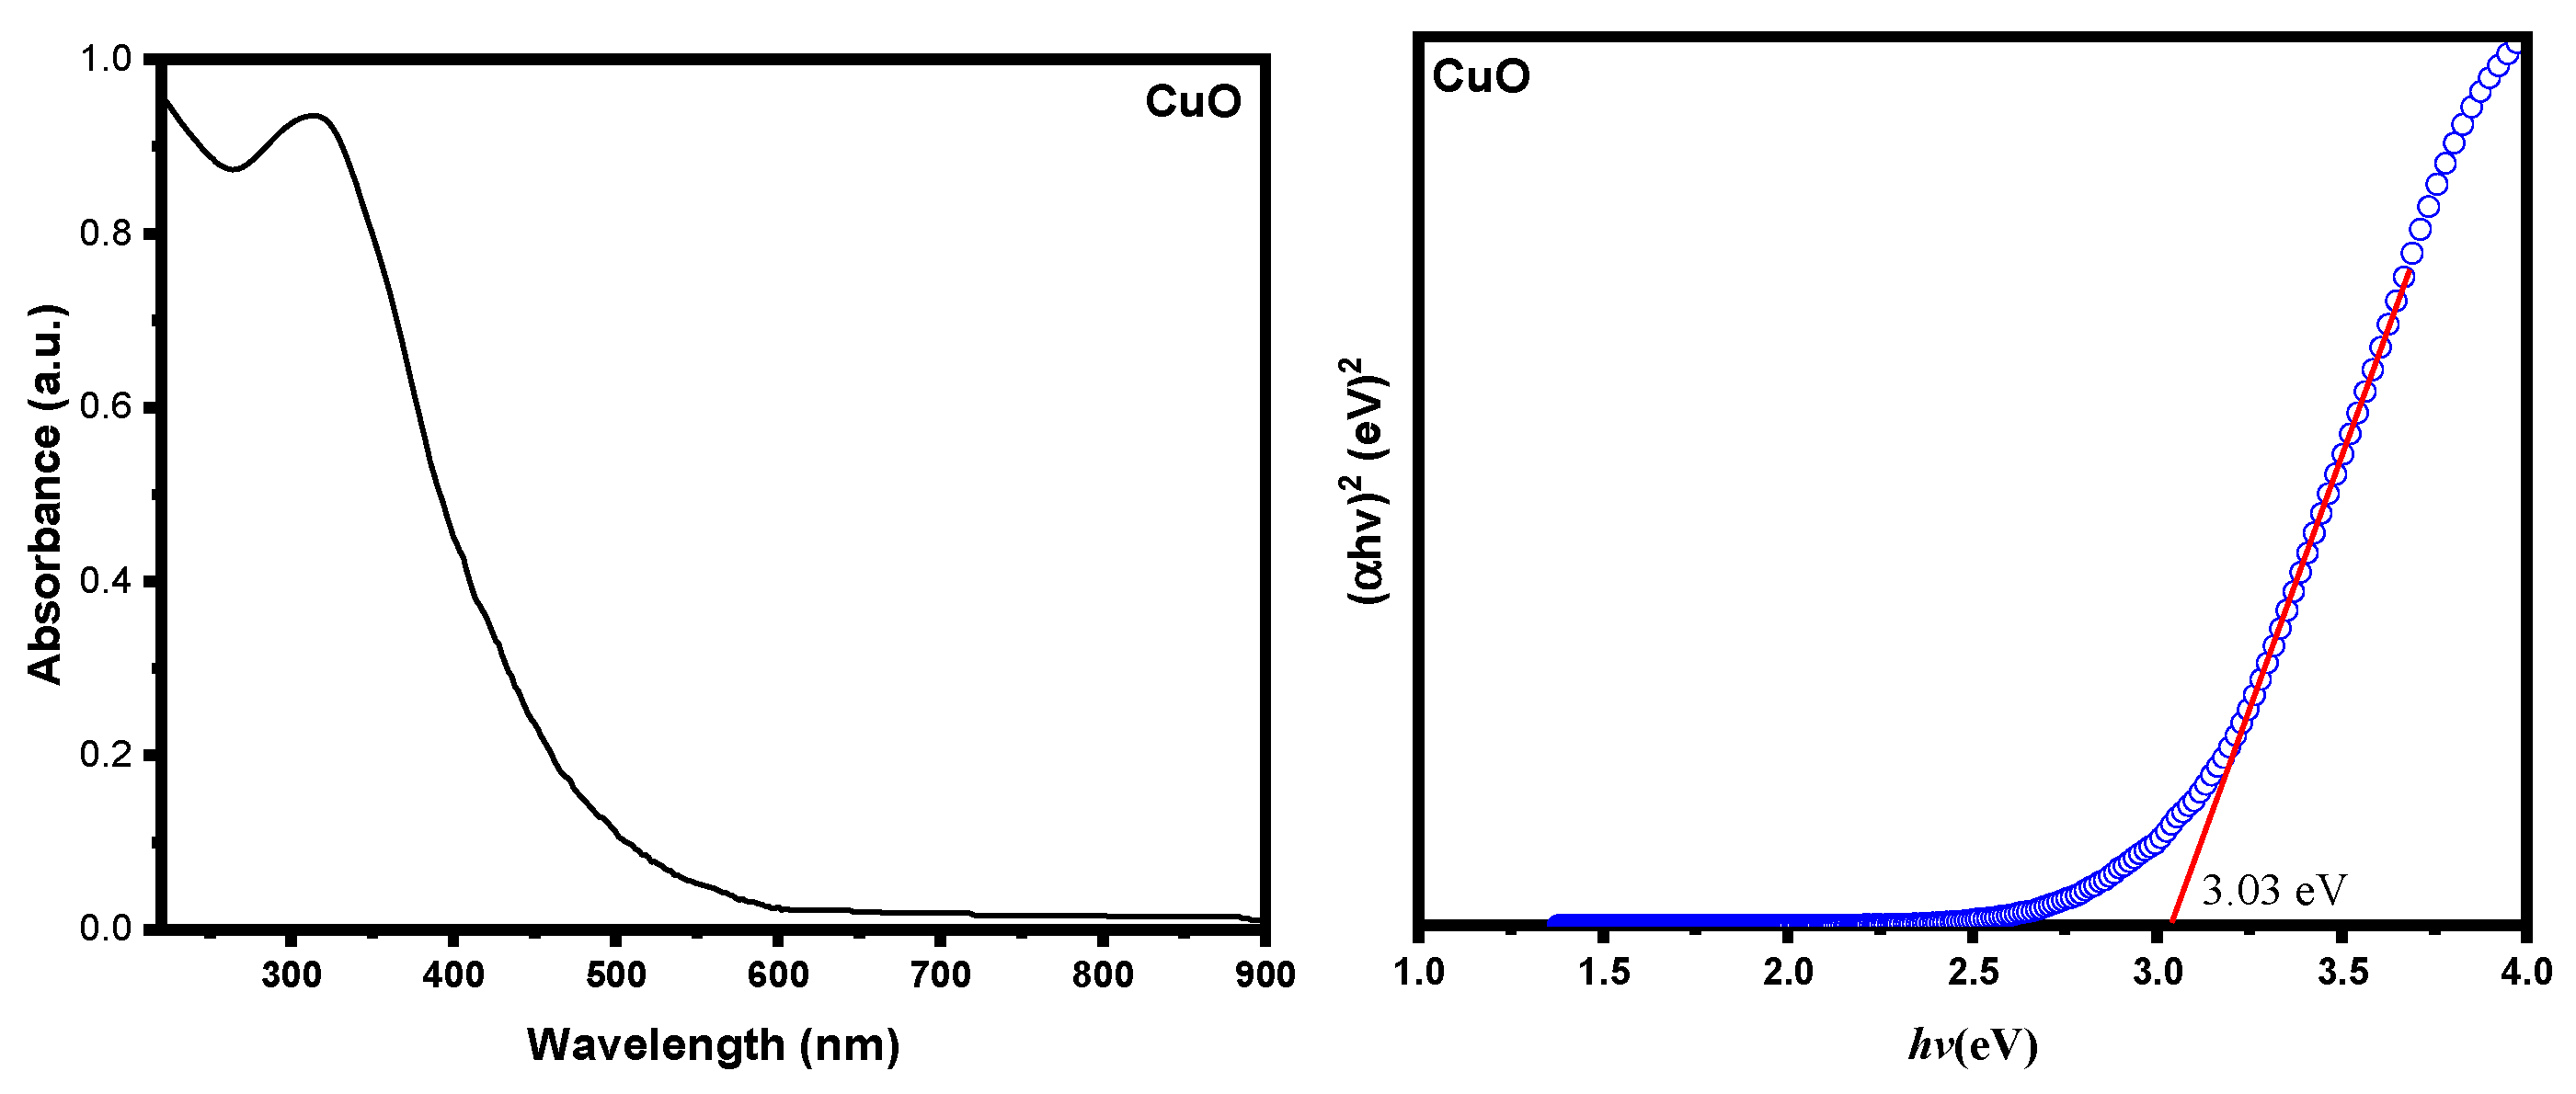
3.5. Determination of Optical Bandgap

Figure 6 depicts the DR UV-vis absorption spectra for the CuO, CdWO4, and CuO–CdWO4 nanocomposite samples and shows a broad absorption peak centered around 350 nm. The optical absorption edge stretches from UV to visible region (from 300 nm to 500 nm), which may be attributed to the increase in the grain size of the samples. The UV-vis absorption data were used to measure the bandgap of the synthesized samples using the Tauc relation: ( ε h v ) = C   ( h v E g ) ^ 2 , where ‘C’ is a constant, ‘ε’ is a molar extinction coefficient, ‘Eg’ is the bandgap of the sample, and ‘n’ stands for evaluating the type of transition [44]. In the Tauc plot, the intercept of the linear portion of the (εhν)2 vs. hν is on the x-axis, as shown in Figure 6. The bandgap values for the CuO, CdWO4, and CuO–CdWO4 were found to be around 3.03 eV, 3.05 eV, and 2.56 eV, respectively. Thus, the synthesized samples are expected to absorb visible light.
The obtained bandgap energy values of the CuO and CdWO4 samples were further used to determine the edge position of the valence band (VB) and the conduction band (CB) in the respective sample. To estimate the edge position, the following theoretical formulas reported in the literature were used [16]:
EVB = X-Ee + 0.5Eg, ECB = EVB − Eg
Here, EVB and ECB are the edge positions for the VB and CB semiconductors; Ee and Eg are the energy of free electrons (~4.5 eV) and the bandgap energy of the semiconductors, respectively; and X is the electro-negativity of the semiconductor. The X values of the CuO and the CdWO4 were obtained from the previous literature as 5.81 and 6.28 eV, respectively [16,45]. The EVB values were calculated to be 2.82 and 3.30 eV, and the ECB values were estimated to be −0.20 and 0.255 eV, for the CuO and the CdWO4, respectively. These results strongly reveal that the heterojunction between CuO and CdWO4 can be effective in preventing the recombination of photogenerated electrons and holes.

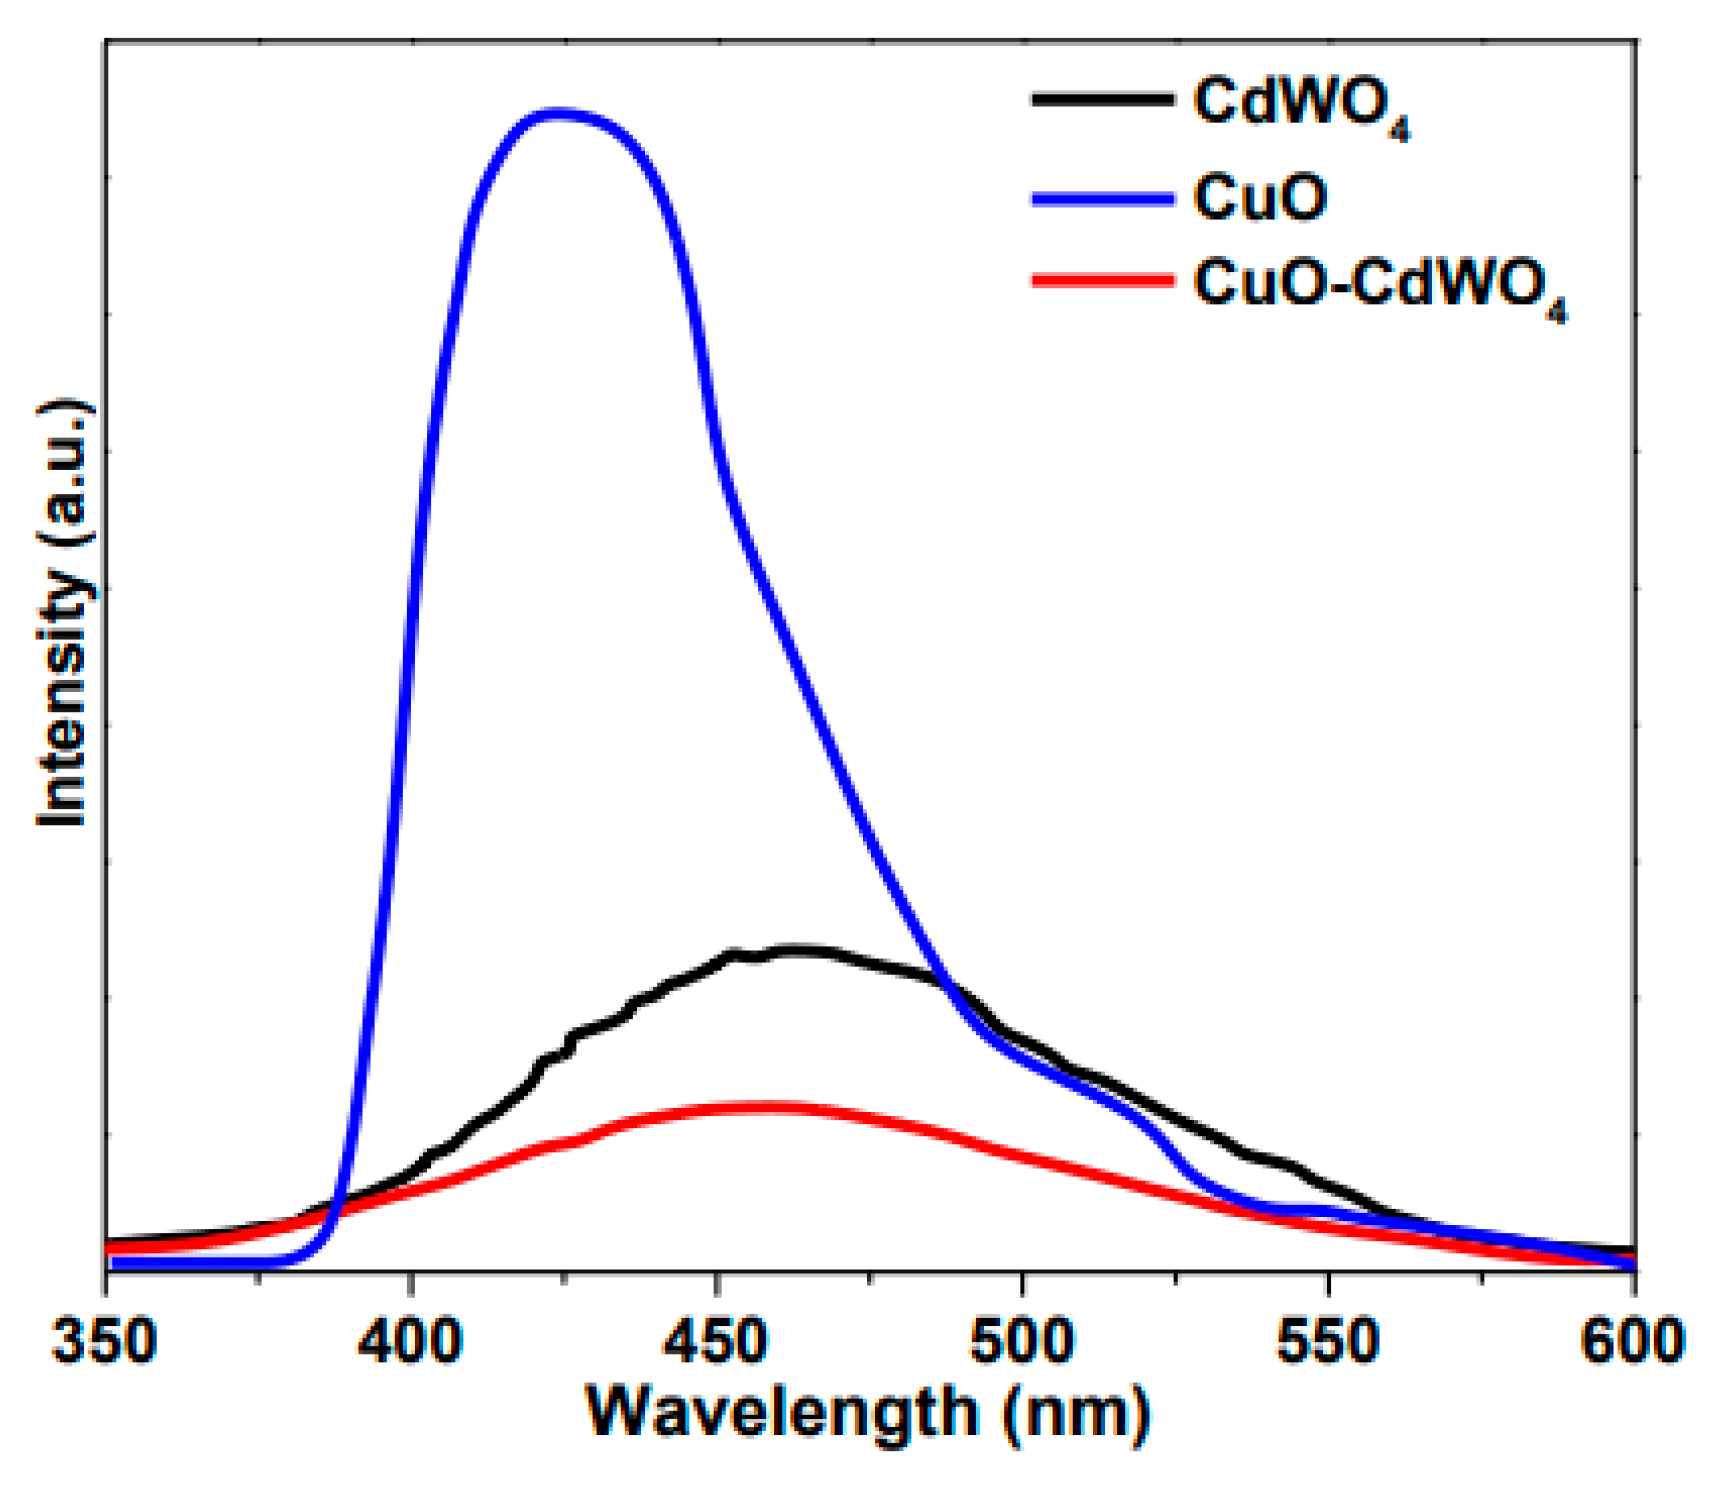
3.6. Photoluminescence (PL) Analysis

Photoluminescence (PL) spectra were obtained to elucidate the migration and separation efficiency of photo-generated charge carriers at the interface of the CuO–CdWO4 semiconductor. The PL emission is the result of electron–hole (e-h+) recombination in the semiconductors [16]. Accordingly, the e-h+ recombination rate is considered to be directly proportional to the PL intensity. A lower PL intensity reveals a lower eh+ recombination rate, thus suggesting the effective photocatalytic applications of the investigated photocatalyst [16]. The PL spectra for the CuO, CdWO4, and CuO–CdWO4 samples are shown in Figure 7. The samples exhibit PL emission in the visible region (400–500 nm). As can be seen in Figure 7, the CuO sample has higher PL intensity than that of the CdWO4 sample. This intensity decreases further in the CuO–CdWO4 composite. It can be deduced that the rate of e-h+ recombination decreases significantly in the composite material, probably due to the synergetic effect between the CuO and CdWO4 semiconductors. This observation indicates that an improved photocatalytic behavior could be expected for the CuO–CdWO4 sample compared to the pristine semiconductors. Besides, the PL spectra provide strong evidence for the interaction between CuO and CdWO4 [16,46].

3.7. X-ray Photoelectron Spectroscopy (XPS) Analysis

The synthesized samples were analyzed using XPS analysis to determine the surface properties of the samples. Comparative XPS analysis of the CuO, CdWO4, and CuO–CdWO4 samples was carried out and the changes in binding energy upon the interaction between CuO and CdWO4 were investigated (Figure 8). The XPS profiles confirm the coexistence of Cu, Cd, W, and O elements in the nanocomposite. The pristine CuO XPS spectra reveal the appearance of two characteristic peaks for Cu species with the spin energy separation of ~20 eV at 933.05 and 953.16 eV corresponding to the Cu2p3/2 and Cu 2p1/2, respectively [47]. Two satellite peaks also appear which could be assigned to the Cu2+ for the CuO sample. These peaks were identified following previous studies, where these peaks reveal the existence of Cu2+ oxidation in the CuO NPs [47,48]. The fitting of the O1s XPS spectra (for CuO) reveals two identical peaks at ~529.0 eV, suggesting the different environment of oxygen in the CuO sample [47]. The pristine CdWO4 XPS spectra for Cd ions appear with two characteristic peaks corresponding to the Cd3d5/2 and Cd3d3/2, with the spin energy separation of ~6.70 eV, at 405.58 eV and 412.32 eV, respectively, suggesting the existence of Cd2+ state in the CdWO4 sample [16]. The W 4f XPS spectrum indicates two characteristic peaks of the W element (+6 oxidation state in CdWO4) located at 35.37 eV and 37.62 eV, respectively [49]. The fitting of the O1s XPS spectra (for CdWO4) indicates the presence of three binding energy peaks at ~529.0, ~531.0, and ~532.5 eV, revealing the binding energy for adsorbed oxygen, hydroxyl oxygen, and lattice oxygen in the CdWO4 sample, respectively [16,49]. After the coupling of CuO to CdWO4, the shifting in the binding energy is clearly seen in the corresponding XPS spectra of the CuO–CdWO4 sample. The shift in binding energy is due to the electron transfer between CuO and CdWO4, which is very favorable for the improved photocatalyst application of CuO–CdWO4. The fitting of the O1s XPS spectrum for the CuO-CdWO4 sample results in the appearance of binding energies for O species from CuO, CdWO4, and adsorbed H2O [48,49]. Therefore, the XPS results confirm the formation of CuO–CdWO4 via a strong interaction between CuO and CdWO4, and these findings are consistent with other analytical results.

3.8. Photocatalytic H2 Production over Synthesized Photocatalysts

The synthesized nanomaterials were investigated as photocatalysts for H2 production via water splitting in the presence of visible light radiation. The photocatalytic investigations were achieved with the addition of 100 mg of photocatalyst in pure water under visible light irradiation for 5 h. The experiments were also performed using methanol or acetic acid (20 vol.% in water) as a sacrificial agent for H2 production [50]. The obtained results over the CuO–CdWO4 nanocomposite were compared with the H2 production ability of the pristine CuO and CdWO4 under the same reaction condition, as depicted in Figure 9a–d The results in Figure 9 clearly reveal a remarkable increase in H2 production efficiency in the case of the CuO–CdWO4 nanocomposite in the presence of methanol as a sacrificial agent in comparison to the pristine CuO and CdWO4 at any given reaction time. The observed results of photocatalytic H2 production under visible light ascribe that effective charge separations were attained when the CuO NPs were embedded on the surface of the CdWO4 [10,50]. The DRUV-vis and PL spectral analyses confirmed this claim. Clearly, the sacrificial agent played a significant role in the water-splitting process [50], as the highest rate of H2 production was achieved in the case of methanol rather than acetic acid.
Figure 9b shows the influence of catalyst dose on the photocatalytic H2 production over the CuO–CdWO4 catalyst using 20 vol.% sacrificing agents. The H2 production enhanced gradually with an increase of catalyst weight up to 100 mg, however, further increase could not alter the H2 production ability of the catalysts. The observed results indicated that a 100 mg catalyst dose was optimal to obtain the best photocatalytic performance; this was probably because the number of catalytically active sites exposed to reacting molecules did not change when the catalyst amount was higher than 100 mg. It was also possible that visible light could not reach the active sites as an increase in light scattering occurred with an increase in catalyst dose. The H2 production increased with the increase of vol% of methanol or acetic acid and reached its highest at 20 vol.% in the case of the CuO–CdWO4 nanocomposite [Figure 9c]. However, a further increase in vol% of methanol resulted in a slight decrease in H2 production. Similar behavior was observed in case of other photocatalysts [9]. An increase in the vol% of the sacrificial agent resulted in the adsorption of a greater number of methanol or acetic acid molecules on the semiconductor surface, blocking visible light from reaching the surface of the catalyst and resulting in a decrease in the H2 production rate.
The reusability of the CuO–CdWO4 nanocomposite was tested for five consecutive cycles. The experiments started with the CuO–CdWO4 mass of 100 mg and 20 vol% of methanol as a sacrificial agent at 25 °C, as mentioned in Figure 9d. After each cycle, the catalyst was recovered as a white powder using centrifugation, followed by washing with deionized water and drying using N2 purging at room temperature. The XRD and TEM analyses (Figures S1 and S2, ESI) of the spent catalyst confirmed the stability of the CuO–CdWO4 nanocomposite as no changes of morphology and phase structure, except the partial loss of crystallinity, were observed. It is clear from Figure 9d that, after consecutive five cycles, the H2 production is at a much higher rate in the CuO–CdWO4 in methanol compared to acetic acid, which retains 90% and 80% of its initial catalytic activity, respectively. It is worth mentioning that, without the sacrificial agents, the catalyst did not produce any considerable H2; while in the presence of methanol and acetic acid, a complete H2 production was achieved after each consecutive catalytic run. The slight decrease in efficiencies could probably be due to the loss of nanocomposite catalyst during the recovery and drying process and might be attributed to the passivation of the nano-catalytic active surface by increasing the concentration of intermediate charge carriers.

3.9. Proposed Reaction Mechanism of H2 Production over CuO–CdWO4

The possible mechanism for the interfacial charge transfer in the CuO–CdWO4 sample under visible light irradiation is proposed in Figure 10. When the CuO–CdWO4 is exposed to visible light, the photogenerated electrons are transported from the VB to the CB of the CuO–CdWO4 [10,50]. As shown in Figure 10, there is a possibility of the generation of e and h+ pairs in both CuO and CdWO4 semiconductors. According to the previous literature, when two different semiconductors (such as CuO and CdWO4) are conjugated, a realignment of the Fermi level generally occurs to meet the thermal equilibrium [10,50]. Since the CB of CuO is more negative than the CB of CdWO4, in the case of the CuO–CdWO4 composite, the electrons can rapidly transfer from the CB of CuO to the CB of CdWO4, which leads to the realignment of the Fermi level until the thermal equilibrium is achieved [27]. Meanwhile, the photogenerated h+ from the highly positive VB of CdWO4 is immigrated to the less positive VB of CuO. This results in the redistribution of electric charges across the semiconductor interface and the formation of the Schottky barrier [27]. The electrons can be trapped in the barrier, and this can lead to the prevention of the recombination of charge carriers. The produced e- and h+ diffuses and reaches the surface of the CuO–CdWO4 composite and reacts with the water molecules (and sacrificial agents) adsorbed on the surface of the catalyst. It should be further noted that the edge positions of the CB and the VB define the e- and h+ reaction ability, respectively. In the case of water splitting, the photoreduction of water occurs by the photogenerated e-. In this case, the bottom of the CB must be more negative than the H+/H2 redox potential (0 eV vs. NHE, pH 0) [50]. The photooxidation reaction is carried out by h+, for which the top of the VB must be more positive than the oxidation potential of O2/H2O (1.23 eV vs. NHE, pH 0) [50]. As can be seen in Figure 10, the edge positions of the CB and the VB for the current material (CuO–CdWO4) meet the required criteria, thus the CuO–CdWO4 could be suitable for water splitting via a redox reaction. In addition, the methanol used in the photo-reforming process can enhance the efficiency of H2 production. Sacrificial agents, which have lower oxidation potential (for instance, 0.45 V vs. NHE for methanol), may easily and more efficiently scavenge the h+, thus largely preventing the e-h+ recombination. The photooxidation of methanol can be carried out through scavenged h+; therefore, the sacrificial agents may also serve as proton sources. Therefore, the use of methanol can be considered as the coupling of the oxidation of an organic substance and proton reduction. Herein, the CuO–CdWO4 composite showed enhanced photocatalytic activity for water splitting when methanol was used as the sacrificial agent. This result is supported by previous studies [10,50].

4. Conclusions

In conclusion, the bare CuO, CdWO4, and CuO–CdWO4 nanocomposite samples were prepared using a simple facile green chemistry-based approach. Different analytical techniques, such as XRD, FT-IR, DRS UV-vis, SEM, TEM, N2 physisorption, PL, and XPS, were used to analyze the physicochemical properties of the prepared samples. In addition, the synthesized samples were utilized as catalysts for photocatalytic H2 production under visible light irradiation. The role of different reaction conditions, including visible light irradiation time, catalyst mass, concentration of sacrificial reagents, and reusability for five cycles, was studied. The maximum H2 was observed while using methanol as a sacrificial agent, which was highest when used over the CuO–CdWO4 nanocomposite. This enhancement was due to the faster charge separation and higher visible light absorption as a result of the synergistic effect between the CuO–CdWO4nanocomposite and methanol. A new method for the synthesis of CuO-CdWO4 nanocomposite was revealed. The photocatalytic study showed an increase in the activity of CuO–CdWO4 towards methanol for H2 generation. The reusability study clearly showed the stability of the developed photocatalyst. The present synthesis approach could be very useful to develop a highly stable photocatalyst under visible light irradiation.

Supplementary Materials

The following supporting information can be downloaded at: https://www.mdpi.com/article/10.3390/nano12244472/s1, Synthesis methodology for CuO and CdWO4 nanoparticles using extract of the Brassica rapa plant; Figure S1: XRD patterns for CuO-CdWO4 composite (a) fresh and (b) spent for 5 cycles; Figure S2: TEM images for CuO-CdWO4 composite (a) fresh and (b) spent for 5 cycles

Author Contributions

Conceptualization and investigation, S.I.S. and B.F.; methodology, M.K.K., S.A.A. and K.N.; software, S.M.B. and S.Z.A.-S.; validation, S.I.S., B.F., M.A.M., K.N. and S.A.A.; formal analysis, S.I.S., B.F. and S.M.B.; resources, S.A.A., M.A.M. and K.N.; data curation and writing—original draft preparation, S.I.S., B.F., M.A.M. and K.N.; writing—review and editing, S.I.S., B.F., M.A.M. and K.N.; supervision, S.A.A., M.A.M. and K.N.; project administration, S.A.A.; funding acquisition, S.A.A. All authors have read and agreed to the published version of the manuscript.

Funding

This project was funded by the Deputyship for Research and Innovation, Ministry of Education in Saudi Arabia through the project number IFPNC-001-130-2020, and Deanship of Scientific Research (DSR), King Abdulaziz University, Jeddah, Saudi Arabia.

Institutional Review Board Statement

Not applicable.

Informed Consent Statement

Not applicable.

Data Availability Statement

Not applicable.

Acknowledgments

The authors extend their appreciation to the Deputyship for Research and Innovation, Ministry of Education in Saudi Arabia for funding this research work through the project number IFPNC-001-130-2020 and Deanship of Scientific Research (DSR), King Abdulaziz University, Jeddah, Saudi Arabia.

Conflicts of Interest

The authors declare no conflict of interest.

Appendix A

This study is an extension of our previous studies [22,27], therefore, we obtained the copyright permission from the publishers.

References

  1. Eberle, U.; Felderhoff, M.; Schueth, F. Chemical and physical solutions for hydrogen storage. Angew. Chem. Int. Ed. 2009, 48, 6608–6630. [Google Scholar] [CrossRef] [PubMed]
  2. Schlapbach, L.; Züttel, A. Hydrogen-storage materials for mobile applications. In Materials for Sustainable Energy: A Collection of Peer-Reviewed Research and Review Articles from Nature Publishing Group; World Scientific: Singapore, 2011; pp. 265–270. [Google Scholar]
  3. Rowsell, J.L.; Yaghi, O.M. Strategies for hydrogen storage in metal–organic frameworks. Angew. Chem. Int. Ed. 2005, 44, 4670–4679. [Google Scholar] [CrossRef] [PubMed]
  4. Yang, J.; Sudik, A.; Wolverton, C.; Siegel, D.J. High capacity hydrogen storage materials: Attributes for automotive applications and techniques for materials discovery. Chem. Soc. Rev. 2010, 39, 656–675. [Google Scholar] [CrossRef] [PubMed] [Green Version]
  5. Talibawo, J.; Kyesmen, P.I.; Cyulinyana, M.C.; Diale, M. Facile Zn and Ni Co-doped hematite nanorods for efficient photocatalytic water oxidation. Nanomaterials 2022, 12, 2961. [Google Scholar] [CrossRef] [PubMed]
  6. Cao, Q.; Hao, S.; Wu, Y.; Pei, K.; You, W.; Che, R. Interfacial charge redistribution in interconnected network of Ni2P–Co2P boosting electrocatalytic hydrogen evolution in both acidic and alkaline conditions. Chem. Eng. J. 2021, 424, 130444. [Google Scholar] [CrossRef]
  7. Cao, Q.; Yu, J.; Cao, Y.; Delaunay, J.J.; Che, R. Unusual effects of vacuum annealing on large-area Ag3PO4 microcrystalline film photoanode boosting cocatalyst- and scavenger-free water splitting. J. Mater. 2021, 7, 929–939. [Google Scholar] [CrossRef]
  8. Badwal, S.P.; Giddey, S.; Munnings, C. Hydrogen production via solid electrolytic routes. Wiley Interdiscip. Rev. Energy Environ. 2013, 2, 473–487. [Google Scholar] [CrossRef]
  9. Song, H.; Luo, S.; Huang, H.; Deng, B.; Ye, J. Solar-Driven Hydrogen Production: Recent Advances, Challenges, and Future Perspectives. ACS Energy Lett. 2022, 7, 1043–1065. [Google Scholar] [CrossRef]
  10. Wen, J.; Xie, J.; Chen, X.; Li, X. A review on g-C3N4-based photocatalysts. Appl. Surf. Sci. 2017, 391, 72–123. [Google Scholar] [CrossRef]
  11. Marschall, R. 50 Years of Materials Research for Photocatalytic Water Splitting. Eur. J. Inorg. Chem. 2021, 2021, 2435–2441. [Google Scholar] [CrossRef]
  12. Rusinque, B.; Escobedo, S.; de Lasa, H. Hydrogen Production via Pd-TiO2 Photocatalytic Water Splitting under Near-UV and Visible Light: Analysis of the Reaction Mechanism. Catalysts 2021, 11, 405. [Google Scholar] [CrossRef]
  13. Jawhari, A.H.; Hasan, N.; Radini, I.A.; Narasimharao, K.; Malik, M.A. Noble Metals Deposited LaMnO3 Nanocomposites for Photocatalytic H2 Production. Nanomaterials 2022, 12, 2985. [Google Scholar] [CrossRef] [PubMed]
  14. Bhirud, A.P.; Sathaye, S.D.; Waichal, R.P.; Ambekar, J.D.; Park, C.-J.; Kale, B.B. In-situ preparation of N-TiO2/graphene nanocomposite and its enhanced photocatalytic hydrogen production by H2S splitting under solar light. Nanoscale 2015, 7, 5023–5034. [Google Scholar] [CrossRef] [PubMed]
  15. Kuang, L.; Zhang, W. Enhanced hydrogen production by carbon-doped TiO2 decorated with reduced graphene oxide (rGO) under visible light irradiation. RSC Adv. 2016, 6, 2479–2488. [Google Scholar] [CrossRef]
  16. Feng, Y.; Liu, C.; Chen, J.; Che, H.; Xiao, L.; Gu, W.; Shi, W. Facile synthesis of BiOI/CdWO4 p–n junctions: Enhanced photocatalytic activities and photoelectrochemistry. RSC Adv. 2016, 6, 38290–38299. [Google Scholar] [CrossRef]
  17. Zhang, X.-Y.; Li, H.-P.; Cui, X.-L.; Lin, Y. Graphene/TiO2 nanocomposites: Synthesis, characterization and application in hydrogen evolution from water photocatalytic splitting. J. Mater. Chem. 2010, 20, 2801–2806. [Google Scholar] [CrossRef]
  18. Bouazizi, N.; Bargougui, R.; Oueslati, A.; Benslama, R. Effect of synthesis time on structural, optical and electrical properties of CuO nanoparticles synthesized by reflux condensation method. Adv. Mater. Lett. 2015, 6, 158–164. [Google Scholar] [CrossRef]
  19. Dobrucka, R. Antioxidant and catalytic activity of biosynthesized CuO nanoparticles using extract of Galeopsidis herba. J. Inorg. Organomet. Polym. Mater. 2018, 28, 812–819. [Google Scholar] [CrossRef] [Green Version]
  20. Singh, G.; Panday, S.; Rawat, M.; Kukkar, D.; Basu, S. Facile synthesis of CuO semiconductor nanorods for time dependent study of dye degradation and bioremediation applications. J. Nano Res. 2017, 46, 154–164. [Google Scholar] [CrossRef]
  21. Tamaekong, N.; Liewhiran, C.; Phanichphant, S. Synthesis of thermally spherical CuO nanoparticles. J. Nanomater. 2014, 2014, 1–5. [Google Scholar] [CrossRef]
  22. Fatima, B.; Siddiqui, S.; Ahmed, R.; Chaudhry, S. Preparation of functionalized CuO nanoparticles using Brassica rapa leave extract for water purification. Desalination Water Treat. 2019, 64, 192–205. [Google Scholar] [CrossRef]
  23. Otero-González, L.; Field, J.A.; Sierra-Alvarez, R. Inhibition of anaerobic wastewater treatment after long-term exposure to low levels of CuO nanoparticles. Water Res. 2014, 58, 160–168. [Google Scholar] [CrossRef] [PubMed]
  24. Verma, N.; Kumar, N. Synthesis and biomedical applications of copper oxide nanoparticles: An expanding horizon. ACS Biomater. Sci. Eng. 2019, 5, 1170–1188. [Google Scholar] [CrossRef] [PubMed]
  25. Raizada, P.; Sudhaik, A.; Patial, S.; Hasija, V.; Khan, A.A.P.; Singh, P.; Gautam, S.; Kaur, M.; Nguyen, V.-H. Engineering nanostructures of CuO-based photocatalysts for water treatment: Current progress and future challenges. Arab. J. Chem. 2020, 13, 8424–8457. [Google Scholar] [CrossRef]
  26. Xu, W.; Zheng, C.; Hua, H.; Yang, Q.; Chen, L.; Xi, Y.; Hu, C. Synthesis and photoelectrochemical properties of CdWO4 and CdS/CdWO4 nanostructures. Appl. Surf. Sci. 2015, 327, 140–148. [Google Scholar] [CrossRef]
  27. Fatima, B.; Siddiqui, S.I.; Ahmed, R.; Chaudhry, S.A. Green synthesis of f-CdWO4 for photocatalytic degradation and adsorptive removal of Bismarck Brown R dye from water. Water Resour. Ind. 2019, 22, 100119. [Google Scholar] [CrossRef]
  28. Wang, L.; Wang, W. In situ synthesis of CdS modified CdWO4 nanorods and their application in photocatalytic H2 evolution. CrystEngComm 2012, 14, 3315–3320. [Google Scholar] [CrossRef]
  29. Fatima, B.; Siddiqui, S.I.; Rajor, H.K.; Malik, M.A.; Rao, K.N.; Ahmad, R.; Vikrant, K.; Kim, T.; Kim, K.-H. Photocatalytic removal of organic dye using green synthesized zinc oxide coupled cadmium tungstate nanocomposite under natural solar light irradiation. Environ. Res. 2022, 216, 114534. [Google Scholar] [CrossRef]
  30. Thirumalai, K.; Balachandran, S.; Selvam, K.; Swaminathan, M. Nanoribbon-structured CdWO4–ZnO for multiple applications. Emerg. Mater. Res. 2016, 5, 264–276. [Google Scholar] [CrossRef]
  31. Sheng, J.L.; Dong, H.; Meng, X.B.; Tang, H.L.; Yao, Y.H.; Liu, D.Q.; Bai, L.L.; Zhang, F.M.; Wei, J.Z.; Sun, X.J. Effect of Different Functional Groups on Photocatalytic Hydrogen Evolution in Covalent-Organic Frameworks. ChemCatChem 2019, 11, 2313. [Google Scholar] [CrossRef]
  32. Akhter, M.; Rahman, M.; Ullah AK, M.; Sikder, M.; Hosokawa, T.; Saito, T.; Kurasaki, M. Brassica rapa var. japonica Leaf Extract Mediated Green Synthesis of Crystalline Silver Nanoparticles and Evaluation of Their Stability, Cytotoxicity and Antibacterial Activity. J. Inorg. Organomet. Polym. 2018, 28, 1483. [Google Scholar] [CrossRef]
  33. Narayanan, K.B.; Park, H.H. Antifungal activity of silver nanoparticles synthesized using turnip leaf extract (Brassica rapa L.) against wood rotting pathogens. Eur. J. Plant Pathol. 2014, 140, 185. [Google Scholar] [CrossRef]
  34. Shi, L.B.; Tang, P.F.; Zhang, W.; Zhao, Y.P.; Zhang, L.C.; Zhang, H. Green synthesis of CuO nanoparticles using Cassia auriculata leaf extract and in vitro evaluation of their biocompatibility with rheumatoid arthritis macrophages (RAW 264.7). Trop. J. Pharm. Res. 2017, 16, 185–192. [Google Scholar] [CrossRef] [Green Version]
  35. Tian, N.; Huang, H.; Zhang, Y. Mixed-calcination synthesis of CdWO4/g-C3N4 heterojunction with enhanced visible-light-driven photocatalytic activity. Appl. Surf. Sci. 2015, 358, 343–349. [Google Scholar] [CrossRef]
  36. Mashkani, S.H.; Nasab, A.S. A simple sonochemical synthesis and characterization of CdWO4 nanoparticles and its photocatalytic application. J. Mater. Sci. Mater. Electron. 2016, 27, 3240–3244. [Google Scholar] [CrossRef]
  37. Liu, Y.; Kim, S.; Kim, Y.J.; Perumalsamy, H.; Lee, S.; Hwang, E.; Yi, T.H. Green synthesis of gold nanoparticles using Euphrasia officinalis leaf extract to inhibit lipopolysaccharide-induced inflammation through NF-κB and JAK/STAT pathways in RAW 264.7 macrophages. Int. J. Nanomed. 2019, 14, 2945–2959. [Google Scholar] [CrossRef] [Green Version]
  38. Loganayaki, N.; Siddhuraju, P.; Manian, S. Antioxidant activity and free radical scavenging capacity of phenolic extracts from Helicteres isora L. and Ceiba pentandra L. J. Food Sci. Technol. 2013, 50, 687–695. [Google Scholar] [CrossRef] [Green Version]
  39. Calos, N.J.; Forrester, J.S.; Schaffer, G.B. A crystallographic contribution to the mechanism of a mechanically induced solid-state reaction. J. Solid State Chem. 1996, 122, 273–280. [Google Scholar] [CrossRef]
  40. Fatima, B.; Siddiqui, S.I.; Ahmad, R.; Linh, N.T.T.; Thai, V.N. CuO-ZnO-CdWO4: A sustainable and environmentally benign photocatalytic system for water cleansing. Environ. Sci. Pollut. Res. 2021, 28, 53793–53803. [Google Scholar] [CrossRef]
  41. Rong, F.; Lu, Q.; Mai, H.; Chen, D.; Caruso, R.A. Hierarchically Porous WO3/CdWO4 Fiber-in-tube nanostructures featuring readily accessible active sites and enhanced photocatalytic effectiveness for antibiotic degradation in water. ACS Appl. Mater. Interfaces 2021, 13, 21138–21148. [Google Scholar] [CrossRef]
  42. Agati, M.; Boninelli, S.; Hamdan, A. Atomic scale microscopy unveils the growth mechanism of 2D-like CuO nanoparticle agglomerates produced via electrical discharges in water. Mater. Chem. Phys. 2021, 261, 124244. [Google Scholar] [CrossRef]
  43. Yu, Z.; Moussa, H.; Liu, M.; Schneider, R.; Moliere, M.; Liao, H. Heterostructured metal oxides-ZnO nanorods films prepared by SPPS route for photodegradation applications. Surf. Coat. Technol. 2019, 375, 670–680. [Google Scholar] [CrossRef]
  44. Sing, K.S.W.; Williams, R.T. Physisorption Hysteresis Loops and the Characterization of Nanoporous Materials. Adsorpt. Sci. Technol. 2004, 22, 773. [Google Scholar] [CrossRef]
  45. Cao, Q.; Li, Q.; Pi, Z.; Zhang, J.; Sun, L.-W.; Xu, J.; Cao, Y.; Cheng, J.; Bian, Y. Metal–Organic-Framework-Derived Ball-Flower-like Porous Co3O4/Fe2O3 Heterostructure with Enhanced Visible-Light-Driven Photocatalytic Activity. Nanomaterials 2022, 12, 904. [Google Scholar] [CrossRef] [PubMed]
  46. Loka, C.; Lee, K.S. Enhanced Visible-Light-Driven Photocatalysis of Ag/Ag2O/ZnO Nanocomposite Heterostructures. Nanomaterials 2022, 12, 2528. [Google Scholar] [CrossRef]
  47. Baig, N.; Saleh, T. Superhydrophobic Polypropylene Functionalized with Nanoparticles for Efficient Fast Static and Dynamic Separation of Spilled Oil from Water. Glob. Chall. 2019, 3, 1800115. [Google Scholar] [CrossRef] [Green Version]
  48. Alam, M.M.; Rahman, M.; Asiri, A.M.; Fazal, M.A. A reliable elec-trochemical approach for detection of testosterone with CuO-doped CeO2 nanocomposites-coated glassy carbon electrode. J. Mater. Sci. Mater. Electron. 2001, 32, 5259–5273. [Google Scholar] [CrossRef]
  49. Liu, Y.; Li, L.; Wang, R.; Li, J.; Huang, J.; Zhang, W. Multi-mode photocatalytic performances of CdS QDs modified CdIn2S4/CdWO4 nanocomposites with high electron transfer ability. J. Nanopart. Res. 2018, 20, 1–17. [Google Scholar] [CrossRef]
  50. Christoforidis, K.C.; Fornasiero, P. Photocatalytic Hydrogen Production: A Rift into the Future Energy Supply. ChemCatChem 2017, 9, 1523. [Google Scholar] [CrossRef]
Scheme 1. Schematic representation of the photocatalytic reactor for H2 production.
Nanomaterials 12 04472 sch001
Figure 1. FT-IR spectra for (a) CuO (Reprinted with copyright permission from Fatima et al. [22]), (b) CdWO4 (Reprinted with copyright permission from Fatima et al. [27]), and (c) CuO-CdWO4 nanocomposite.
Nanomaterials 12 04472 g001
Figure 2. XRD patterns of CuO (Reprinted with permission from Fatima et al. [22]), CdWO4 (Reprinted with permission from Fatima et al. [27]), and CuO–CdWO4 nanocomposite.
Nanomaterials 12 04472 g002
Figure 3. SEM images for (a) CuO, (b) CdWO4 and (c) CuO–CdWO4, and (d) EDX pattern for CuO-CdWO4.
Nanomaterials 12 04472 g003aNanomaterials 12 04472 g003b
Figure 4. TEM images of (a) CuO, (b) CdWO4 and (c) CuO–CdWO4, and (d) SEAD pattern for CuO-CdWO4 nanocomposite.
Nanomaterials 12 04472 g004
Figure 5. N2 adsorption-desorption isotherms and pore size distribution patterns for the CuO, CdWO4, and CuO–CdWO4 nanocomposite samples.
Nanomaterials 12 04472 g005aNanomaterials 12 04472 g005b
Figure 6. DR UV-vis spectra and the Tauc plots for CuO, CdWO4, and CuO–CdWO4 nanocomposite samples.
Nanomaterials 12 04472 g006aNanomaterials 12 04472 g006b
Figure 7. Photoluminescence (PL) spectra for CuO, CdWO4, and CuO–CdWO4 samples
Nanomaterials 12 04472 g007
Figure 8. XPS analysis of CuO, CdWO4, and CuO–CdWO4.
Nanomaterials 12 04472 g008
Figure 9. Production of H2 as a function of (a) visible light irradiation time (catalyst concentration = 100 mg, methanol = 20 vol.%, and acetic acid = 20 vol.%), (b) catalyst dosage (methanol = 20 vol.% and acetic acid = 20 vol.%), (c) methanol and acetic acid concentration (catalyst concentration = 100 mg) and (d) H2 production for five cyclic runs (catalyst mass = 100 mg, methanol = 20 vol.%, and acetic acid = 20 vol.%).
Nanomaterials 12 04472 g009
Figure 10. Proposed reaction mechanism of H2 production using sacrificing reagents in the presence of CuO–CdWO4 nanocomposite.
Nanomaterials 12 04472 g010
Table 1. FT-IR analysis of CuO, CdWO4, and CuO–CdWO4 samples.
CuOCdWO4CuO–CdWO4
Wavenumber Region (cm−1)Assigned
Group
Wavenumber (cm−1)Assigned
Group
Wavenumber Region (cm−1)Assigned
Group
3398-O-H stretching3419-O-H stretching3481–3400-O-H stretching
2060C=N stretching2923 and 2853Stretching vibration of C-H of CH3, and CH2, respectively--
1590C=O and/or -NH stretching1744–1639C=O, -NH, and aromatic C=C double-bond functional groups1670–1590C=O, -NH, and aromatic C=C double-bond functional groups
1400–1023Aromatic C–C groups and C–O functional groups1460–1020Aromatic C–C groups and C–O functional groups1460–1020Aromatic C–C groups and C–O functional groups
935–700Deformation vibration of C–H bonds----
600–400Cu–O bond900–500Intrinsic vibrations from CdWO41000–400Vibrations from CuO and CdWO4
Table 2. EDX analysis of CuO, CdWO4, and CuO–CdWO4 samples.
OrderElementsEDX Analysis (Atom %)
CuOCdWO4CuO–CdWO4
1.Cu28.33-38.24
2.Cd-20.8414.05
3.W-45.3224.85
4.O53.1633.8622.85
Publisher’s Note: MDPI stays neutral with regard to jurisdictional claims in published maps and institutional affiliations.

