
Preparation of Solid Lipid Nanoparticles of Cinnamaldehyde and Determination of Sustained Release Capacity
Abstract
:1. Introduction
2. Materials and Methods
2.1. Materials and Reagents
2.2. Instruments and Equipmen
2.3. Preparation and Characterization of SLN-CA
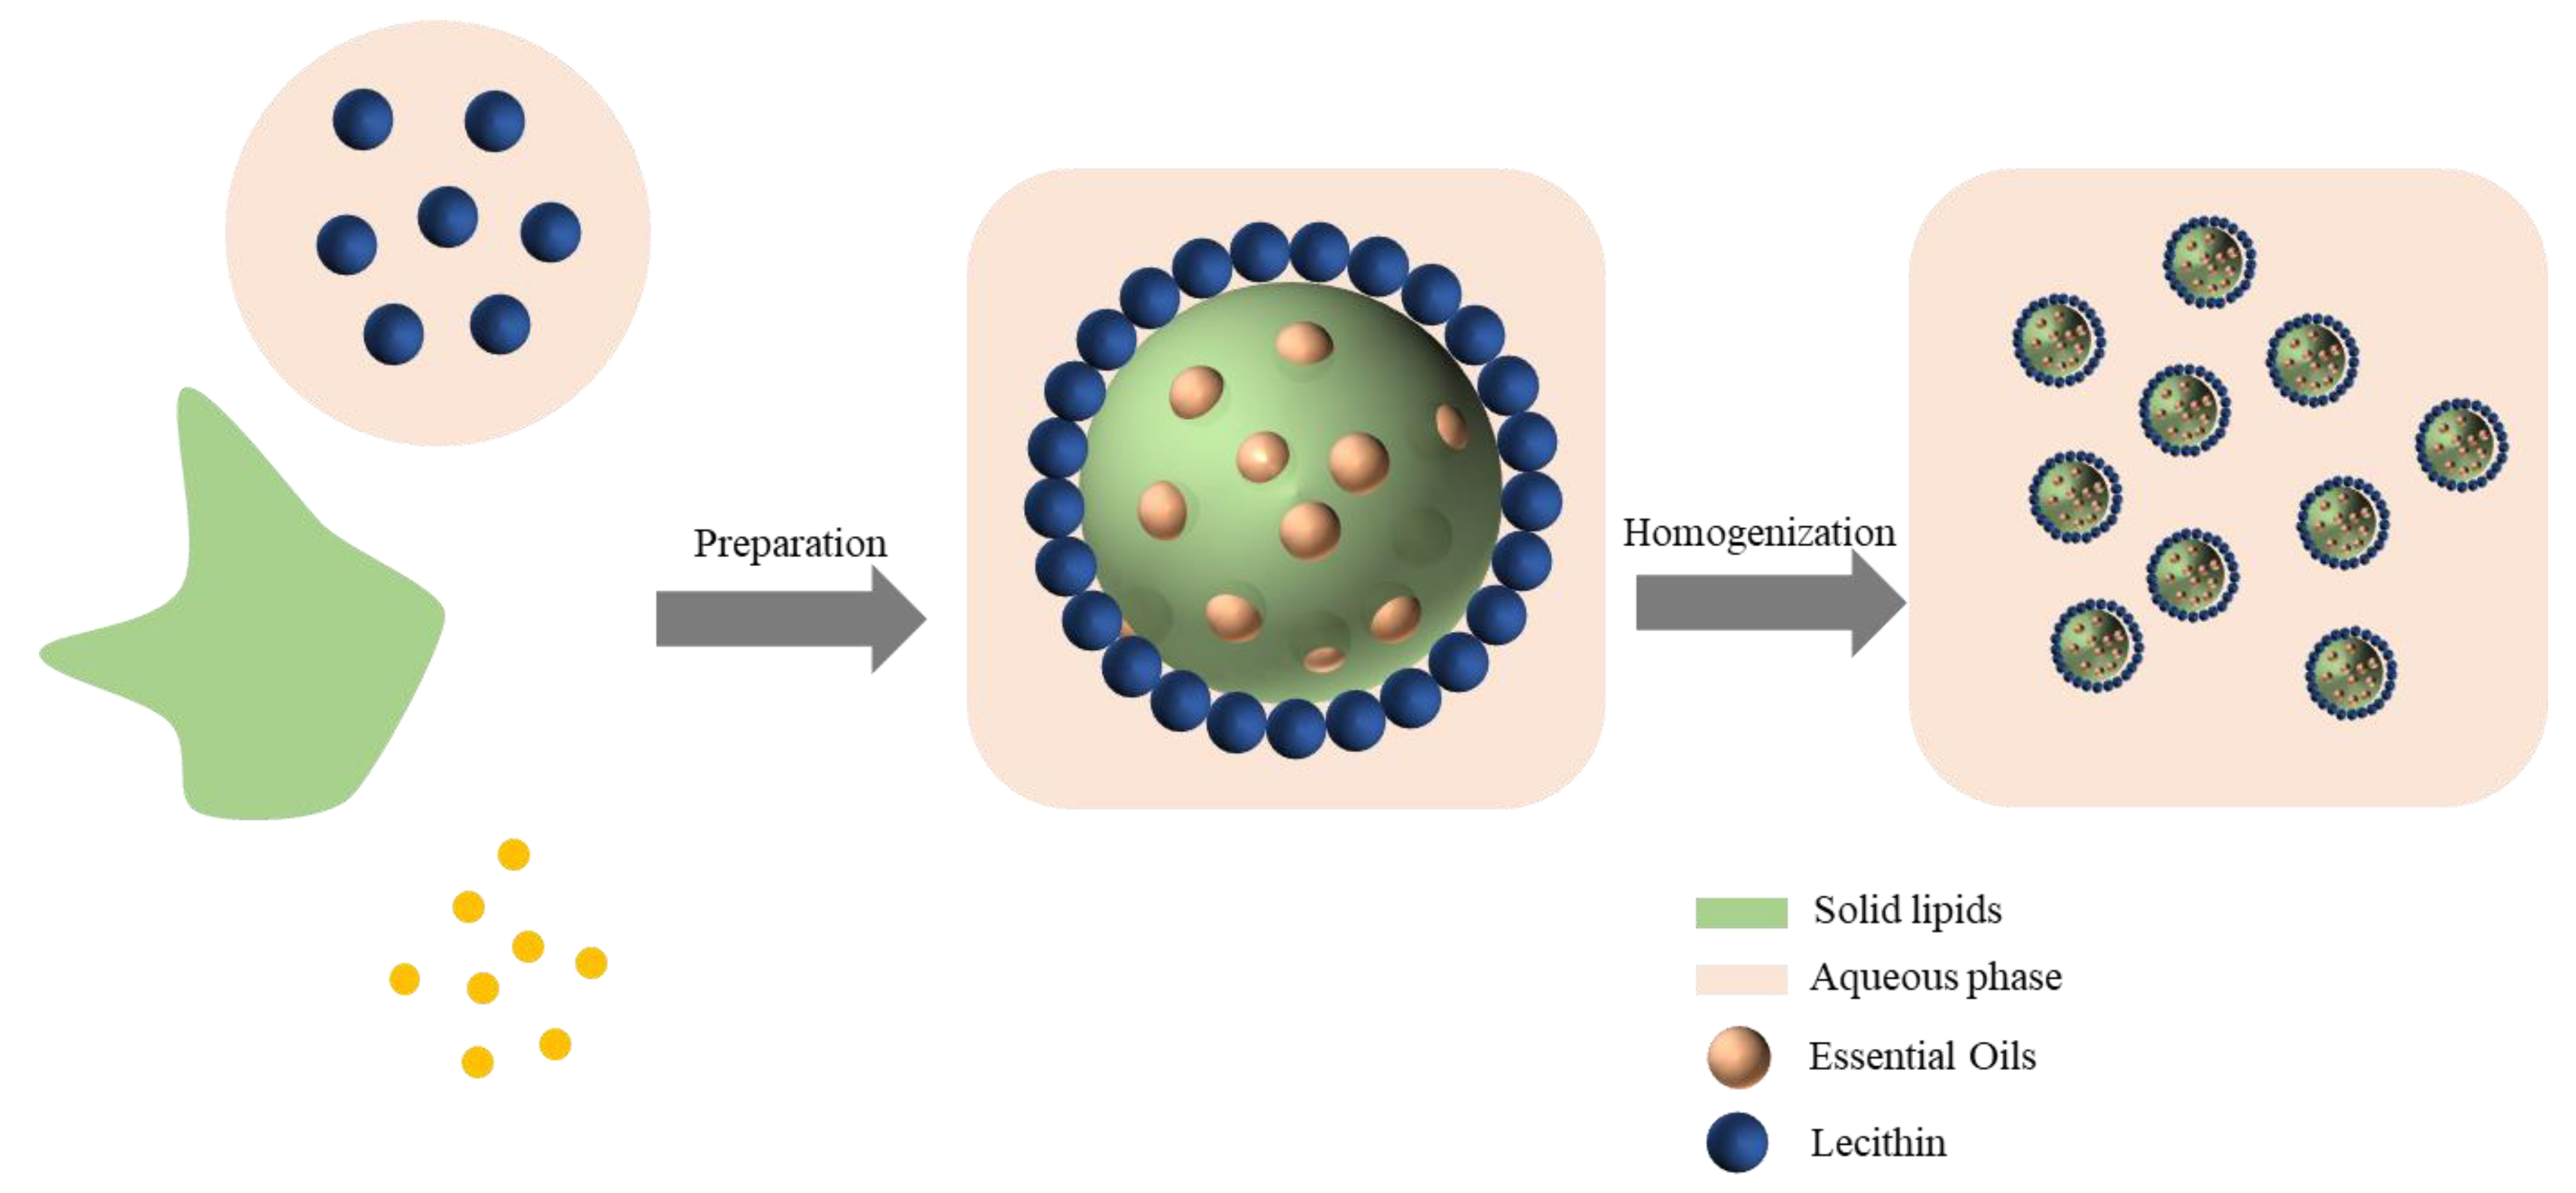
2.3.1. Preparation of SLN-CA
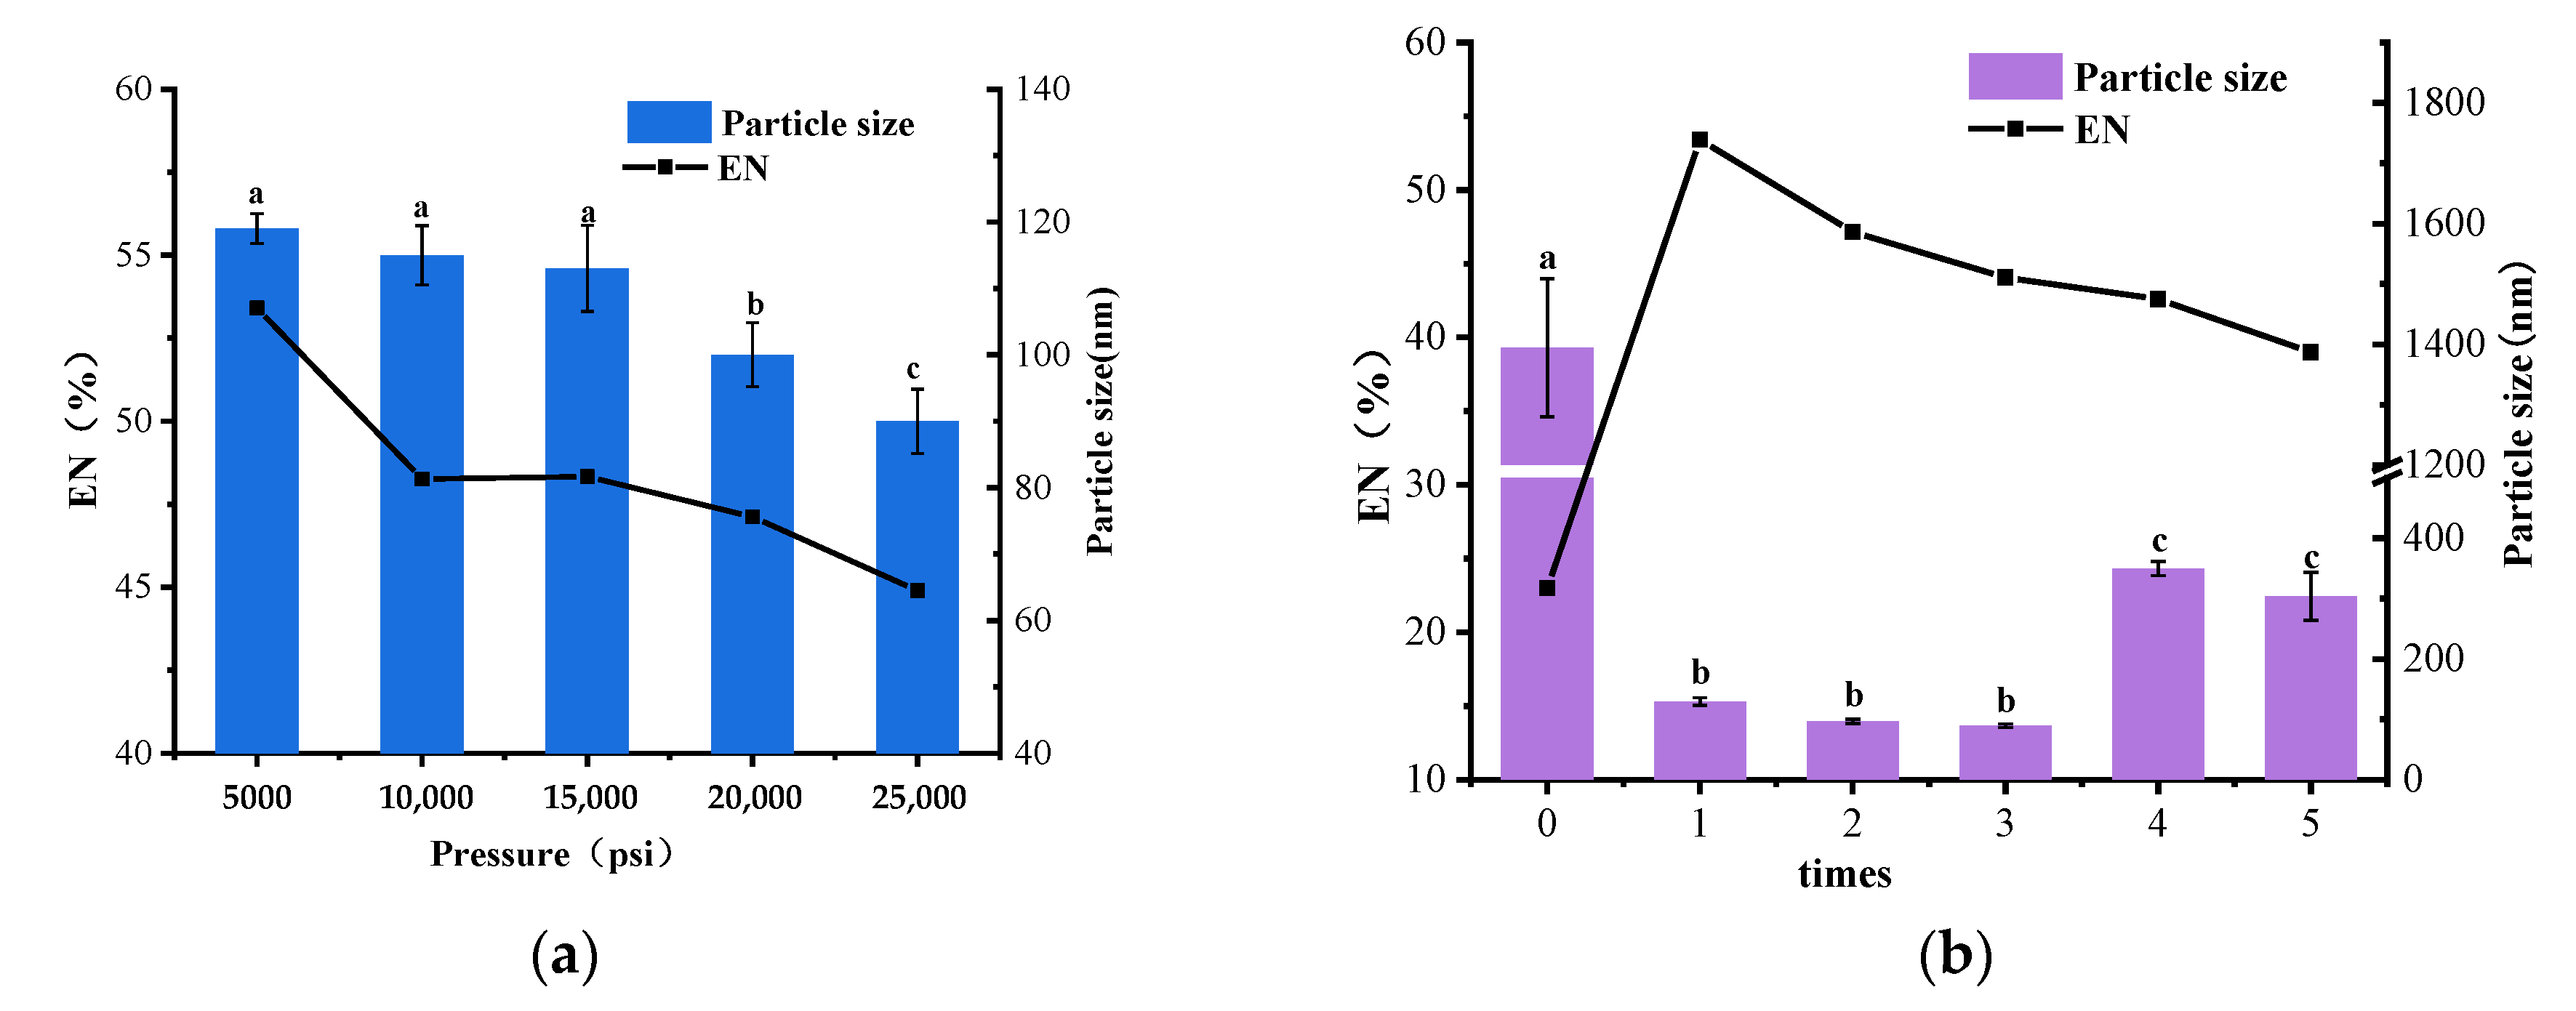
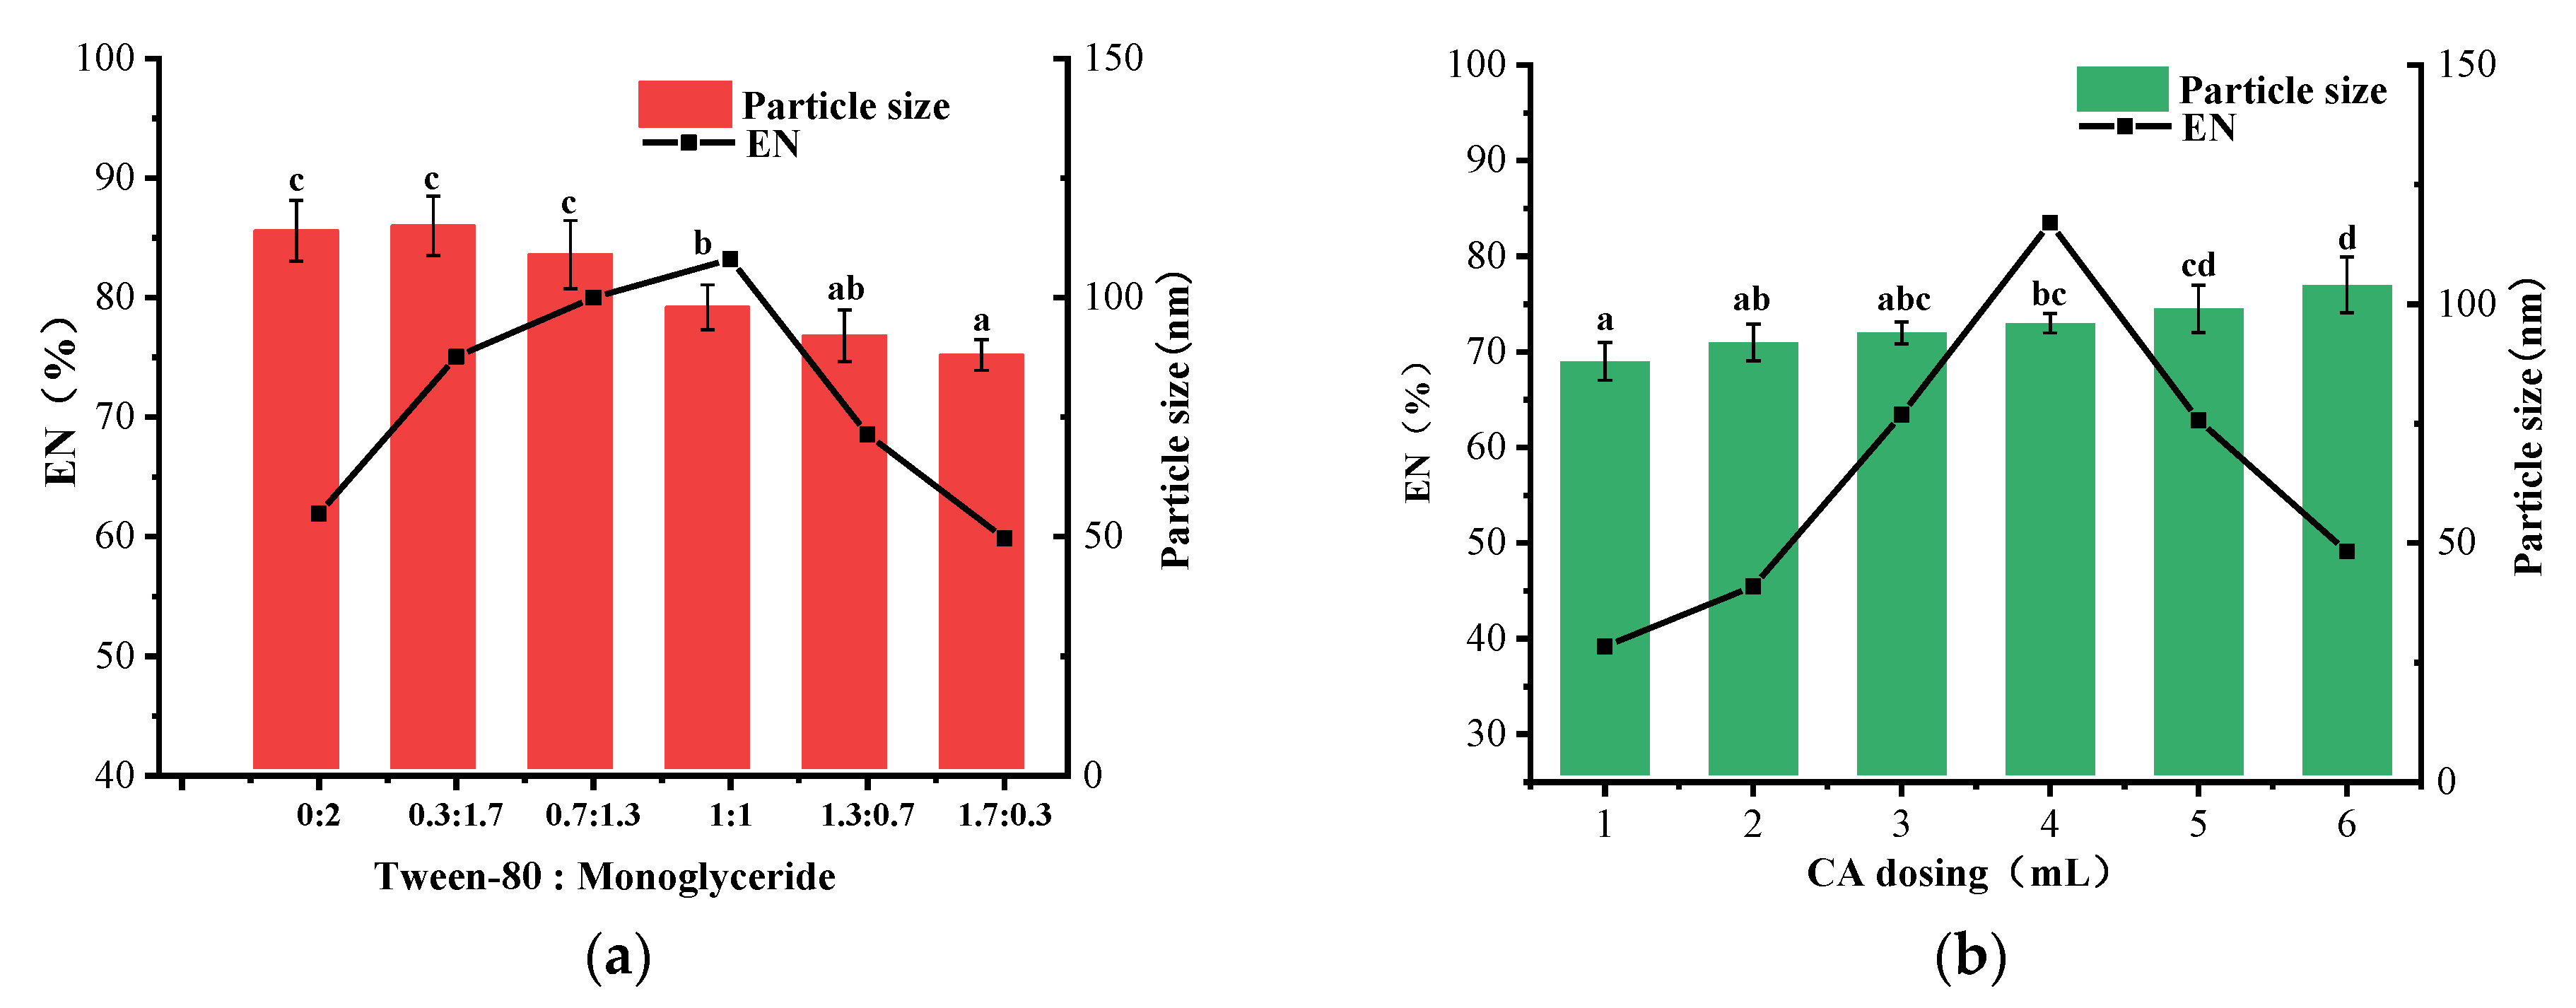
2.3.2. Process and Prescription Optimization
2.3.3. Particle Size Distribution
2.3.4. Zeta-Potential
2.3.5. Polydispersity
2.3.6. Absorption Spectra
2.3.7. Encapsulation Percentage
2.3.8. Nanoparticle Morphology
2.3.9. Differential Scanning Calorimetry
2.3.10. Fourier Transform Infrared Spectroscopy (FT-IR)
2.3.11. Retardation and Retention
2.3.12. Stability
- (1)
- Changes in the appearance of SLN-CA before and after 6 d storage
- (2)
- Changes in particle size of SLN-CA before and after storage for 6 d
- (3)
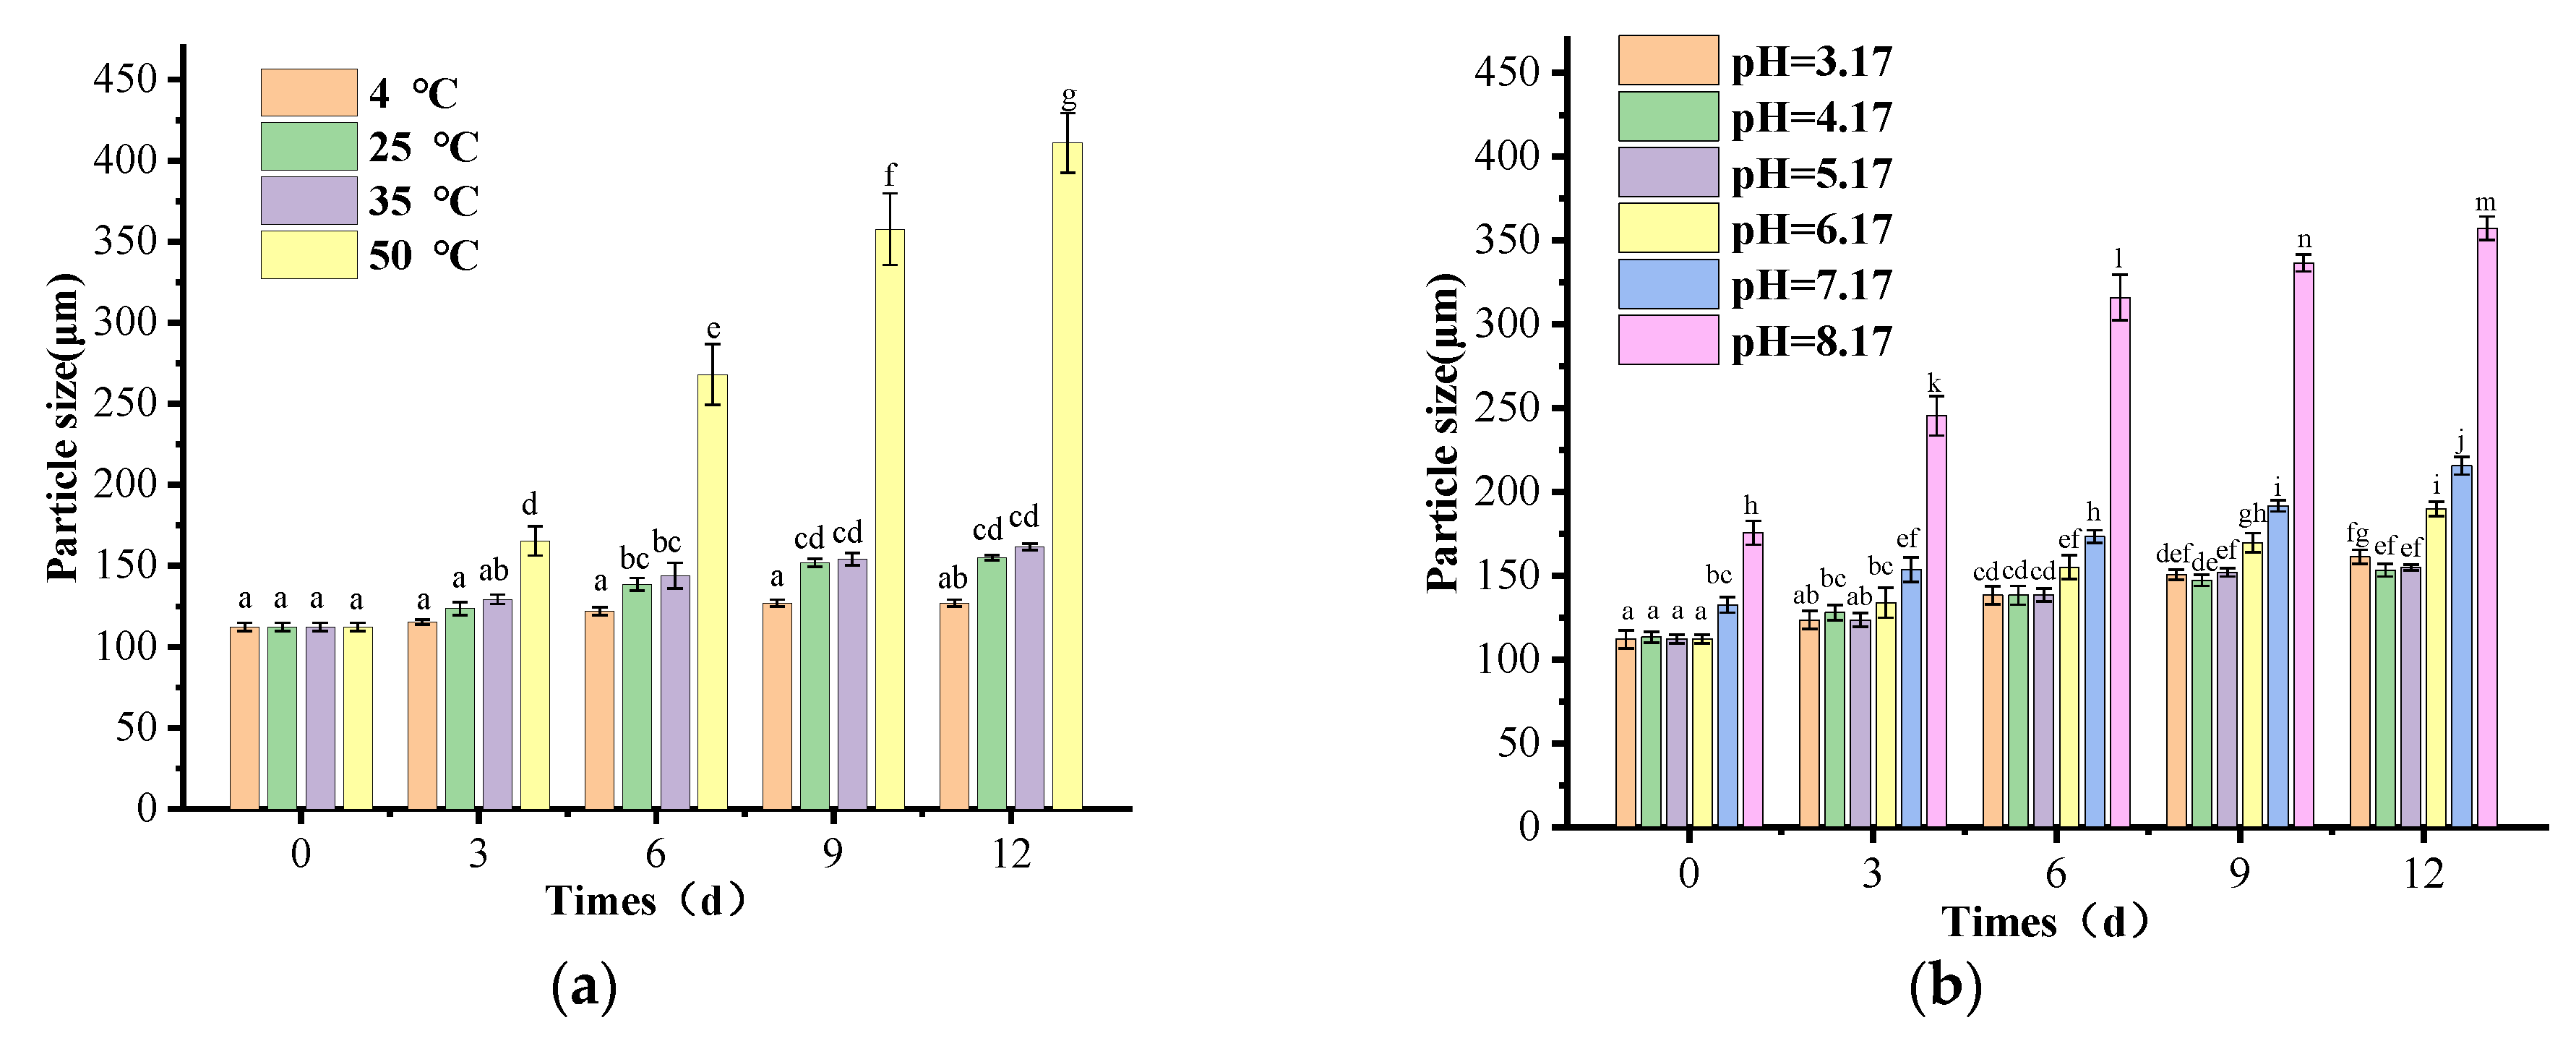
- Effect of different pH values on the particle size of SLN-CA
- (4)
- Effect of different pH values on the particle size of SLN-CA in storage for 6 days
- (5)
- Effect of different temperatures on the particle size of SLN-CA stored for 6 days
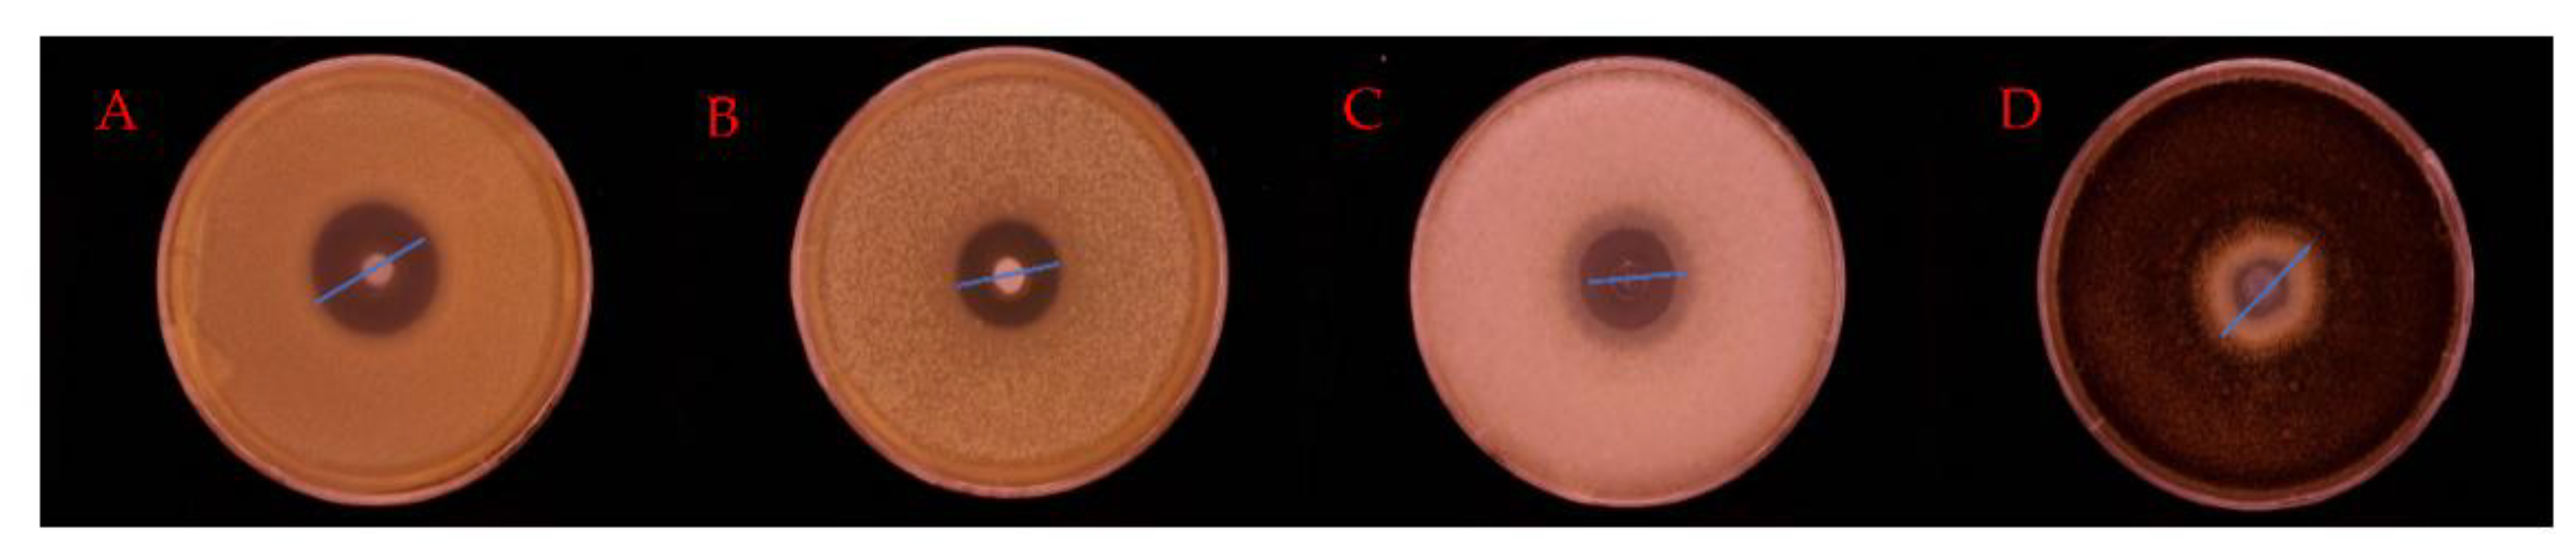
2.4. Inhibition of Bacteria and Fungi
- (1)
- The diameter of the inhibition circle size is ≥20 mm. The inhibition effect is susceptible.
- (2)
- The diameter of the inhibition circle size in the middle of 12–20 mm inhibition for moderate sensitivity.
- (3)
- The diameter of the inhibition circle size of ≤12 mm inhibition for low sensitivity.
3. Results and Discussion
3.1. Preparation and Characterization of SLN-CA
3.1.1. Preparation of SLN-CA
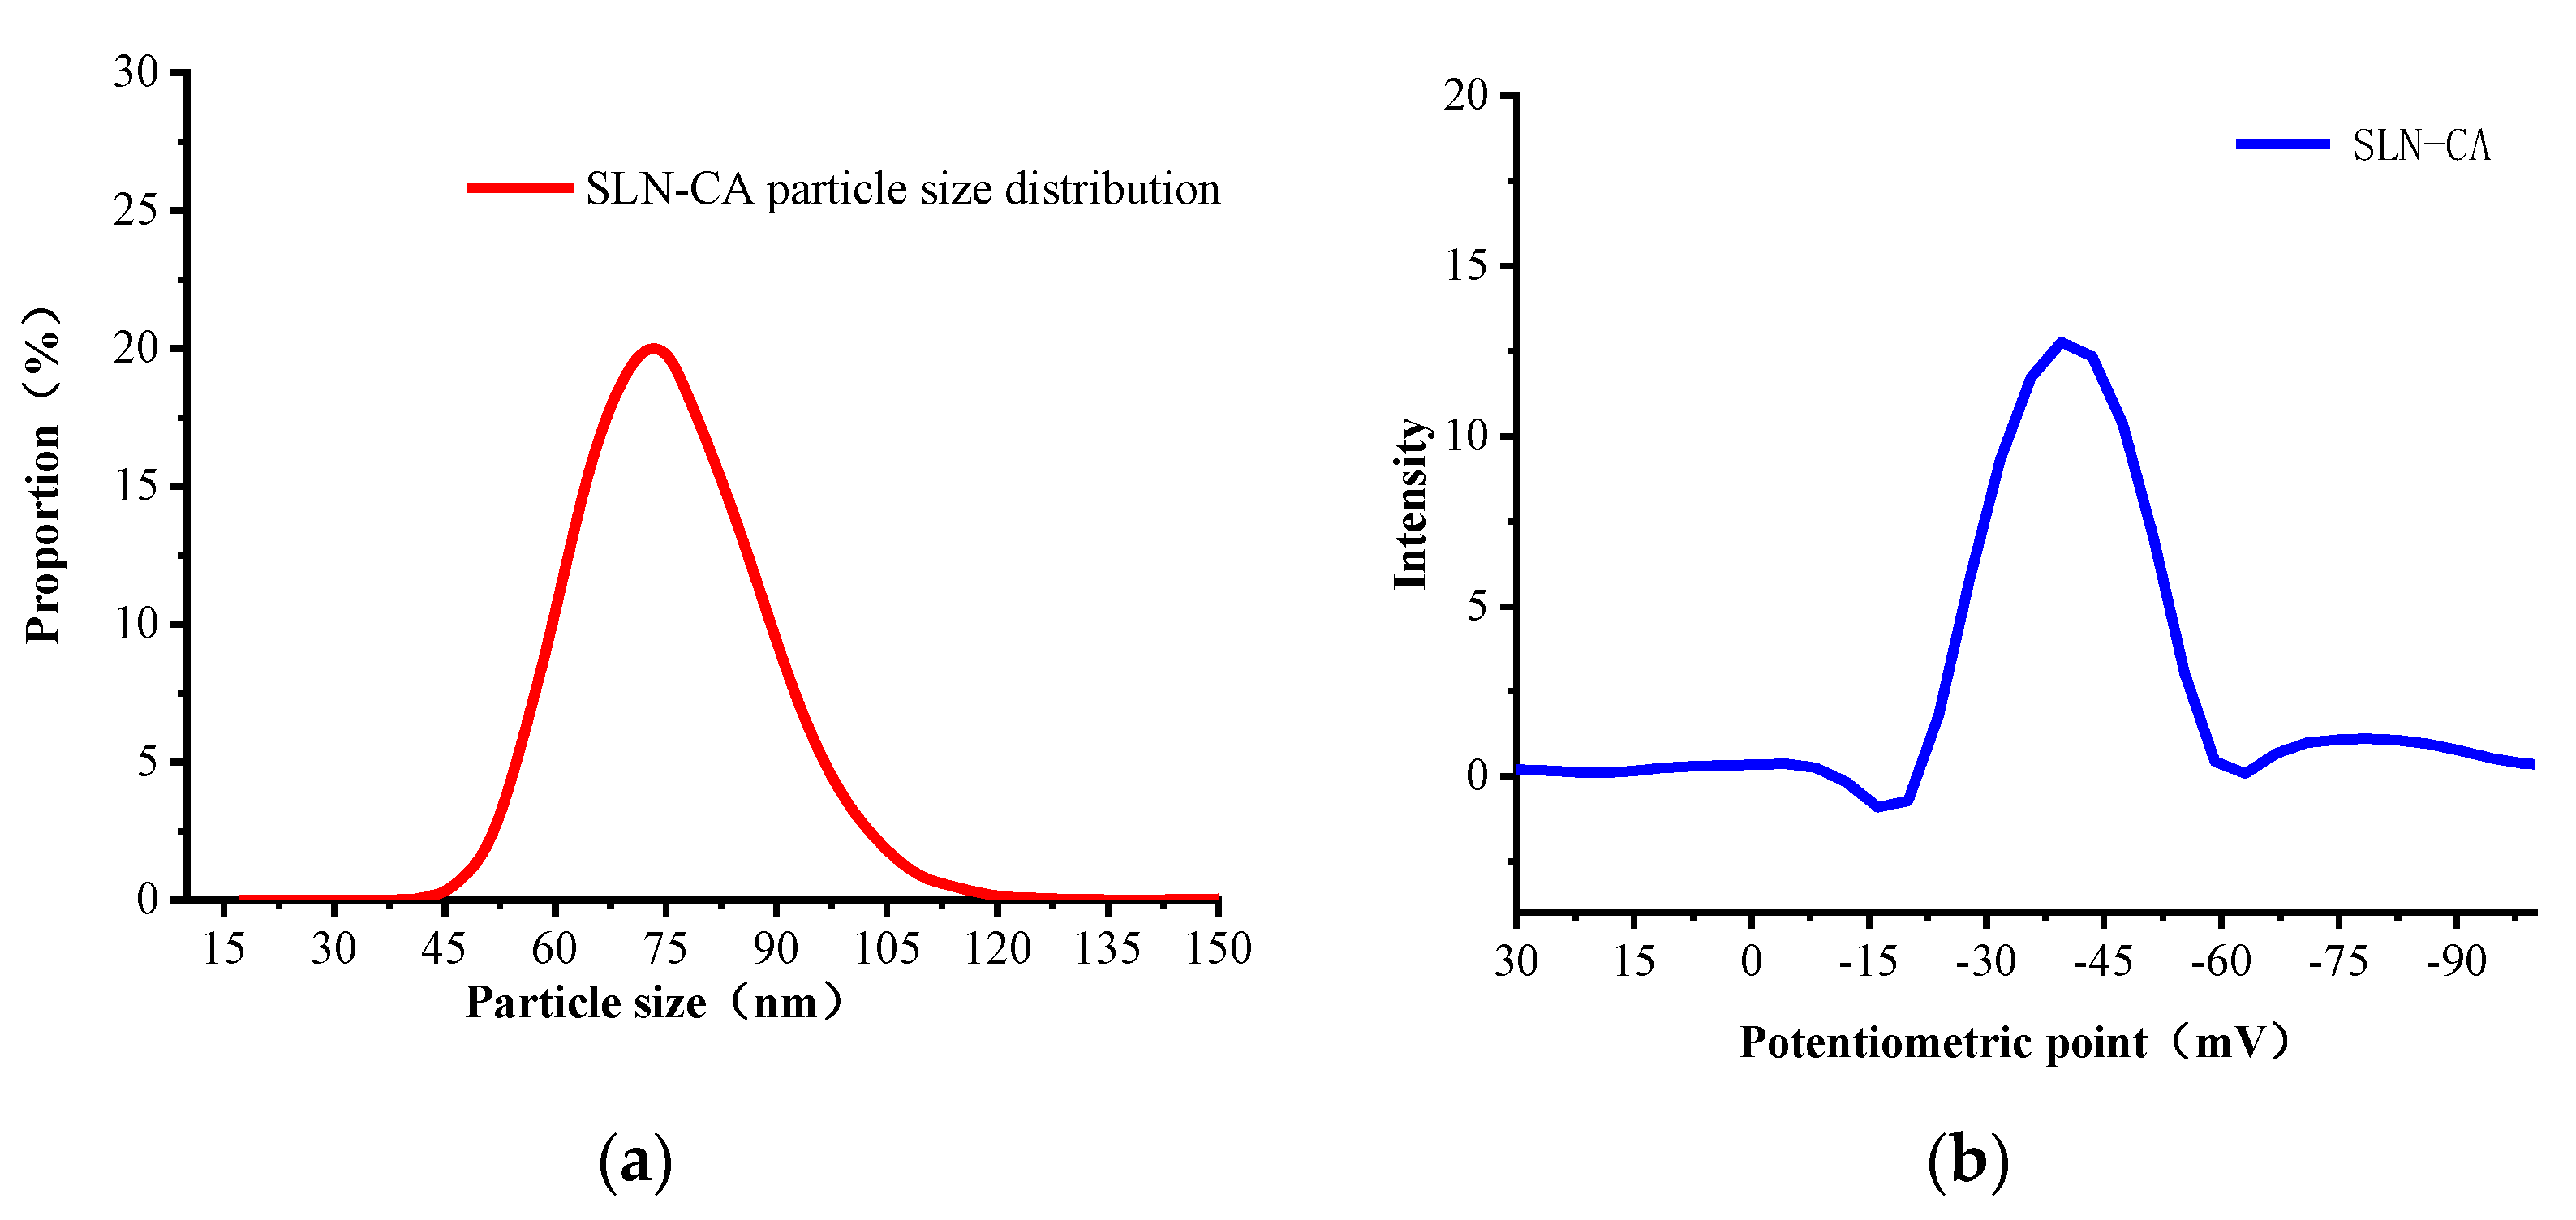
3.1.2. Particle Size, Zeta-Potential and Polydispersity Coefficient
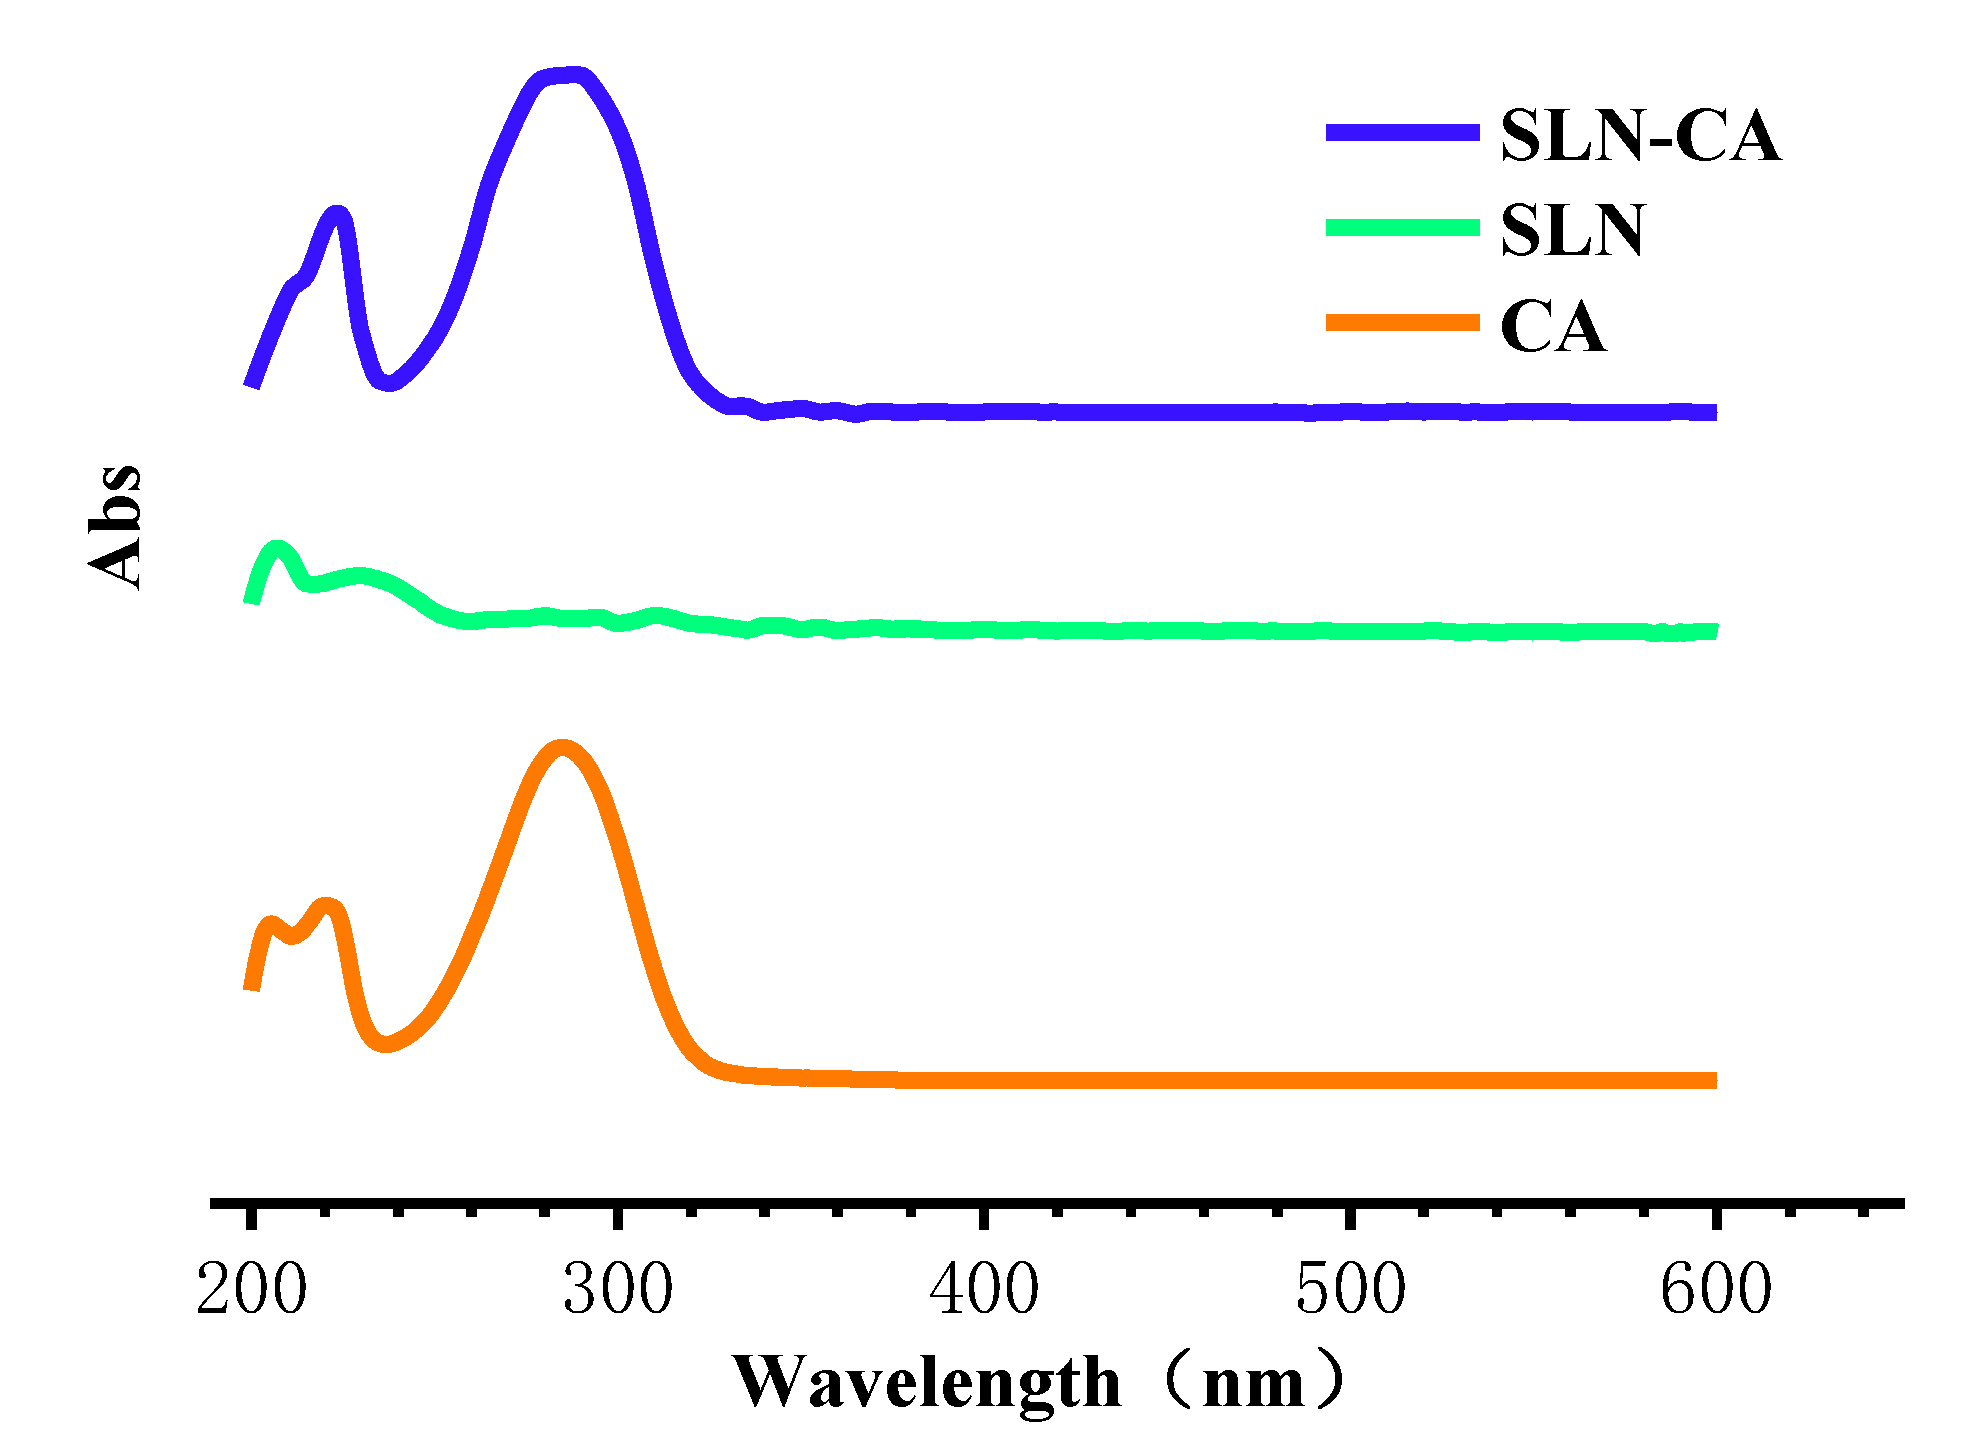
3.1.3. UV Absorption Spectrum
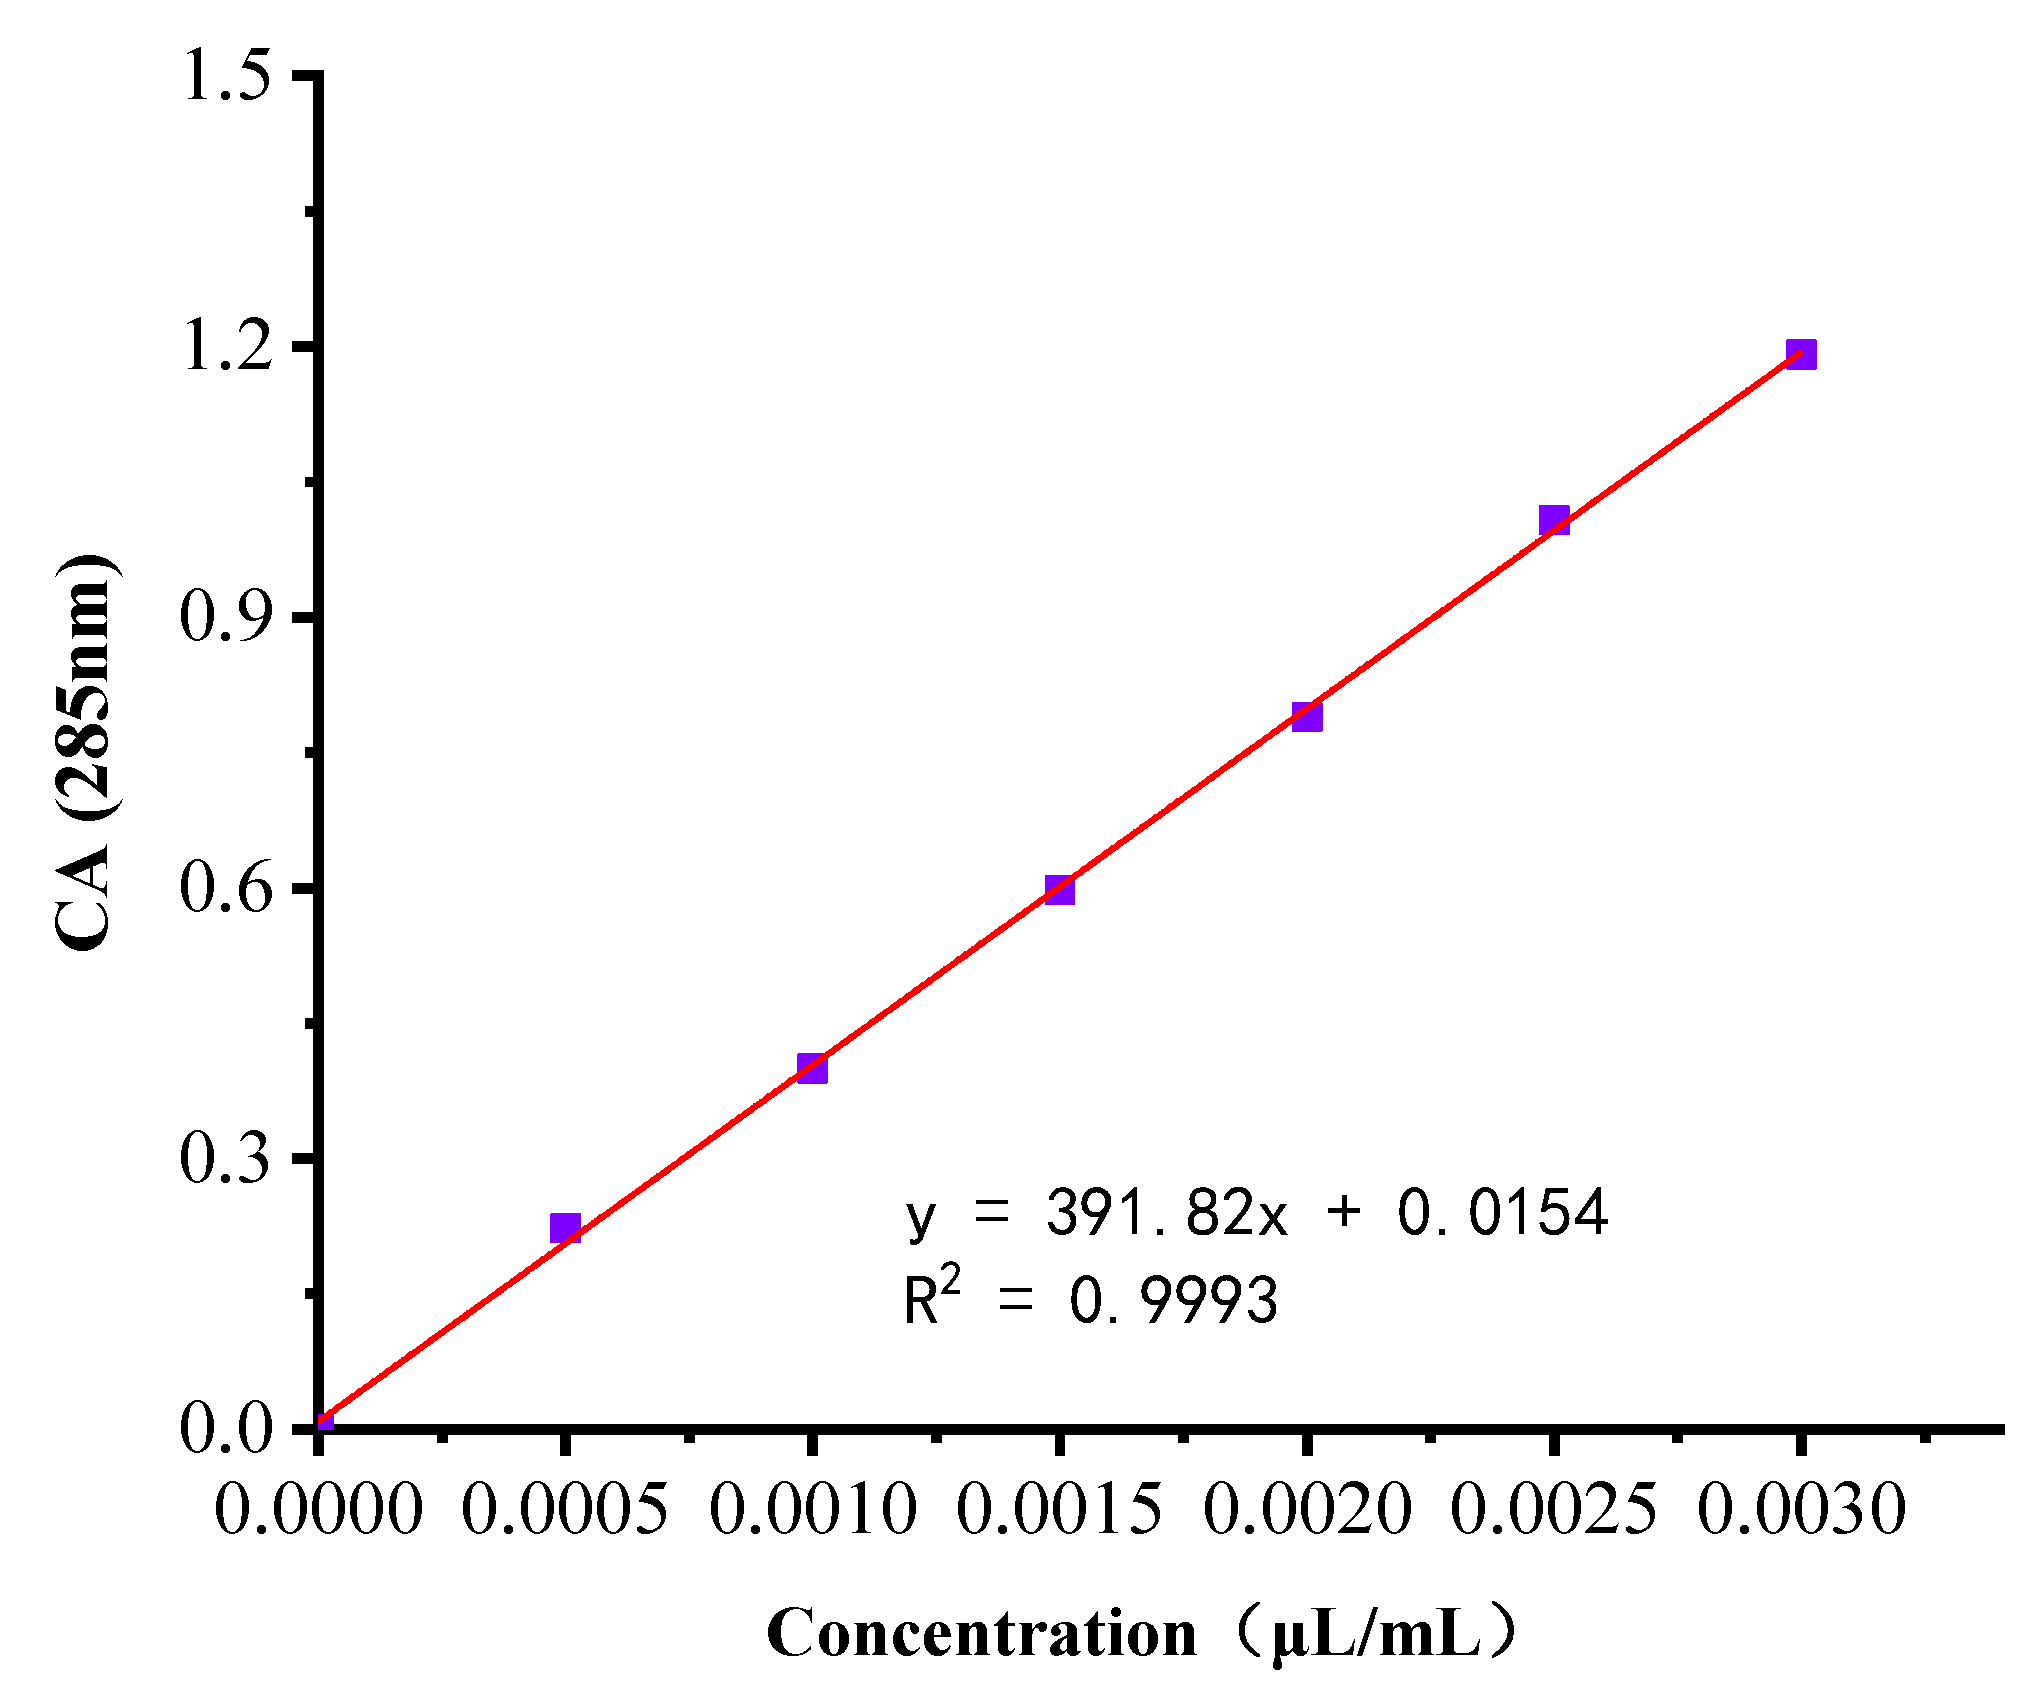
3.1.4. Standard Curves
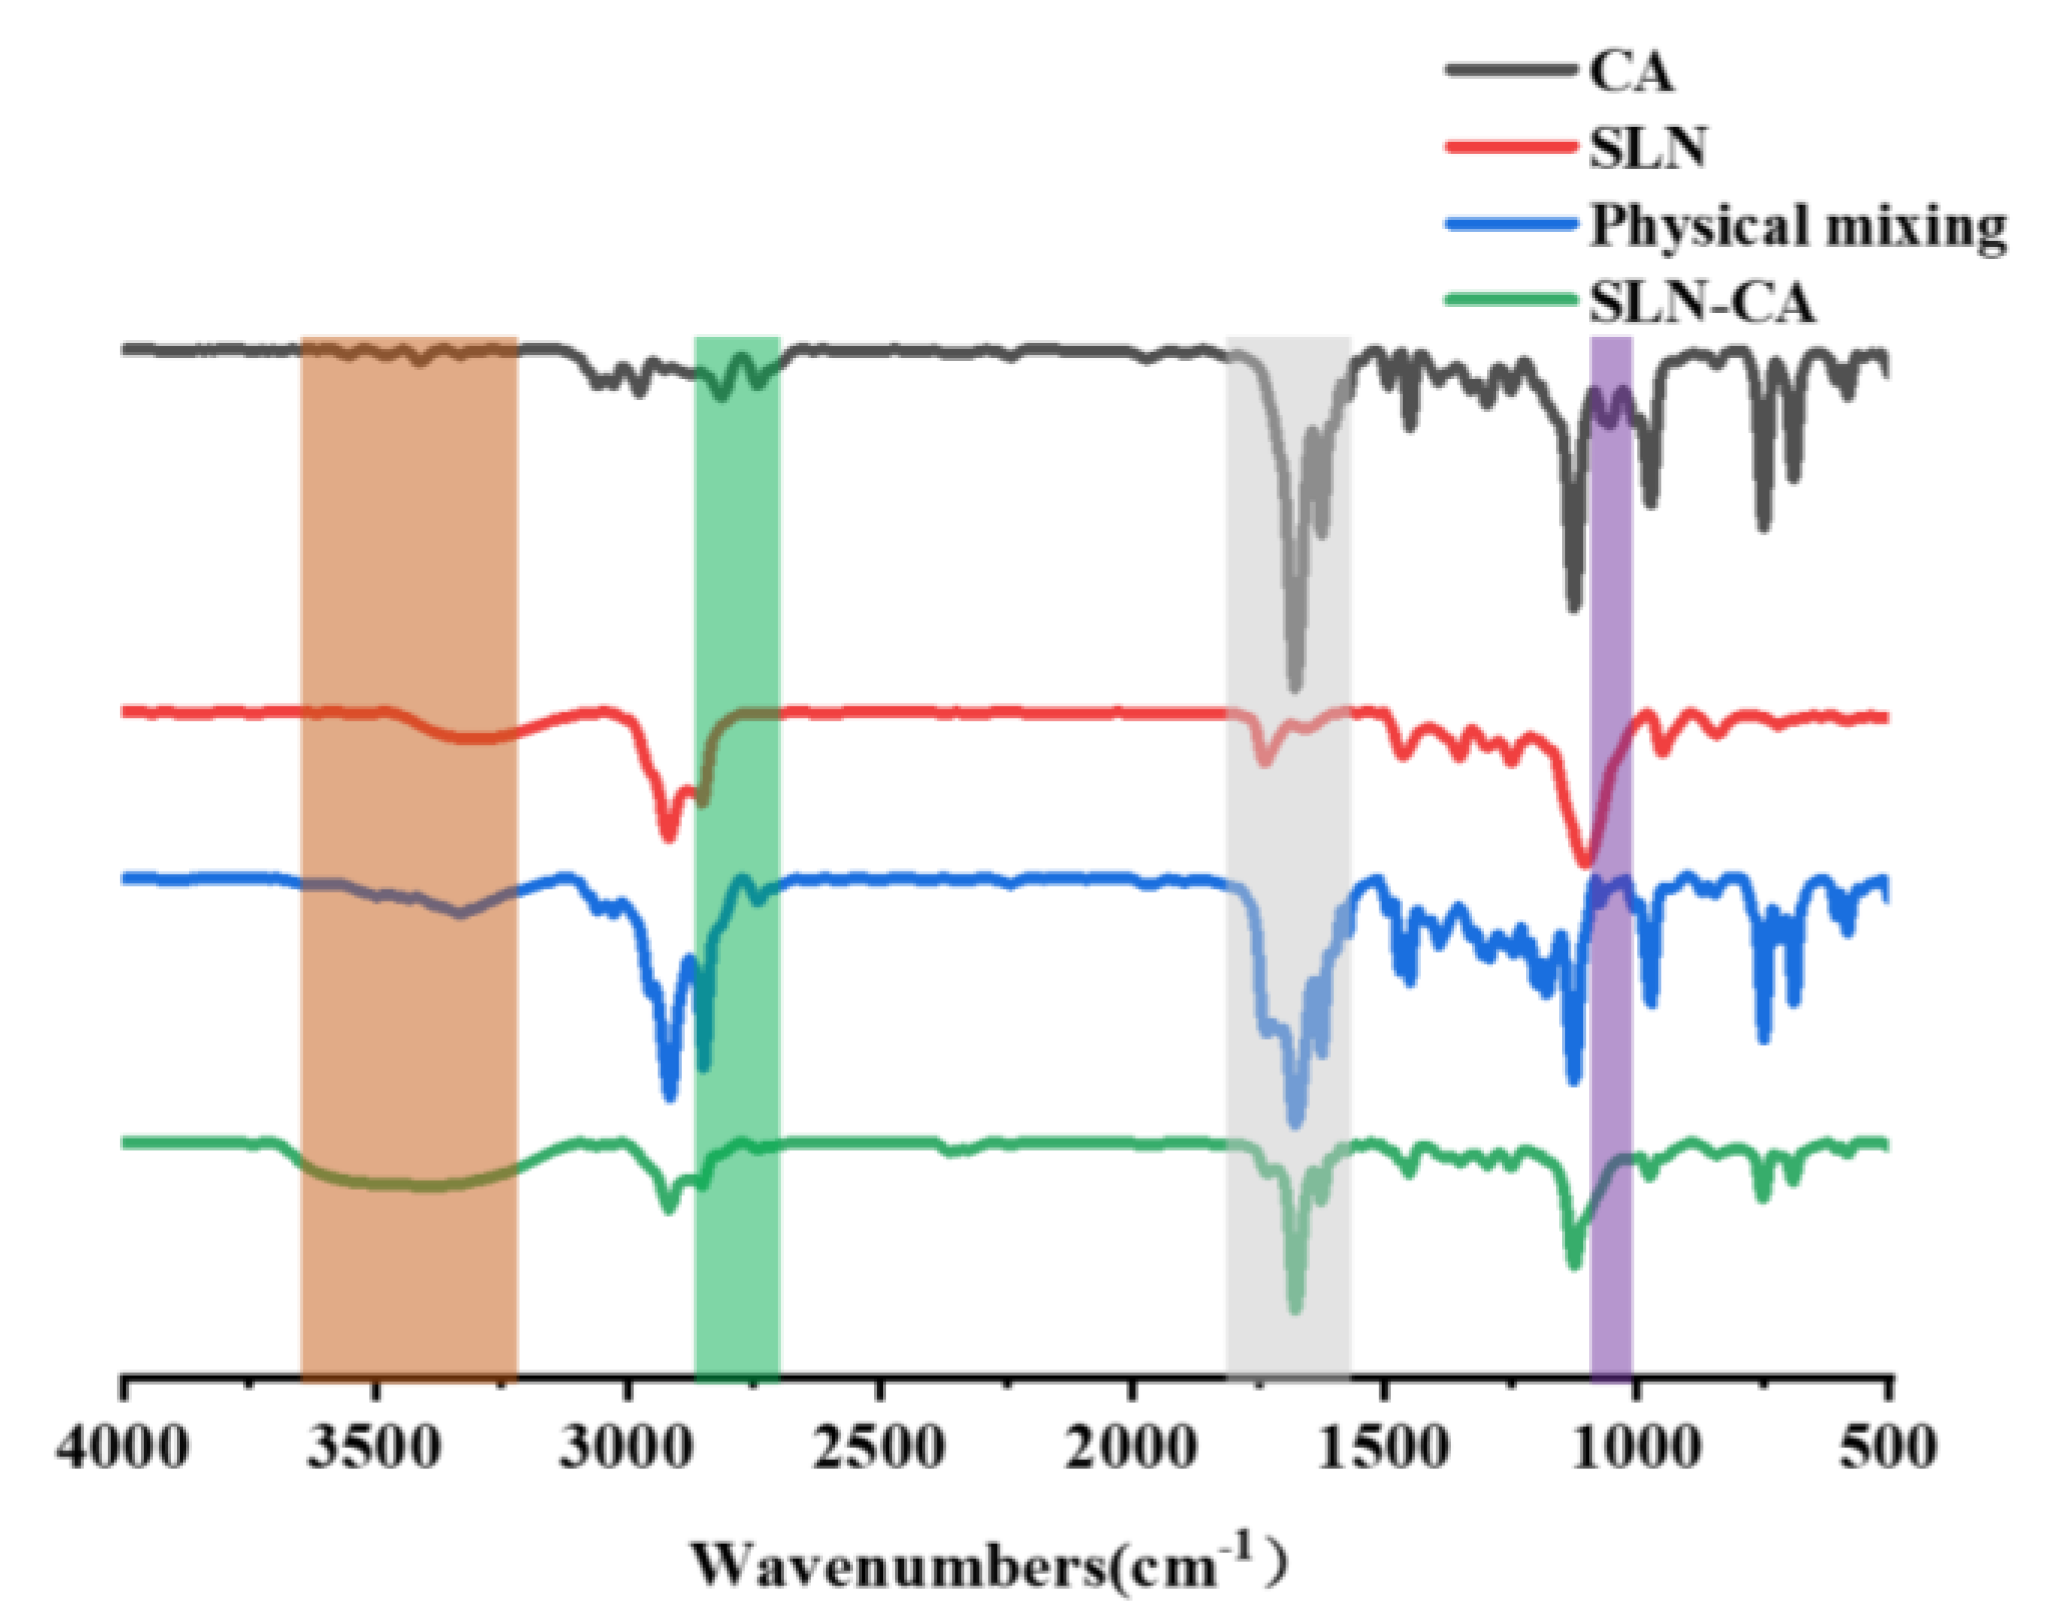
3.1.5. FT-IR
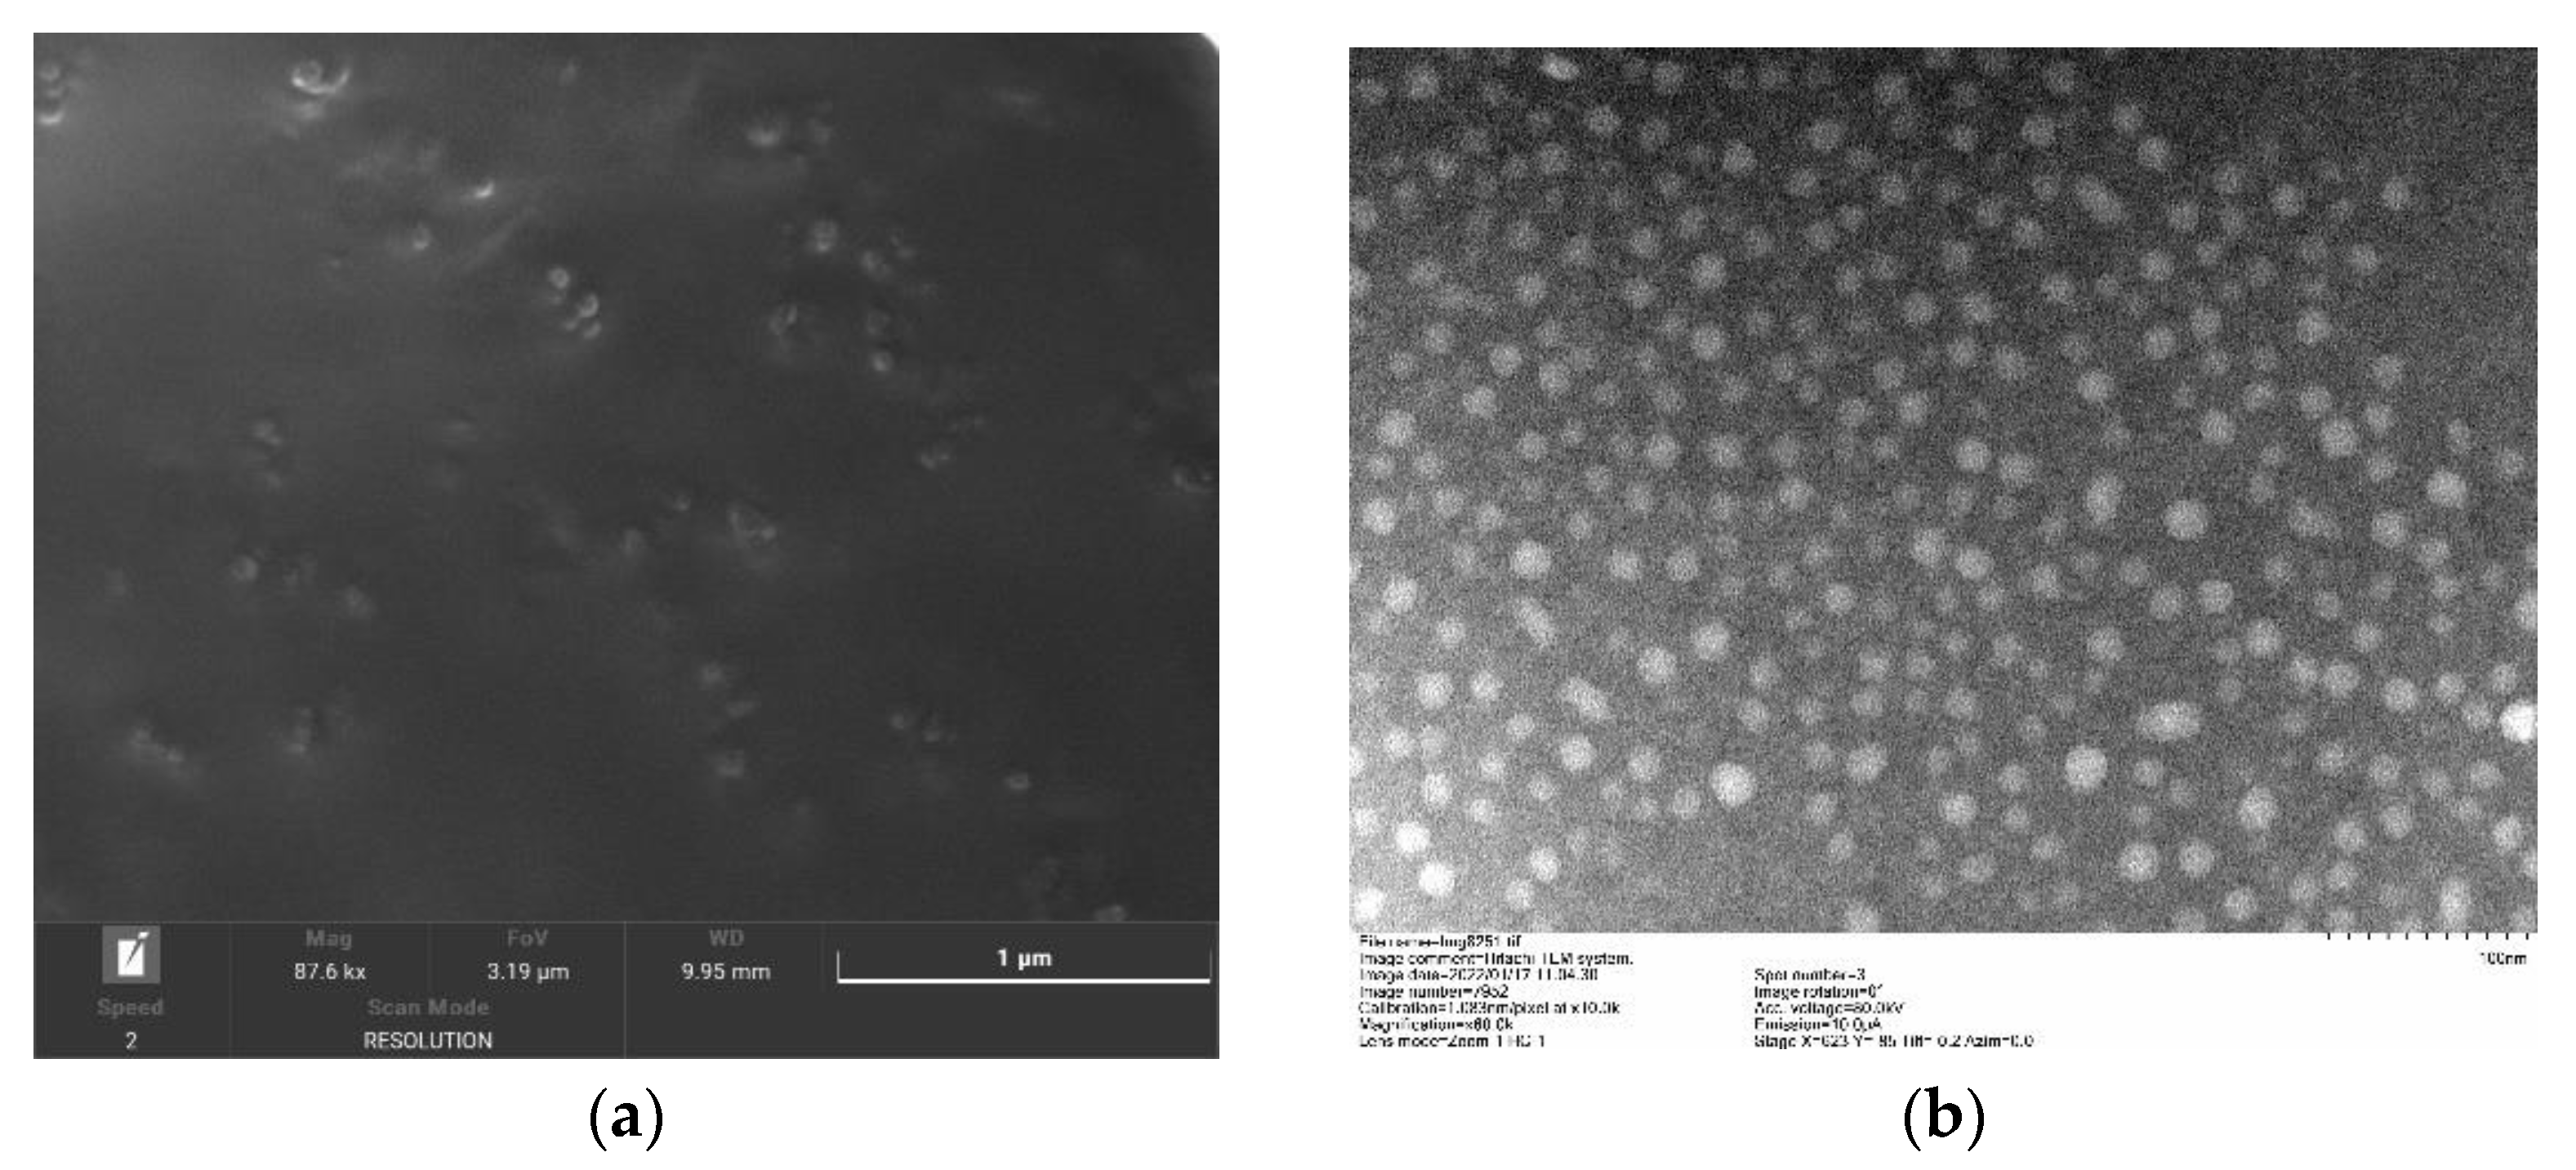
3.1.6. SEM and TEM
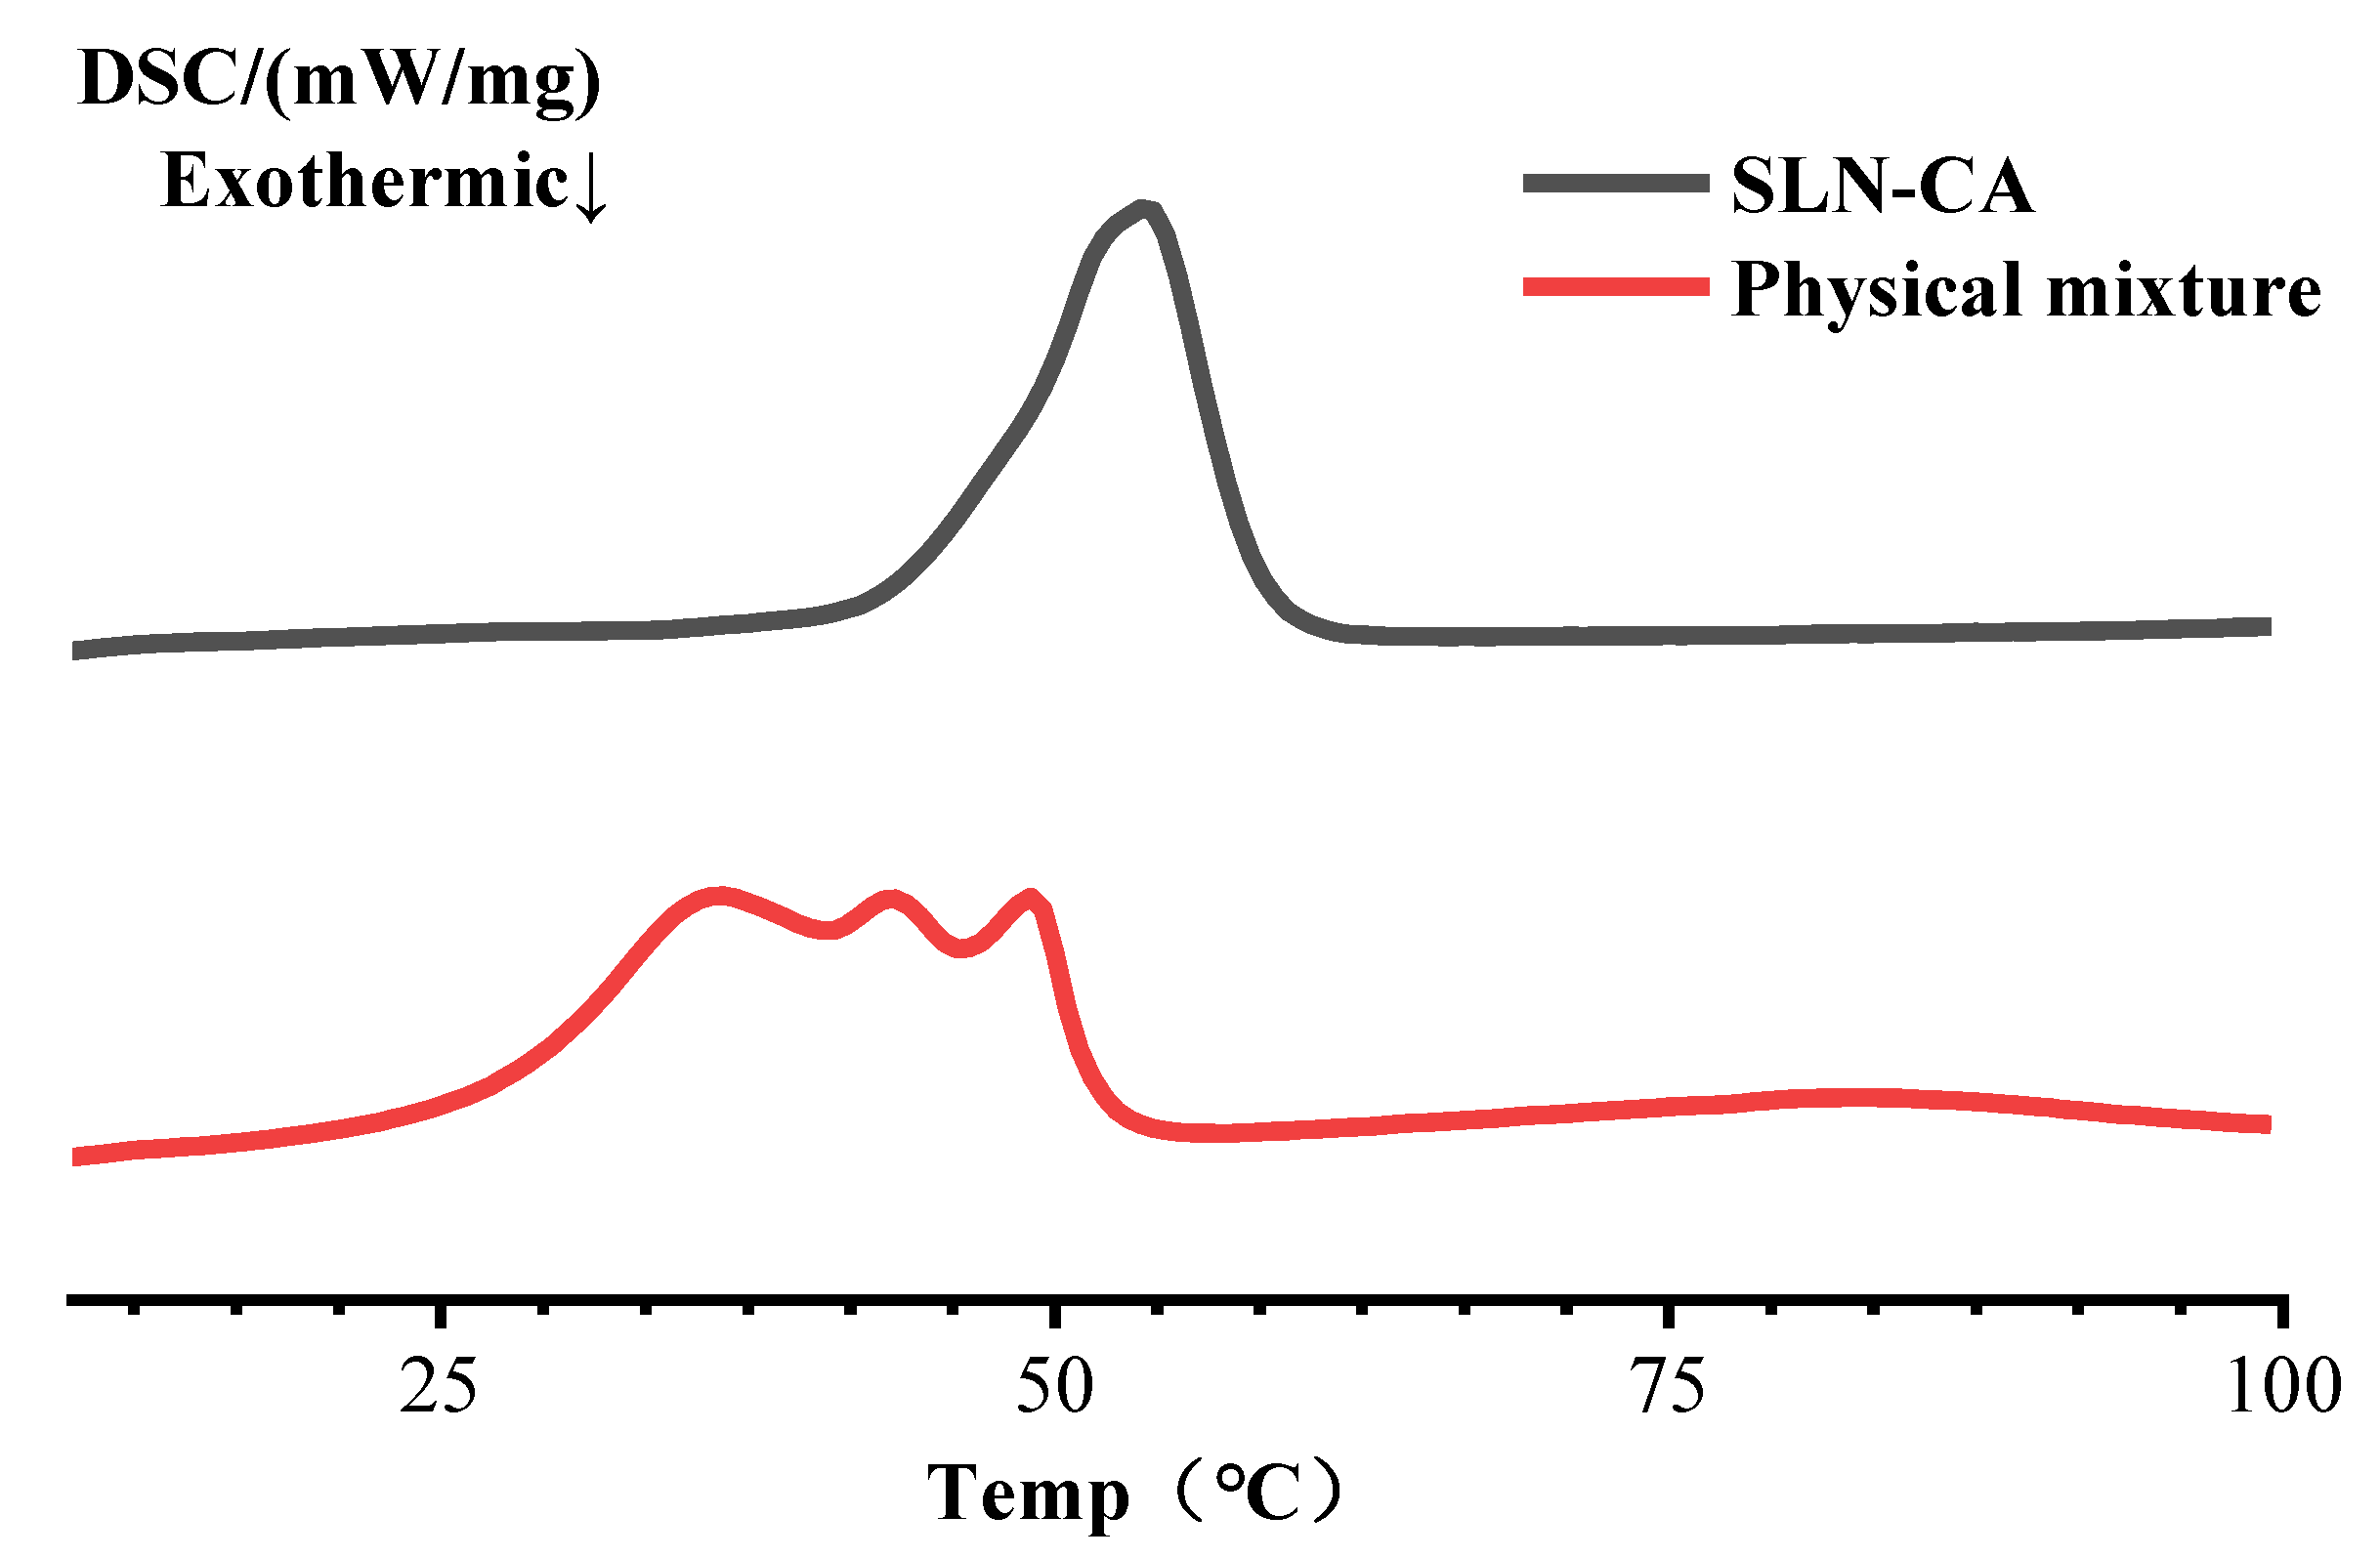
3.1.7. Differential Scanning Calorimetry
3.1.8. Encapsulation Percentage
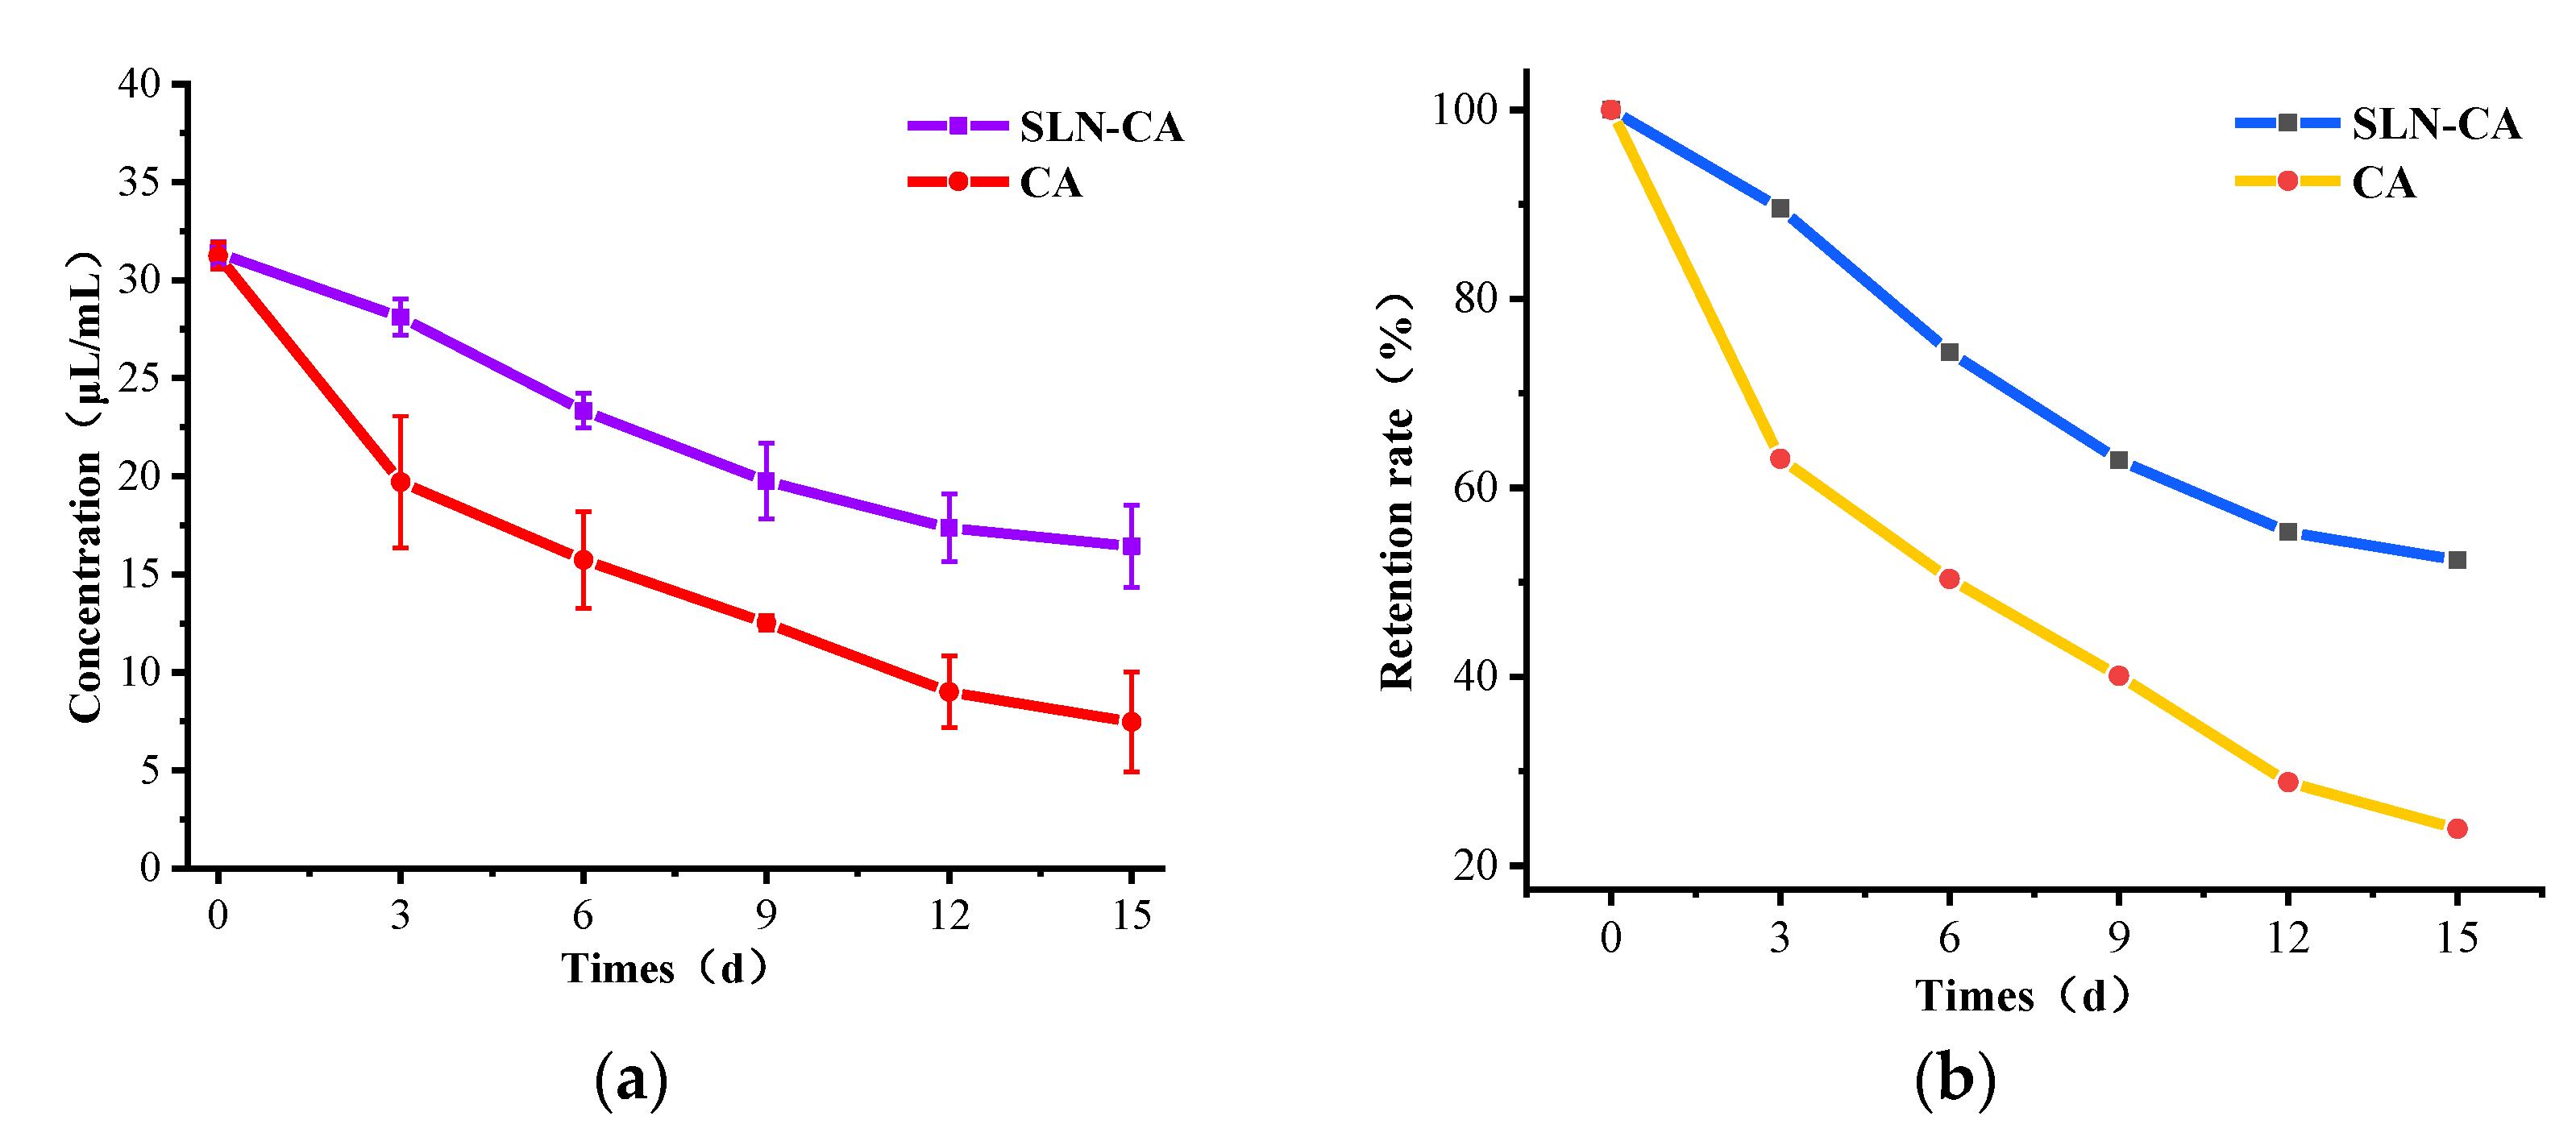
3.1.9. Determination of Slow Release and Retention
3.1.10. Stability
3.2. Inhibition of Bacteria and Fungi
4. Conclusions
Author Contributions
Funding
Data Availability Statement
Acknowledgments
Conflicts of Interest
References
- Azevedo, A.G.; Barros, C.; Miranda, S.; Machado, A.V.; Castro, O.; Silva, B.; Saraiva, M.; Silva, A.S.; Pastrana, L.M.; Carneiro, O.S.; et al. Active Flexible Films for Food Packaging: A Review. Polymers 2022, 14, 2442. [Google Scholar] [CrossRef] [PubMed]
- Wang, P.; Ma, L.; Jin, J.; Zheng, M.; Pan, L.; Zhao, Y.; Sun, X.; Liu, Y.; Xing, F. The anti-aflatoxigenic mechanism of cinnamaldehyde in Aspergillus flavus. Sci. Rep. 2019, 9, 10499. [Google Scholar] [CrossRef] [PubMed] [Green Version]
- Deng, J.-h.; Wang, G.-s.; Li, J.; Zhao, Y.-l.; Wang, X. Effects of Cinnamaldehyde on the Cell Wall of A. fumigatus and Its Application in Treating Mice with Invasive Pulmonary Aspergillosis. Evid.-Based Complement. Altern. Med. Ecam 2018, 2018, 5823209. [Google Scholar] [CrossRef] [Green Version]
- Okamoto, K.; Narayama, S.; Katsuo, A.; Shigematsu, I.; Yanase, H. Biosynthesis of p-anisaldehyde by the white-rot basidiomycete Pleurotus ostreatus. J. Biosci. Bioeng. 2002, 93, 207–210. [Google Scholar] [CrossRef] [PubMed]
- Bedoya-Serna, C.M.; Dacanal, G.C.; Fernandes, A.M.; Pinho, S.C. Antifungal activity of nanoemulsions encapsulating oregano (Origanum vulgare) essential oil: In vitro study and application in Minas Padrão cheese. Braz. J. Microbiol. 2018, 49, 929–935. [Google Scholar] [CrossRef]
- Shi, F.; Zhao, J.; Liu, Y.Y.; Wang, Z.; Zhang, Y.; Feng, N. Preparation and characterization of solid lipid nanoparticles loaded with frankincense and myrrh oil. Int. J. Nanomed. 2012, 7, 2033–2043. [Google Scholar]
- Maryam, K.; Shakeri, S.; Kiani, K. Preparation and in vitro investigation of antigastric cancer activities of carvacrol-loaded human serum albumin nanoparticles. IET Nanobiotechnol. 2015, 9, 294–299. [Google Scholar] [CrossRef]
- Osanlou, R.; Emtyazjoo, M.; Banaei, A.; Hesarinejad, M.A.; Ashrafi, F. Preparation of solid lipid nanoparticles and nanostructured lipid carriers containing zeaxanthin and evaluation of physicochemical properties. Colloids Surf. A Physicochem. Eng. Asp. 2022, 641, 128588. [Google Scholar] [CrossRef]
- Jinsong, Y. Preparation and Physicochemical Properties of Solid Lipid Nanoparticles Containing Praziquantel; China Pharmacy: Nanjing, China, 2007. [Google Scholar]
- Lin, Y.; Huang, R.; Sun, X.; Yu, X.; Xiao, Y.; Wang, L.; Hu, W.; Zhong, T. The p-Anisaldehyde/β-cyclodextrin inclusion complexes as fumigation agent for control of postharvest decay and quality of strawberry. Food Control 2021, 130, 108346. [Google Scholar] [CrossRef]
- Varshosaz, J.; Minayian, M.; Moazen, E. Enhancement of oral bioavailability of pentoxifylline by solid lipid nanoparticles. J. Liposome Res. 2010, 20, 115–123. [Google Scholar] [CrossRef]
- Nsairat, H.; Khater, D.; Odeh, F.; Al-Adaileh, F.; Al-Taher, S.A.; Jaber, A.M.; Alshaer, W.; Al Bawab, A.; Mubarak, M.S. Lipid nanostructures for targeting brain cancer. Heliyon 2021, 7, e07994. [Google Scholar] [CrossRef] [PubMed]
- Li, J.; Qin, Q.; Zha, S.; Zhao, Q.; Li, H.; Liu, L.; Hou, S.-B.; Zhao, B. Green Extraction of Forsythoside A, Phillyrin and Phillygenol from Forsythia suspensa Leaves Using a β-Cyclodextrin-Assisted Method. Molecules 2022, 27, 7055. [Google Scholar] [CrossRef] [PubMed]
- Misra, S.; Chopra, K.; Sinha, V.R.; Medhi, B. Galantamine-loaded solid–lipid nanoparticles for enhanced brain delivery: Preparation, characterization, in vitro and in vivo evaluations. Drug Deliv. 2016, 23, 1434–1443. [Google Scholar] [CrossRef] [PubMed] [Green Version]
- Margari, A.; Monteduro, A.G.; Rizzato, S.; Capobianco, L.; Crestini, A.; Rivabene, R.; Piscopo, P.; D’Onofrio, M.; Manzini, V.; Trapani, G.D.; et al. The Encapsulation of Citicoline within Solid Lipid Nanoparticles Enhances Its Capability to Counteract the 6-Hydroxydopamine-Induced Cytotoxicity in Human Neuroblastoma SH-SY5Y Cells. Pharmaceutics 2022, 14, 1827. [Google Scholar] [CrossRef] [PubMed]
- Abdollahzadeh, E.; Rezaei, M.; Hosseini, H. Antibacterial activity of plant essential oils and extracts: The role of thyme essential oil, nisin, and their combination to control Listeria monocytogenes inoculated in minced fish meat. Food Control 2014, 35, 177–183. [Google Scholar] [CrossRef]
- Joanna, C.; Marcin, L.; Ewa, K.; Grażyna, P. A nonspecific synergistic effect of biogenic silver nanoparticles and biosurfactant towards environmental bacteria and fungi. Ecotoxicology 2018, 27, 352–359. [Google Scholar] [CrossRef] [Green Version]
- El-Gendy, M.M.A.A.; Al-Zahrani, H.A.A.; El-Bondkly, A.M. Genome Shuffling of Mangrove Endophytic Aspergillus luchuensis MERV10 for Improving the Cholesterol-Lowering Agent Lovastatin under Solid State Fermentation. Mycobiology 2016, 44, 171–179. [Google Scholar] [CrossRef] [Green Version]
- Abd El-Hack, M.E.; Alagawany, M.; Abdel-Moneim, A.-M.E.; Mohammed, N.G.; Khafaga, A.F.; Bin-Jumah, M.N.; Othman, S.I.; Allam, A.A.; Elnesr, S.S. Cinnamon (Cinnamomum zeylanicum) Oil as a Potential Alternative to Antibiotics in Poultry. Antibiotics 2020, 9, 210. [Google Scholar] [CrossRef]
- Kampa, J.; Frazier, R.A.; Rodriguez-Garcia, J. Physical and Chemical Characterisation of Conventional and Nano/Emulsions: Influence of Vegetable Oils from Different Origins. Foods 2022, 11, 681. [Google Scholar] [CrossRef]
- Ben-Khalifa, R.; Gaspar, F.B.; Pereira, C.; Chekir-Ghedira, L.; Rodríguez-Rojo, S. Essential Oil and Hydrophilic Antibiotic Co-Encapsulation in Multiple Lipid Nanoparticles: Proof of Concept and In Vitro Activity against Pseudomonas aeruginosa. Antibiotics 2021, 10, 1300. [Google Scholar] [CrossRef]
- Omwoyo, W.; Melariri, P.; Gathirwa, J.; Oloo, F.A.; Mahanga, G.M.; Kalombo, L.; Ogutu, B.; Swai, H.S. Development, characterization and antimalarial efficacy of dihydroartemisinin loaded solid lipid nanoparticles. Nanomed. Nanotechnol. Biol. Med. 2016, 12, 801–809. [Google Scholar] [CrossRef] [PubMed]
- Zimmermann, E.; Müller, R.H. Electrolyte- and pH-stabilities of aqueous solid lipid nanoparticle (SLN) dispersions in artificial gastrointestinal media. Eur. J. Pharm. Biopharm. 2001, 52, 203–210. [Google Scholar] [CrossRef]
- Freitas, C.; Müller, R.H. Correlation between long-term stability of solid lipid nanoparticles (SLN) and crystallinity of the lipid phase. Eur. J. Pharm. Biopharm. 1999, 47, 125–132. [Google Scholar] [CrossRef] [PubMed]
- Napolitano, J.G.; Gödecke, T.; Rodríguez-Brasco, M.F.; Jaki, B.U.; Chen, S.-N.; Lankin, D.C.; Pauli, G.F. The tandem of full spin analysis and qHNMR for the quality control of botanicals exemplified with Ginkgo biloba. J. Nat. Prod. 2012, 75, 238–248. [Google Scholar] [CrossRef] [PubMed] [Green Version]
- Khurana, R.K.; Bansal, A.K.; Beg, S.; Burrow, A.J.; Katare, O.P.; Singh, K.K.; Singh, B. Enhancing biopharmaceutical attributes of phospholipid complex-loaded nanostructured lipidic carriers of mangiferin: Systematic development, characterization and evaluation. Int. J. Pharm. 2017, 518, 289–306. [Google Scholar] [CrossRef] [PubMed]
- Sapino, S.; Peira, E.; Chirio, D.; Chindamo, G.; Guglielmo, S.; Oliaro-Bosso, S.; Barbero, R.; Vercelli, C.; Re, G.; Brunella, V.; et al. Thermosensitive Nanocomposite Hydrogels for Intravitreal Delivery of Cefuroxime. Nanomaterials 2019, 9, 1461. [Google Scholar] [CrossRef] [Green Version]
- Siekmann, B.; Westesen, K. Thermoanalysis of the recrystallization process of melt-homogenized glyceride nanoparticles. Colloids Surf. B Biointerfaces 1994, 3, 159–175. [Google Scholar] [CrossRef]
- Zimmermann, E.; Souto, E.B.; Müller, R.H. Physicochemical investigations on the structure of drug-free and drug-loaded solid lipid nanoparticles (SLN) by means of DSC and 1H NMR. Die Pharm. 2005, 60, 508–513. [Google Scholar]
- Mohammadi-Samani, S.; Yousefi, G.; Mohammadi, F.; Ahmadi, F. Meloxicam transdermal delivery: Effect of eutectic point on the rate and extent of skin permeation. Iran. J. Basic Med. Sci. 2014, 17, 112–118. [Google Scholar]
- Das, S.; Chaudhury, A. Recent Advances in Lipid Nanoparticle Formulations with Solid Matrix for Oral Drug Delivery. AAPS PharmSciTech 2010, 12, 62–76. [Google Scholar] [CrossRef] [Green Version]
- Gupta, T.; Singh, J.; Kaur, S.; Sandhu, S.K.; Singh, G.; Kaur, I.P. Enhancing Bioavailability and Stability of Curcumin Using Solid Lipid Nanoparticles (CLEN): A Covenant for Its Effectiveness. Front. Bioeng. Biotechnol. 2020, 8, 879. [Google Scholar] [CrossRef] [PubMed]
- Mijaljica, D.; Spada, F.; Harrison, I.P. Skin Cleansing without or with Compromise: Soaps and Syndets. Molecules 2022, 27, 2010. [Google Scholar] [CrossRef] [PubMed]
- Zhang, Y.; Zhao, Q.; Su, S.-c.; Dan, L.; Li, X.; Wang, Y.; Lin, Y.; Tian, Z.; Sun, C.; Lu, H. Comparative analysis of circRNA expression profile and circRNA-miRNA-mRNA regulatory network between palmitic and stearic acid-induced lipotoxicity to pancreatic β cells. Bioengineered 2021, 12, 9031–9045. [Google Scholar] [CrossRef] [PubMed]
- Shreaz, S.; Wani, W.A.; Behbehani, J.M.; Raja, V.; Irshad, M.; Karched, M.; Ali, I.; Siddiqi, W.A.; Hun, L.T. Cinnamaldehyde and its derivatives, a novel class of antifungal agents. Fitoterapia 2016, 112, 116–131. [Google Scholar] [CrossRef]


| Particle Size (nm) | Zeta-Potential (mV) | PDI | |
|---|---|---|---|
| SLN-CA | 74 ± 5 | −44.36 ± 2.2 | 0.153 ± 0.032 |
| Strain | S. aureus | E. coli | Rhizopus | Aspergillus niger |
|---|---|---|---|---|
| Diameter of inhibition circle (mm) | 23.10 ± 1.22 | 21.48 ± 0.85 | 20.66 ± 3.37 | 18.63 ± 2.45 |
Publisher’s Note: MDPI stays neutral with regard to jurisdictional claims in published maps and institutional affiliations. |
© 2022 by the authors. Licensee MDPI, Basel, Switzerland. This article is an open access article distributed under the terms and conditions of the Creative Commons Attribution (CC BY) license (https://creativecommons.org/licenses/by/4.0/).
Share and Cite
Chen, J.; Li, S.; Zheng, Q.; Feng, X.; Tan, W.; Feng, K.; Liu, Y.; Hu, W. Preparation of Solid Lipid Nanoparticles of Cinnamaldehyde and Determination of Sustained Release Capacity. Nanomaterials 2022, 12, 4460. https://doi.org/10.3390/nano12244460
Chen J, Li S, Zheng Q, Feng X, Tan W, Feng K, Liu Y, Hu W. Preparation of Solid Lipid Nanoparticles of Cinnamaldehyde and Determination of Sustained Release Capacity. Nanomaterials. 2022; 12(24):4460. https://doi.org/10.3390/nano12244460
Chicago/Turabian StyleChen, Jiajia, Shangjian Li, Qinhua Zheng, Xiaolin Feng, Weijian Tan, Kexin Feng, Yuntong Liu, and Wenzhong Hu. 2022. "Preparation of Solid Lipid Nanoparticles of Cinnamaldehyde and Determination of Sustained Release Capacity" Nanomaterials 12, no. 24: 4460. https://doi.org/10.3390/nano12244460