Article

Visible-Light Activation of Persulfate or H2O2 by Fe2O3/TiO2 Immobilized on Glass Support for Photocatalytic Removal of Amoxicillin: Mechanism, Transformation Products, and Toxicity Assessment

by
Francis M. dela Rosa
1,2,3,
Marin Popović
4,
Josipa Papac Zjačić
1,
Gabrijela Radić
1,
Marijana Kraljić Roković
1,
Marin Kovačić
1,
María José Farré
2,
Boštjan Genorio
5,
Urška Lavrenčič Štangar
5,
Hrvoje Kušić
1,*,
Ana Lončarić Božić
1 and
Mira Petrović
2,6
1
Faculty of Chemical Engineering and Technology, University of Zagreb, Marulićev trg 19, 10000 Zagreb, Croatia
2
Catalan Institute for Water Research (ICRA), C/Emili Grahit, 101, 17003 Girona, Spain
3
Faculty of Sciences, University of Girona, 17071 Girona, Spain
4
Department of Safety and Protection, Karlovac University of Applied Sciences, Trg J.J. Strossmayera 9, 47000 Karlovac, Croatia
5
Faculty of Chemistry and Chemical Technology, University of Ljubljana, Vecna pot 113, 1000 Ljubljana, Slovenia
6
Catalan Institution for Research and Advanced Studies (ICREA), Passeig Lluis Companys 23, 08010 Barcelona, Spain
*
Author to whom correspondence should be addressed.
Nanomaterials 2022, 12(23), 4328; https://doi.org/10.3390/nano12234328
Submission received: 15 November 2022 / Revised: 1 December 2022 / Accepted: 2 December 2022 / Published: 5 December 2022

Abstract

:
Fe2O3/TiO2 nanocomposites were fabricated via a facile impregnation/calcination technique employing different amounts iron (III) nitrate onto commercial TiO2 (P25 Aeroxide). The as-prepared Fe2O3/TiO2 nanocomposites were characterized by X-ray diffraction (XRD), Raman spectroscopy (RS), scanning electron microscopy/energy-dispersive spectroscopy (SEM/EDXS), X-ray photoelectron spectroscopy (XPS), Brunauer–Emmett–Teller analysis (BET), electron impedance spectroscopy (EIS), photoluminescence spectroscopy (PL), and diffuse reflectance spectroscopy (DRS). As a result, 5% (w/w) Fe2O3/TiO2 achieved the highest photocatalytic activity in the slurry system and was successfully immobilized on glass support. Photocatalytic activity under visible-light irradiation was assessed by treating pharmaceutical amoxicillin (AMX) in the presence and absence of additional oxidants: hydrogen peroxide (H2O2) and persulfate salts (PS). The influence of pH and PS concentration on AMX conversion rate was established by means of statistical planning and response surface modeling. Results revealed optimum conditions of [S2O82−] = 1.873 mM and pH = 4.808; these were also utilized in presence of H2O2 instead of PS in long-term tests. The fastest AMX conversion possessing a zero-order rate constant of 1.51 × 10⁻⁷ M·min−1 was achieved with the photocatalysis + PS system. The AMX conversion pathway was established, and the evolution/conversion of formed intermediates was correlated with the changes in toxicity toward Vibrio fischeri. Reactive oxygen species (ROS) scavenging was also utilized to investigate the AMX conversion mechanism, revealing the major contribution of photogenerated h+ in all processes.

1. Introduction

Semiconductor-based photocatalysis has emerged as a promising technology for water purification. Among photocatalysts studied, titanium dioxide (TiO2) has been regarded as the “benchmark photocatalyst” due to its chemical and thermal stability, biological inertness, suitable mechanical properties, low cost, and nontoxicity [1,2,3]. However, TiO2 suffers from fast recombination of photogenerated charges (i.e., electron/hole pairs; e/h+) and is active only under UV light due to its wide bandgap (3.0–3.2 eV), thus hindering its potential for visible-light-driven applications [1,4]. Consequently, these deficiencies can be improved by coupling TiO2 with a narrow-bandgap semiconductor with a visible-light response. As such, heterojunction formation between the two semiconductors promotes synergistic effects, leading to more efficient charge separation and improved photocatalytic activity under visible-light irradiation [2,4,5]. Hematite (α-Fe2O3) is a well-suited candidate for coupling with TiO2 due to its visible-light activity (bandgap energy (Eg) = 1.9–2.2 eV) [6], natural abundance, low cost, and stability in a wide range of pH in aqueous solutions [7]. In recent years, the application of Fe2O3/TiO2-based composite photocatalysts has gained attention due to their efficiency for the removal of contaminants of emerging concern (CECs) from water [8]. Further photocatalytic activity enhancement can be accomplished using electron acceptors such as persulfate (S2O82−, PS) and hydrogen peroxide (H2O2), which promote suppression of e/h+ recombination in Fe2O3/TiO2 photocatalysts, thus leading to the increased availability of photogenerated h+ for the generation of additional reactive oxygen species (ROS) and for subsequent oxidation reactions [9,10].
However, several knowledge gaps need to be addressed regarding Fe2O3/TiO2 application in real environmental conditions, including the following:
(i) Unequal distribution of solar energy around Earth’s surface. Most applications of Fe2O3/TiO2 for CEC removal are reported under solar irradiation [8]. In fact, solar light is composed of 3% UV light, 44% visible light, and 53% infrared light [11,12]. The UV light portion within solar irradiation plays an important role for the activation of the overall photocatalytic composite (i.e., Fe2O3/TiO2), and its absence may result in different mechanisms [13]. It must also be noted that UV distribution at the Earth’s surface is unequal and influenced by several factors [14]. As such, focusing on the utilization of visible light is favorable for such environmental applications.
(ii) Toxicity assessment. Transformation and/or degradation byproducts of CECs after Fe2O3/TiO2 photocatalytic processes are scarcely reported. Clearly, the formation of more toxic byproducts has already been reported using different TiO2/semiconductor-based composites [15]. Accordingly, such potential treatment drawbacks must receive well-deserved attention since they can impose additional risk to the environment.
(iii) Photocatalyst recovery. Fe2O3/TiO2 immobilization in various supports is scarcely reported and is usually in powder form prior to the application. Immobilization of photocatalysts provides a potential decrease in operating costs for the water treatment process by avoiding in-treatment agglomeration and post-treatment separation issues [1,3,9,16,17].
Herein, the overall aim of the study was to provide insight into the visible-light activation of PS and H2O2 using immobilized Fe2O3/TiO2 for the photocatalytic removal of amoxicillin (AMX), a pharmaceutical that is included in the second EU “watch list” based on the proposed European Decision 2018/840/EU [18,19]. The specific goals of the present investigation were (i) to prepare Fe2O3/TiO2 via an impregnation/calcination technique, (ii) to characterize the as-prepared photocatalyst using instrumental techniques specific for the investigation of structural and elemental composition, as well as morphological, textural, optical, and electrochemical properties, (iii) to determine Fe2O3 content for optimal photocatalytic activity, (iv) to optimize the combined effect of pH and PS concentration for the removal of AMX using the immobilized Fe2O3/TiO2, and (v) to correlate AMX transformation byproducts under different photocatalytic processes (i.e., photocatalysis alone, photocatalysis + H2O2, and photocatalysis + PS) with each toxicity profile.

2. Materials and Methods

2.1. Materials

Amoxicillin (C16H19N3O5S, AMX, 96%, Acros Chemicals, Geel, Belgium) was used as a targeted contaminant of emerging concern. Aeroxide P25 (TiO2–P25, Evonik, Essen, Germany) and iron(III) nitrate nonahydrate (Fe(NO3)3·9H2O, ≥98.0%, Fluka, Buchs, Switzerland) were used as precursors for the preparation of nanocomposites. Ethanol (C2H5OH, EtOH, 96%, Gram-mol, Zagreb, Croatia), titanium isopropoxide (Ti{OCH(CH3)2}4, TTIP, 97%, Sigma-Aldrich, St. Louis, MO, USA), perchloric acid (HClO4, 70%, Kemika, Zagreb, Croatia), tetraethyl orthosilicate (Si(OC2H5)4, TEOS, 99%, Sigma-Aldrich, St. Louis, MO, USA), hydrochloric acid (HCl, 37%, Gram-mol, Zagreb, Croatia), and Levasil 200/30 (colloidal SiO2, Obermeier, Bad Berleburg, Germany) were used for the immobilization of as-prepared nanocomposites onto glass substrates. Formic acid (HCOOH, FA, HPLC grade, Sigma-Aldrich, St. Louis, MO, USA) and acetonitrile (CH3CN, HPLC grade, J.T. Baker, Philipsburg, NJ, USA) were used to prepare HPLC mobile phases. 2-Propanol ((CH3)2CHOH, p.a, Gram-mol, Zagreb, Croatia), Nafion (5 wt.%, Sigma-Aldrich, St. Louis, MO, USA), and sodium sulfate (Na2SO4, p.a., Kemika, Zagreb, Croatia) were used in photo electrochemical experiments. Sodium persulfate (Na2S2O8, PS, ≥99.0%, Sigma-Aldrich, St. Louis, MO, USA) and hydrogen peroxide (H2O2, 30%, T.T.T., Zagreb, Croatia) were used as oxidants. Sodium hydroxide (NaOH, p.a., Kemika, Zagreb, Croatia) and sulfuric acid (H2SO4, p.a., Kemika, Zagreb, Croatia) were used for pH adjustments. Methanol (CH3OH, MeOH, HPLC grade, J.T. Baker, Philipsburg, NJ, USA), tert-butanol ((CH3)3COH, t-BuOH, 99%, Lach-Ner, Neratovice, Czech Republic), FA (98%, Fluka, Buchs, Switzerland), and 1,4-benzoquinone (C6H4O2, BQ, 98%, Fluka, Buchs, Switzerland), were used for scavenging studies, i.e., for the determination of main species/mechanisms involved in degradation of AMX by the studied system. Throughout the study, all aqueous solutions were prepared with MilliQ-water, obtained using a Direct-Q3 UV Millipore (Merck, Burlington, MA, USA) ultrapure water system.

2.2. Preparation and Imobilization of Fe2O3/TiO2 Nanocomposites

The appropriate amount of TiO2–P25 (0.300 g) was dispersed in 80 mL of EtOH under sonication (Bandelin Sonorex RK 510 H, Berlin, Germany) for 5 min. Then, the appropriate amount of Fe(NO3)3·9H2O dissolved in 20 mL of EtOH was slowly added dropwise to the TiO2–P25 suspension whilst under sonication. After the sonication process was performed for 30 min, a brownish-white suspension was observed. The suspension was then continuously stirred for 6 h at room temperature, before drying at 60 °C for 12 h. The collected powder was calcined at 350 °C for 2 h in air using a muffle furnace (LP-08, Instrumentaria, Zagreb, Croatia) to obtain the final product. Different contents of Fe(NO3)3·9H2O were added to form final Fe2O3/TiO2 nanocomposites with a theoretical content (w/w) of 1%, 3%, 5%, 10%, and 20% (Fe2O3 to TiO2–P25). Pure α-Fe2O3 was obtained by performing the same procedure without the presence of TiO2–P25. Images of the prepared nanocomposites are shown in Figure S1.
The selected photocatalyst nanocomposites were immobilized using a low-temperature method [16]. The procedure involved the preparation of silica sol and titania sol. The silica sol was prepared via the hydrolysis of TEOS in water catalyzed by HCl, performed under vigorous stirring until a clear sol was obtained. Titania sol was prepared via the hydrolysis of TTIP in EtOH catalyzed by HClO4, conducted under reflux conditions at 100 °C for 48 h. Subsequently, the obtained silica sol, titania sol, EtOH, and Levasil 200/30 were mixed to form a binder sol in which 1.0 g of obtained photocatalyst was added. The mixture was homogenized in an ultrasonic bath for 10 min prior to the coating of round glass substrates (r = 37.5 mm) by spin coating at 1500 rpm for 30 s using a KW-4A spin coater (Chemat Technology, Los Angeles, CA, USA). The plates were thereafter heat-treated in an oven UN-55 (Memmert, Schawabach, Germany) at 200 °C for 2 h. The same procedure was repeated to prepare three catalyst layers, while the heating cycles (200 °C for 2 h) were applied between coatings of layers.

2.3. Characterization of Fe2O3/TiO2 Nanocomposites

X-ray diffractograms (XRD) of the prepared nanocomposites were recorded using an X-ray diffractometer MiniFlex 600 (Rigaku, Tokyo, Japan), using Cu Kα1 (λ = 1.54059 Å) radiation from 3° to 70° with a step width of 0.02° and scan speed of 2.00°/min.
Raman spectroscopy were measured using an Alpha300 (Oxford Instruments-Witec, Ulm, Germany) equipped with a microscope and attached atomic force microscope (AFM). The excitation source wavelength was set to 532 nm, while the integration time was set to 5 s with an average of 20 scans taken.
Scanning electron microscopy (SEM) images were obtained using an Ultra Plus SEM (Zeiss, Jena, Germany). Energy-dispersive spectroscopy spectra (EDS) were recorded with an X-max silicon drift detector (Oxford Instruments, Abingdon, UK).
X-ray photoelectron spectroscopy (XPS) measurements were performed using a PHI VersaProbe III (Version AD) (PHI, Chanhassen, MI, USA) equipped with a hemispherical analyzer and a monochromatic Al Kα X-ray source. Survey spectra were measured using a pass energy of 224 eV and step of 0.8 eV, while Fe 2p core-level spectra were measured at a pass energy of 27 eV and step of 0.1 eV. The data were acquired using ESCApe 1.4 software. Fitting of Fe and Ti 2p core-level spectra were performed using CasaXPS software.
Diffuse reflectance spectra (DRS) of the prepared nanocomposites were measured using a UV-2600i UV/Vis spectrophotometer (Shimadzu, Kyoto, Japan), equipped with an integrating sphere. The obtained reflectance versus wavelength spectra of pure components and nanocomposites were transformed into the Kubelka–Munk function (KM) versus photon energy () in order to calculate bandgap (Eg) values. The bandgap (Eg) values of studied photocatalytic materials were calculated from the onsets of the absorption edge using the formula presented in Equation (1) [20].
λ g = 1240 E g ,
where λg is the bandgap wavelength.
Photoluminescence (PL) spectra were recorded at room temperature using a Varian Cary Eclipse fluorescence spectrophotometer (Agilent, Sta.Clara, CA, USA) with an excitation wavelength of 325 nm.
The Brunauer–Emmett–Teller (BET) single-point and multipoint surface area was determined from N2 adsorption/desorption isotherms using Gemini 2380 instrument (Micrometrics, Norcross, GA, USA). The nanocomposites were characterized in powdered form in all above-stated characterization techniques.

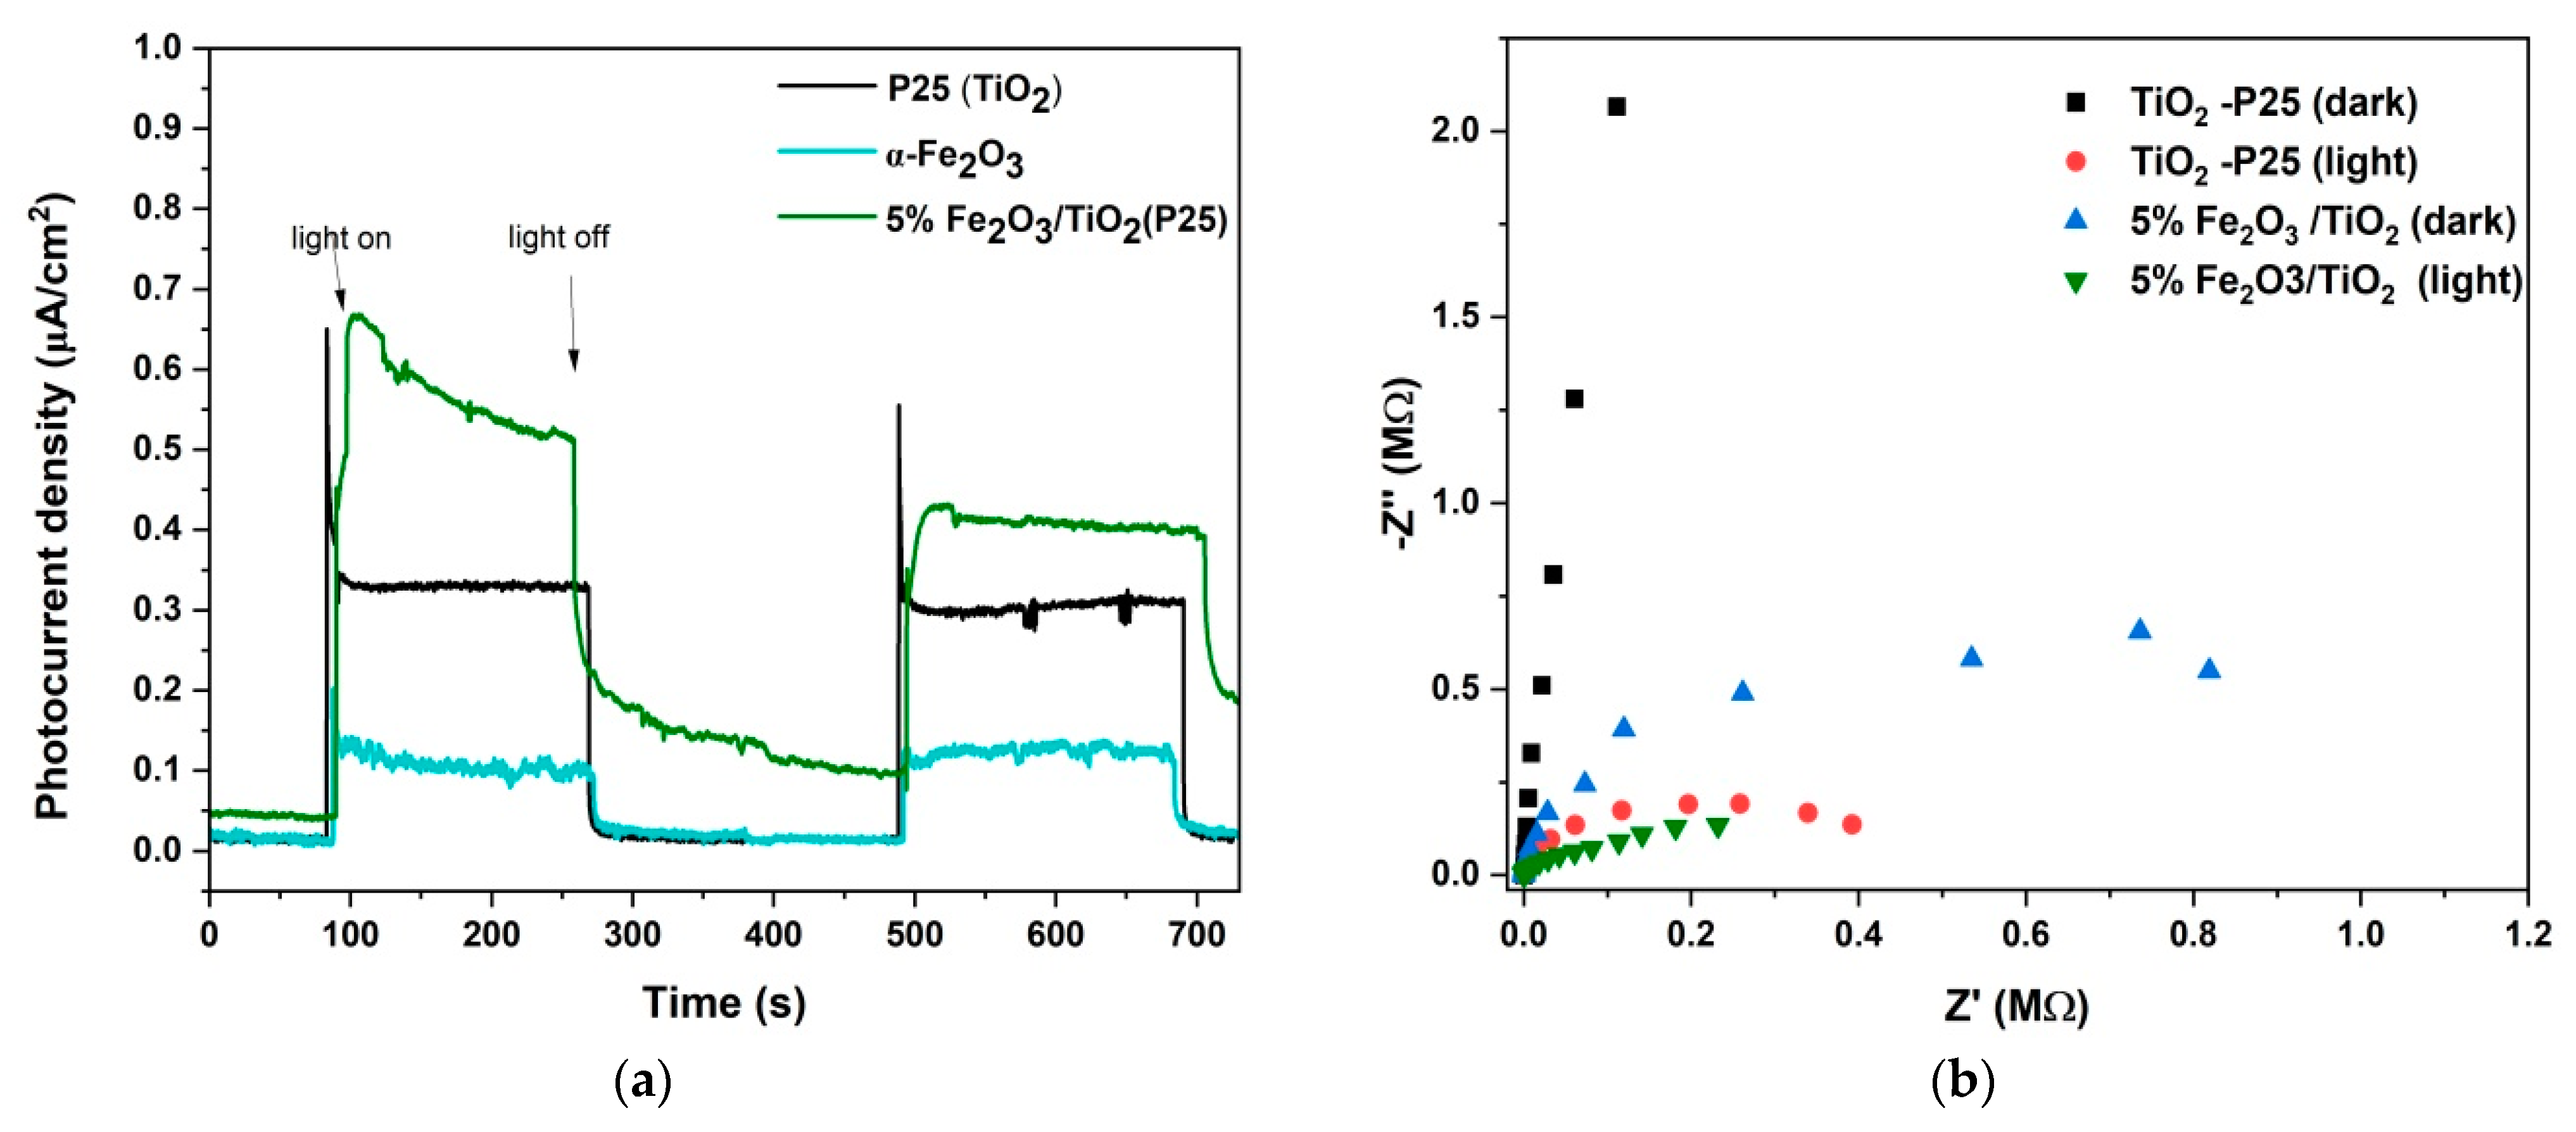
2.4. Photoelectrochemical (PEC) Measurements

Prepared nanocomposites were immobilized on 1 cm2 area of fluorine-doped tin oxide (FTO, Sigma-Aldrich, St. Louis, MO, USA) glass (2.2 mm thick; resistivity of 7 Ω/sq; overall dimension: 2 cm × 1 cm) using the method described by Elbakkay et al. [21]. Prior to coating, FTO glass slides were sonicated for 10 min sequentially in EtOH, acetone, and ultrapure water and then dried at room temperature. Thereafter, 2 mg of prepared nanocomposite was dispersed in 400 µL of 2-propanol and 10 µL of Nafion (Sigma-Aldrich, 5 wt.%) under sonication for 30 min. Finally, 30 µL of catalyst suspension was immediately drop-casted on 1 cm2 area of clean FTO glass and then dried in an oven at 80 °C for 30 min to form a working electrode.
Transient photocurrent responses and electrochemical impedance spectra (EIS) were obtained using a potentiostat/galvanostat PalmSens4 (PalmSensBV, Houten, The Netherlands) equipped with a standard three-electrode system and an LED light source (spectrum shown in Figure S2). Ag/AgCl electrode, Pt wire, as-prepared nanocomposite-coated FTO glass (1 cm2), and 0.1 M Na2SO4 solution were used as the reference electrode, counter electrode, working electrode, and electrolyte solution, respectively.

2.5. Photocatalytic Activity Evaluation

Photocatalytic treatment experiments with 0.05 mM AMX water solution were carried out in a water-jacketed (V = 0.09 L, T = 25.0 ± 0.2 °C) batch photoreactor illuminated by a simulated solar irradiation produced by Oriel Arc source (Newport; 450 W Xe lamp, Osram, Irvine, CA, USA), which was equipped with a collimator and airmass filter (AM 1.5 G), as well as an additional UV cutoff filter (λ > 400 nm) to provide only visible-light illumination [17]. In preliminary experiments a slurry system was used; 0.045 g of photocatalyst powder was dispersed with AMX solution (natural pH = 5.5) under constant stirring (300 rpm). The solution was continuously mixed for 30 min in the dark in order to achieve adsorption/desorption, denoted as (−30), and thereafter exposed to visible-light illumination. The onset of illumination is denoted as (0). During the experiments, 700 µL aliquots of samples were collected at designated time intervals (15, 30, 45, 60, 75, and 90 min), filtered through a 0.45 µM Chromafil XTRA RC (Macherey-Nagel, Duren, Germany) syringe filter, and immediately quenched with 100 µL of MeOH prior to HPLC analysis, as described in Section 2.6. The photocatalyst powder which possessed the highest photocatalytic activity was selected for immobilization onto glass plates as described in Section 2.2. The glass plates with immobilized photocatalytic material were placed at the bottom of the reactor in contact with AMX solution under constant mixing (90 rpm) by an orbital shaker DOS-20 (NeoLab, Heidelberg, Germany) and were subjected to a similar treatment procedure as described above for the slurry system, except for the illumination time intervals (15, 30, 45, 60, 75, 90, 120, and 150 min). A full factorial design (FFD) was utilized to study the effect of initial pH and PS concentration on AMX degradation (Table 1 and Table S1). The coded parameters X1 and X2 represent pH (ranging from 4 to 8) and concentration of PS (ranging from 500 µM to 3000 µM), respectively. The chosen minimum and maximum concentrations of PS corresponded to AMX:PS molar ratios of 1:10 to 1:60, respectively. The obtained optimal conditions for the degradation of AMX based on FFD experiments and response surface modeling were utilized as the basis for H2O2 conditions, which were later used and compared for the investigation of toxicity, transformation byproducts, and scavenging studies. Identification of reactive oxidizing species (ROS) was carried out using t-BuOH (5 mM), FA (5 mM), BQ (0.5 mM), and MeOH (5 mM) as scavengers for HO, h+, O2•−, and both HO and sulfate radical (SO4•−), respectively. The experiments were conducted in triplicate, and average values are reported; the reproducibility of experiments was ≥95.5%.

2.6. Analytical Methods

pH measurements were performed using a Handylab pH/LF portable pH-meter (Schott Instruments GmbH, Mainz, Germany). AMX concentration was monitored using an HPLC, Series 10, (Shimadzu, Kyoto, Japan) equipped with a UV-DAD detector (SPD-M10AVP, Shimadzu) and a reversed-phase (RP) C18 column (250 mm × 4.6 mm, 5 μm, Macherey-Nagel Nucleosil, Duren, Germany). Isocratic elution was carried out with a mobile phase consisting of 90% aqueous 50 mM FA and 10% acetonitrile at an overall flow of 1 mL·min−1, whereas AMX was monitored at 272 nm. AMX transformation products (TPs) were analyzed using an ultrahigh-performance chromatograph (Thermo Scientific Vanquish system) in tandem with a high-resolution mass spectrometer (Orbitrap ExplorisTM 120, Thermo Scientific, Waltham, MA, USA), in positive and negative ionization mode. The samples were diluted fivefold with HPLC-grade water prior to the injection. Chromatographic separation of AMX and its transformation products was achieved on an RP C18 column (50 mm × 2.1 mm Hypersil GOLDTM, pore size 1.9 μm, Thermo Scientific, Vilnius, Lithuania). Gradient elution of water with 0.1% FA (A phase) and acetonitrile (B phase) was utilized, at a flow rate of 0.400 mL·min−1, under the following gradient program: 0–0.200 min, 2% B; 0.200–4.750 min, 98% B; 98% B maintained for 1.250 min (4.750–6.000 min); back to the initial mobile phase composition 3 min post run time (98% A/2% B). Ammonium acetate was used for negative mode instead of FA. The conditions for high-resolution mass spectrometry with an electrospray ionization source were the following: capillary, 3500 V; ion transfer tube temperature, 325 °C; vaporizer temperature, 350 °C; sheath gas pressure (Arb), 50; auxiliary gas pressure (Arb), 10; scan modes, full MS (resolution 60,000) and ddMS2 (resolution 15,000); scan range, m/z 100–1000. Raw MS data files of the control, blank matrix, and AMX samples were imported into Compound DiscovererTM (v.3.3 SP1 Thermo Scientific, Waltham, MA, USA) software for transformation product identification. Fragment ion search (FISh) coverage function in Compound DiscovererTM was utilized for structure elucidation and chemical transformations involved for each chromatographic peak. Expected compounds were measured within ±2 ppm of mass error; with maximum area ≥105 and FISh coverage score ≥43.50. The aquatic toxicity of treated samples was evaluated using a commercial bioassay, based on inhibition of the luminescence emitted by Vibrio fischeri (VF) according to ISO 11348-3:2007 measured on a BiofixLumi-10 luminometer (Macherey-Nagel, Duren, Germany). Luminescence inhibition after 15 min exposure was taken as the endpoint. The results were expressed as effective concentrations causing a 50% reduction in bioluminescence (EC50) and converted into toxicity units (TU = 100/EC50).

2.7. Calculations

Response surface methodology (RSM) was utilized to determine the effectiveness of visible-light-driven photocatalytic treatment of AMX dependent on initial pH and PS concentration. The values of process parameters are represented by independent variables: X1 and X2 (Table 1). Experimental space was described using a 32 full factorial design (FFD) for the vis-(5% Fe2O3/TiO2)/PS system, selected as the best according to preliminary results obtained in the slurry system (Table S1). The AMX conversion rate constants after a 150 min treatment period were chosen as process responses. The combined influence of studied parameters on process performance was described by a quadratic polynomial equation representing the RSM model, which was evaluated using a standard statistical test, i.e., analysis of variance (ANOVA), considering the following statistical parameters: Fisher F-test value (F), its probability value (p), regression coefficients (pure: R2; adjusted: Radj2), and t-test value. Moreover, graphical-based analysis was conducted on the so-called “residual diagnostic” (RD) using a normal probability test, Levene’s test, and a constant variance test. The calculations were performed using the Statistica 13.5 (Tibco, Palo Alto, CA, USA) and Design-Expert 10.0 (StatEase, Minneapolis, MN, USA) software packages.

3. Results and Discussion

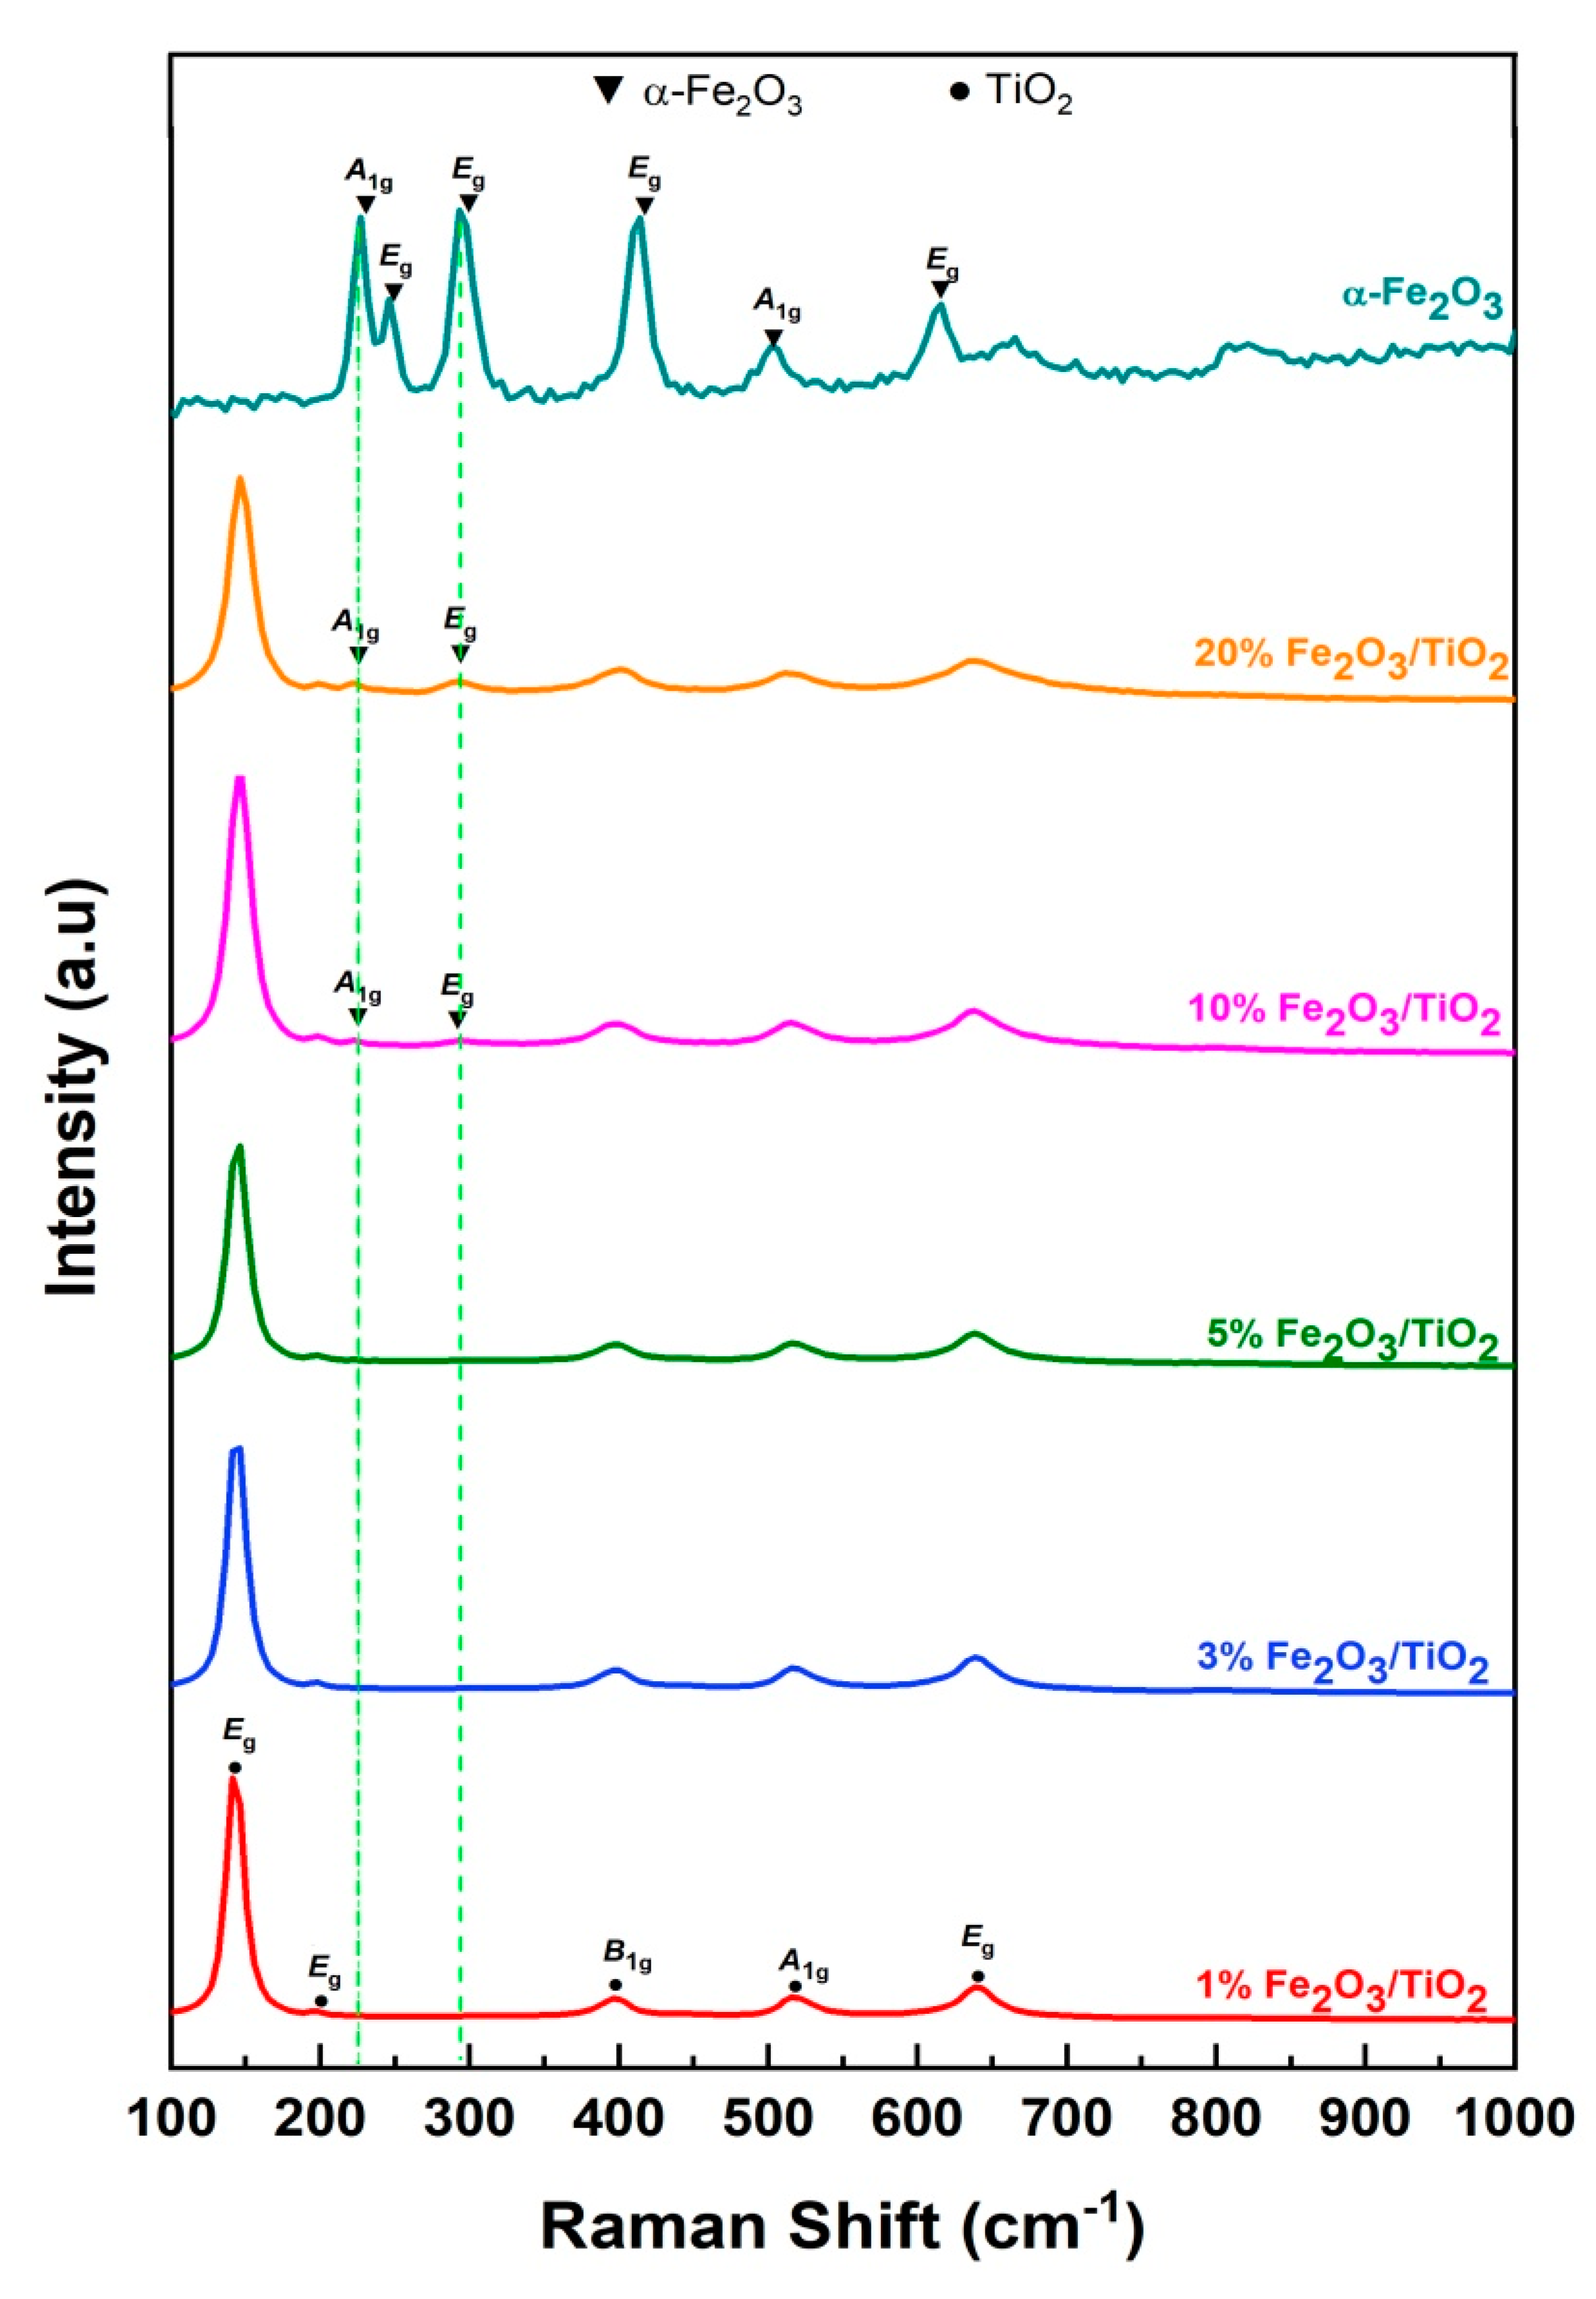
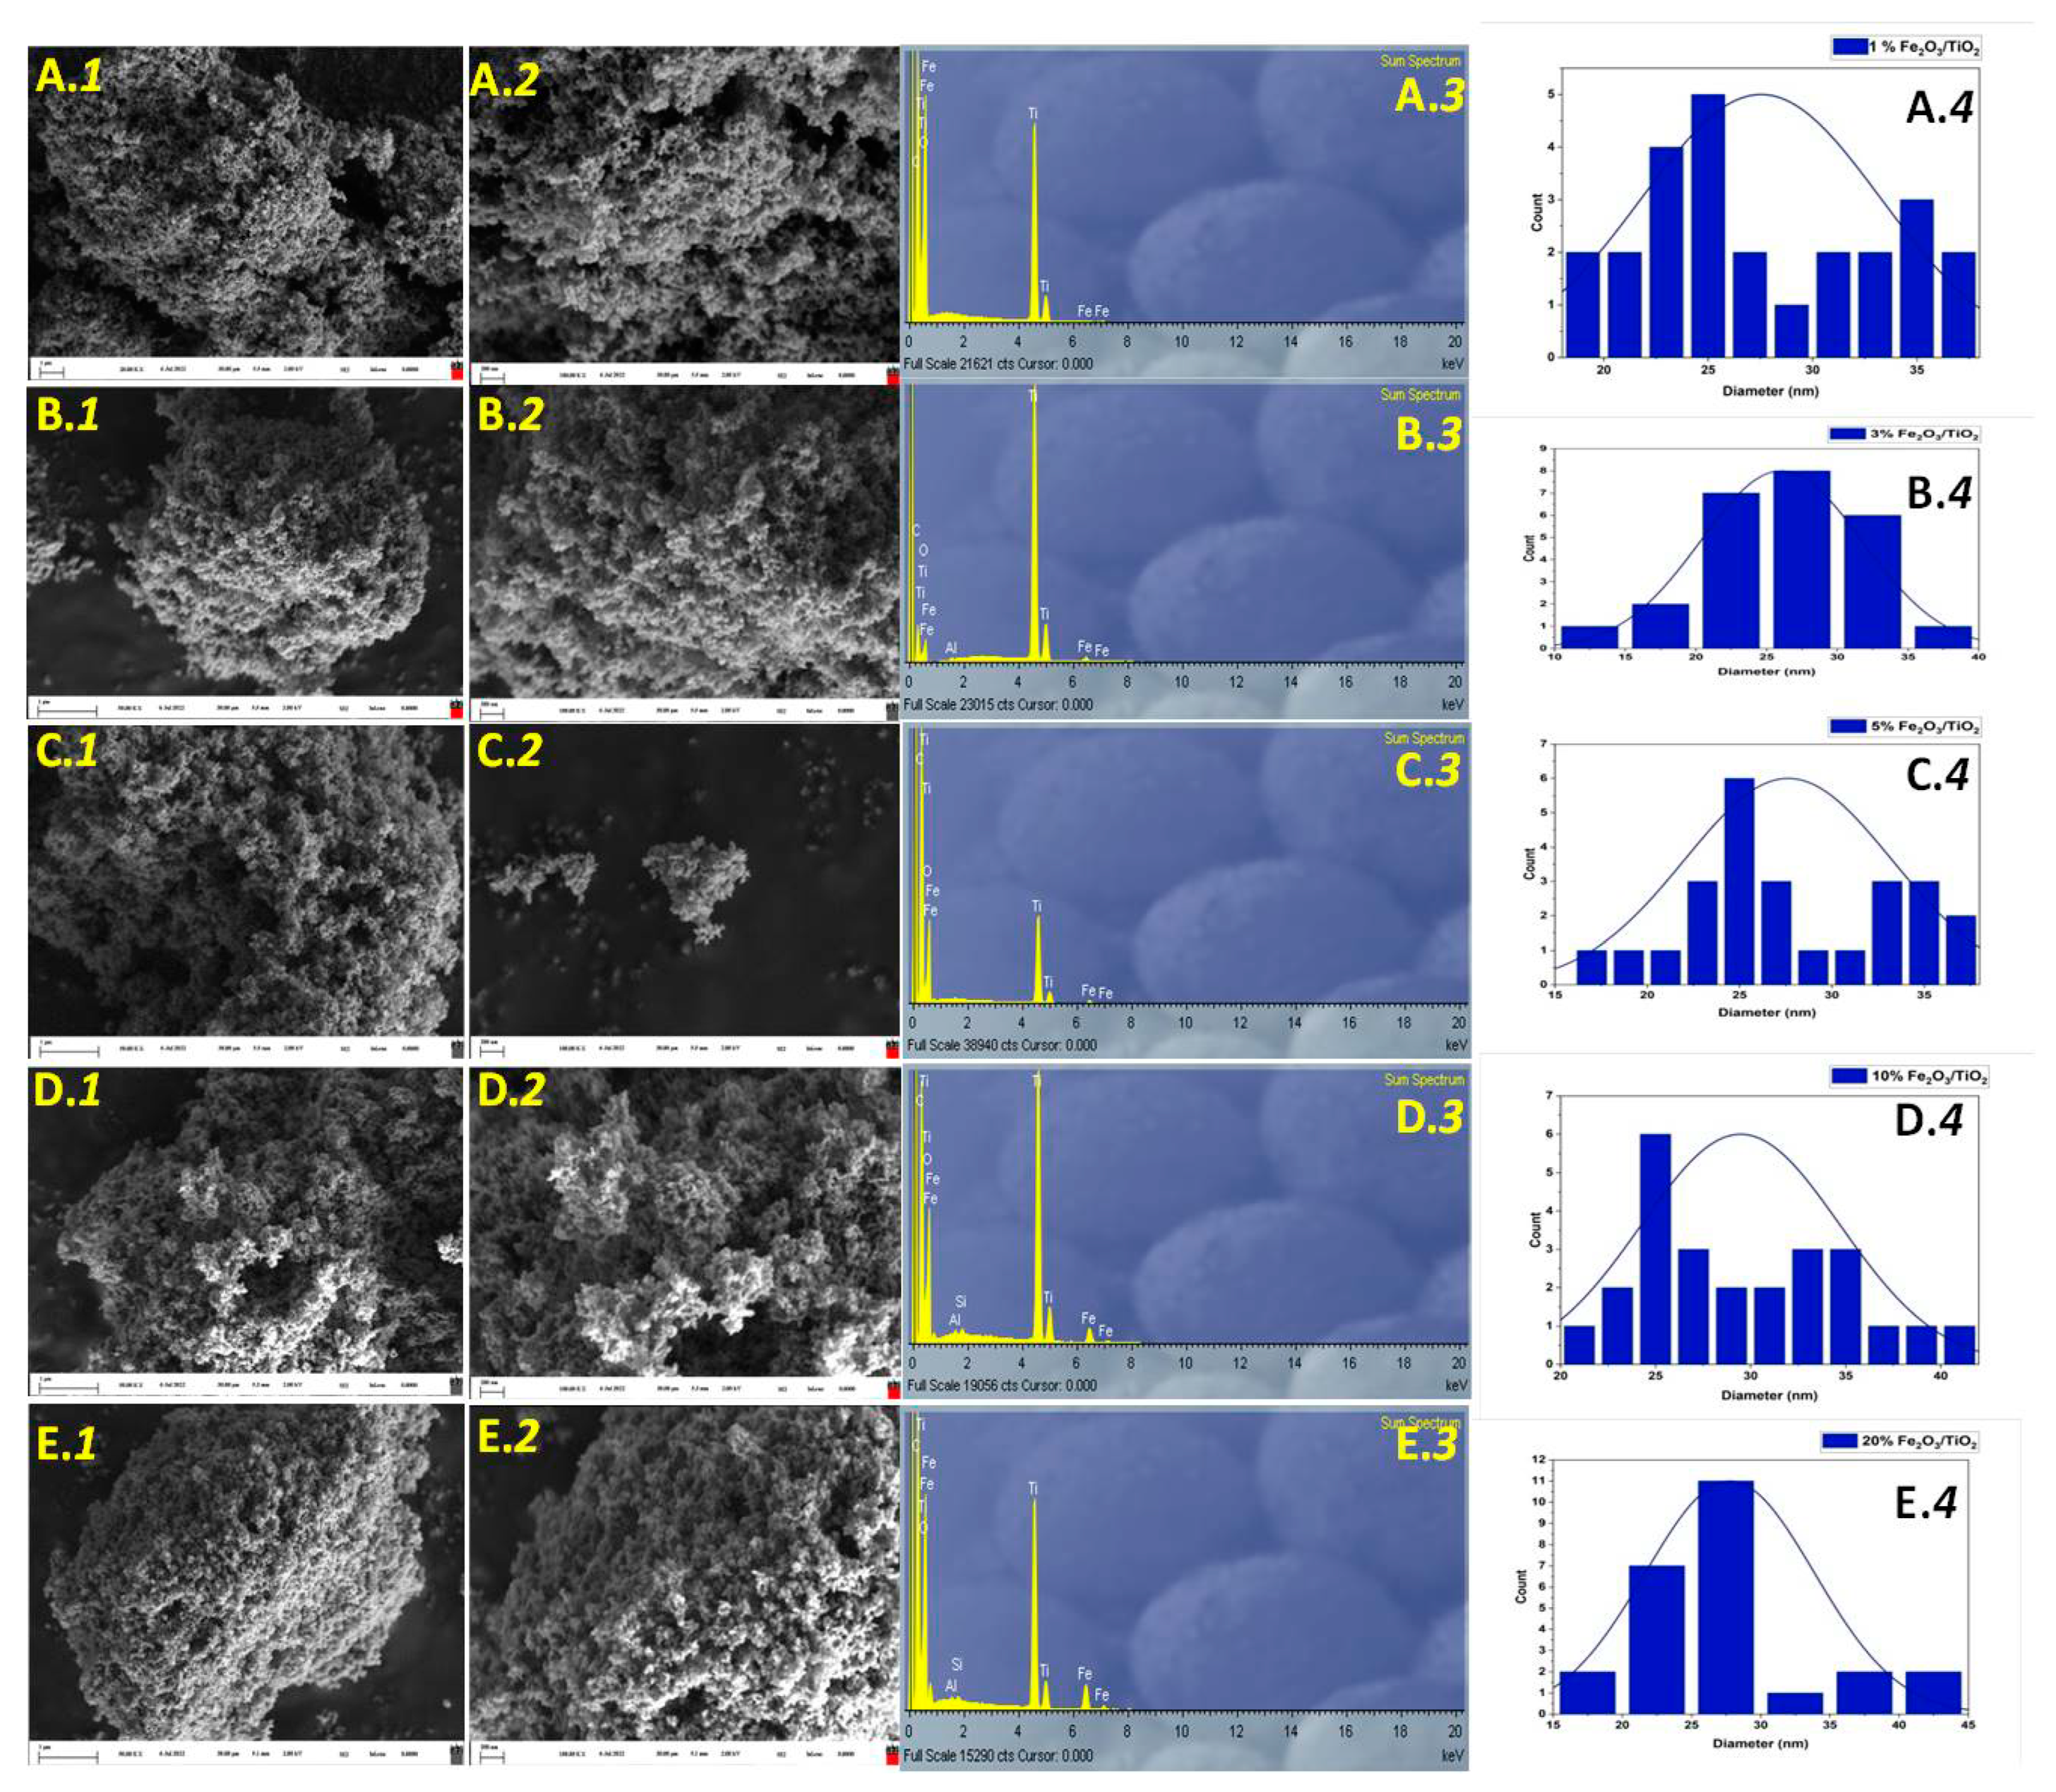
3.1. Material Characterization

The crystalline structures of the as-prepared photocatalytic materials were investigated using XRD. In Figure 1a, the peaks observed in the diffractograms at 2θ = 25.30°, 37.00°, 37.84°, 38.72°, 48.02°, 53.94°, 54.94°, 62.72°, and 68.92° were indexed into lattices (101), (103), (004), (112), (200), (105), (211), (204), and (116), respectively, which are in good agreement with anatase (ICDD PDF card 21-1272), while peaks at 2θ = 27.44°, 36.14°, and 41.22° were indexed into lattices (110), (101), and (111), respectively, which correspond to rutile (ICDD PDF card 21-1276) [22,23]. Meanwhile, preparation using only pure iron precursor yielded diffractogram peaks at 2θ = 23.72°, 32.74°, 35.20°, 40.40°, 49.06°, 53.02°, 57.10°, 62.08°, and 63.62°, which were indexed into lattices (012), (104), (110), (113), (024), (116), (018), (214), and (300), corresponding to pure hematite (ICDD PDF card 33-0664) [24,25]. Partial magnification around the (104) plane (Figure 1b) of hematite revealed that only 20% (w/w) Fe2O3/ TiO2 provided a noticeable additional peak, confirming the successful inclusion of α-Fe2O3, while no traces of hematite were detected in the remaining nanocomposites due to XRD detection limits [23]. In Figure 1c, partial magnification around 25.30° ((101), anatase plane), revealed a peak shift to a lower angle upon increasing the addition of Fe2O3, which is attributed to lattice distortion on the TiO2 surface [23].
Raman spectra of the prepared nanocomposites and pure α-Fe2O3 are shown in Figure 2. All of the prepared nanocomposites showed distinct phonon modes of TiO2 such as Eg (143, 196, and 641 cm−1), A1g (516 cm−1), and B1g (396 cm−1) [26,27]. Meanwhile, α-Fe2O3 showed two A1g phonon modes (227 and 496 cm−1) and four Eg phonon modes (245, 294, 410, and 613 cm−1) [24,28,29,30,31]. No vibrational modes of other iron-related species (i.e., maghemite or magnetite) were detected, which indicates the high purity of the obtained α-Fe2O3. It must be noted that only 10% and 20% (w/w) Fe2O3/TiO2 provided noticeable α-Fe2O3 vibrational modes (A1g (227 cm−1), Eg (294 cm−1)), confirming the successful inclusion of α-Fe2O3 in the composite, which is also in agreement with the XRD results.
Scanning electron microscopy (SEM) images and EDX spectra of the prepared nanocomposite photocatalysts are shown in Figure 3. The formation of agglomerated TiO2–P25 (Aeroxide) particles is a consequence of the impregnation/calcination method. It must be noted that Fe2O3 content loading was low and did not cause any distortion of the overall appearance of the nanocomposite. As such, it can be derived that small Fe2O3 particles were formed around TiO2–P25 to promote a heterojunction between the semiconductors (i.e., TiO2 and Fe2O3), which may improve charge transfer mobility in the overall nanocomposite [23]. EDX spectra revealed the presence of small Fe amount among the prepared nanocomposites, which later proved the incorporation of Fe2O3. These results are in agreement with the obtained XRD and Raman results, as discussed above.
X-ray photoelectron spectroscopy (XPS) was further used to determine the surface chemical composition and oxidation states of 5% Fe2O3/TiO2 nanocomposites. The XPS full survey spectrum (Figure 4a) showed distinct signals of Fe 2p, Ti 2p, and O 1s, confirming the successful inclusion of α-Fe2O3 on the surface of TiO2 [32], while the C 1s peak was attributed to adventitious carbon contamination originating from air exposure of the samples [33]. In Figure 4b, the core-level XPS spectrum of Fe 2p showed two peaks at binding energy (BE) values of 723.50 and 709.85 eV, corresponding to Fe 2p1/2 and Fe 2p3/2, respectively, and a satellite signal at around 715 eV, which are all characteristic of Fe3+ in Fe2O3 [23,32,34]. Moreover, the difference in core energy level of Fe 2p, Δ(BE) = (2p1/2 − 2p3/2) = 13.65 eV also proved the presence to α-Fe2O3 [32,34]. In Figure 4c, the core-level XPS spectrum of Ti 2p showed Ti4+ characteristic peaks at BE values of 464.33 and 458.53 eV, corresponding to Ti 2p1/2 and Ti 2p3/2, respectively [23,32]. Similarly, Ti 2p, Δ(BE) = (2p1/2 − 2p3/2) = 5.8 eV, indicated the normal state of Ti4+ in TiO2–anatase, which is similar to the results reported in the literature [33,35,36].
The UV diffuse reflectance spectra of pure components and prepared nanocomposites are shown in Figure 5a, whereas the Kubelka–Munk transformed spectra for the calculation of bandgap values are presented in Figure 5b. As shown in Table 2, calculated bandgap values of TiO2–P25 and α−Fe2O3 powders are in agreement with the values provided in the literature [37,38]. An increase in visible-light absorption (Figure 5a) and an overall decrease in bandgap values (Table 2) of the Fe2O3/TiO2 nanocomposites were observed upon increasing Fe2O3 content.
Photoluminescence (PL) spectroscopy was used to study the separation of photogenerated e/h+ pairs in the as-prepared nanocomposites. As can be seen in Figure 6, all Fe2O3/TiO2 nanocomposites showed a specific emission peak at around 444 nm, as similarly reported by Sayed et al. [39], albeit with different intensities. Materials containing 1% and 3% (w/w) Fe2O3 exhibited higher PL intensity compared to pristine TiO2. Such low Fe2O3 loading (i.e., 1 and 3% (w/w)) may suppress the defect concentration, thus promoting an increase in e/h+ recombination rate [40,41]. Similarly, a further increase in Fe2O3 loading (i.e., 20% (w/w)) exhibited the highest PL intensity among all the prepared nanocomposites, higher than pristine TiO2. As such, an optimal level of 5% Fe2O3 loading exhibited the lowest PL intensity, suggesting a strongly suppressed e/h+ recombination rate [42], which could be considered as having the highest photocatalytic activity among all the prepared nanocomposites.
To further explore the photogenerated charge carrier separation efficiency of the prepared nanocomposite, photoelectrochemical studies (i.e., transient photocurrent responses and EIS) were conducted. The photocurrent density responses of a photocatalyst are directly related to its photocatalytic activity [43,44]. Transient photocurrent responses of TiO2, α−Fe2O3, and 5% Fe2O3/TiO2 are shown in Figure 7a. Specifically, 5% Fe2O3/TiO2 exhibited the highest response (0.55 μA·cm2) compared to individual parts of the composite (i.e., TiO2 and Fe2O3). The improved separation efficiency was attributed to successful heterojunction formation. It must be noted that the photocurrent density of 5% Fe2O3/TiO2 was reduced in the second cycle (light on/light off) to 0.45 μA·cm2, which may be attributed to the leaching of Fe2O3 [44]. Electron impedance spectroscopy (EIS) was used to study the interfacial charge transfer mechanism in the prepared samples [45]. As shown in Figure 7b, EIS Nyquist plots of pure TiO2 and 5% Fe2O3/TiO2 were measured under dark and light irradiation. In EIS, the radius of the semicircle corresponds to the overall charge transfer resistance [44,45,46]. Under visible-light irradiation, all samples showed less charge transfer resistance than in the dark, with 5% Fe2O3/TiO2 having a smaller radius than pure TiO2, indicating an efficient charge transfer mechanism between Fe2O3 and TiO2 due to successful heterojunction formation.

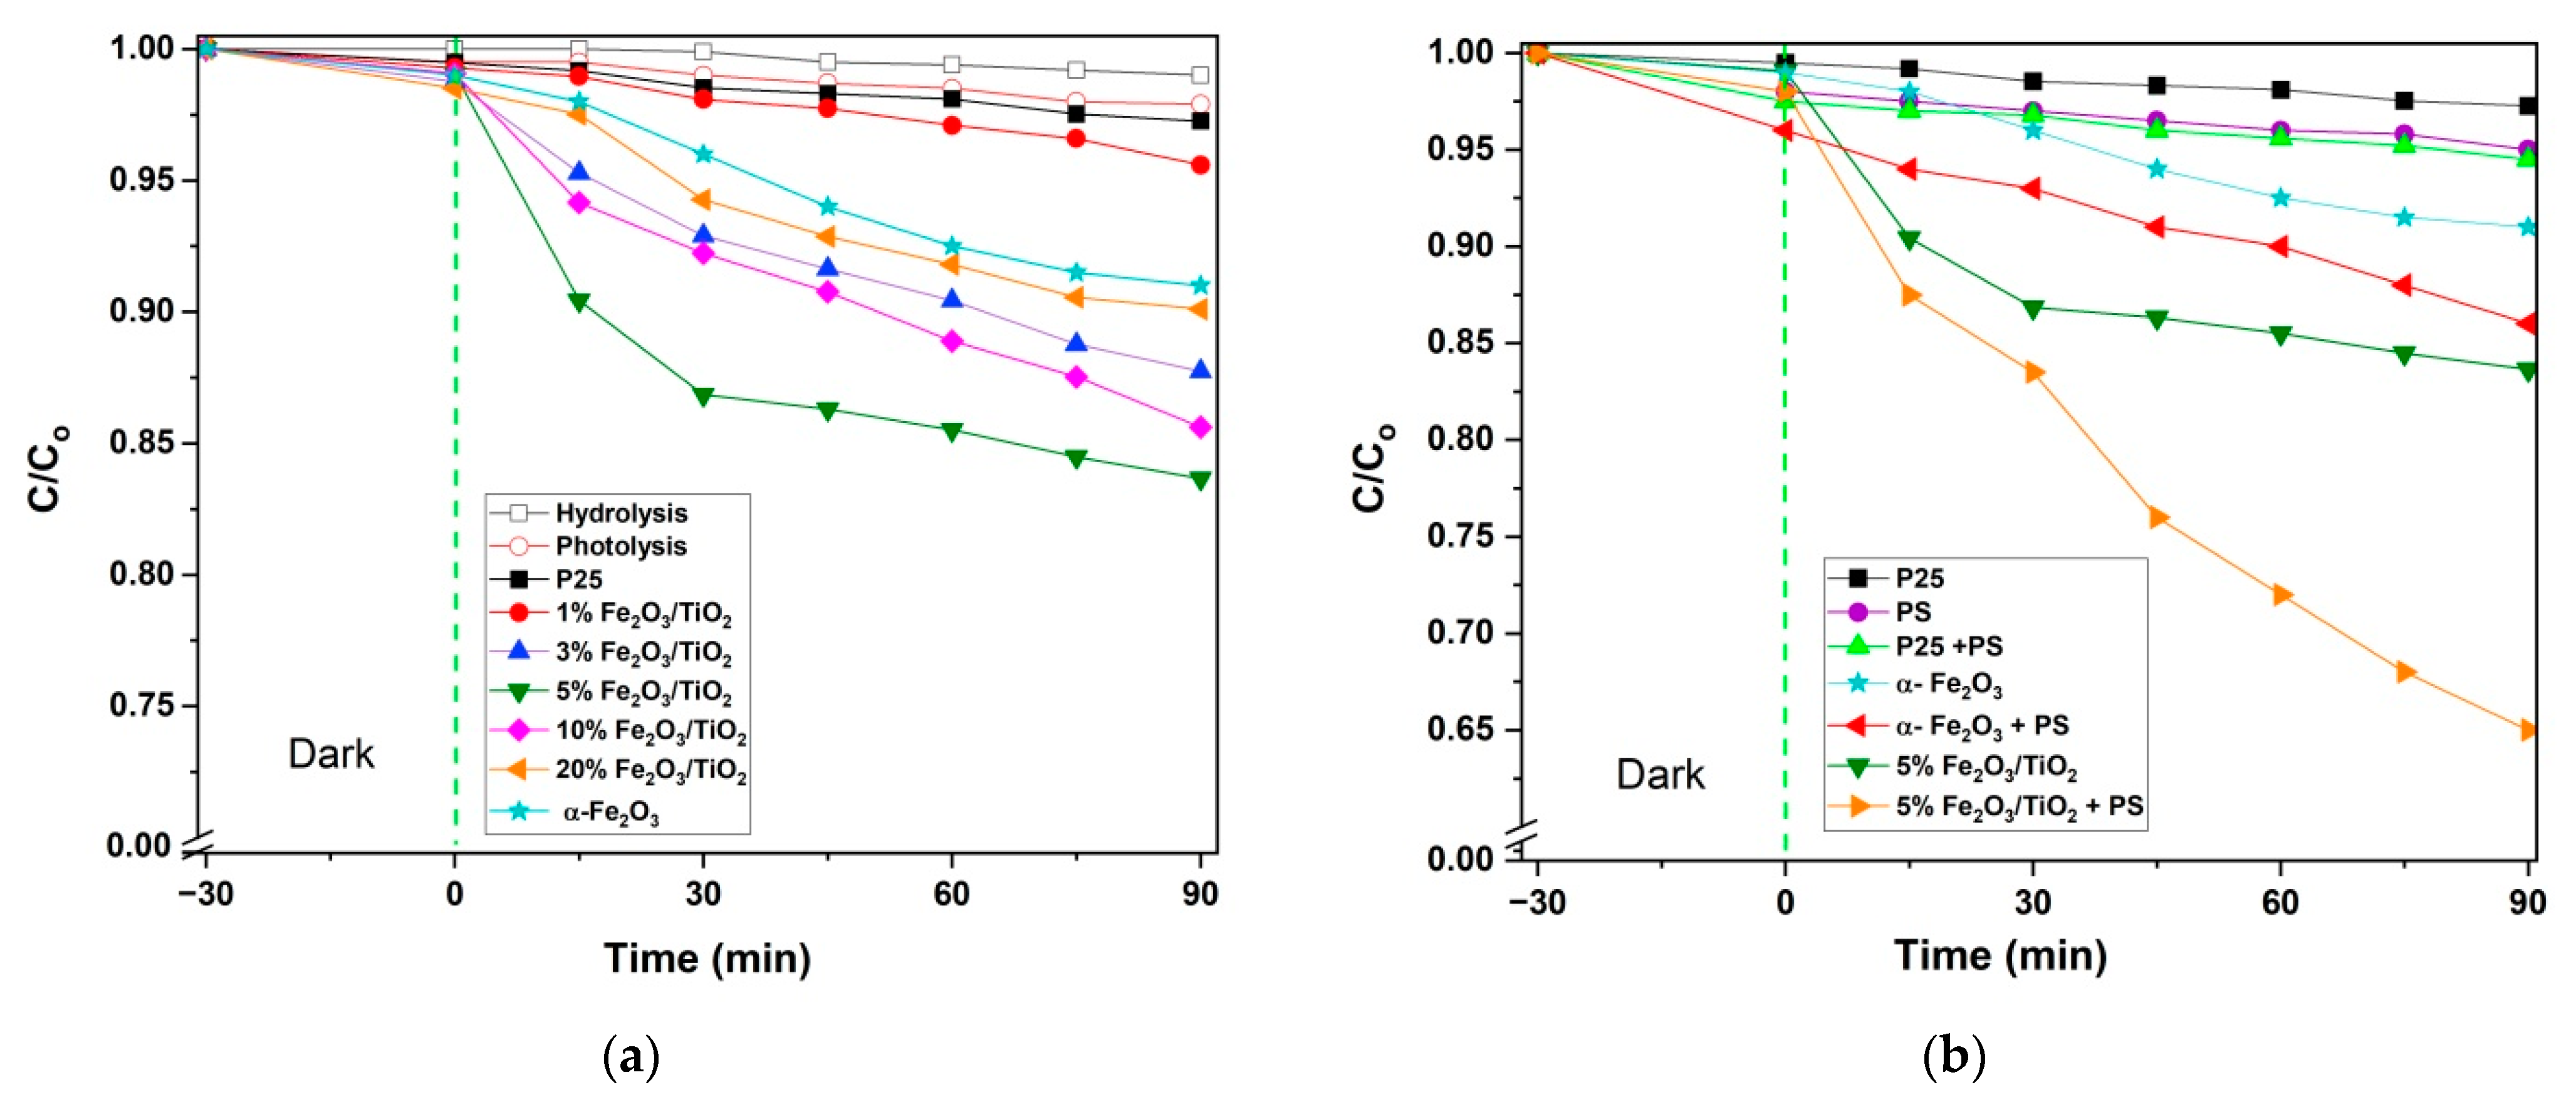
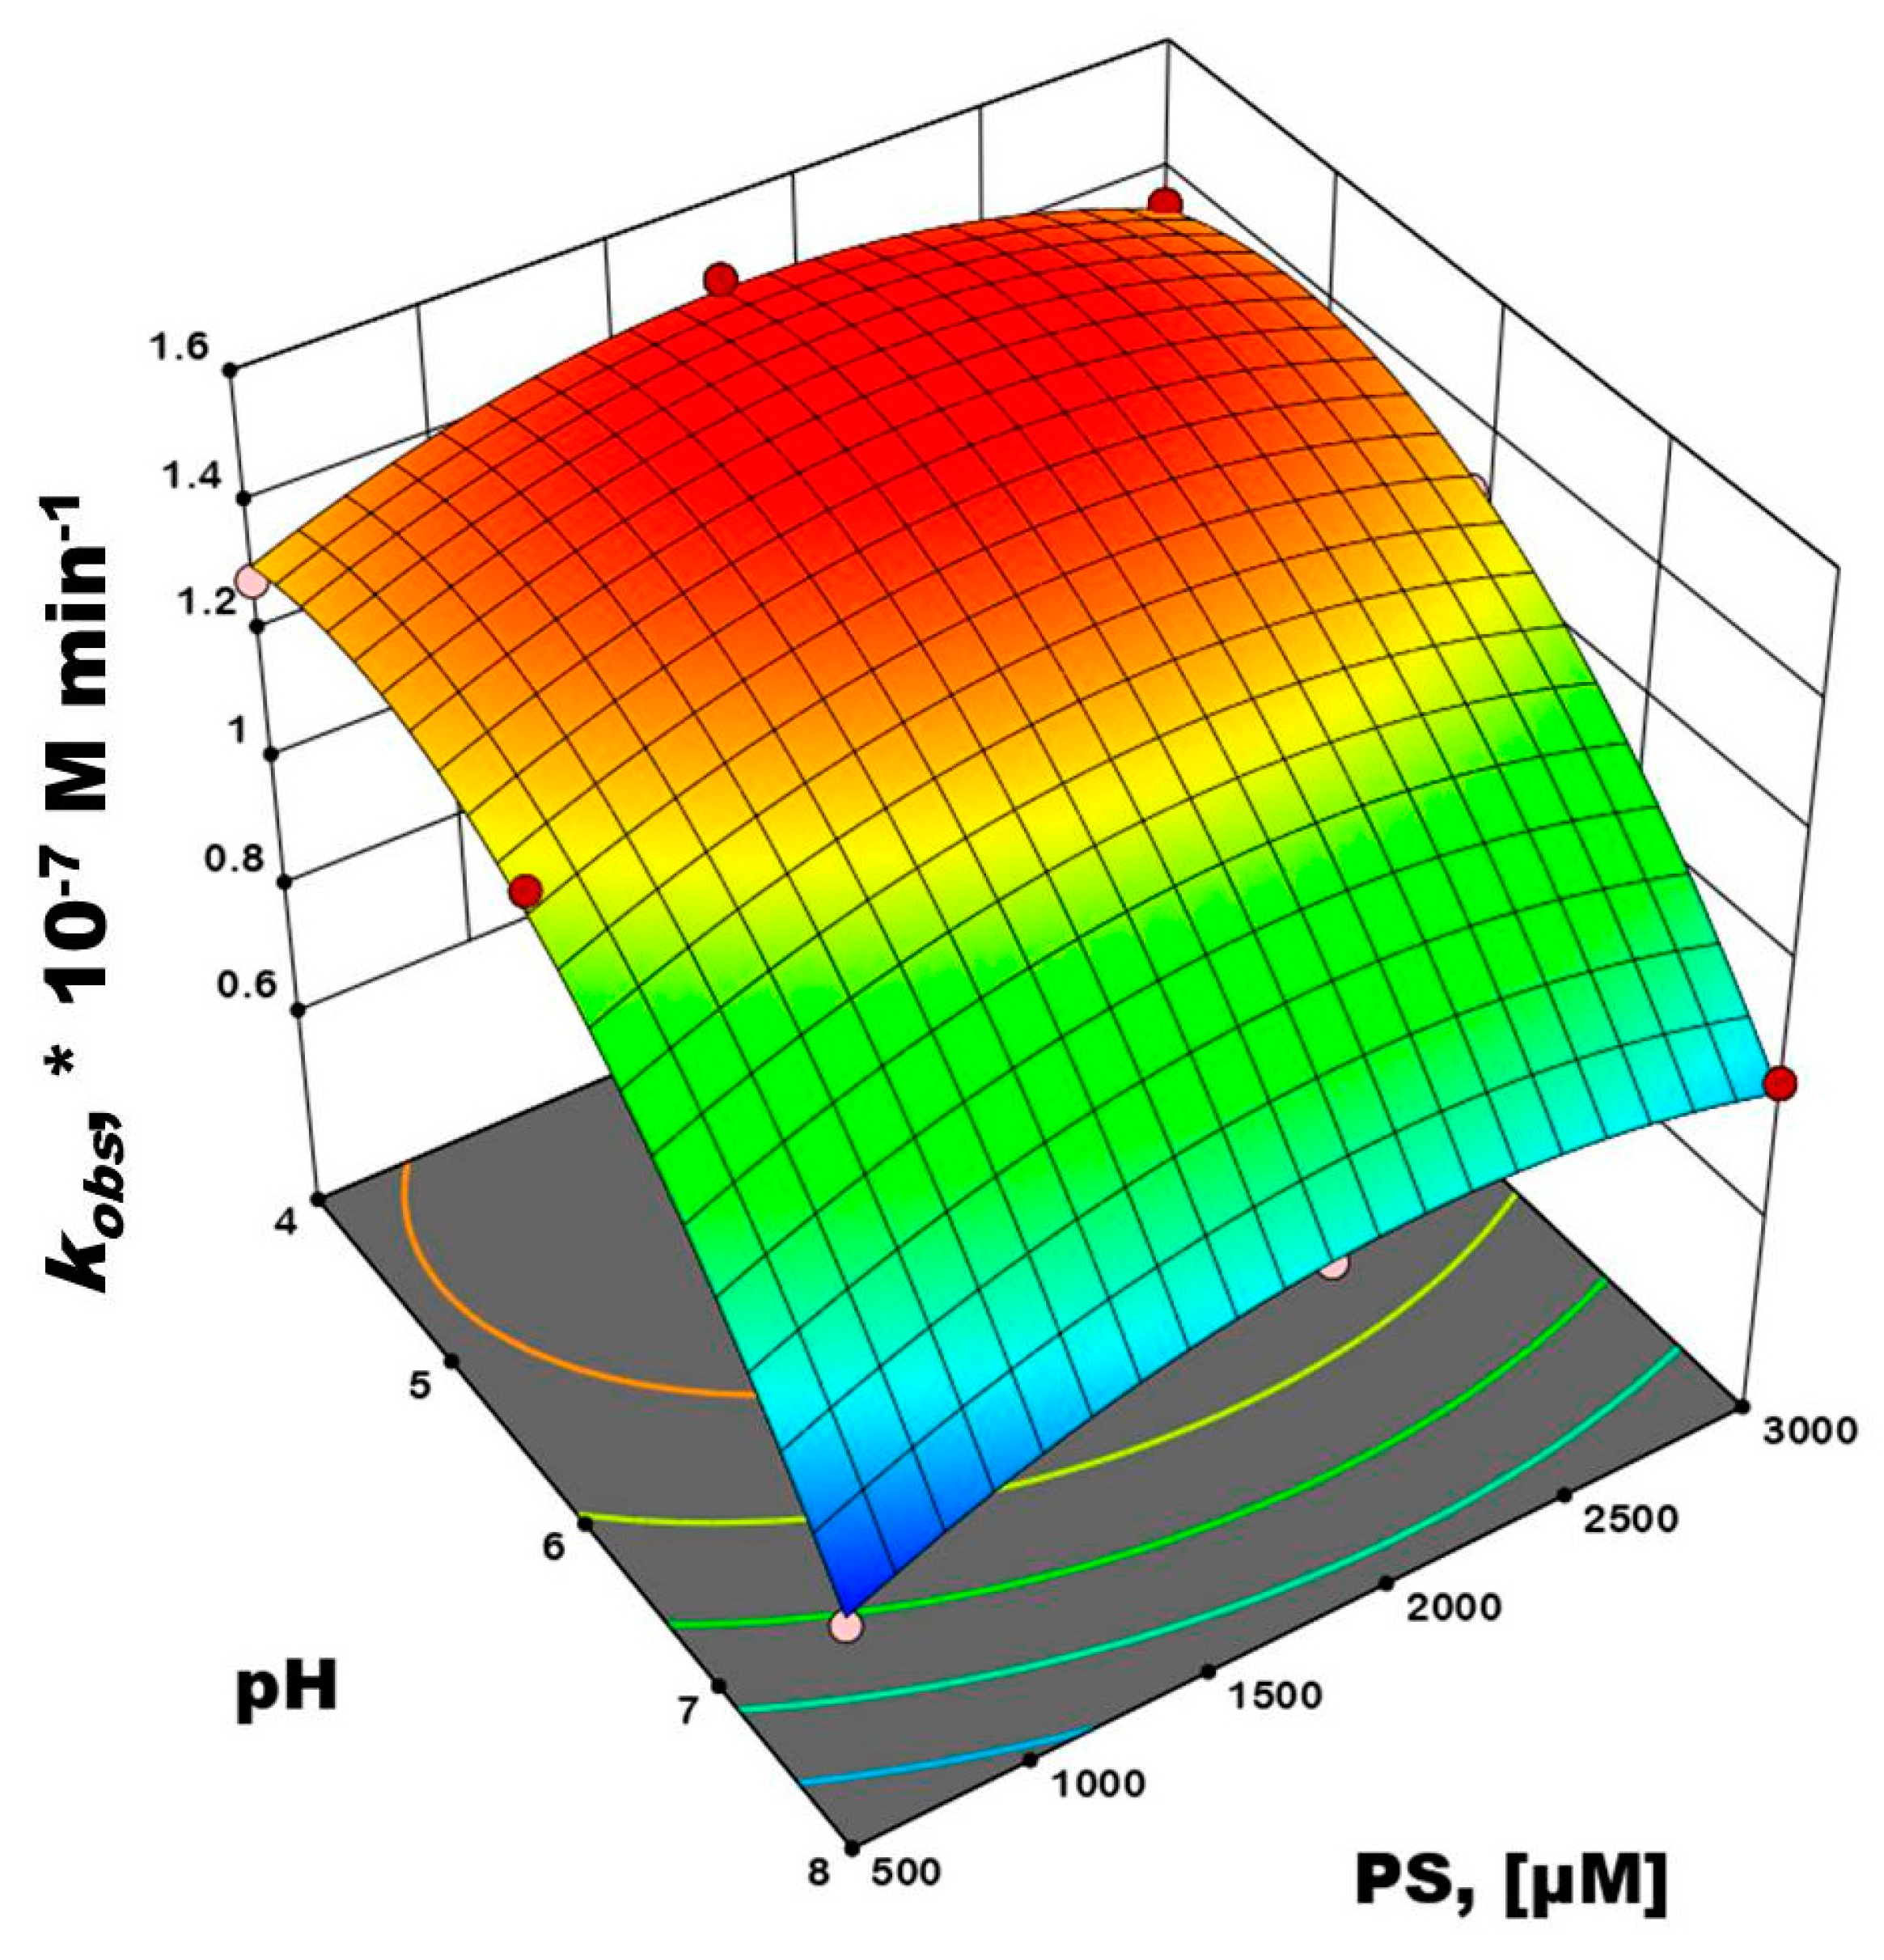
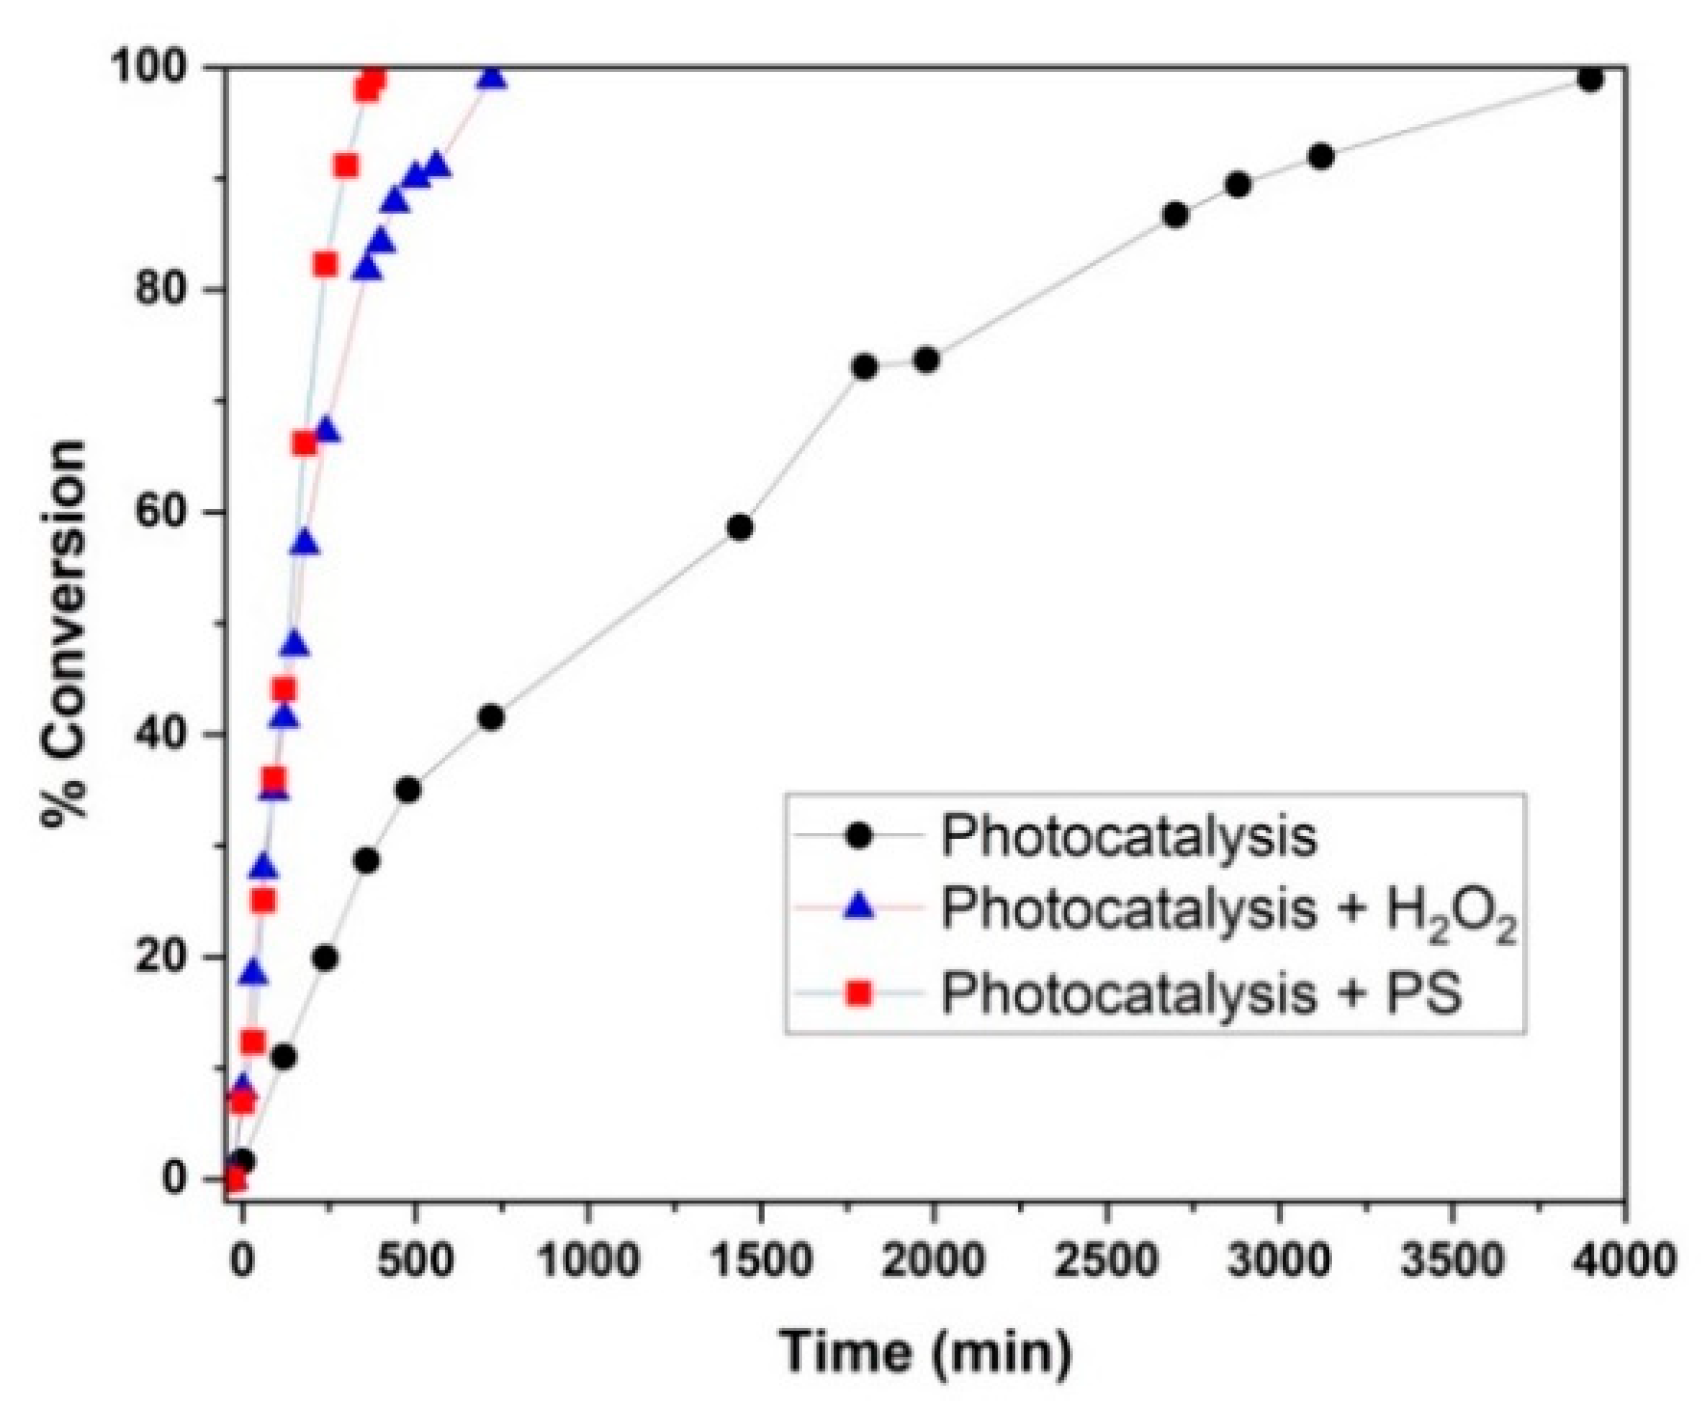
3.2. Photocatalytic Activity Tests
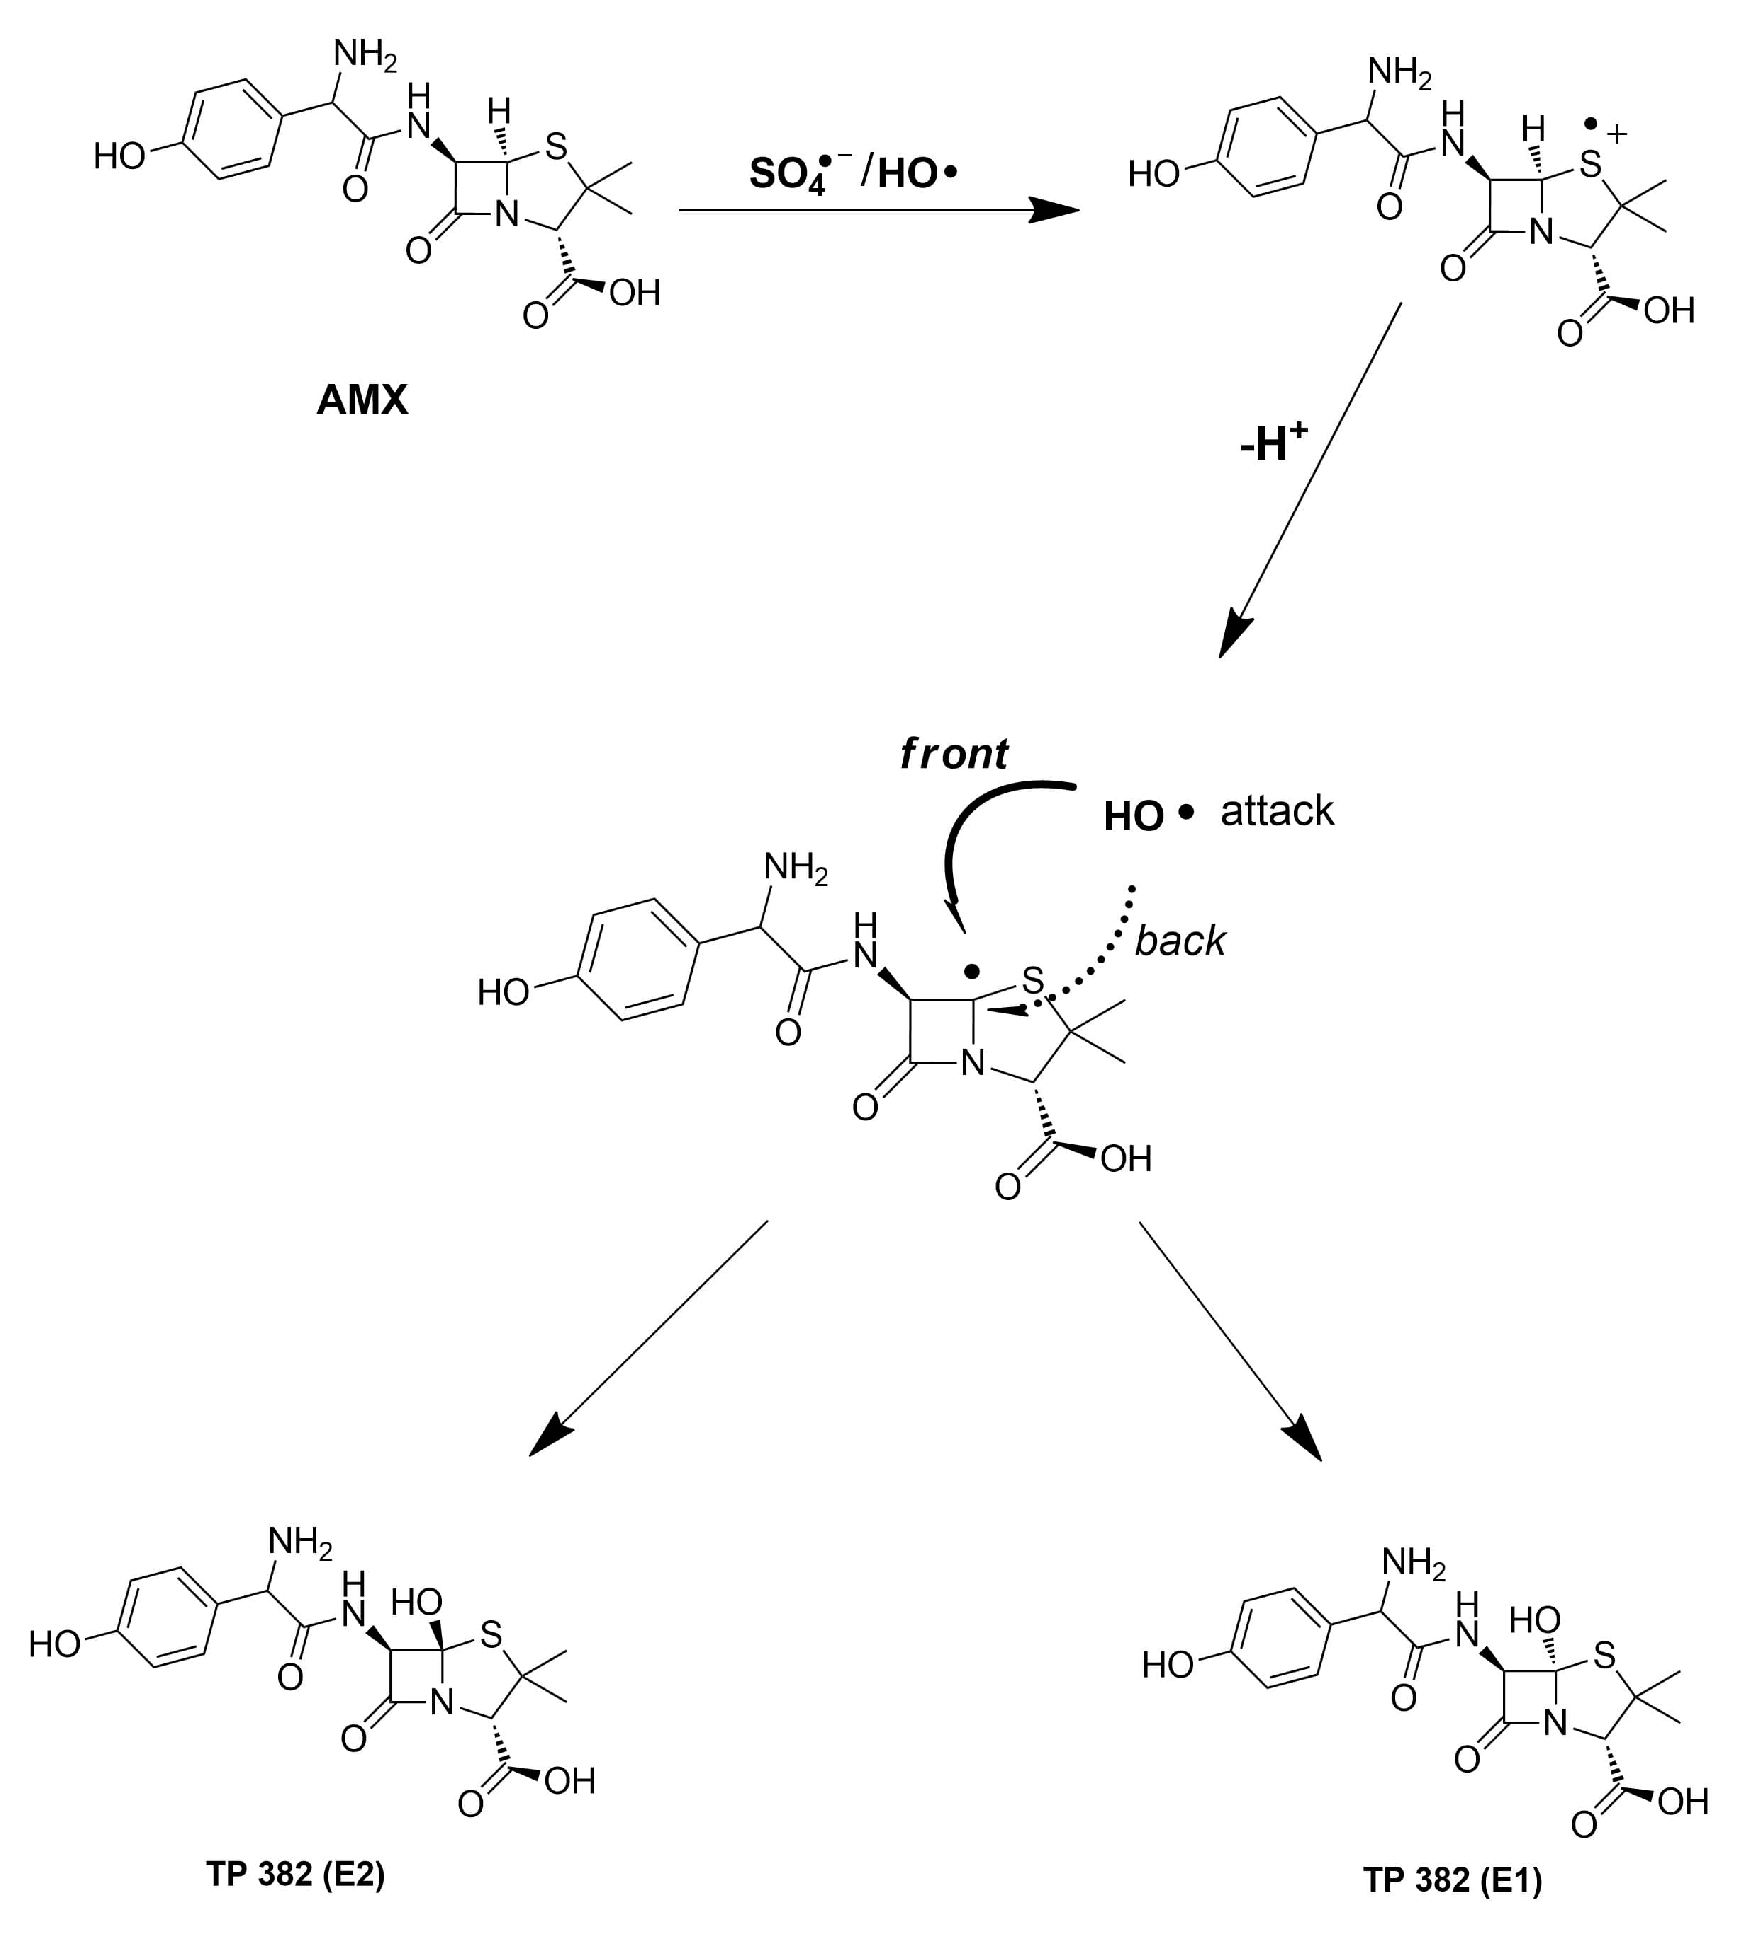
Preliminary experiments revealed a negligible effect of hydrolysis and photolysis on AMX concentration within the 90 min period (Figure 8a). Initial adsorption extents of AMX onto the prepared photocatalysts during the dark period (−30 to 0 min) were found to be infinitesimally small (<1.5%); thus, the observed removal extents of AMX during photocatalytic treatment were mainly approximated to the conversion extents. Such results were ascribed to the pKa values of AMX (pKa1 = 2.4, pKa2 = 7.4, and pKa3 = 9.6) [47] and the points of zero charge of TiO2–P25 (pHPZC = 6.5–6.7) [48,49,50], α-Fe2O3 (pHPZC = 6.2) [51], and Fe2O3/TiO2 (pHPZC = 5.8–6.8) [39,52,53]. Hence, at pH 5.5, AMX is mostly present in its neutral form/zwitterionic form (pKa1 (2.4) < pH < pKa2 = 7.4 [47], and the net surface charge of all prepared photocatalysts is positive, thus leading to less interaction between two moieties. Single- and multipoint BET surface areas of the prepared photocatalysts are presented in Table 3. Incorporation of α-Fe2O3 with TiO2–P25 generally decreased the surface area of the prepared nanocomposites. However, such changes in surface area did not greatly affect much the adsorption behavior of the prepared photocatalysts since electrostatic interaction (i.e., pKa and pHPZC) played a major role in this scenario.
The highest photocatalytic activity was achieved by 5% Fe2O3/TiO2, exhibiting 16.3% AMX conversion within the 90 min period, which was significantly higher compared to any of the nanocomposites and pure components (i.e., TiO2–P25 and α-Fe2O3) (Figure 8a). Such an improvement in photocatalytic activity was ascribed to the suppression of recombination of photogenerated e/h+ within the composite, as also proven and supported by PL spectroscopy (Figure 6) and photoelectrochemical experiments (Figure 7). Accordingly, 5% Fe2O3/TiO2 was selected as the photocatalyst to be immobilized onto glass support due to its superior photocatalytic activity to other prepared nanocomposites.
In Figure 8b, the presence of [PS] = 0.3 mM with 5% Fe2O3/TiO2 led to a significant increase in AMX conversion (35%). Such results are ascribed to additional SO4•− (and potentially HO) produced from PS, which serve as the electron acceptor and suppressor for e/h+ recombination [9]. The determination of excess [PS] is shown in Figure S3. For further optimization, 5% Fe2O3/TiO2 was immobilized on the glass support (Figure S4), and RSM modeling was applied to avoid the obtention of misleading information from the conventional “one-parameter-at-time” approach [1]. As can be seen from Figure S5, i.e., the kinetic profiles of AMX conversions for the vis-(5% Fe2O3/TiO2)/PS system operated in conditions set by 32 FFD (Table 1 and Table S1), the obtained results obeyed zero-order kinetics. Accordingly, AMX conversion rate constants (kobs) for the period of treatment under visible irradiation were calculated using Equation (2), representing the functional dependence of AMX conversion versus treatment time, implying a surface reaction mechanism for activation of PS [54,55,56]. Such calculated kobs values were used as system responses in RSM.
c 0 c = k o b s × t .  
It must be noted that all photocatalytic experiments included a 30 min dark period to ensure adsorption/desorption equilibrium (Figure S5). For pH 4 and 6, the net surface charge of 5% Fe2O3/TiO2 was positive, while AMX mostly existed in neutral form; as a result, the absorbed amount of AMX was less than 1.5%, which is a consequence of less attraction between two moieties. For pH 8, it is expected that the absorbed amount of AMX would be less as well, since the net charges of 5% Fe2O3/TiO2 and AMX would both be negative, and repulsion of negative charges is expected to be dominant. However, AMX removal was observed to be 37–40% within the 30 min dark period, which can be associated with the base activation of persulfate [57,58]. In this case, the base-catalyzed hydrolysis of persulfate yields hydroperoxide anions and sulfate ions (Equation (3)). Thereafter, additional persulfate ion reacts with hydroperoxide anion to yield sulfate radicals and superoxide radicals (Equation (4)). Lastly, sulfate radicals can react with hydroxide ions to produce hydroxyl radicals (Equation (5)) [57,58]. Hence, it must be noted that the AMX removal associated with base-catalyzed persulfate was not included in RSM modeling since its process was characterized as a nonphotochemical reaction. As such, only the photocatalytic treatment (i.e., 0 to 150 min) was included, expressed as the AMX conversion rate constant, (kobs).
S 2 O 8   2 + 2 H 2 O   O H   2 S O 4   2 + H O O + 3 H + .  
S 2 O 8   2 + H O O     S O 4   + S O 4   2 + O 2   + H + .
S O 4   + O H O H + S O 4   2 .  
Accordingly, multiple regression analysis was applied on the FFD matrix and AMX (kobs) values calculated for the treatment period under visible-light irradiation (Table S1), yielding a polynomial equation for the RSM model, Equation (6).
Y = 1.41 − 0.2967 × X1 + 0.2467 × X12 + 0.0433 × X2 − 0.1367 × X22 + 0.0275 × X1 × X2.
The obtained model was characterized by ANOVA (Table S2) and RD tools (Figure S6), and it was found to be significant (p = 0.0010) and accurate (R2 = 0.9956 and Radj2 = 0.9883). On the other hand, RD revealed that (i) there were no violations in the assumptions that errors were normally distributed and independent of each other, (ii) the error variances were homogeneous, and (iii) the residuals were independent. ANOVA analysis also revealed that model terms corresponding to both process parameters (i.e., pH and [PS]) were significant, (p ≤ 0.05). (Table S2). Therefore, this model can be used as a tool to clearly discuss the influence of studied parameters on AMX conversion. The 3D surface and contour representations of the influence of initial pH and [PS] on AMX conversion rate (kobs), are shown in Figure 9.
As can be observed from Figure 9, an acidic pH (pH 4 to 6) was favorable for AMX conversion, which was associated with a high concentration of SO4•− (Eo = 2.5–3.1 V vs. NHE), consisting of a higher oxidation potential than HO (Eo = 2.5–3.1 V vs. NHE) [59]. In addition, sulfate radicals are also dominant in acidic pH (pH 4 to 6) as described by Equations (7) and (8) [60,61]. An increase in pH toward basic range would lead to a decrease in the AMX conversion rate, which can be described by Equation (5) [62].
S 2 O 8   2 + H + H S 2 O 8 .  
H S 2 O 8 S O 4   + H S O 4   .
An increase in PS concentration was directly proportional to an enhancement of the AMX conversion rate up to the point where a further increase promoted a negative effect. Such a decrease in AMX conversion rate can be attributed to excess PS concentration, which promotes scavenging and terminates the formed radical species, as described in Equations (9)–(12) [63].
S 2 O 8   2 + S O 4   S 2 O 8   + S O 4   2 .  
  S 2 O 8   2 + O H H S O 4 + S O 4   + 0.5 O 2   .
  S O 4   + S O 4   S 2 O 8   2 .  
  S O 4   + O H H S O 4 + 0.5 O 2   .
On the basis of the results presented in Figure 9, the optimum conditions for AMX conversion were pH 4.808 and a PS concentration of approximately 1873 μM, which were accurately calculated by maximizing the polynomial equation in Equation (6); thus, the predicted AMX conversion rate was 1.51 × 10⁻⁷ M·min−1. Accordingly, the obtained optimum conditions were further used as the basis for H2O2-assisted photoconversion experiments, which were later compared for the investigation of the AMX conversion mechanism, transformation byproducts, and toxicity studies.
As shown in Figure 10, three photocatalytic processes (i.e., photocatalysis, photocatalysis + H2O2, and photocatalysis + PS) were compared on the basis of their AMX conversion profiles upon reaching <99%. Photocatalysis + PS was shown to be the fastest, reaching the full %AMX conversion within 380 min. Photocatalysis + H2O2 also showed improved full AMX conversion (within 720 min) compared to photocatalysis alone (3900 min). Photocatalysis only relies on photogenerated h+, O2•−, and HO as ROS for AMX conversion (Equations (13)–(16)). Accordingly, 5% Fe2O3/TiO2 can be excited using visible light to yield photogenerated e/h+ (Equation (13)). Thereafter, photogenerated e reacts with O2 (dissolved in water) to form O2•− (Equation (14)) [13,64,65]. Photogenerated h+ accumulated in the valence band (VB) of Fe2O3 may react with OH to form HO (Equation 15) [64], and photogenerated h+ may directly react with AMX (adsorbed at the catalyst surface), thereby producing transformation byproducts (Equation (16)).
5 %   F e 2 O 3   / T i O 2   + h v   ( v i s i b l e   l i g h t ) e   C B + h   V B + .
e   C B + O 2     O 2   .  
h   V B + + O H O H .  
h   V B + + A M X A M X   ( p r o d u c t s ) .  
The improved AMX conversion via photocatalytic processes with oxidants can be ascribed the reactions of photogenerated e with H2O2 and PS to form HO and SO4•−, respectively (Equations (17) and (18)) [66].
e   C B + H 2 O 2   O H + O H .
e   C B + S 2 O 8   2 S O 4   2 + S O 4   .  

3.3. Mechanism

The AMX conversion mechanisms via photocatalysis, photocatalysis + H2O2, and photocatalysis + PS systems were studied in the presence of ROS scavengers (Figure 11). FA was used for scavenging photogenerated h+, while BQ was used to scavenge O2•− (k = (0.9–1.0) × 109 M−1·s−1) [67,68]. MeOH and t-BuOH were used to differentiate the contributions of SO4•− and HO. In such a case, MeOH reacts with both SO4•− and HO (k = 1.1 × 10⁷ M−1·s−1 and k = 9.7 × 10⁸ M−1·s−1, respectively) [69,70]. Conversely, t-BuOH reacts three-orders-of-magnitude higher with HO (k = 9.7 × 10⁸ M−1·s−1, than with SO4•− k = (4.0 − 9.1) × 105 M−1·s−1 [66]), thus making t–BuOH as an efficient scavenger for HO.
The AMX conversion and kinetic profiles achieved by photocatalysis in the presence of ROS scavengers are shown in Figure 11a,d, respectively. The highest inhibition of AMX conversion occurred in the presence of FA, resulting in only 12% AMX degradation (comparing to 35% obtained in the absence of any scavenger). This indicated that photogenerated h+ plays the main role in AMX photocatalytic conversion. Similarly, Zhu et al. reported that the Fe2O3–TiO2/fly ash cenosphere composite’s main active species for degradation of methylene blue were also photogenerated h+ [71]. Furthermore, it was observed that AMX conversion was reduced to 31% and 26% in the presence of BQ and t-BuOH, respectively. Such results indicated that HO plays a more significant role than O2•−. Hence, the order of ROS in decreasing contribution under the photocatalysis process is as follows: h+ > HO > O2•−.
The AMX conversion and kinetic profiles achieved by photocatalysis + H2O2 in the presence of ROS scavengers are shown in Figure 11b,e, respectively. The highest inhibition of AMX conversion occurred in presence of FA, resulting in an 8% reduction compared to the case without scavengers (40% and 48% AMX degradation, respectively). This indicates that photogenerated h+ plays a major role in AMX conversion. Similarly, Monteagudo et al. reported the dominant role of h+ in the solar–TiO2/H2O2 system for degradation of aniline [66]. AMX conversion in presence of t–BuOH was reduced to 44%. It is important to note that, even though h+ plays the major role, the HO contribution is nearly the same, as shown by the comparison of their rate constants (Figure 11e). Lastly, the presence of BQ reduced AMX conversion only to 46%, showing that superoxide radical plays a minor role in the overall process. Hence, the order of ROS in decreasing contribution in the photocatalysis + H2O2 process is as follows: h+ ≥ HO > O2•−.
The AMX conversion and kinetic profiles achieved with photocatalysis + PS in the presence of ROS scavengers are shown in Figure 11c,f, respectively. FA promotes the greatest inhibition among all scavengers used, yielding an AMX conversion of only 13% (compared to 55% in the case with no scavenger), implying that photogenerated h+ plays a major role in AMX conversion. Similar results were obtained upon performing persulfate activation-related processes such as solar/TiO2/S2O82− [63], solar/TiO2–Fe2O3/PS [9], and vis–TiO2/FeOCl/PS [72], which all reported that photogenerated h+ was the main oxidative species. On the other hand, AMX conversion was reduced to 20% and 45%, in the presence of MeOH and t–BuOH, respectively. Accordingly, SO4•− plays a more significant role than HO, as expected due to the acidic conditions applied. The presence of BQ resulted in rather low inhibition, up to 47.5% of AMX degraded, suggesting that O2•− only contributes a minor role. Therefore, the overall order of ROS in decreasing contribution by photocatalysis + PS is as follows: h+ > SO4•− > HO > O2•−.
The combined mechanism of the three photocatalytic systems is shown in Figure 12. The combination of TiO2 and Fe2O3 leads to the formation of a Type 1 heterojunction [5], where the valence band (VB) and conduction band (CB) of Fe2O3 are in between the VB and CB of TiO2, (Figure 12, before contact). However, such a heterojunction formation is unfavorable for the effective separation of photogenerated charges (e/h+) due to the migration/accumulation to Fe2O3. Xia et al. [64], Liu et al. [65], and Mei et al. [44] proposed that, in order to achieve greater charge separation between Fe2O3 and TiO2, the fermi level of each semiconductor must be equalized. Thereafter, photogenerated electrons can flow from the CB of Fe2O3 to the CB of TiO2 under visible–light irradiation (Figure 12, After Contact). Additionally, photogenerated e can react with O2, H2O2, and S2O82−, yielding O2•−, HO, and SO4•−, respectively, while photogenerated holes react directly with AMX and HO, forming HO.

3.4. AMX Transformation Byproducts and Toxicity Evaluation
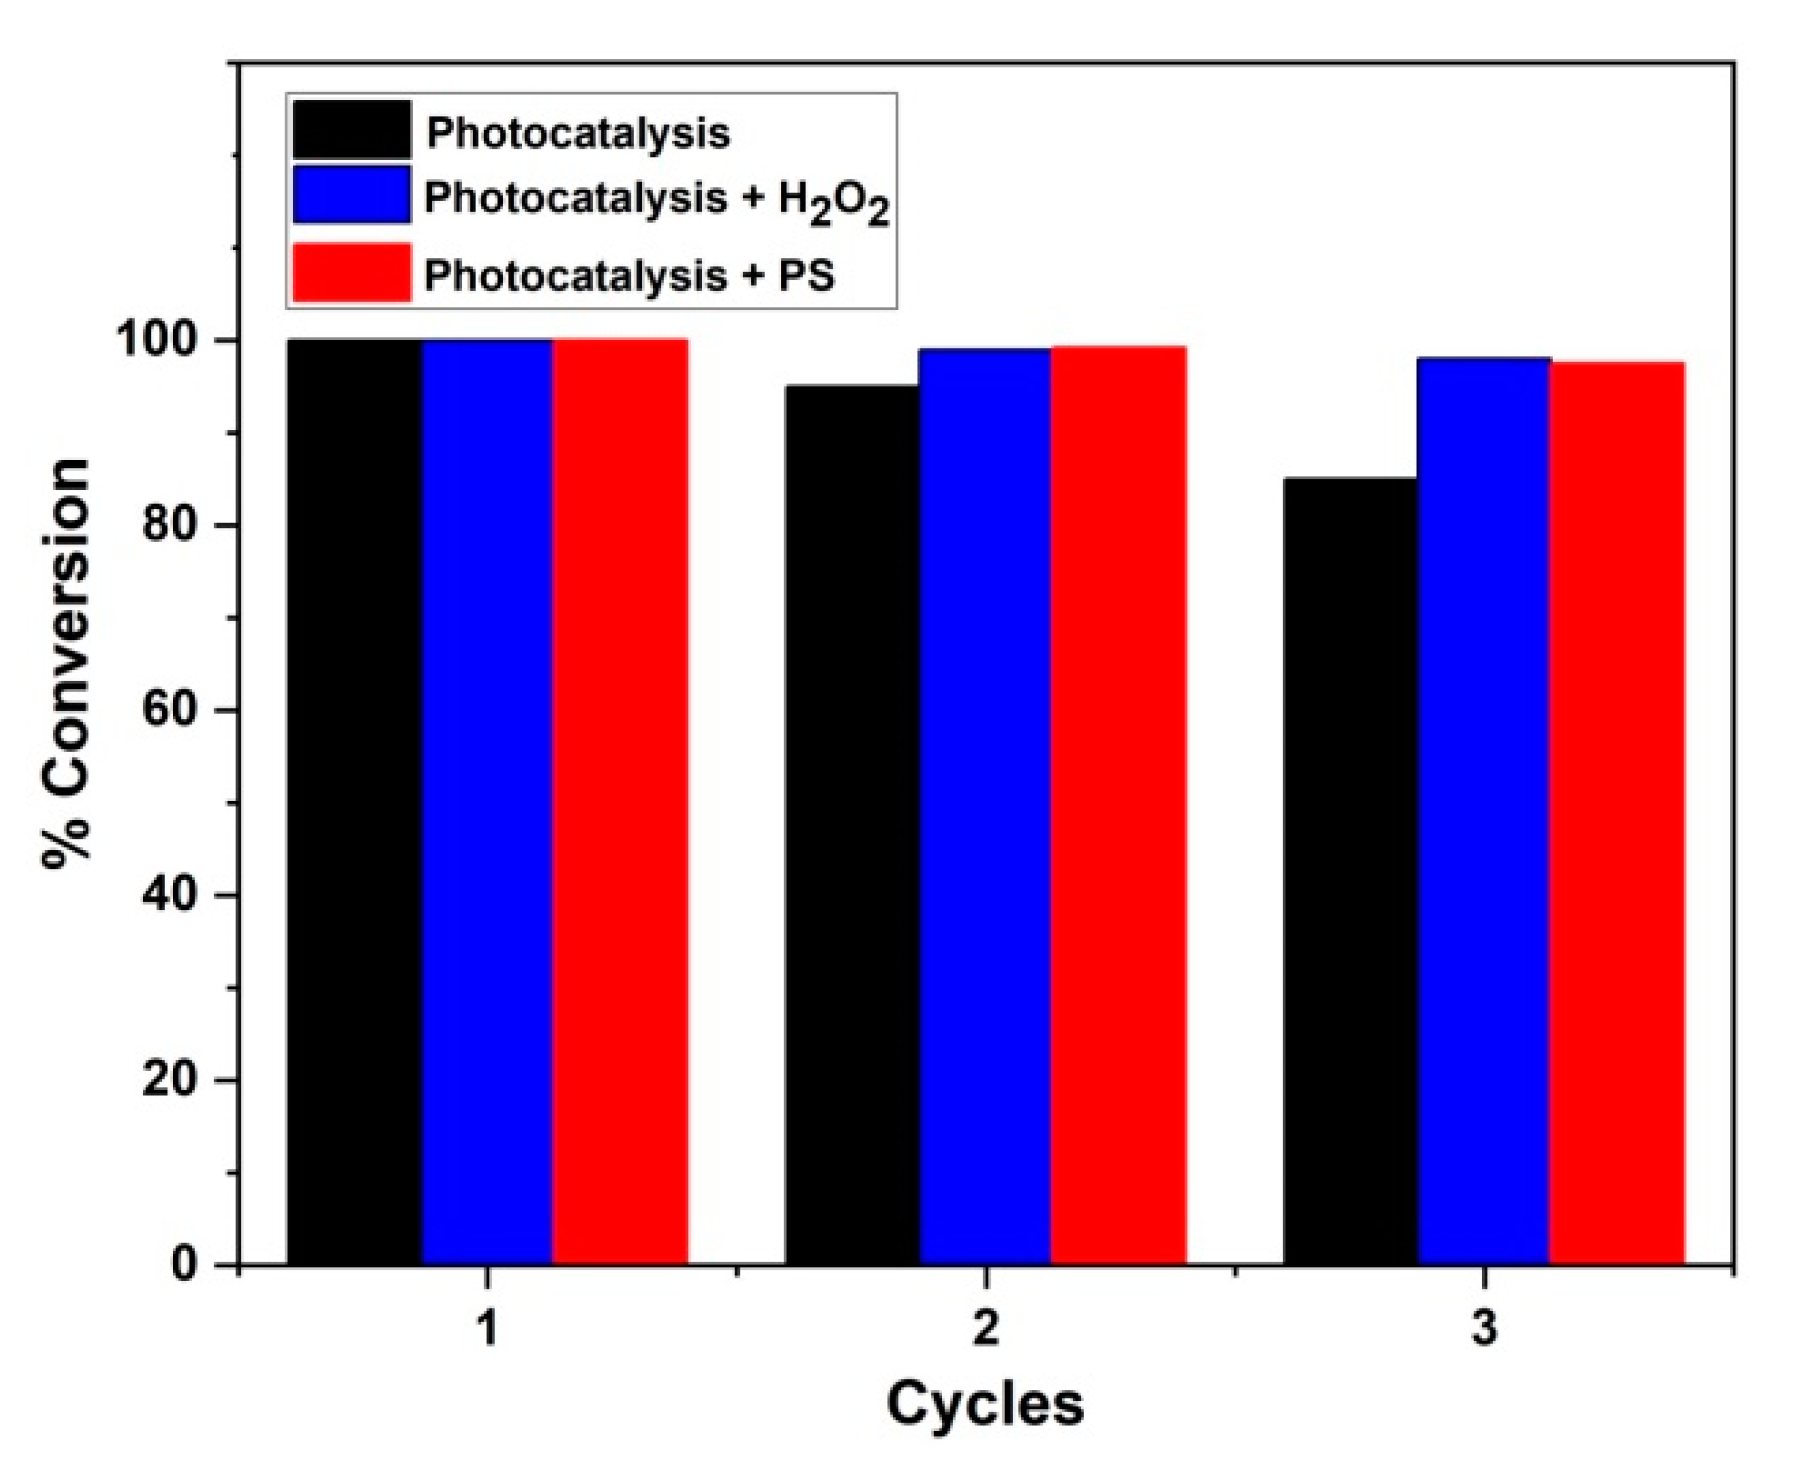
The transformation products (TPs) of AMX in photocatalysis, photocatalysis + H2O2, and photocatalysis + PS systems were investigated and identified using LC–HRMS-orbitrap in positive and negative modes. The TPs detected and their corresponding mass spectra are presented in Table S3 and Figures S7–S14, respectively. The annotated Δmass (error) between the experimental mass-to-charge ratio (m/z) and theoretical values (m/z) values of all proposed chemical formula was less than ± 2 ppm with an FISh coverage score ≥43.50, which allows accuracy in the assignment of elemental composition and fragment ion elucidation, respectively. It must be noted that only results from positive modes were elucidated, since all results from negative modes showed FISh coverage ≤40%. As shown in Figure 13, three TPs (TP 384 (H1), TP 384 (H2), and TP 366) were detected in all processes studied. TP 384 (H1) and TP 384 (H2) correspond to penicilloic acid (C16H21N3O6S) (i.e., the hydrolysis byproduct of AMX), which is formed via the reaction of H2O molecule with the strained four-membered β-lactam ring of AMX [73,74]. TP 366 corresponds to amoxicillin 2′,5′-diketopiperazine (C16H19N3O5S), which is formed via the loss of H2O and then further condensation of TP 384 (H1) or TP 384 (H2) [75].
TP 367 was detected in both photocatalysis and photocatalysis + H2O2 treatments, which can be attributed to two-step successive transformation (i.e., (1) oxidative deamination, and (2) reduction to alcohol) of AMX (Figure S15). Oxidative deamination byproducts formation of β-lactam derivatives is ascribed to the abstraction of α-hydrogen atoms, leading to the formation of a carbonyl derivative [76]. In such a case, the >CH-NH2 moiety of AMX can be transformed into an imine moiety >CH=NH; then, further cleavage of the carbon–nitrogen double bond occurs, yielding a C=O moiety, TP (m/z) = 365. However, it must be noted that the intermediate TP (m/z) = 365 was not detected in any of the photocatalytic processes studied since its carbonyl moiety is further reduced to alcohol, forming the detected derivative, TP 367. The involved reduction reaction may be attributed to photocatalytic hydrogenation of TP 365 with the assistance of AMX as a “self” hydrogen donor (H+) and sacrificial agent. Similarly, Wei et al. reported simultaneous hydrogen production and degradation of AMX using Bi spheres-g-C3N4 [77] and MoS2@ZnxCd1−xS [78], supporting the assumption that persistent organic pollutants can be used as sacrificial electron donors. Conventionally, low C-atom alcohols (i.e., methanol, ethanol, isopropanol, triethanolamine, etc.) and low C-atom carboxylic acids (i.e., lactic acid) are used as sacrificial electron donors for photocatalytic hydrogenation and H2 production [5,79]. In this case, it can be assumed that AMX and its byproducts (i.e., low C-atom species) mimic the role of lower C-atom alcohols in photocatalytic hydrogenation/hydrogen-forming reactions.
Three oxidation TPs (TP 382 (S–O), TP 382 (E1), and TP 382 (E2)) were detected in both photocatalysis + H2O2 and photocatalysis + PS treatment processes. Accordingly, TP 382 (S–O) was formed via attack of SO4•− and/or HO on the sulfur atom of the thioether moiety via an electron transfer mechanism, as confirmed by molecular orbital calculations [74]. TP 382 (E1) and TP 382 (E2) are ascribed to monohydroxylation of AMX. The AMX reaction centers that are susceptible to HO attack are illustrated in Figure 13. According to the MS2 results, hydroxylation on the methyl groups (C3a and C3b) and aromatic ring (C11–14) was ruled out due to detection of fragments (m/z) 131.01610, and 107.04916, respectively (Figure S8). Moreover, the fragment proposed by Trovo et al., C7H13N2O3S (m/z = 189.0686), and other related fragments [73], which account for hydroxylation at the N-8 position (Figure 13), were not detected in this study. Instead, the m/z = 189.06583 fragment was detected, which was ascribed to C10H9N2O2, as proposed by Compound DiscovererTM (Figure S8). Both SO4•− and HO are expected to attack the sulfur atom of AMX to generate a sulfur-centered radical cation via an electron transfer mechanism [74]. Thereafter, this radical cation can be deprotonated to generate the α-thioether radical, which is susceptible to hydroxylation (Figure 14). As such, TP 382 (E1) and TP 382 (E2) are proposed since hydroxylation can occur on the positive/negative lobe of the α-thioether radical’s vacant p-orbital [80].
The evolution and conversion profiles of TPs obtained from three different photocatalytic processes are presented in Figure 15a–c and correlated with toxicity profiles in Figure 15d–f, respectively. As can be seen in Figure 15a (photocatalysis), four byproducts were detected: TP 366, TP367, and the hydrolysis byproducts TP 384 (H1) and (H2). As compared to process toxicity profile (Figure 15d), it can observed that the sample reached the maximum 4.15 toxicity units (more toxic than initial level) at 25% AMX conversion. This result can be ascribed to TP 366 evolution, which also reached its maximum area at the same point (i.e., 25% AMX conversion). Specifically, TP 366 is amoxicillin 2′,5′-diketopiperazine, a known rearranged hydrolysis product of AMX, which has already been detected in Israel water effluents [75] and Spain river water samples [81]. Nevertheless, it must be noted that toxicity units dropped to 1.12 after reaching 50% AMX conversion, which also coincides with the decrease in TP 366 concentration. Although TP 384 (H2) is the dominant byproduct in the photocatalysis process, it had a minor contribution to the overall toxicity. TP 367 also had a minor contribution to overall toxicity, despite increased formation (50–99% AMX conversions extents). Clearly, the spike in toxicity units is directly linked to TP 366 formation.
As shown in Figure 15b (photocatalysis+ H2O2), seven byproducts were detected: TP 366, TP 367, TP 382 (E1 and E2), TP 382 (S–O), and TP 384 (H1 and H2). As compared to the process toxicity profile (Figure 15e), it can be observed that the sample reached the maximum of 3.01 toxicity units (more toxic than initial level) at 10% AMX conversion. This result can be ascribed to combined toxicity of TP 382 (S–O) with TP 366 and TP 384 (H1). It must be noted that TP 382 (S–O) also reached its maximum area at the same point (i.e., 10% AMX conversion). As reported in the literature, TP 382 (S–O) was found to be a contributor to the overall toxicity on persulfate-treated AMX aqueous solution [9]. Accordingly, toxicity units dropped to 1.52 upon reaching 25% AMX conversion, which coincides with the decrease in TP 382 (S–O) concentration. The maximum of TP 366 was reached at 50% AMX conversion, exhibiting no abrupt effect on the toxicity of the sample. Such results may be ascribed to the “antagonistic” effect of other TPs, such as the presence TP 384 (H1), which may have eventually led to the reduced toxicity of TP 366.
In Figure 15c (photocatalysis + PS), six byproducts were detected: TP 366, TP 382 (E1) and (E2), TP 382 (S–O), and TP 384 (H1 and H2). As compared to the process toxicity profile (Figure 15f), it can observed that the sample reached the maximum of 2.53 toxicity units (more toxic than initial level) at <99% AMX conversion. This result can be ascribed to the increased formation of TP 382 (E1) and (E2), as well as TP 382 (S–O), which also reached their maximum concentrations at the same point (i.e., <99% AMX conversion). All remaining TPs (i.e., TP 366, TP 367, and TP 384 (H1 and H2)) showed no synergistic and/or antagonistic effect on the overall toxicity.

3.5. Stability Test

Stability tests were performed for three consecutive cycles using the immobilized 5% Fe2O3/TiO2 photocatalyst with the optimum conditions obtained in Section 3.2. As shown in Figure 16, AMX conversion of <99% was achieved in three consecutive cycles of photocatalytic experiments containing PS and H2O2. However, 95% and 85% AMX conversions were achieved in the second and third cycles, respectively, of the sole photocatalysis process. The loss of activity of the immobilized photocatalyst during photocatalysis (without oxidant) in consecutive cycles was mainly due to overexposure (3900 min/cycle) compared to other processes containing PS and H2O2 (380 and 720 min/cycle, respectively).

4. Conclusions

Fe2O3/TiO2 nanocomposites were successfully prepared using an impregnation/calcination technique of TiO2-P25 and Fe(NO3)3·9H2O. XRD and RS analyses revealed that the obtained iron oxide was hematite, α-Fe2O3. Moreover, XRD, RS, XPS, and SEM/EDXS showed successful incorporation of α-Fe2O3 with TiO2. DRS results showed improved visible-light absorption and a decrease in overall bandgap values of Fe2O3/TiO2 nanocomposites upon increasing α-Fe2O3 content. Electrochemical experiments (EIS and photocurrent responses) revealed improved charge separation (e/h+) of the obtained nanocomposite compared to its individual components (i.e., TiO2 and α-Fe2O3). Specifically, 5% (w/w) Fe2O3/TiO2 showed the highest photocatalytic activity based on preliminary photocatalytic experiments, as well as on the PL spectroscopy results. The results obtained from RSM modeling showed optimum conditions of [PS] = 1.873 mM and pH 4.808. Photocatalysis + PS achieved fastest AMX conversion, possessing a higher zero-order rate constant (k = 1.51 × 10⁻⁷ M·min−1) compared to photocatalysis + H2O2 (k = 1.11 × 10⁻⁷ M·min−1) and photocatalysis only (k = 0.35 × 10⁻⁷ M·min−1). ROS scavenging showed that photogenerated h+ played the major role for AMX conversion in all processes. Toxicity changes of AMX solution were associated with TP 366 during photocatalysis, TP 382 (S–O) during photocatalysis + H2O2, and hydroxylated TPs (i.e., TP 382 (S–O) and TP 382 (E1 and E2)) during photocatalysis + PS. It is important to note that these AMX TPs greatly affected the toxicity of AMX solution during treatment in general.

Supplementary Materials

The following supporting information can be downloaded at https://www.mdpi.com/article/10.3390/nano12234328/s1: Figure S1: Images of TiO2 (P25) and Fe2O3/TiO2 nanocomposites; Figure S2: Full spectrum coverage of LED used in PEC tests; Figure S3: Photocatalytic removal of AMX using prepared 5% Fe2O3/TiO2 under visible-light irradiation with different PS concentration: (a) removal profile; (b) % removal per different PS concentration. Conditions: [catalyst dosage] = 0.5 g/L; [AMX] = 0.05 mM; initial pH = natural pH (5.5); Figure S4: Image of immobilized 5% Fe2O3/TiO2 nanocomposite onto glass support; Figure S5: AMX photocatalytic treatment by vis-(5% Fe2O3/TiO2)/PS. Experimental conditions set by FFD (Table S1); Figure S6: Residual diagnostics of RSM model predicting AMX removal rate constants (kobs) by vis-(5% Fe2O3/TiO2)/PS process after 150 min treatment: (A) observed vs. predicted plot, (B) normal probability plot, and (C) internally studentized residuals vs. predicted values plot; Figure S7: MS and MS2 spectra of AMX; Figure S8: MS and MS2 spectra of TP 382 (E1); Figure S9: MS and MS2 spectra of TP 382 (E2); Figure S10: MS and MS2 spectra of TP 382 (S–O); Figure S11: MS and MS2 spectra of TP 384 (H1); Figure S12: MS and MS2 spectra of TP 384 (H2); Figure S13: MS and MS2 spectra of TP 367; Figure S14: MS and MS2 spectra of TP 366; Figure S15. Formation of TP 365 (m/z = 365) and TP 367; Table S1: FFD matrix for AMX removal rate constants (kobs) by vis-(5% Fe2O3/TiO2)/PS process after 150 min treatment; Table S2: Analysis of variance (ANOVA) of RSM model predicting AMX removal rate constants (kobs) by vis-(5% Fe2O3/TiO2)/PS process after 150 min treatment; Table S3: Accurate mass measurements determined using LC–MS-Orbitrap of protonated AMX conversion products and their corresponding fragment ions. References [73,74,82,83,84] are cited in the supplementary materials

Author Contributions

Conceptualization, F.M.d.R., H.K. and M.P. (Mira Petrović); methodology, F.M.d.R., M.P. (Marin Popović), J.P.Z., G.R., M.K.R., M.K., M.J.F., B.G., U.L.Š. and H.K.; software, F.M.d.R., M.P. (Marin Popović), M.K.R., M.K., M.J.F., B.G. and H.K.; validation, F.M.d.R., M.P. (Marin Popović), J.P.Z., M.K.R., M.J.F. and H.K.; formal analysis, F.M.d.R., M.P. (Marin Popović), J.P.Z., M.K.R. and M.J.F.; investigation, F.M.d.R., M.P. (Marin Popović), J.P.Z., G.R., M.K.R. and M.J.F.; resources, M.K.R., M.J.F.,.B.G., U.L.Š., H.K., A.L.B. and M.P. (Mira Petrović); data curation, F.M.d.R., M.P. (Marin Popović), J.P.Z., G.R., M.K.R., M.K., M.J.F., B.G., U.L.Š., A.L.B., H.K. and M.P. (Mira Petrović); writing—original draft preparation, F.M.d.R. and H.K.; writing—review and editing, F.M.d.R., U.L.Š., A.L.B., H.K. and M.P. (Mira Petrović); visualization, F.M.d.R. and H.K.; supervision, H.K. and M.P. (Mira Petrović); project administration, H.K. and M.P. (Mira Petrović); funding acquisition, H.K. and M.P. (Mira Petrović). All authors have read and agreed to the published version of the manuscript.

Funding

This project has received funding from the European Union’s Horizon 2020 research and innovation programme under the Marie Skłodowska-Curie Actions grant agreement No. 812880; NOWELTIES project.

Data Availability Statement

The data presented in this study are available upon reasonable request from the corresponding author.

Conflicts of Interest

The authors declare no conflict of interest.

References

  1. Chong, M.N.; Jin, B.; Chow, C.W.K.; Saint, C. Recent developments in photocatalytic water treatment technology: A review. Water Res. 2010, 44, 2997–3027. [Google Scholar] [CrossRef] [PubMed]
  2. Pichat, P. Photocatalysis and Water Purification: From Fundamentals to Recent Applications; Wiley: Berlin, Germany, 2013. [Google Scholar]
  3. Schneider, J.; Matsuoka, M.; Takeuchi, M.; Zhang, J.; Horiuchi, Y.; Anpo, M.; Bahnemann, D.W. Understanding TiO2 photocatalysis: Mechanisms and materials. Chem. Rev. 2014, 114, 9919–9986. [Google Scholar] [CrossRef] [PubMed]
  4. Pelaez, M.; Nolan, N.T.; Pillai, S.C.; Seery, M.K.; Falaras, P.; Kontos, A.G.; Dunlop, P.S.M.; Hamilton, J.W.J.; Byrne, J.A.; O’Shea, K.; et al. A review on the visible light active titanium dioxide photocatalysts for environmental applications. Appl. Catal. B Environ. 2012, 125, 331–349. [Google Scholar] [CrossRef] [Green Version]
  5. Perović, K.; dela Rosa, F.M.; Kovačić, M.; Kušić, H.; Štangar, U.L.; Fresno, F.; Dionysiou, D.D.; Bozic, A.L. Recent achievements in development of TiO2-based composite photocatalytic materials for solar driven water purification and water splitting. Materials 2020, 13, 1338. [Google Scholar] [CrossRef] [Green Version]
  6. Li, J.; Chu, D. Energy band engineering of metal oxide for enhanced visible light absorption. In Multifunctional Photocatalytic Materials for Energy; Elsevier Ltd.: Amsterdam, The Netherlands, 2018; pp. 49–78. [Google Scholar]
  7. Lanzl, C.A.; Baltrusaitis, J.; Cwiertny, D.M. Dissolution of hematite nanoparticle aggregates: Influence of primary particle size, dissolution mechanism, and solution pH. Langmuir 2012, 28, 15797–15808. [Google Scholar] [CrossRef]
  8. Khasawneh, O.; Palaniandy, P. Removal of organic pollutants from water by Fe2O3/TiO2 based photocatalytic degradation: A review. Environ. Technol. Innov. 2021, 21, 101230. [Google Scholar] [CrossRef]
  9. dela Rosa, F.M.; Papac, J.; Garcia-Ballesteros, S.; Kovačić, M.; Katančić, Z.; Kušić, H.; Božić, A.L. Solar Light Activation of Persulfate by TiO2/Fe2O3 Layered Composite Films for Degradation of Amoxicillin: Degradation Mechanism, Matrix Effects, and Toxicity Assessments. Adv. Sustain. Syst. 2021, 5, 2100119. [Google Scholar] [CrossRef]
  10. García-Muñoz, P.; Zussblatt, N.P.; Pliego, G.; Zazo, J.A.; Fresno, F.; Chmelka, B.F.; Casas, J.A. Evaluation of photoassisted treatments for norfloxacin removal in water using mesoporous Fe2O3-TiO2 materials. J. Environ. Manage. 2019, 238, 243–250. [Google Scholar] [CrossRef] [PubMed]
  11. Battula, V.R.; Jaryal, A.; Kaisalam, K. Visible light-driven simultaneous H2 production by water splitting coupled with selective oxidation of HMF to DFF catalyzed by porous carbon nitride. J. Mater. Chem. A 2019, 7, 5643–5649. [Google Scholar] [CrossRef]
  12. He, Y.; Qian, J.; Wang, P.; Wu, J.; Lu, B.; Tang, S. Acceleration of levofloxacin degradation by combination of multiple free radicals via MoS2 anchored in manganese ferrite doped perovskite activated PMS under visible light. Chem. Eng. J. 2022, 431, 133933. [Google Scholar] [CrossRef]
  13. Sakar, M.; Prakash, R.M.; Do, T.-O. Insights into the TiO2 -Based Photocatalytic Systems and Their Mechanisms. Catalysts 2019, 9, 680. [Google Scholar] [CrossRef] [Green Version]
  14. Herman, J.R.; Krotkov, N.; Celarier, E.; Larko, D.; Labow, G. Distribution from of UV radiation at the Earth ’ s surface from TOMS-measure UV-backscattered radiances. J. Geophys. Res. 1999, 104, 12059–12076. [Google Scholar] [CrossRef]
  15. Li, G.; Nie, X.; Gao, Y.; An, T. Can environmental pharmaceuticals be photocatalytically degraded and completely mineralized in water using g-C3N4/TiO2 under visible light irradiation?-Implications of persistent toxic intermediates. Appl. Catal. B Environ. 2016, 180, 726–732. [Google Scholar] [CrossRef]
  16. Kete, M.; Pavlica, E.; Fresno, F.; Bratina, G.; Štangar, U.L. Highly active photocatalytic coatings prepared by a low-temperature method. Environ. Sci. Pollut. Res. 2014, 21, 11238–11249. [Google Scholar] [CrossRef] [PubMed]
  17. Kovacic, M.; Kopcic, N.; Kusic, H.; Bozic, A.L. Solar driven degradation of 17β-estradiol using composite photocatalytic materials and artificial irradiation source: Influence of process and water matrix parameters. J. Photochem. Photobiol. A Chem. 2018, 361, 48–61. [Google Scholar] [CrossRef]
  18. EC Commission Implementing Decision (EU) 2018/840 of 5 June 2018 establishing a watch list of substances for Union-wide monitoring in the field of water policy pursuant to Directive 2008/105/EC of the European Parliament and of the Council and repealing Comm. Off. J. Eur. Union 2018, L 141, 9–12.
  19. Loos, R.; Marinov, D.; Sanseverino, I.; Napierska, D.; Lettieri, T. Review of the 1st Watch List under the Water Framework Directive and Recommendations for the 2nd Watch List; Publications Office of the European Union: Luxembourg, 2018. [Google Scholar]
  20. Andrews, D.; Lipson, R.; Nann, T. Comprehensive Nanoscience and Nanotechnology; Elsevier Ltd.: Amsterdam, The Netherlands, 2019. [Google Scholar]
  21. Elbakkay, M.H.; El Rouby, W.M.A.; Mariño-López, A.; Sousa-Castillo, A.; Salgueiriño, V.; El-Dek, S.I.; Farghali, A.A.; Correa-Duarte, M.A.; Millet, P. One-pot synthesis of TiO2/Sb2S3/RGO complex multicomponent heterostructures for highly enhanced photoelectrochemical water splitting. Int. J. Hydrogen Energy 2021, 46, 31216–31227. [Google Scholar] [CrossRef]
  22. Moniz, S.J.A.; Shevlin, S.A.; An, X.; Guo, Z.X.; Tang, J. Fe2O3-TiO2 nanocomposites for enhanced charge separation and photocatalytic activity. Chem.-A Eur. J. 2014, 20, 15571–15579. [Google Scholar] [CrossRef]
  23. Dai, X.; Lu, G.; Hu, Y.; Xie, X.; Wang, X.; Sun, J. Reversible redox behavior of Fe2O3/TiO2 composites in the gaseous photodegradation process. Ceram. Int. 2019, 45, 13187–13192. [Google Scholar] [CrossRef]
  24. Lassoued, A.; Dkhil, B.; Gadri, A.; Ammar, S. Control of the shape and size of iron oxide (α-Fe2O3) nanoparticles synthesized through the chemical precipitation method. Results Phys. 2017, 7, 3007–3015. [Google Scholar] [CrossRef]
  25. Hua, J.; Gengsheng, J. Hydrothermal synthesis and characterization of monodisperse α-Fe2O3 nanoparticles. Mater. Lett. 2009, 63, 2725–2727. [Google Scholar] [CrossRef]
  26. Peña-flores, J.I.; Palomec-garfias, A.F.; Márquez-beltrán, C.; Sánchez-mora, E. Fe effect on the optical properties of TiO2: Fe2O3 nanostructured composites supported on SiO2 microsphere assemblies. Nanoscale Res. Lett. 2014, 9, 499. [Google Scholar] [CrossRef] [PubMed] [Green Version]
  27. Ohsaka, T. Temperature Dependence of the Raman Spectrum in Anatase TiO2. J. Phys. Soc. Japan 1980, 48, 1661–1668. [Google Scholar] [CrossRef]
  28. Mansour, H.; Omri, K.; Bargougui, R.; Ammar, S. Novel α-Fe2O3/TiO2 nanocomposites with enhanced photocatalytic activity. Appl. Phys. A 2020, 126, 151. [Google Scholar] [CrossRef]
  29. De Faria, D.L.A.; Lopes, F.N. Heated goethite and natural hematite: Can Raman spectroscopy be used to differentiate them? Vib. Spectrosc. 2007, 45, 117–121. [Google Scholar] [CrossRef]
  30. Jubb, A.M.; Allen, H.C. Vibrational Spectroscopic Characterization of Hematite, Maghemite, and Magnetite Thin Films Produced by Vapor Deposition. ACS Appl. Mater. Interfaces 2010, 2, 2804–2812. [Google Scholar] [CrossRef]
  31. Cho, Y.; Huh, Y. Preparation of Hyperbranched Structures of α -Fe2O3. Bull. Korean Chem. Soc. 2009, 30, 1413–1415. [Google Scholar]
  32. Huang, R.; Liang, R.; Fan, H.; Ying, S.; Wu, L.; Wang, X. Enhanced Photocatalytic Fuel Denitrification over TiO2/α-Fe2O3 Nanocomposites under Visible Light irradiation. Sci. Rep. 2017, 7, 7858. [Google Scholar] [CrossRef]
  33. Lamm, B.; Trześniewski, B.J.; Döscher, H.; Smith, W.A.; Stefik, M. Emerging Postsynthetic Improvements of BiVO4 Photoanodes for Solar Water Splitting. ACS Energy Lett. 2018, 3, 112–124. [Google Scholar] [CrossRef]
  34. Singh, A.P.; Tossi, C.; Tittonen, I.; Hellman, A.; Wickman, B. Synergies of co-doping in ultra-thin hematite photoanodes for solar water oxidation: In and Ti as representative case. RSC Adv. 2020, 10, 33307–33316. [Google Scholar] [CrossRef]
  35. Akhavan, O. Thickness dependent activity of nanostructured TiO2 /α- Fe2O3 photocatalyst thin films. Appl. Surf. Sci. 2010, 257, 1724–1728. [Google Scholar] [CrossRef]
  36. Akhavan, O.; Azimirad, R.; Safa, S.; Larijani, M.M. Visible light photo-induced antibacterial activity of CNT-doped TiO2 thin films with various CNT contents. J. Mater. Chem. 2010, 20, 7386–7392. [Google Scholar] [CrossRef]
  37. Strens, R.G.J.; Wood, B.J. Diffuse reflectance spectra and optical properties of some iron and titanium oxides and oxyhydroxides. Mineral. Mag. 1979, 43, 347–354. [Google Scholar] [CrossRef] [Green Version]
  38. Torrent, J.; Barron, V. Diffuse reflectance spectroscopy of iron oxides. Encycl. Surf. Colloid Sci. 2002, 1438–1446. [Google Scholar]
  39. Sayed, M.; Ren, B.; Ali, A.M.; Al-Anazi, A.; Nadagouda, M.N.; Ismail, A.A.; Dionysiou, D.D. Solar light induced photocatalytic activation of peroxymonosulfate by ultra-thin Ti3+ self-doped Fe2O3/TiO2 nanoflakes for the degradation of naphthalene. Appl. Catal. B Environ. 2022, 315, 121532. [Google Scholar] [CrossRef]
  40. Xie, W.; Li, R.; Xu, Q. Enhanced photocatalytic activity of Se-doped TiO2 under visible light irradiation. Sci. Rep. 2018, 8, 8752. [Google Scholar] [CrossRef] [Green Version]
  41. Cao, Y.Q.; Zi, T.Q.; Zhao, X.R.; Liu, C.; Ren, Q.; Fang, J.B.; Li, W.M.; Li, A.D. Enhanced visible light photocatalytic activity of Fe2O3 modified TiO2 prepared by atomic layer deposition. Sci. Rep. 2020, 10, 13437. [Google Scholar] [CrossRef]
  42. D’Amato, C.A.; Giovannetti, R.; Zannotti, M.; Rommozzi, E.; Ferraro, S.; Seghetti, C.; Minicucci, M.; Gunnella, R.; Di Cicco, A. Enhancement of visible-light photoactivity by polypropylene coated plasmonic Au/TiO2 for dye degradation in water solution. Appl. Surf. Sci. 2018, 441, 575–587. [Google Scholar] [CrossRef]
  43. Yuan, S.; Mu, J.; Mao, R.; Li, Y.; Zhang, Q.; Wang, H. All-Nanoparticle Self-assembly ZnO / TiO2 Heterojunction Thin Films with Remarkably Enhanced Photoelectrochemical Activity. ACS Appl. Mater. Interfaces 2014, 6, 5719–5725. [Google Scholar] [CrossRef]
  44. Mei, Q.; Zhang, F.; Wang, N.; Yang, Y.; Wu, R.; Wang, W. TiO2/Fe2O3 heterostructures with enhanced photocatalytic reduction of Cr(VI) under visible light irradiation. RSC Adv. 2019, 9, 22764–22771. [Google Scholar] [CrossRef] [Green Version]
  45. Zubair, M.; Svenum, I.; Rønning, M.; Yang, J. Core-Shell Nanostructures of Graphene-Wrapped CdS Nanoparticles and TiO2 (CdS @ G @ TiO2): The Role of Graphene in Enhanced Photocatalytic H2 Generation. Catalysts 2020, 10, 358. [Google Scholar] [CrossRef] [Green Version]
  46. Jiang, W.; Zong, X.; An, L.; Hua, S.; Miao, X.; Luan, S.; Wen, Y.; Tao, F.F.; Sun, Z. Consciously Constructing Heterojunction or Direct Z-Scheme Photocatalysts by Regulating Electron Flow Direction. ACS Catal. 2018, 8, 2209–2217. [Google Scholar] [CrossRef]
  47. Zhao, J.; Sun, Y.; Wu, F.; Shi, M.; Liu, X. Oxidative Degradation of Amoxicillin in Aqueous Solution by Thermally Activated Persulfate. J. Chem. 2019, 2019, 2505823. [Google Scholar] [CrossRef]
  48. Boncagni, N.T.; Otaegui, J.M.; Warner, E.; Curran, T.; Ren, J.; De Cortalezzi, M.M.F. Exchange of TiO2 nanoparticles between streams and streambeds. Environ. Sci. Technol. 2009, 43, 7699–7705. [Google Scholar] [CrossRef]
  49. Buscio, V.; Brosillon, S.; Mendret, J.; Crespi, M.; Gutiérrez-bouzán, C. Photocatalytic Membrane Reactor for the Removal of C.I. Disperse Red 73. Materials 2015, 8, 3633–3647. [Google Scholar] [CrossRef] [Green Version]
  50. Kritikos, D.E.; Xekoukoulotakis, N.P.; Psillakis, E.; Mantzavinos, D. Photocatalytic degradation of reactive black 5 in aqueous solutions: Effect of operating conditions and coupling with ultrasound irradiation. Water Res. 2007, 41, 2236–2246. [Google Scholar] [CrossRef]
  51. Shrimali, K.; Jin, J.; Hassas, B.V.; Wang, X.; Miller, J.D. The surface state of hematite and its wetting characteristics. J. Colloid Interface Sci. 2016, 477, 16–24. [Google Scholar] [CrossRef]
  52. Mendiola-Alvarez, S.Y.; Araña, J.; Doña Rodríguez, J.M.; Hernández-Ramírez, A.; Turnes Palomino, G.; Palomino Cabello, C.; Hinojosa-Reyes, L. Comparison of photocatalytic activity of α-Fe2O3-TiO2/P on the removal of pollutants on liquid and gaseous phase. J. Environ. Chem. Eng. 2021, 9, 104828. [Google Scholar] [CrossRef]
  53. Subramonian, W.; Wu, T.Y.; Chai, S.-P. Photocatalytic degradation of industrial pulp and paper mill effluent using synthesized magnetic Fe2O3-TiO2: Treatment efficiency and characterizations of reused photocatalyst. J. Environ. Manage. 2017, 187, 298–310. [Google Scholar] [CrossRef] [Green Version]
  54. Fang, G.; Wu, W.; Liu, C.; Dionysiou, D.D.; Deng, Y.; Zhou, D. Activation of persulfate with vanadium species for PCBs degradation: A mechanistic study. Appl. Catal. B Environ. 2017, 202, 1–11. [Google Scholar] [CrossRef]
  55. Matzek, L.W.; Carter, K.E. Sustained persulfate activation using solid iron: Kinetics and application to ciprofloxacin degradation. Chem. Eng. J. 2017, 307, 650–660. [Google Scholar] [CrossRef]
  56. Zhong, H.; Tian, Y.; Yang, Q.; Brusseau, M.L.; Yang, L.; Zeng, G. Degradation of landfill leachate compounds by persulfate for groundwater remediation. Chem. Eng. J. 2017, 307, 399–407. [Google Scholar] [CrossRef] [PubMed] [Green Version]
  57. Furman, O.S.; Teel, A.M.Y.L.; Watts, R.J. Mechanism of Base Activation of Persulfate. Environ. Sci. Technol. 2010, 44, 6423–6428. [Google Scholar] [CrossRef] [PubMed]
  58. Saien, J.; Jafari, F. Chapter 1- Methods of Persulfate Activation for the Degradation of Pollutants: Fundamentals and Influencing Parameters. In Persulfate-Based Oxidation Processes in Environmental Remediation; The Royal Society of Chemistry: London, UK, 2022; pp. 1–59. [Google Scholar]
  59. Olmez-Hanci, T.; Arslan-Alaton, I. Comparison of sulfate and hydroxyl radical based advanced oxidation of phenol. Chem. Eng. J. 2013, 224, 10–16. [Google Scholar] [CrossRef]
  60. Kolthoff, I.M.; Miller, I.K. The Chemistry of Persulfate. I. The Kinetics and Mechanism of the Decomposition of the Persulfate Ion in Aqueous Medium. J. Am. Chem. Soc. 1951, 73, 3055–3059. [Google Scholar] [CrossRef]
  61. Kolthoff, I.M.; Miller, I.K. The Chemistry of Persulfate. II. The Reaction of Persulfate with Mercaptans Solubilized in Solutions of Saturated Fatty Acid Soaps. J. Am. Chem. Soc. 1951, 73, 5118–5122. [Google Scholar] [CrossRef]
  62. Gao, H.; Chen, J.; Zhang, Y.; Zhou, X. Sulfate radicals induced degradation of Triclosan in thermally activated persulfate system. Chem. Eng. J. 2016, 306, 522–530. [Google Scholar] [CrossRef]
  63. Kusic, H.; Peternel, I.; Ukic, S.; Koprivanac, N.; Bolanca, T.; Papic, S.; Bozic, A.L. Modeling of iron activated persulfate oxidation treating reactive azo dye in water matrix. Chem. Eng. J. 2011, 172, 109–121. [Google Scholar] [CrossRef]
  64. Xia, Y.; Yin, L. Core-shell structured α-Fe2O3@TiO2 nanocomposites with improved photocatalytic activity in the visible light region. Phys. Chem. Chem. Phys. 2013, 15, 18627–18634. [Google Scholar] [CrossRef]
  65. Liu, J.; Yang, S.; Wu, W.; Tian, Q.; Cui, S.; Dai, Z.; Ren, F.; Xiao, X.; Jiang, C. 3D Flowerlike α-Fe2O3@TiO2 Core–Shell Nanostructures: General Synthesis and Enhanced Photocatalytic Performance. ACS Sustain. Chem. Eng. 2015, 3, 2975–2984. [Google Scholar] [CrossRef]
  66. Monteagudo, J.M.; Durán, A.; Martín, I.S.; Vellón, B. Photocatalytic degradation of aniline by solar / TiO2 system in the presence of the electron acceptors Na2S2O8 and H2O2. Sep. Purif. Technol. 2020, 238, 116456. [Google Scholar] [CrossRef]
  67. Buxton, G.V.; Greenstock, C.L.; Helman, W.P.; Ross, A.B. Critical Review of rate constants for reactions of hydrated electrons, hydrogen atoms and hydroxyl radicals (⋅OH/⋅O− in Aqueous Solution. J. Phys. Chem. Ref. Data 1988, 17, 513–886. [Google Scholar] [CrossRef] [Green Version]
  68. Rao, P.S.; Hayon, E. Redox potentials of free radicals. IV. Superoxide and hydroperoxy radicals O2 and HO2. J. Phys. Chem. 1975, 79, 397–402. [Google Scholar] [CrossRef]
  69. Matta, R.; Tlili, S.; Chiron, S.; Barbati, S. Removal of carbamazepine from urban wastewater by sulfate radical oxidation. Environ. Chem. Lett. 2011, 9, 347–353. [Google Scholar] [CrossRef]
  70. Anipsitakis, G.P.; Dionysiou, D.D. Radical generation by the interaction of transition metals with common oxidants. Environ. Sci. Technol. 2004, 38, 3705–3712. [Google Scholar] [CrossRef]
  71. Zhu, J.; Liu, S.; Ge, J.; Guo, X.; Wang, X.; Wu, H. Synthesis of Fe2O3-TiO2/fly-ash-cenosphere composite and its mechanism of photocatalytic oxidation under visible light. Res. Chem. Intermed. 2016, 42, 3637–3654. [Google Scholar] [CrossRef]
  72. Sabri, M.; Habibi-Yangjeh, A.; Chand, H.; Krishnan, V. Activation of persulfate by novel TiO2/FeOCl photocatalyst under visible light: Facile synthesis and high photocatalytic performance. Sep. Purif. Technol. 2020, 250, 117268. [Google Scholar] [CrossRef]
  73. Trovó, A.G.; Pupo Nogueira, R.F.; Agüera, A.; Fernandez-Alba, A.R.; Malato, S. Degradation of the antibiotic amoxicillin by photo-Fenton process-Chemical and toxicological assessment. Water Res. 2011, 45, 1394–1402. [Google Scholar] [CrossRef] [Green Version]
  74. Zhang, Y.; Xiao, Y.; Zhong, Y.; Lim, T.T. Comparison of amoxicillin photodegradation in the UV/H2O2 and UV/persulfate systems: Reaction kinetics, degradation pathways, and antibacterial activity. Chem. Eng. J. 2019, 372, 420–428. [Google Scholar] [CrossRef]
  75. Lamm, A.; Gozlan, I.; Rotstein, A.; Avisar, D. Detection of amoxicillin-diketopiperazine-2′, 5′ in wastewater samples. J. Environ. Sci. Heal. Part A 2009, 44, 1512–1517. [Google Scholar] [CrossRef]
  76. He, X.; Mezyk, S.P.; Michael, I.; Fatta-Kassinos, D.; Dionysiou, D.D. Degradation kinetics and mechanism of β-lactam antibiotics by the activation of H2O2 and Na2S2O8 under UV-254nm irradiation. J. Hazard. Mater. 2014, 279, 375–383. [Google Scholar] [CrossRef] [PubMed]
  77. Wei, Z.; Liu, J.; Fang, W.; Xu, M.; Qin, Z.; Jiang, Z.; Shangguan, W. Photocatalytic hydrogen evolution with simultaneous antibiotic wastewater degradation via the visible-light-responsive bismuth spheres-g-C3N4 nanohybrid: Waste to energy insight. Chem. Eng. J. 2019, 358, 944–954. [Google Scholar] [CrossRef]
  78. Wei, Z.; Xu, M.; Liu, J.; Guo, W.; Jiang, Z.; Shangguan, W. Simultaneous visible-light-induced hydrogen production enhance- ment and antibiotic wastewater degradation using MoS2 @ ZnxCd1-xS: Solid-solution-assisted photocatalysis. Chinese J. Catal. 2020, 41, 103–113. [Google Scholar] [CrossRef]
  79. Ma, D.; Zhai, S.; Wang, Y.; Liu, A.; Chen, C. TiO2 Photocatalysis for Transfer Hydrogenation. Molecules 2019, 24, 330. [Google Scholar] [CrossRef] [PubMed] [Green Version]
  80. Solomons, T.W.G. Organic Chemistry; Wiley: Berlin, Germany, 2011. [Google Scholar]
  81. Pérez-Parada, A.; Agüera, A.; del Mar Gómez-Ramos, M.; García-Reyes, J.F.; Heinzen, H.; Fernández-Alba, A.R. Behavior of amoxicillin in wastewater and river water: Identification of its main transformation products by liquid chromatography/electrospray quadrupole time-of-flight mass spectrometry. Rapid Commun. Mass Spectrom. 2011, 25, 731–742. [Google Scholar] [CrossRef] [PubMed]
  82. Arsand, J.B.; Hoff, R.B.; Jank, L.; Meirelles, L.N.; Silvia Díaz-Cruz, M.; Pizzolato, T.M.; Barceló, D. Transformation products of amoxicillin and ampicillin after photolysis in aqueous matrices: Identification and kinetics. Sci. Total Environ. 2018, 642, 954–967. [Google Scholar] [CrossRef]
  83. Gozlan, I.; Rotstein, A.; Avisar, D. Investigation of an amoxicillin oxidative degradation product formed under controlled environmental conditions. Environ. Chem. 2010, 7, 435–442. [Google Scholar] [CrossRef]
  84. Gozlan, I.; Rotstein, A.; Avisar, D. Amoxicillin-degradation products formed under controlled environmental conditions: Identification and determination in the aquatic environment. Chemosphere 2013, 91, 985–992. [Google Scholar] [CrossRef]
Figure 1. (a) XRD pattern of prepared Fe2O3/TiO2 nanocomposites; (b) partial magnification around (104) plane of hematite; (c) partial magnification around (101) plane of anatase.
Nanomaterials 12 04328 g001
Figure 2. Raman spectra of Fe2O3/TiO2 nanocomposites and pure α−Fe2O3.
Nanomaterials 12 04328 g002
Figure 3. SEM images (50,000× (1); 100,000× (2); EDX spectrum (3); particle size distribution (4)) of (A) 1% Fe2O3/TiO2, (B) 3% Fe2O3/TiO2, (C) 5% Fe2O3/TiO2, (D) 10% Fe2O3/TiO2, and (E) 20% Fe2O3/TiO2 nanocomposites.
Nanomaterials 12 04328 g003
Figure 4. (a) XPS survey analysis of 5% Fe2O3/TiO2; (b) Fe 2p core-level spectrum; (c) Ti 2p core-level spectrum.
Nanomaterials 12 04328 g004
Figure 5. (a) UV/visible DRS spectrum of Fe2O3/ TiO2 nanocomposites; (b) Kubelka−Munk functions [F(R)E]1/2 versus photon energy (eV).
Nanomaterials 12 04328 g005
Figure 6. Photoluminescence (PL) spectra of pristine TiO2 and Fe2O3/ TiO2 nanocomposites.
Nanomaterials 12 04328 g006
Figure 7. (a) Transient photocurrent responses of TiO2–P25, α−Fe2O3, and 5% Fe2O3/TiO2 nanocomposites; (b) EIS Nyquist plots of TiO2−P25 and 5% Fe2O3/TiO2 in dark and light conditions.
Nanomaterials 12 04328 g007
Figure 8. Photocatalytic removal of AMX using prepared photocatalysts under visible-light irradiation without oxidant (a,b) with [PS] = 0.3 mM. Conditions: [catalyst dosage] = 0.5 g/L; [AMX] = 0.05 mM; initial pH = natural pH (5.5); catalyst used in powdered form.
Nanomaterials 12 04328 g008
Figure 9. The 3D surface and contour plots presenting mutual interactions of initial pH and [PS] on photocatalytic AMX conversion by vis−(5% Fe2O3/TiO2)/PS (catalyst used in immobilized form).
Nanomaterials 12 04328 g009
Figure 10. The %AMX conversion with photocatalysis, photocatalysis + H2O2, and photocatalysis + PS. Experimental Conditions: pH = 4.808; [PS] = [H2O2] = 1.873 mM; catalyst = immobilized 5% (w/w) Fe2O3/TiO2; [AMX] = 0.05 mM.
Nanomaterials 12 04328 g010
Figure 11. AMX conversion under photocatalysis (a), photocatalysis + H2O2 (b), and photocatalysis + PS (c) in presence of scavengers; (df) corresponding zero-order rate constants for each process. Experimental conditions: [AMX] = 0.05 mM; initial pH = 4.808; [PS] = [H2O2] = 1.873 mM; [FA] = [MeOH] = [t-BuOH] = 5 mM; [BQ] = 0.5 mM; catalyst used in immobilized form.
Nanomaterials 12 04328 g011
Figure 12. Proposed charge transfer mechanism between Fe2O3 and TiO2 heterojunction before and after contact, under visible−light irradiation.
Nanomaterials 12 04328 g012
Figure 13. Proposed transformation byproducts of AMX under different photocatalytic treatment processes. Black boxes indicate the transformation byproducts obtained in all processes; red boxes indicate the transformation products obtained under photocatalysis and photocatalysis + H2O2; green boxes indicate the transformation by-products obtained under photocatalysis + H2O2 and photocatalysis + persulfate.
Nanomaterials 12 04328 g013
Figure 14. Proposed mechanism for the formation of TP 382 (E1 and E2).
Nanomaterials 12 04328 g014
Figure 15. Evolution and conversion of identified AMX transformation byproducts for photocatalysis (a), photocatalysis + H2O2 (b), and photocatalysis + PS (c); corresponding toxicity toward V. fischeri (df).
Nanomaterials 12 04328 g015
Figure 16. The %AMX conversion by photocatalysis, photocatalysis + H2O2, and photocatalysis + PS during three consecutive cycles. Experimental conditions: [AMX] = 0.05 mM; initial pH = 4.808; [PS] = [H2O2] = 1.873 mM; reaction time: photocatalysis (3900 min/cycle); photocatalysis + H2O2 (720 min/cycle); photocatalysis + PS (380 min/cycle); catalyst used in immobilized form.
Nanomaterials 12 04328 g016
Table 1. Experimental range and levels of process/variables.
Process ParametersModel Variables/Coded ValuesLevel/Range
−101
pHX1468
[S2O82−] (µM)X250017503000
Table 2. Photocatalyst bandgap values estimated using Kubelka–Munk function.
PhotocatalystTiO2 (P25)1% Fe2O3/TiO23% Fe2O3/TiO25% Fe2O3/TiO210% Fe2O3/TiO220% Fe2O3/TiO2α-Fe2O3
Bandgap (eV)3.313.293.082.941.921.891.87
Table 3. Single-point and multipoint BET surface area of samples.
PhotocatalystSingle-Point BET (m2/g)Multipoint BET (m2/g)
TiO2–P2546.611247.3512 ± 0.1206
α-Fe2O325.289725.4548 ± 0.2408
1% Fe2O3/TiO249.792651.2769 ± 0.4552
3% Fe2O3/TiO239.354839.6042 ± 0.3677
5% Fe2O3/TiO240.421740.985 ± 0.2412
10% Fe2O3/TiO242.548643.4856 ± 0.1723
20% Fe2O3/TiO234.406834.7489 ± 0.3532
Publisher’s Note: MDPI stays neutral with regard to jurisdictional claims in published maps and institutional affiliations.

