Article

Vapour-Phase Selective Hydrogenation of γ-Valerolactone to 2-Methyltetrahydrofuran Biofuel over Silica-Supported Copper Catalysts

by
Ramyakrishna Pothu
1,
Prathap Challa
2,
Rajendiran Rajesh
2,
Rajender Boddula
2,3,*,
Ravi Balaga
2,
Putrakumar Balla
2,*,
Vijayanand Perugopu
2,
Ahmed Bahgat Radwan
3,
Aboubakr M. Abdullah
3 and
Noora Al-Qahtani
3,*
1
School of Physics and Electronics, College of Chemistry and Chemical Engineering, Hunan University, Changsha 410082, China
2
Energy & Environmental Engineering Department, CSIR−Indian Institute of Chemical Technology, Hyderabad 500007, India
3
Center for Advanced Materials (CAM), Qatar University, Doha 2713, Qatar
*
Authors to whom correspondence should be addressed.
Nanomaterials 2022, 12(19), 3414; https://doi.org/10.3390/nano12193414
Submission received: 19 August 2022 / Revised: 12 September 2022 / Accepted: 21 September 2022 / Published: 29 September 2022
(This article belongs to the Special Issue Catalysis of Porous Nanomaterials)

Abstract

:
2-Methyltetrahydrofuran (MTHF) is a desirable biomass-based platform chemical with excellent potential as an ideal biofuel, green solvent, and raw material for synthesizing downstream chemicals. In this work, a series of copper nanoparticles encapsulated on SiO2 were prepared by the wet impregnation method and evaluated as efficient non-noble metal catalysts for the vapour-phase hydrogenation of γ-valerolactone (GVL) to MTHF in a fixed-bed reactor under mild reaction conditions. The obtained catalyst properties were determined by XRD, FE-SEM, TEM, UV-DRS, TPR, NH3-TPD, N2O decomposition and pore size distribution measurements. Meanwhile, the parameters/variables tuning their catalytic performance (activity, conversion, selectivity and stability) were examined. Various Cu loadings featured on the SiO2 support are essential for tuning the catalytic activity. Among the catalysts tested, a 5 wt% Cu/SiO2 catalyst showed a 97.2% MTHF selectivity with 71.9% GVL conversion, and showed a stability for 33 h time-on-stream, achieved at 260 °C and atmospheric pressure conditions. It was found that a huge dispersion of Cu metal in support, hydrogen activation ability, abundant acidic sites and surface area are all beneficial for improved MTHF selectivity.

1. Introduction

The majority of transportation fuels, chemicals, and materials originate from fossil fuels. As the worldwide need for energy grows, fossil fuels will be destroyed at an alarming rate. With the ever-worsening environment connected with the global fuel-intensive sector, extensive efforts are being made to find green alternative sustainable energy sources as the best methods for resolving problems [1]. Biomass is the most promising carbon-containing renewable and sustainable global resource, and it is typically used to replace fossil resources in the production of sustainable fuels and value-added chemicals such as 5-hydroxymethyfurfural (HMF), furfuryl alcohol, levulinic acid (LA), γ-valerolactone (GVL), and others [2,3]. The catalytic conversion of biomass-derived molecules into a broad range of fuels, chemicals and materials has piqued the interest of energy researchers all over the world in this context [2]. GVL has long been regarded as one of the most useful platform chemicals derived from biomass, with applications such as green solvents, flavoring agents, fuel additives, and polymer building blocks [3]. It can also be utilized as a starting material for the manufacture of alkanes and other important compounds. Value-added compounds, such as 1,4-pentanediol (PDO) and 2-methyltetrahydrofuran (MTHF), can be produced by hydrogenating GVL [4]. PDO is a valuable monomer for making bio-based polymers (polyesters), as well as an intermediary in the creation of perfumes, lubricants, and other chemicals [5]. MTHF is a promising biomass-based platform chemical with excellent potential as a green solvent [6,7], reagent for organometallic transformations [8] and biotransformations [9], and a viable biofuel or fuel additive due to its octane number of 87, which is comparable to gasoline, and as a P-series fuel component for the transportation infrastructure [10,11]. As a result, a competitive technique for producing 2-MTHF is necessary. Catalytic hydrogenation is one of the most effective and environmentally friendly ways to remove oxygen atoms from biomass and improve its practical values [12,13,14,15]. The acceptable route is thought to be involved in the production of MTHF from GVL as it undergoes the hydrodeoxygenation pathway. Many investigations have been conducted into the hydrogenation of LA to GVL and GVL to PDO, with a subsequent hydrogenation to MTHF and other compounds. Different catalyst qualities and reaction conditions would be required for each of these three steps, increasing the complexity of producing MTHF directly from LA. Only a few articles on GVL hydrogenation to yield MTHF or PDO have been identified. According to research, GVL hydrogenation can occur via two different mechanisms (Scheme 1).
The hydrogenolysis of GVL’s ester bond (O–(C=O)), followed by cyclodehydration of the PDO intermediate, yields MTHF. The other method includes ring-opening to hydrogenate GVL. Over bifunctional catalysts with metal and Bronsted sites, the breaking of the C–O bond on the methyl side of GVL and subsequent hydrogenation leads to the pentanoic acid formation, and with further hydrogenation forms 1-pentanol; both combinations result in pentyl valerates (valeric biofuels) [16,17,18]. On the basis of Au [19], Pt [20,21], Ru [22,23,24,25], Rh [18], Fe [26], and Co [27,28], catalytic selective hydrogenation of GVL to MTHF and/or PDO was carried out over homogeneous catalysts, with approximately 100% product yield. However, scarce noble metal catalysts are expensive and are inferior to heterogeneous catalysts due to the difficulty in isolating the catalyst from the reaction media, and so the cost of the catalysts can increase [22,23].
The majority of recent research has been concentrated on Cu-based catalysts. Zhai et al. employed a Cu/MgO catalyst with a 9% Cu concentration composed through metal-organic chemical vapour deposition (MO-CVD) on a MgO support, which achieved a 64% yield of PDO at 240 °C in dioxane solvent and at 80 bar H2 [29]. Furthermore, it was discovered that the numerous basic sites of CuMg catalysts, through Cu minimal concentration, are required for the ring-opening/breaking of the furan ring in GVL to generate PDO [30]. A significant 96% yield was achieved using a catalyst that contained 30% Cu/ZrO2, annealed at 700 °C beneath reaction conditions (200 °C, 60 bar). On the other hand, 87% yield of MTHF was achieved by calcination with temperatures reduced to 300 °C and the reaction temperature raised to 240 °C [31]. Denise et al. used minimal amounts of Cu/SiO2 catalysts to hydrogenate GVL in cyclopentyl methyl ether solvent, yielding 78% PDO and no production of MTHF under reaction conditions (160 °C, 50 bar) [32]. Cu/SiO2 was synthesized using reduced Cu-hydroxosilicate and applied to GVL hydrogenation with n-butanol as the solvent in a fixed-bed reactor at 130 °C and 1.3 MPa H2, resulting in 32% GVL conversion and 67% PDO selectivity [33]. Despite its utility, these systems have several flaws, including cost, separation from product liquid, non-reusability, the need for precise handling of metal complexes, tedious work-up procedures, and the high price of catalyst preparation [13,22]. Vapor-phase reactions are more efficient and environmentally friendly than liquid-phase reactions because they require less H2 pressure, operate continuously, and allow for easy product separation [13]. Using a continuous flow, tubular, fixed-bed microreactor, we provided a vapour-phase catalytic hydrogenation pathway capable of selectively converting GVL to MTHF in the presence of silica-supported copper catalysts with hydrogen (Scheme 2). TPR, NH3-TPD, BET surface area, N2O decomposition, XRD, FE-SEM, and TEM were employed to characterize the catalysts, and the factors/parameters affecting their catalytic performance (activity, conversion, selectivity and stability) were deliberated.

2. Experimental Section

2.1. Catalyst Synthesis

A collection of Cu catalysts with altered Cu loadings, ranging from 2 to 20 (2, 5, 10, 15 and 20) wt% were synthesized by the wet-impregnation of copper nitrate trihydrate (Cu(NO3)2.3H2O, Sigma Aldrich, Germany) on the silica (SiO2, Sigma Aldrich, Germany) support. The catalysts were dried for 12 h at 110 °C and afterwards calcined for 5 h at 500 °C.

2.2. Catalyst Characterization

The XRD tests were carried out using a Rigaku MiniFlex diffractometer (Tokyo, TYO, Japan) using Cu Kα radiation that had been nickel filtered at 40 kV and 20 mA, with a ramp rate of 2°min−1. The textural properties of the silica-supported Cu materials were established using a Micromeritics ASAP 2020 system (Georgia, GA, USA) using N2 adsorption–desorption isotherms at 77 K. The catalysts were initially evacuated for 3 h at 200 °C. The BET equation was used to calculate the BET values. For the 200 kV conduction and TEM analysis, JEOL 2010 apparatus (Massachusetts, MA, USA) was used. After being sonicated for 10 min to dissolve the powder catalysts in an ethanol solution, the mixture was diffused onto Cu grids, and the microscope column received the sample holder. UV–Vis diffuse reflectance spectra (UV–DRS) analysis was carried out using a GBC UV–Visible Cintra instrument (Victoria, VIC, Australia). Using the 2920 Micromeritics device (Georgia, GA, USA), temperature-programmed desorption of ammonia (NH3-TPD) and temperature-programmed reduction of hydrogen (H2-TPR) analysis was used to examine the acidity of the catalysts. Typically, 0.1 g of material was prepared in an H2-TPR experiment by being exposed to He gas at 200 °C for 2 h, before being cooled to room temperature. TPR analysis was carried out between 25 °C and 600 °C with a ramping rate of 10 °C/min and a flow of 5 vol% H2/Ar. For the TPD run, the catalysts were pretreated, purged with He 50 mL for 1 h at 200 °C and the temperature was then lowered. The catalyst was treated with He 50 mL for 30 min at the same temperature after being reduced in situ using 5% H2-Ar in 40 mL for 2 h at 250 °C. Following that, 75 mL of 10% NH3-He gas underwent NH3 absorption for 1 h at 80 °C, followed by a 2 h purge at 120 °C for NH3 physisorption. The TPD run was carried out between 120 °C and 750 °C, and TCD assessed the NH3 output. The Brunauer–Emmett–Teller (BET) and Barret–Joyner-Halenda (BJH) methods were employed to measure the surface area and pore size. Images from scanning electron microscopy (SEM) were captured using a 20 kV-operated Philips/FEI Quanta 200F SEM (Texas, TX, USA).

2.3. Catalytic Reaction

Under typical conditions of 260 °C and 0.1 MPa of H2 pressure, the vapour-phase hydrogenation of GVL to MTHF synthesis and the process was evaluated in a continuous fixed-bed stainless steel tube reactor. The Cu/SiO2 catalyst was added to the reactor in amounts of around 0.4 g. The sample was initially reduced with 50 mL of H2 flow at 300 °C. The reactant feed was introduced using an HPLC pump, feed gas was used to pressurise the reactor, and the desired temperature was attained. Then 10% of the aqueous GVL feed was heated to 260 °C and subjected to an H2 flow, while being attached to the reactor intake. At various reaction conditions, the Cu/SiO2 catalytic performance was tested. A DB-wax column in a gas chromatograph was used to examine the products, which were collected hourly using an ice-water trap. The samples were diluted with methanol prior to the GC analysis, and an HP-1MS column was used for the GC-MS analysis. The conversion of GVL and selectivity of MTHF and PDO products were obtained using the equation below.
C o n v e r s i o n   o f   G V L   ( % ) = GVL   moles   ( in ) GVL   moles   ( out ) GVL   moles   ( in ) × 100
S e l e c t i v i t y   ( % ) = moles   of   one   product moles   of   all   products × 100

3. Results and Discussion

3.1. Structure and Composition of the Catalysts

3.1.1. XRD

Figure 1 depicts a variety of Cu/SiO2 catalysts where the CuO crystal structure on the SiO2 support was examined using XRD studies. It was clear that the silica support was in the amorphous condition and could not be seen by XRD because there is no peak corresponding to it. Only the characteristics peaks for the CuO crystalline phase were visible in all catalysts, as shown in Figure 1, which is consistent with a database of conventional CuO (JCPDS No. 80-1268) [34,35]. It is important to note that the peak intensity of CuO was seen to augment with increasing Cu% filling, indicating that increasing Cu% filling in the catalyst promotes the formation of CuO crystallites [34,35,36]. The observed XRD pattern does not contain any peaks associated with any other CuO phase.
Figure 2 displays the catalysts’ XRD patterns following reduction. All catalysts ascribed to metallic Cu were reported to have the two primary diffraction peaks at 2θ = 43.5° and 50.5°. Metallic Cu peak intensity grew as the amount of Cu was loaded, indicating that the amount of Cu(0) crystallinity also increased when the amount of Cu was loaded. Additionally, the CuO peaks were vanishing in the XRD pattern following the reduction of the series of Cu/SiO2 catalysts, showing that CuO had totally reduced to metallic Cu.

3.1.2. BET surface Area
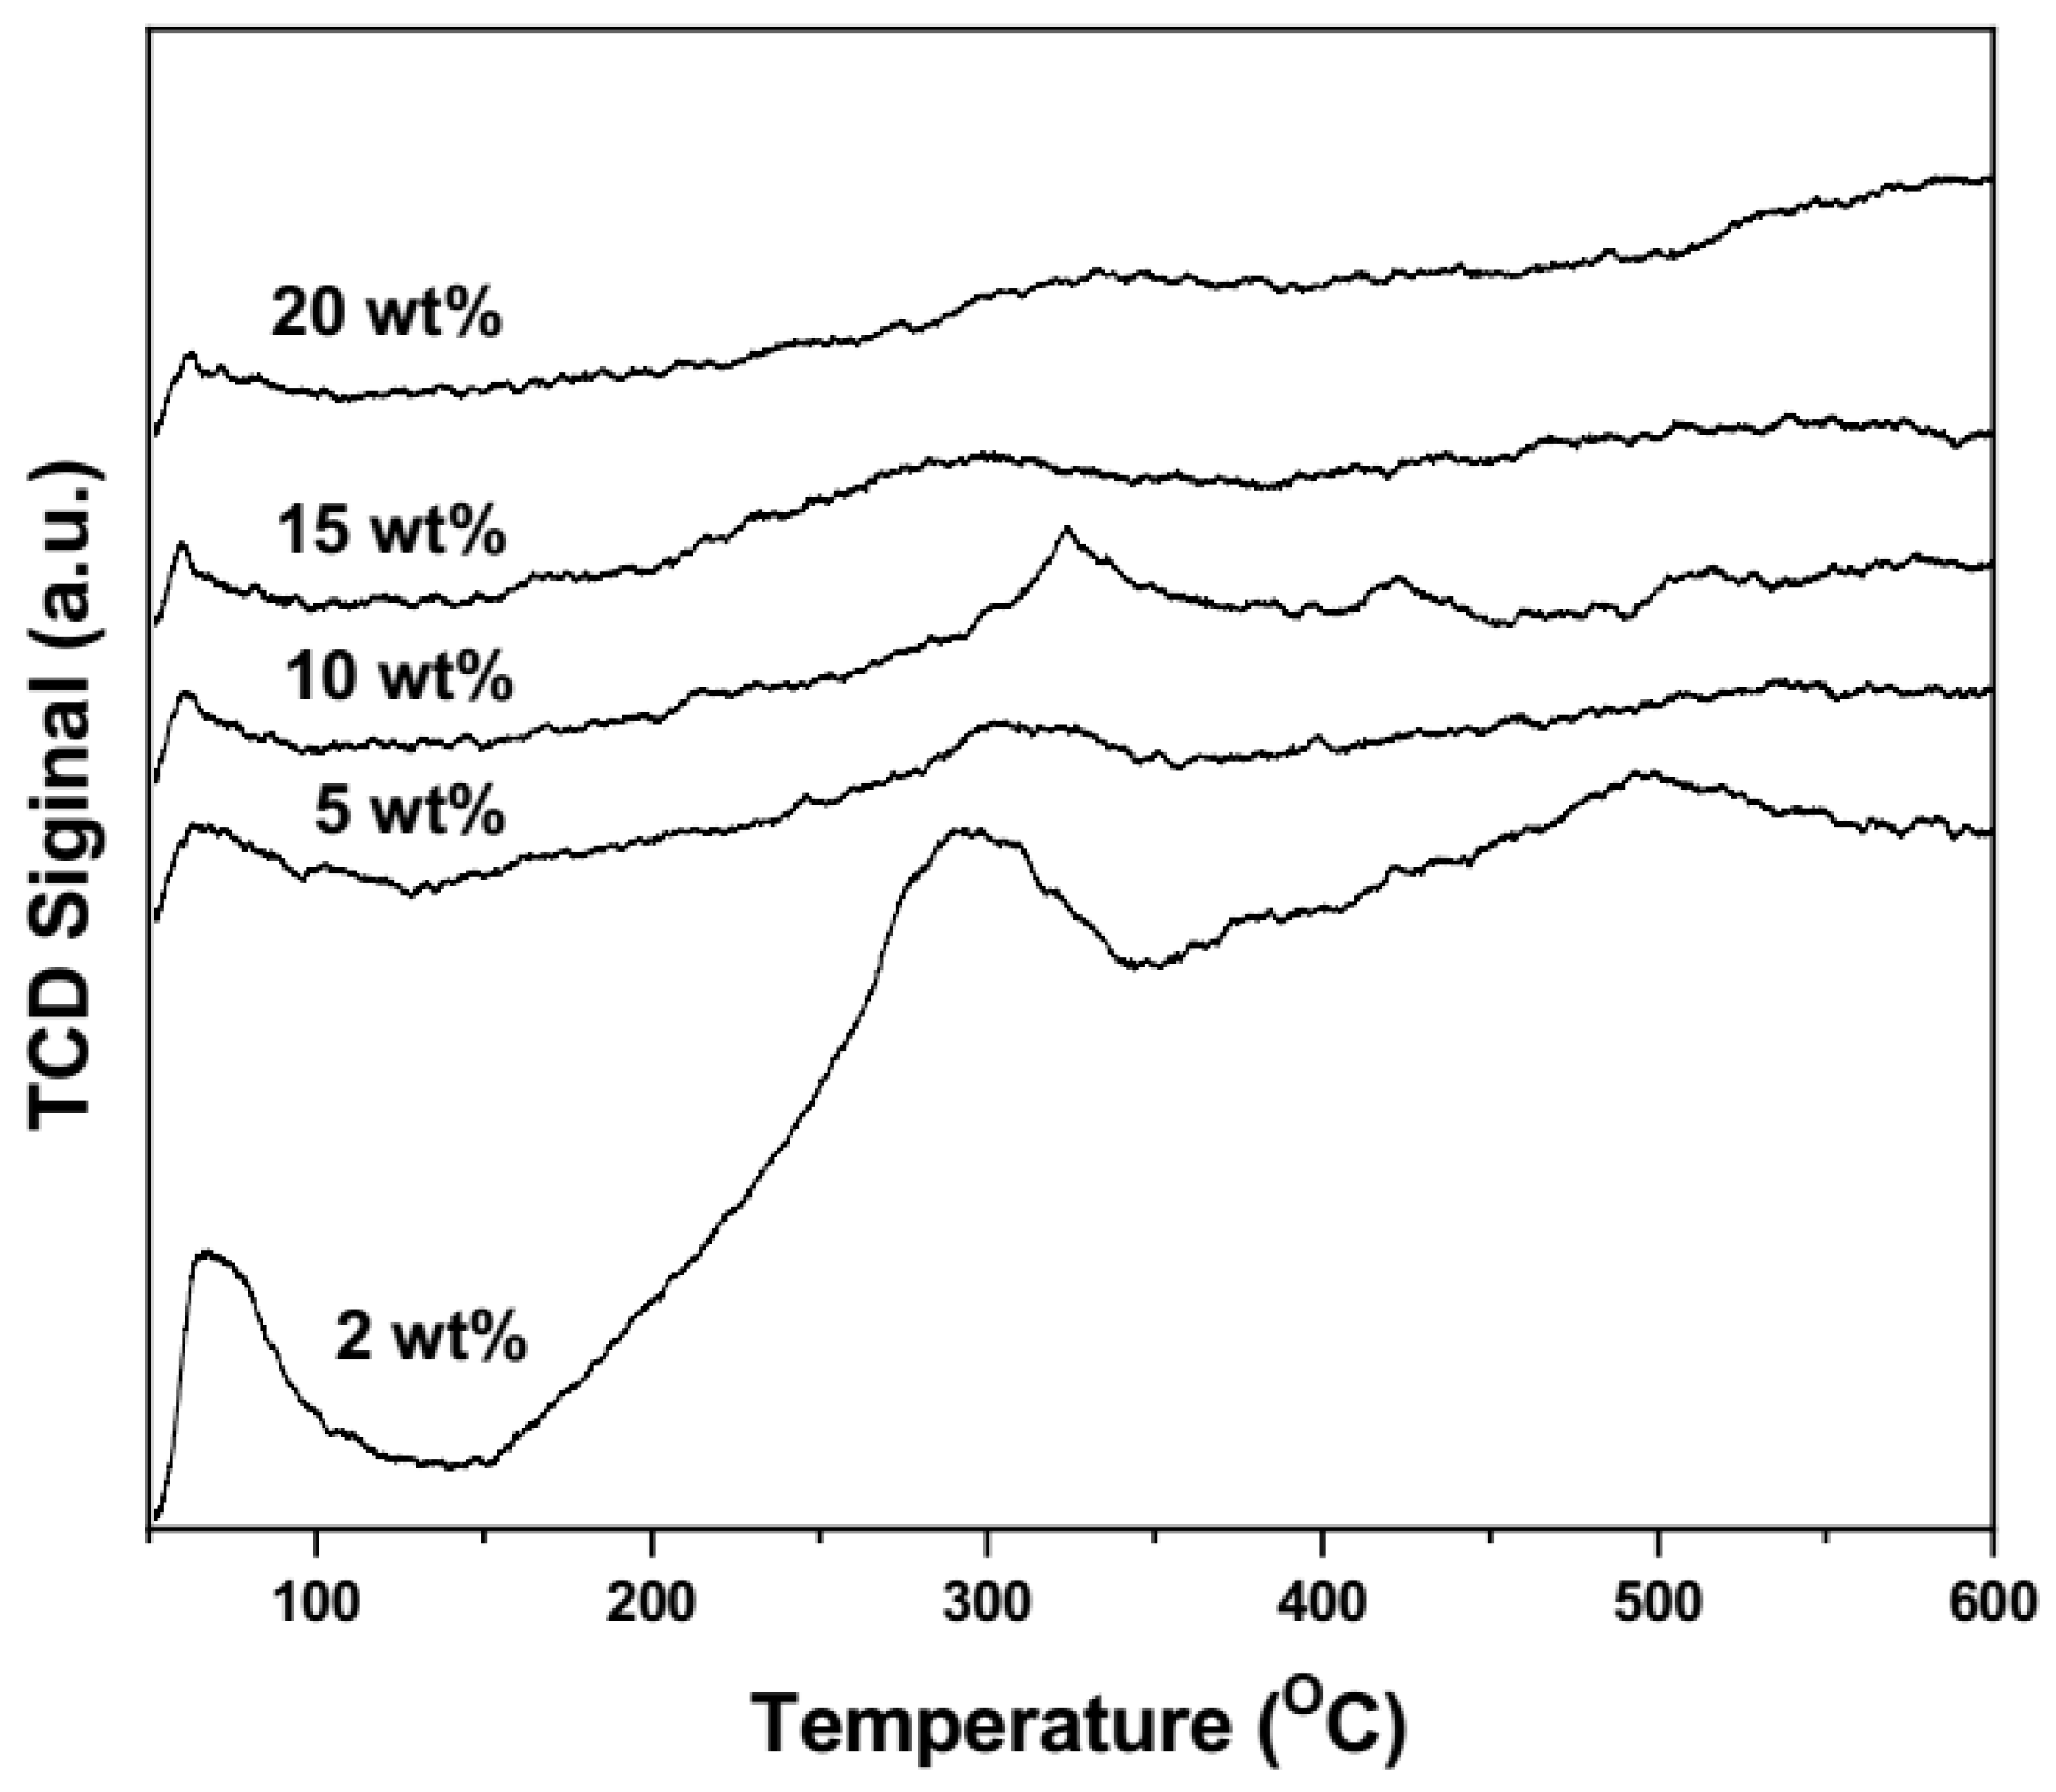
Nitrogen physisorption measurements were utilized to survey the textural characteristics (Table 1) of the various Cu/SiO2 catalysts. The specific surface area and cumulative pore volume of the pristine SiO2 samples were determined to be 346 m2 g−1 and 0.72 cm3 g−1, respectively. A small reduction in surface area was seen after Cu was impregnated into the surface of the SiO2 support. Table 1 shows that when the Cu loading increased, the catalyst surface area and pore volume dropped. This might be because CuO particles have filled the pores, as suggested by the XRD analysis.

3.1.3. H2-TPR

TPR examined the CuO species reducibility behaviour in various Cu/SiO2 catalysts. Figure 3 displays the TPR profiles of Cu/SiO2 catalysts with various Cu loadings, and Table 2 lists the outcomes of hydrogen uptake.
Low Cu loading (2 wt%) in the Cu/SiO2 catalyst had a single broad peak about 280 °C, which may be attributed to the reduction of isolated Cu species, as can be shown in the H2-TPR profiles. Another reduction peak, corresponding to the reduction of CuO crystallites to metallic Cu, arose at a high-temperature region (380 °C), when the Cu loading increased from 2 to 5 wt% [37]. While the high-temperature-peak intensity reached its highest value for the 10 wt% Cu loading in Cu/SiO2, and at a lower temperature region, the peak intensity clearly increased with increasing Cu%, from 2 to 20 wt%. Furthermore, the H2-TPR profile showed another reduction peak when the Cu loading was increased above 10 wt%. However, the peak intensity drastically reduced for samples with Cu loadings greater than 10 wt% at the higher temperature region (380 °C), indicating a weak interaction between Cu and silica [38]. With an increase in the sample’s Cu concentration, the value of hydrogen uptake rises. H2-TPR profiles of various Cu/SiO2 samples demonstrated the steady shift in the highest intensity peak (reduced CuO) at the lower temperature region when the Cu% loading was increased. This downward movement over the spinel phase of the Cu/SiO2, which reduced the interaction of the of the Cu2+ with Si4+ ions, can be attributed to the segregation of CuO [39].
Figure 4 represents the quantity of hydrogen uptake determined from the H2-TPR profile versus Cu% loading. It was discovered that the overall hydrogen consumption matched the quantity needed for the complete conversion of CuO to metallic Cu. As a result, this result provided strong support for the XRD results.

3.1.4. UV–Vis DRS

The electronic state of different Cu/SiO2 catalysts can be studied using electronic spectroscopy in the UV–visible range (Figure 5). One band at approximately 200–250 nm and a broad absorption band at 350–800 nm were fitted to the spectra. In mononuclear or isolated species, O2− to Cu2+ ligand-to-metal charge-transfer causes the first maximum in UV–Vis DRS spectra at 235 nm [40]. With an increase in Cu loading, this band was somewhat moved to a higher-wavelength region. The wide absorption band at 525 nm is due to Cu 2p electron d-d transitions in octahedral Cu particles which are surrounded by oxygen [41,42]. With an increasing Cu loading, this broad charge transfer band’s strength declines, and its position also appeared to migrate towards longer wavelengths.

3.1.5. N2O decomposition
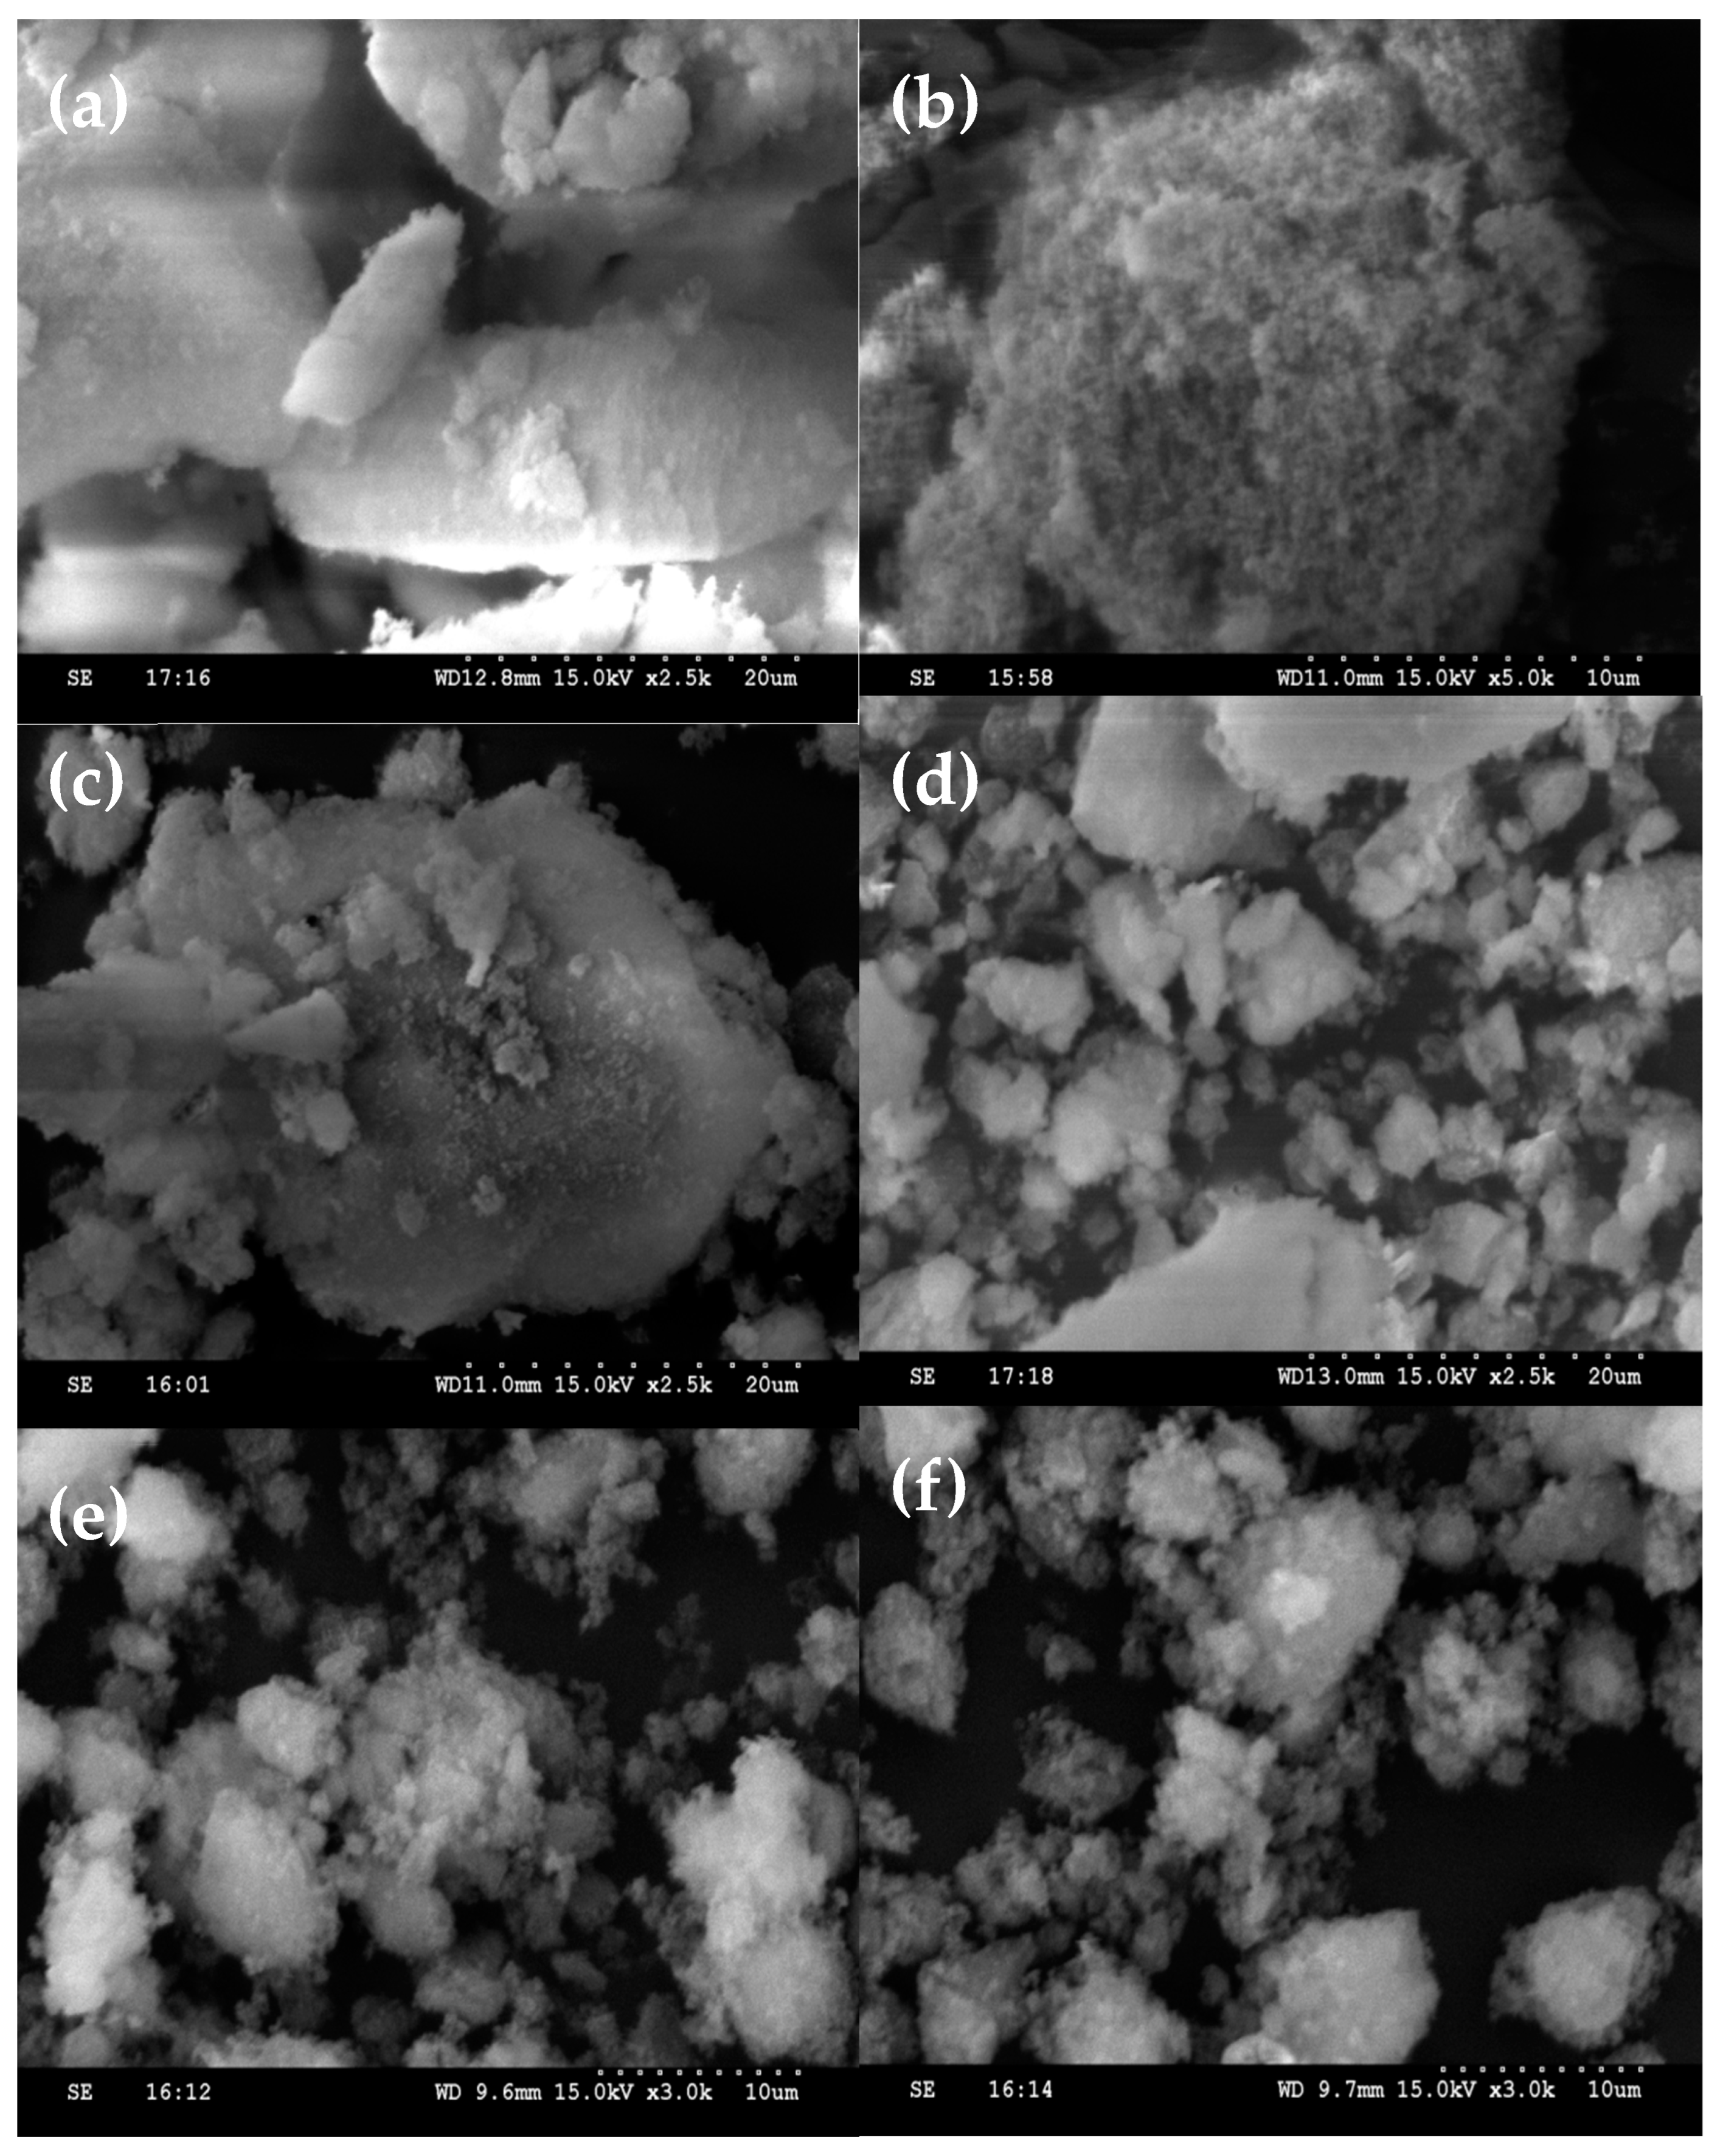
The Cu percentage dispersion in SiO2 support, Cu metal specific surface area (m2/g Cu), and Cu metal crystallize size (nm) were calculated using the N2O decomposition method (Table 3). According to Table 3, there is a maximum value for the dispersion and specific copper surface area for the 5 wt% Cu supported on an SiO2 sample. Cu surface area dropped to 34 m2/gCu when the Cu filling rose from 2 to 20 wt%. This finding indicated that increasing the Cu fiilling on the SiO2 support did not increase the number of Cu species shown. In fact, it actually prevented Cu species from spreading over the support. The accumulation of Cu clusters with a strong development in three dimensions, as evidenced by the increase in average size of Cu crystallites. As a result, an increased Cu loading on the SiO2 support reduced the Cu dispersion. These data are in excellent consistency with the TPR and XRD findings.

3.1.6. SEM

SEM was used to examine the morphology of several Cu/SiO2 catalysts, as well as pure SiO2 supports. Figure 6 displays the SEM images corresponding to various Cu loadings. The creation of three-dimensional CuO phase structures for the supported catalyst is clearly seen in the various Cu/SiO2 catalysts. Due to the development of Cu crystallites in all samples, it was expected that there would be no monolayer-like dispersion. From 10 wt% Cu loadings, the development of CuO accumulation into three-dimensional structures became increasingly apparent. According to XRD and TPR studies, a heavy Cu% filling causes poor dispersion because the crystallites become larger and take on a three-dimensional shape.

3.1.7. TEM

To further examine the microstructure of the best catalyst, images of the 5 wt% Cu/SiO2 catalyst were taken with different resolutions of TEM. TEM is a crucial technique in providing details regarding the size distribution, morphology, and particle size of Cu particles on the SiO2. Size distribution histograms obtained from TEM images and their particle size analysis, which counted extent 200 particles in each image, are displayed in Figure 7. The average Cu crystallite size of the reduced 5 wt% Cu/SiO2 catalyst was found to be 4.3 ± 0.6 nm. This implied that the Cu species active component is uniformly dispersed over the SiO2 support. This result is well-matched to the N2O decomposition results. This demonstrates clearly that CuO exists in a uniformly dispersed condition (Figure 6 and Figure 7) and that average Cu crystallites are less at lower Cu% loadings (Table 3) [43].

3.1.8. NH3–TPD

NH3–TPD measurements were utilized to survey the surface acidity of the various Cu/SiO2 catalysts (Figure 8). Table 4 provides a summary of the total acidity in different Cu/SiO2 catalysts, determined from the peak area. The potency and quantity of the catalyst’s acidic sites are shown by the peak temperature and the amount of desorbed NH3, respectively. The desorption of ammonia bound to weak acid sites and physisorbed ammonia molecules was primarily responsible for the low-temperature peak in the ammonia TPD profiles, which is centred at 60–80 °C. The desorption of NH3 from moderate acid sites was responsible for the high-temperature desorption peak which was centred at 250–300 °C. The weak acid sites of the pristine SiO2 sample (40 µmol/g) showed a low-temperature peak at 74 °C and the moderate acid sites (192 µmol/g) showed a low-temperature peak at 297 °C, i.e., the total overall acidity of the pristine SiO2 was 232 µmol/g. Increased Cu loadings were observed to be inferior, as shown by the low-temperature desorption peak of NH3-TPD profile, because the catalyst surface area was reduced. On the other hand, the high-temperature NH3 desorbed peak is most pronounced at low Cu loadings, and gradually diminishes as Cu loading increases, suggesting a loss of adsorption sites caused by the agglomeration of Cu ions with the development of tiny CuO crystallites. Increasing Cu loading on the support resulted in a decrease in the overall acidity of the Cu/SiO2 catalysts. The highest amount of acidic strength was seen in the 5 wt% Cu/SiO2 catalyst, which is advantageous for the greater conversion activity of GVL to MTHF.

3.2. Catalytic Activity

3.2.1. Influence of Cu Loading on SiO2 Support

We preliminarily investigated the GVL hydrogenation over various Cu/SiO2 catalysts by looking at the effect of metal loading on catalytic performance, as portrayed in Table 5. GVL conversion increased when Cu loading increased from 2 wt% to 5 wt%; it later decreased when the Cu% loading rose from 10 to 20 wt% at 200 °C and ambient pressure conditions. These findings unequivocally demonstrated that the reaction rate is significantly influenced by the acid concentration. The best and optimized results can be obtained using the 5 wt% Cu/SiO2 catalyst, which exhibited GVL conversion and MTHF selectivity as 21.6% and 98.1%, respectively. Due to the high diffusivity of Cu species on the SiO2 surface, favorable conditions for the maximum catalytic activity of 5 wt% Cu/SiO2 were created, with good dispersion of Cu, smaller particle sizes and strong acidic site availability, as confirmed by BET surface area, N2O decomposition and NH3-TPD studies.
The decline in the Cu-specific surface area and its corresponding surface acidity may be tentatively responsible for the drop-in activity with the increase in Cu content from 10 to 20 wt%. It should be noted that because the support had a smaller surface area, the multilayer deposition of active sites on the support prevents a higher Cu loading from necessarily leading to higher activities. According to these findings, the GVL conversion and selectivity were directly correlated with the acid concentration and the active Cu sites of the catalyst.

3.2.2. Influence of TOF

The relationship between Cu loading and TOF is displayed in Figure 9, which can be used to determine the relationship between the hydrogenation of GVL and the amount of Cu loading. The rate of GVL molecules transformed per unit of time per exposed Cu site is known as TOF. Cu dispersion and hydrogenation activity are suggested to have a structure–activity link in Figure 9. Because of the CuO crystallite growth on the surface of the SiO2 support, it was discovered that the conversion decreased as the CuO loading was increased up to 20 wt%.
As shown in Table 6, the decline in the selectivity of GVL is presumably because of reduced dispersion and the greater particle size of Cu, which is evidently shown through the decomposition of N2O and XRD tests. The findings in Table 6 also imply a strong relationship between the catalyst’s activity and the N2O decomposition data.

3.2.3. Influence of Reaction Temperature

The results of the investigation into the effects of reaction temperature on the hydrogenation reaction of GVL by the 5 wt% Cu/SiO2 catalyst in the 200–300 °C temperature range are summarised in Table 7. With an increase in reaction temperature from 200 to 300 °C, GVL conversion increases. A lack of sufficient energy for GVL dehydration into MTHF could be the cause of the low conversion seen at lower temperatures. The selectivity of MTHF drops from 91% to 84% when the reaction temperature rises from 200 to 300 °C. On the other hand, because the dehydration product of GVL has taken over, reaction temperatures beyond 260 °C are undesirable for this reaction.

3.2.4. Influence of WHSV

The effects of WHSV (0.525, 1.05, 1.575 and 2.10 h−1 with respect to GVL) on the GVL hydrogenation procedure were examined using a 5 wt% Cu/SiO2 catalyst. Figure 10 presents the WHSV values calculated while keeping the catalyst’s weight constant by increasing the GVL input flow from 0.25 mL/h (WHSV = 0.525 h−1) to 1.0 mL/h (WHSV = 2.10 h−1). Due to an increase in the feed’s contact time with the catalyst surface, the greatest GVL conversion and MTHF selectivity were seen at saturated WHSV (1.05 h−1). Because the feed’s retention time fell, along with the catalyst’s surface area, as WHSV increased from 1.05 to 2.1 h−1, the GVL conversion and MTHF selectivity also reduced.

3.2.5. Influence of Time-on-Stream

A 33 h investigation into the impact of stream time on conversion and selectivity using a 5 wt% Cu/SiO2 catalyst at 260 °C is depicted in Figure 11. This catalyst exhibits stable catalytic activity towards both the GVL conversion and MTHF selectivity. No change was observed, even at the start of the 33 h investigation. Hence, this catalyst does not show any catalytic deactivation for this reaction, probably due to the mild reaction conditions and the highly suppressed coke formation and active sites sintering. Moreover, metal leaching did not appear which might also be accounted for by the lower metal (5 wt% Cu) loading of the SiO2 support.

3.2.6. Deactivation Studies

To further investigate catalyst stability, the spent 5 wt% Cu/SiO2 catalyst was analyzed by XRD and the results are shown in Figure 12. It can be seen from Figure 2 that the reduced 5 wt% Cu/SiO2 catalyst has two primary Cu metallic-related diffraction peaks at 2θ = 43.5° and 50.5°. The XRD pattern of the spent catalyst displayed a number of intense peaks associated with CuO and Cu2O species. CuO peaks in the used catalyst may result from highly distributed Cu phase oxidation interacting with the support, and a rise in the strength of the CuO peaks may be caused by an increase in the size of the CuO species crystallites. As a result, the reductive regeneration of a used catalyst during thermal conversion, while hydrogen flow was present, improved the recovery of catalytic activity.

4. Conclusions

The fabrication of catalysts with varying Cu loadings (2–20 wt%) with SiO2 support by wet-impregnation is an inexpensive and efficient method, following calcination. The prepared catalysts were characterized by physicochemical measurements. The results showed that the best catalyst had a surface area of 194 m2 g−1, a pore volume of 0.2199 cm3 g−1, a Cu metal area of 132 m2 g−1, a dispersion of Cu of 20.6%, and 133 µmol g−1 of acidic sites. Various reaction conditions, including the effect of Cu loading, temperature, time and catalyst concentration were optimized in the reaction protocol for the selective vapour-phase conversion of GVL to MTHF. A 5 wt% Cu/SiO2 catalyst exhibited high catalytic activity, selectivity and stability due to the high dispersion of Cu on the support, the surface area, the acidic sites and the H2 activation ability. This work proposes an efficient route for the vapour-phase catalytic selective hydrogenation of biomass resources.

Author Contributions

R.P. and R.B. (Rajender Boddula): conceptualization, methodology, supervision, writing, and editing—original draft; P.C., R.R., P.B., R.B. (Ravi Balaga), A.B.R., A.M.A. and V.P.: data curation and results analysis; funding acquisition N.A.-Q. All authors have read and agreed to the published version of the manuscript.

Funding

This work was supported by Qatar University through a National Capacity Building Program Grant (NCBP), [QUCP-CAM-2022-463]. Statements made herein are solely the responsibility of the authors. Ramyakrishna Pothu acknowledges the China Scholarship Council (CSC) (Award number: 2017SLJ018367), China, for the financial support.

Institutional Review Board Statement

Not applicable.

Informed Consent Statement

Not applicable.

Data Availability Statement

Data are contained within the article.

Conflicts of Interest

The authors declare no conflict of interest.

References

  1. Kumar, P.; Varkolu, M.; Mailaram, S.; Kunamalla, A.; Maity, S.K. Biorefinery Polyutilization Systems: Production of Green Transportation Fuels From Biomass. In Polygeneration with Polystorage for Chemical and Energy Hubs; Elsevier: Amsterdam, The Netherlands, 2019; pp. 373–407. [Google Scholar]
  2. Jing, Y.; Guo, Y.; Xia, Q.; Liu, X.; Wang, Y. Catalytic Production of Value-Added Chemicals and Liquid Fuels from Lignocellulosic Biomass. Chem 2019, 5, 2520–2546. [Google Scholar] [CrossRef]
  3. Ye, L.; Han, Y.; Feng, J.; Lu, X. A Review about GVL Production from Lignocellulose: Focusing on the Full Components Utilization. Ind. Crops Prod. 2020, 144, 112031. [Google Scholar] [CrossRef]
  4. Khoo, H.H.; Wong, L.L.; Tan, J.; Isoni, V.; Sharratt, P. Synthesis of 2-Methyl Tetrahydrofuran from Various Lignocellulosic Feedstocks: Sustainability Assessment via LCA. Resour. Conserv. Recycl. 2015, 95, 174–182. [Google Scholar] [CrossRef]
  5. Stadler, B.M.; Brandt, A.; Kux, A.; Beck, H.; Vries, J.G. Properties of Novel Polyesters Made from Renewable 1,4-Pentanediol. ChemSusChem 2020, 13, 556–563. [Google Scholar] [CrossRef] [PubMed]
  6. Pace, V.; Hoyos, P.; Castoldi, L.; Domínguez de María, P.; Alcántara, A.R. 2-Methyltetrahydrofuran (2-MeTHF): A Biomass-Derived Solvent with Broad Application in Organic Chemistry. ChemSusChem 2012, 5, 1369–1379. [Google Scholar] [CrossRef] [PubMed]
  7. Englezou, G.; Kortsen, K.; Pacheco, A.A.C.; Cavanagh, R.; Lentz, J.C.; Krumins, E.; Sanders-Velez, C.; Howdle, S.M.; Nedoma, A.J.; Taresco, V. 2-Methyltetrahydrofuran (2-MeTHF) as a Versatile Green Solvent for the Synthesis of Amphiphilic Copolymers via ROP, FRP, and RAFT Tandem Polymerizations. J. Polym. Sci. 2020, 58, 1571–1581. [Google Scholar] [CrossRef]
  8. Monticelli, S.; Castoldi, L.; Murgia, I.; Senatore, R.; Mazzeo, E.; Wackerlig, J.; Urban, E.; Langer, T.; Pace, V. Recent Advancements on the Use of 2-Methyltetrahydrofuran in Organometallic Chemistry. Mon. Fur Chem. 2017, 148, 37–48. [Google Scholar] [CrossRef] [PubMed]
  9. Alcantara, A.R.; de Maria, P.D. Recent Advances on the Use of 2-Methyltetrahydrofuran (2-MeTHF) in Biotransformations. Curr. Green Chem. 2018, 5, 86–103. [Google Scholar] [CrossRef]
  10. Kar, Y.; Deveci, H. Importance of P-Series Fuels for Flexible-Fuel Vehicles (FFVs) and Alternative Fuels. Energy Sources Part A Recovery Util. Environ. Eff. 2006, 28, 909–921. [Google Scholar] [CrossRef]
  11. Climent, M.J.; Corma, A.; Iborra, S. Conversion of Biomass Platform Molecules into Fuel Additives and Liquid Hydrocarbon Fuels. Green Chem. 2014, 16, 516. [Google Scholar] [CrossRef] [Green Version]
  12. Seretis, A.; Diamantopoulou, P.; Thanou, I.; Tzevelekidis, P.; Fakas, C.; Lilas, P.; Papadogianakis, G. Recent Advances in Ruthenium-Catalyzed Hydrogenation Reactions of Renewable Biomass-Derived Levulinic Acid in Aqueous Media. Front. Chem. 2020, 8, 221. [Google Scholar] [CrossRef] [PubMed]
  13. Pothu, R.; Gundeboyina, R.; Boddula, R.; Perugopu, V.; Ma, J. Recent Advances in Biomass-Derived Platform Chemicals to Valeric Acid Synthesis. New J. Chem. 2022, 46, 5907–5921. [Google Scholar] [CrossRef]
  14. Tabassum, N.; Pothu, R.; Pattnaik, A.; Boddula, R.; Balla, P.; Gundeboyina, R.; Challa, P.; Rajesh, R.; Perugopu, V.; Mameda, N.; et al. Heterogeneous Catalysts for Conversion of Biodiesel-Waste Glycerol into High-Added-Value Chemicals. Catalysts 2022, 12, 767. [Google Scholar] [CrossRef]
  15. Wang, J.; Liu, J.; Yu, X.; Zhang, W.; Zhang, G.; Liu, M.; Shen, J.; Yang, C.; Jin, X. Non-Noble Metal Catalysts for Transfer Hydrogenation of Levulinic Acid: The Role of Surface Morphology and Acid-Base Pairs. Mater. Today Energy 2020, 18, 100501. [Google Scholar] [CrossRef]
  16. Sun, D.; Saito, T.; Yamada, Y.; Chen, X.; Sato, S. Hydrogenation of γ-Valerolactone to 1,4-Pentanediol in a Continuous Flow Reactor. Appl. Catal. A Gen. 2017, 542, 289–295. [Google Scholar] [CrossRef]
  17. Licursi, D.; Antonetti, C.; Fulignati, S.; Giannoni, M.; Raspolli Galletti, A.M. Cascade Strategy for the Tunable Catalytic Valorization of Levulinic Acid and γ-Valerolactone to 2-Methyltetrahydrofuran and Alcohols. Catalysts 2018, 8, 277. [Google Scholar] [CrossRef]
  18. Huang, X.; Kudo, S.; Ashik, U.P.M.; Einaga, H.; Hayashi, J. Selective Hydrodeoxygenation of γ-Valerolactone over Silica-Supported Rh-Based Bimetallic Catalysts. Energy Fuels 2020, 34, 7190–7197. [Google Scholar] [CrossRef]
  19. Bucciol, F.; Tabasso, S.; Grillo, G.; Menegazzo, F.; Signoretto, M.; Manzoli, M.; Cravotto, G. Boosting Levulinic Acid Hydrogenation to Value-Added 1,4-Pentanediol Using Microwave-Assisted Gold Catalysis. J. Catal. 2019, 380, 267–277. [Google Scholar] [CrossRef]
  20. Mizugaki, T.; Togo, K.; Maeno, Z.; Mitsudome, T.; Jitsukawa, K.; Kaneda, K. One-Pot Transformation of Levulinic Acid to 2-Methyltetrahydrofuran Catalyzed by Pt–Mo/H-β in Water. ACS Sustain. Chem. Eng. 2016, 4, 682–685. [Google Scholar] [CrossRef]
  21. Ramírez Bocanegra, N.; Suarez Vázquez, S.I.; Sandoval Rangel, L.; Garza Navarro, M.A.; Rivera de la Rosa, J.; Lucio Ortiz, C.J.; Flores-Escamilla, G.A.; Santos López, I.A.; Carrillo Pedraza, E.S.; Bravo Sánchez, M.; et al. Catalytic Conversion of GVL to Biofuels Using Cu and Pt Catalysts over Microwave-Synthesized FAU Zeolite. Catal. Today 2022, 392–393, 105–115. [Google Scholar] [CrossRef]
  22. Mehdi, H.; Fábos, V.; Tuba, R.; Bodor, A.; Mika, L.T.; Horváth, I.T. Integration of Homogeneous and Heterogeneous Catalytic Processes for a Multi-Step Conversion of Biomass: From Sucrose to Levulinic Acid, γ-Valerolactone, 1,4-Pentanediol, 2-Methyl-Tetrahydrofuran, and Alkanes. Top. Catal. 2008, 48, 49–54. [Google Scholar] [CrossRef]
  23. Maumela, M.; Marx, S.; Meijboom, R. Heterogeneous Ru Catalysts as the Emerging Potential Superior Catalysts in the Selective Hydrogenation of Bio-Derived Levulinic Acid to γ-Valerolactone: Effect of Particle Size, Solvent, and Support on Activity, Stability, and Selectivity. Catalysts 2021, 11, 292. [Google Scholar] [CrossRef]
  24. Li, W.; Xie, J.-H.; Yuan, M.-L.; Zhou, Q.-L. Ruthenium Complexes of Tetradentate Bipyridine Ligands: Highly Efficient Catalysts for the Hydrogenation of Carboxylic Esters and Lactones. Green Chem. 2014, 16, 4081. [Google Scholar] [CrossRef]
  25. Phanopoulos, A.; White, A.J.; Long, N.J.; Miller, P.W. Catalytic Transformation of Levulinic Acid to 2-Methyltetrahydrofuran Using Ruthenium–N-Triphos Complexes. ACS Catal. 2015, 15, 2500–2512. [Google Scholar] [CrossRef]
  26. Elangovan, S.; Wendt, B.; Topf, C.; Bachmann, S.; Scalone, M.; Spannenberg, A.; Jiao, H.; Baumann, W.; Junge, K.; Beller, M. Improved Second Generation Iron Pincer Complexes for Effective Ester Hydrogenation. Adv. Synth. Catal. 2016, 358, 820–825. [Google Scholar] [CrossRef]
  27. Korstanje, T.J.; van der Vlugt, J.I.; Elsevier, C.J.; de Bruin, B. Hydrogenation of Carboxylic Acids with a Homogeneous Cobalt Catalyst. Science 2015, 350, 298–302. [Google Scholar] [CrossRef] [PubMed]
  28. Srimani, D.; Mukherjee, A.; Goldberg, A.F.G.; Leitus, G.; Diskin-Posner, Y.; Shimon, L.J.W.; Ben David, Y.; Milstein, D. Cobalt-Catalyzed Hydrogenation of Esters to Alcohols: Unexpected Reactivity Trend Indicates Ester Enolate Intermediacy. Angew. Chem. Int. Ed. 2015, 54, 12357–12360. [Google Scholar] [CrossRef]
  29. Zhai, X.; Li, C.; Di, X.; Yin, D.; Liang, C. Preparation of Cu/MgO Catalysts for γ-Valerolactone Hydrogenation to 1,4-Pentanediol by MOCVD. J. Fuel Chem. Technol. 2017, 45, 537–546. [Google Scholar] [CrossRef]
  30. Fan, M.; Shao, Y.; Sun, K.; Li, Q.; Zhang, S.; Wang, Y.; Xiang, J.; Hu, S.; Wang, S.; Hu, X. Switching Production of γ-Valerolactone and 1,4-Pentanediol from Ethyl Levulinate via Tailoring Alkaline Sites of CuMg Catalyst and Hydrogen Solubility in Reaction Medium. Mol. Catal. 2021, 510, 111680. [Google Scholar] [CrossRef]
  31. Du, X.-L.; Bi, Q.-Y.; Liu, Y.-M.; Cao, Y.; He, H.-Y.; Fan, K.-N. Tunable Copper-Catalyzed Chemoselective Hydrogenolysis of Biomass-Derived γ-Valerolactone into 1,4-Pentanediol or 2-Methyltetrahydrofuran. Green Chem. 2012, 14, 935. [Google Scholar] [CrossRef]
  32. Cavuoto, D.; Ravasio, N.; Scotti, N.; Gervasini, A.; Campisi, S.; Marelli, M.; Cappelletti, G.; Zaccheria, F. A Green Solvent Diverts the Hydrogenation of γ–Valerolactone to 1,4-Pentandiol over Cu/SiO2. Mol. Catal. 2021, 516, 111936. [Google Scholar] [CrossRef]
  33. Simakova, I.; Demidova, Y.; Simonov, M.; Prikhod’ko, S.; Niphadkar, P.; Bokade, V.; Dhepe, P.; Murzin, D.Y. Heterogeneously Catalyzed γ-Valerolactone Hydrogenation into 1,4-Pentanediol in Milder Reaction Conditions. Reactions 2020, 1, 54–71. [Google Scholar] [CrossRef]
  34. Putrakumar, B.; Seelam, P.K.; Srinivasarao, G.; Rajan, K.; Harishekar, M.; Riitta, K.; Liang, T.X. A Comparison of Structure–Activity of Cu-Modified Over Different Mesoporous Silica Supports for Catalytic Conversion of Levulinic Acid. Waste Biomass Valorization 2022, 13, 67–79. [Google Scholar] [CrossRef]
  35. Dong, F.; Meng, Y.; Han, W.; Zhao, H.; Tang, Z. Morphology Effects on Surface Chemical Properties and Lattice Defects of Cu/CeO2 Catalysts Applied for Low-Temperature CO Oxidation. Sci. Rep. 2019, 9, 12056. [Google Scholar] [CrossRef] [PubMed]
  36. Yin, A.; Guo, X.; Dai, W.-L.; Fan, K. The Nature of Active Copper Species in Cu-HMS Catalyst for Hydrogenation of Dimethyl Oxalate to Ethylene Glycol: New Insights on the Synergetic Effect between Cu0 and Cu+. J. Phys. Chem. C 2009, 113, 11003–11013. [Google Scholar] [CrossRef]
  37. Marchi, A.J.; Fierro, J.L.G.; Santamaría, J.; Monzón, A. Dehydrogenation of Isopropylic Alcohol on a Cu/SiO2 Catalyst: A Study of the Activity Evolution and Reactivation of the Catalyst. Appl. Catal. A Gen. 1996, 142, 375–386. [Google Scholar] [CrossRef]
  38. Wang, Z.; Liu, Q.; Yu, J.; Wu, T.; Wang, G. Surface Structure and Catalytic Behavior of Silica-Supported Copper Catalysts Prepared by Impregnation and Sol–Gel Methods. Appl. Catal. A Gen. 2003, 239, 87–94. [Google Scholar] [CrossRef]
  39. Torresi, P.A.; Díez, V.K.; Luggren, P.J.; Di Cosimo, J.I. Conversion of Diols by Dehydrogenation and Dehydration Reactions on Silica-Supported Copper Catalysts. Appl. Catal. A Gen. 2013, 458, 119–129. [Google Scholar] [CrossRef]
  40. Popova, M.; Dimitrov, M.; Santo, V.D.; Ravasio, N.; Scotti, N. Dehydrogenation of Cyclohexanol on Copper Containing Catalysts: The Role of the Support and the Preparation Method. Catal. Commun. 2012, 17, 150–153. [Google Scholar] [CrossRef]
  41. An, D.; Zhang, Q.; Wang, Y. Copper Grafted on SBA-15 as Efficient Catalyst for the Selective Oxidation of Methane by Oxygen. Catal. Today 2010, 157, 143–148. [Google Scholar] [CrossRef]
  42. Karthik, M.; Lin, L.-Y.; Bai, H. Bifunctional Mesoporous Cu–Al–MCM-41 Materials for the Simultaneous Catalytic Abatement of NOx and VOCs. Microporous Mesoporous Mater. 2009, 117, 153–160. [Google Scholar] [CrossRef]
  43. Liu, X.; Wang, A.; Yang, X.; Zhang, T.; Mou, C.-Y.; Su, D.-S.; Li, J. Synthesis of Thermally Stable and Highly Active Bimetallic Au−Ag Nanoparticles on Inert Supports. Chem. Mater. 2009, 21, 410–418. [Google Scholar] [CrossRef]
Scheme 1. Possible routes of MTHF production from GVL over catalytic hydrogenation.
Nanomaterials 12 03414 sch001
Scheme 2. Selective conversion of GVL to MTHF over Cu/SiO2 catalyst.
Nanomaterials 12 03414 sch002
Figure 1. XRD patterns of various Cu/SiO2 catalysts.
Nanomaterials 12 03414 g001
Figure 2. XRD patterns of series of reduced Cu/SiO2 catalysts.
Nanomaterials 12 03414 g002
Figure 3. H2-TPR profiles of various Cu/SiO2 catalysts.
Nanomaterials 12 03414 g003
Figure 4. H2 consumed against Cu loading.
Nanomaterials 12 03414 g004
Figure 5. UV–Vis DRS profiles of various Cu/SiO2 catalysts.
Nanomaterials 12 03414 g005
Figure 6. SEM images of pristine SiO2 (a), 2 wt% (b), 5 wt% (c), 10 wt% (d), 15 wt% (e), 20 wt% (f) of Cu/SiO2 catalysts.
Nanomaterials 12 03414 g006
Figure 7. (a,b) TEM images of 5 wt% Cu/SiO2 catalyst with different resolution and (c) average particle size.
Nanomaterials 12 03414 g007
Figure 8. TPD profiles of various Cu/SiO2 catalysts.
Nanomaterials 12 03414 g008
Figure 9. TOF vs. Cu% loading in different Cu/SiO2 catalysts.
Nanomaterials 12 03414 g009
Figure 10. Influence of WHSV on the catalytic performance of 5 wt% Cu/SiO2. Reaction conditions at various WHSV: 10 wt% GVL of reaction feed, 0.4 g of 5 wt% Cu/SiO2 catalyst, 260 °C reaction temperature.
Nanomaterials 12 03414 g010
Figure 11. Time on stream study of the 5 wt% Cu/SiO2 catalyst.
Nanomaterials 12 03414 g011
Figure 12. XRD pattern of spent 5 wt% Cu/SiO2 catalysts.
Nanomaterials 12 03414 g012
Table 1. Textural properties of various Cu/SiO2 catalysts.
Cu Loading (wt%)Total Pore Volume (cm3 g−1)Average Pore Size (nm)BET Surface Area
(m2 g−1)
20.34215.99228
50.21994.53194
100.17454.56153
150.16614.62144
200.13094.31133
Table 2. H2 consumption and reaction temperature of the various Cu/SiO2 Catalysts from H2-TPR profiles.
Cu Loading
(wt%)
H2 Consumption
(µmol g−1)
Total H2 Consumption
(µmol g−1)
Peak Temperture
T max (°C)
Surface Reduction (Sr)Bulk Reduction
(Br)
SrBr
2195-195282-
5432230662275383
1036510241389269387
152178-2178255-
202834-2834246-
Table 3. Percentage dispersion, average particle size, metal surface area, and H2 uptake of various Cu/SiO2 catalysts from N2O decomposition.
Catalyst Loading
(wt%)
Cu-Dispersion
(%)
Specific Copper Surface Area
(m2 g−1Cu)
H2 Uptake
(µmol g−1)
Average Particle Size
(nm)
218.8120325.55
520.6132815.11
1011.576908.97
158.01529513.2
205.22348120.7
Table 4. NH3-TPD of SBA-15 and different Cu/SiO2 samples.
Cu Loading
(wt%)
NH3 Desorbed
(µmol g−1)
Total
NH3 Desorbed
(µmol g−1)
Peak Temperature
T max (°C)
WeakMediumWeakMedium
21510812371297
51411913370299
108889667292
157566367285
206313768256
Table 5. Hydrogenation of GVL to 2-MTHF over various Cu/SiO2 catalysts with various Cu loadings.
Catalyst (% Cu Loading)GVL
Conv. (%) a
Selectivity (%) b
MTHFPDOOthers
215.496.01.92.1
521.698.10.31.6
1017.190.27.32.4
1514.788.29.13.7
209.472.922.74.3
a Reaction conditions: feed rate of GVL: 0.50 mL h−1; weight of Cu/SiO2 catalyst 0.4 g; reaction temperature: 200 °C; H2 gauge pressure: 0.1 MPa; H2 flow rate 50 cm3 min−1. b MTHF: 2-methyltetrahydrofuran; PDO: 1,4-pentanediol.
Table 6. Comparison between catalytic activity with catalyst properties in different Cu/SiO2 catalysts.
Cu Loading
(wt%)
Specific Copper Surface Area
(m2 g−1Cu)
Average Particle Size of Cu
(nm)
Conversion of GVL
(%)
Selectivity of MTHF (%)
21205.5515.496.0
51325.1121.698.1
10768.9717.190.2
155213.214.788.2
203420.79.472.9
Table 7. Hydrogenation of GVL to 2-MTHF over 5% Cu/SiO2 catalysts over various temperatures.
Reaction Temperature (°C)GVL
Conv. (%) a
Selectivity (%)
MTHFPDOOthers
20021.698.10.31.6
2203598.40.51.1
2404395.62.32.1
26071.997.21.11.7
28082.175.120.64.3
30096.783.913.95.2
a Reaction conditions: feed rate of GVL: 0.50 mL h−1; weight of Cu/SiO2 catalyst: 0.4 g; H2 gauge pressure: 0.1 MPa; H2 flow rate: 50 cm3 min−1.
Publisher’s Note: MDPI stays neutral with regard to jurisdictional claims in published maps and institutional affiliations.

