Article

The Effects of Lengths of Flavin Surfactant N-10-Alkyl Side Chains on Promoting Dispersion of a High-Purity and Diameter-Selective Single-Walled Nanotube

Department of Chemistry, Yonsei University, 50 Yonsei-ro, Seodaemun-gu, Seoul 03722, Korea
*
Author to whom correspondence should be addressed.
Nanomaterials 2022, 12(19), 3380; https://doi.org/10.3390/nano12193380
Submission received: 26 August 2022 / Revised: 17 September 2022 / Accepted: 23 September 2022 / Published: 27 September 2022
(This article belongs to the Section 2D and Carbon Nanomaterials)

Abstract

:
Flavin with defined helical self-assembly helps to understand chemical designs for obtaining high-purity semiconducting (s)-single-walled carbon nanotubes (SWNT) in a diameter (dt)-selective manner for high-end applications. In this study, flavins containing 8, 12, 16, and 20 n-alkyl chains were synthesized, and their single/tandem effects on dt-selective s-SWNT dispersibility were investigated at isomolarity. Flavins with n-dodecyl and longer chain lengths (FC12, FC16, and FC20) act as good surfactants for stable SWNT dispersions whereas n-octyl flavin (FC8) exhibits poor dispersibility owing to the lack of SWNT buoyancy. When used with small-dt SWNT, FC8 displays chirality-selective SWNT dispersion. This behavior, along with various flavin helical motifs, prompts the development of criteria for ‘side chain length (lS)’ required for stable and dt-selective SWNT dispersion, which also explains lS-dependent dt-enrichment behavior. Moreover, SWNT dispersions with flavins with dodecyl and longer lS exhibit increased metallic (m)-SWNT, background absorption-contributing carbonaceous impurities (CIs) and preferential selectivity of s-SWNT with slightly larger dt. The increased CIs that affect the SWNT quantum yield were attributed to a solubility parameter. Furthermore, the effects of flavin lS, sonication bath temperature, centrifugal speed, and surfactant concentration on SWNT purity and s-/m-SWNT ratio were investigated. A tandem FC8/FC12 provides fine-tuning of dt-selective SWNT dispersion, wherein the FC8 ratio governs the tendency towards smaller dt. Kinetic and thermodynamic assemblies of tandem flavins result in different sorting behaviors in which wide dt-tunability was demonstrated using kinetic assembly. This study highlights the importance of appropriate side chain length and other extrinsic parameters to obtain dt-selective or high-purity s-SWNT.

1. Introduction

Single-walled carbon nanotubes (SWNTs), hollow cylindrical forms of rolled-up graphene, are an excellent candidate for next-generation nanodevices. SWNTs have attracted significant attention as next-generation thin-film transistors and energy materials owing to their lightweight and excellent electrical [1,2,3,4] and thermal [5,6,7] properties. However, in these applications, SWNTs in mixtures require separation into metallic (m) and semiconducting (s) forms. Well-known s-SWNT separation methods include ion-column chromatography using DNA [8,9,10], density gradient centrifugation [11,12,13], gel chromatography [14,15,16], aqueous two-phase extraction [17,18,19], and dispersions using poly(fluorene) (PFO) [20,21,22] or flavins [23,24,25,26]. Among these approaches, PFO or flavin derivatives as dispersants enable s-enriched SWNT dispersions by one-pot sonochemical dispersion [20,21,24,25].
Flavins possess a well-defined self-assembly motif for dispersing carbon nanotubes [27,28,29,30,31] and could be easily removed [25] for high-end applications. As shown in Figure 1A, the isoalloxazine ring of the flavin wrapping system exhibits a strong π–π interaction with SWNT and quadruple hydrogen-bonding with the facing isoalloxazine, and its side chain provides dispersibility [27,28]. Flavin mononucleotide (FMN) and n-dodecyl flavin (FC12), which exhibit varied side chains, have been demonstrated as efficient dispersing agents in water [27,32] and organic solvents [24,28,33]. In this regard, efforts have been made to assess how the changes in the flavin core structure, which participates in direct π–π interactions with SWNT, affect the SWNT separation and resultant dispersibility [25]. Particularly, flavins with n-octadecyl side chains have larger SWNT diameter (dt) selectivity than those with dodecyl chains [25]. In addition, PFO with longer side chain length (lS) results in the selection of larger dt SWNT owing to the side chain interaction with SWNT [34]. In the PFO system, one of the dual alkyl side chains in PFO acts as an SWNT-interacting group, selecting different dt by change the distance between surfactants, whereas the other provides dispersibility [34]. Moreover, polythiophene exhibits a similar larger-dt selectivity with increasing lS [35,36,37]. Because flavin side chain does not directly interact with the SWNT sidewalls, its distinct role compared to that of PFO can provide insight into designing novel surfactants with adequate length. Therefore, it is understood that surfactants with specific lS may be selective for smaller-dt SWNT, which requires verification.
Surfactant has specific binding affinity with SWNT metallicity, dt, and handedness. Therefore, different surfactant concentrations lead to different SWNT species selection. When comparing surfactants with analogous SWNT-interacting cores and different lS, it is imperative to reveal the effect of lS while excluding concentration-driven SWNT selectivity. In this regard, we reported that a surface stoichiometry between the flavin footprint/surface area of SWNT exists, and the surfactant/SWNT ratio plays an important role in selecting SWNT chiralities [33,38]. Therefore, the effects of lS in equimolar flavin can explicitly reveal the relationship between SWNT dispersibility and selectivity for obtaining high-purity s-SWNT. Furthermore, the simultaneous use of flavins with different lS further fine-tunes dt selectivity and has not been explored yet.
In this study, we synthesized four flavin derivatives and investigated their single/tandem effects on dt-selective dispersion of high-purity s-SWNT in equimolar flavin. First, the flavin derivatives with octyl to eicosyl lS (that is, FC8, FC12, FC16, and FC20) were synthesized and characterized using various techniques including nuclear magnetic resonance (NMR) and elemental analysis. Notably, increasing lS from FC12 to FC20 increased the m-SWNT and carbonaceous impurities (CIs), whereas FC8 exhibited poor dispersion for larger dt SWNT and chirality-selective dispersion for smaller dt SWNT. The lS per carbon atom in SWNT for providing marginal/good SWNT dispersibility was derived using dt-selective dispersion. The increased CI content in the SWNT dispersion with increasing lS was ascribed to the matched solubility parameter (δ). Various parameters such as lS, centrifugal force, sonication bath temperature, and surfactant concentration were investigated to control the amounts of s-/m-SWNT and SWNT purity. Finally, the tandem use of FC8/FC12 to disperse and control the distribution of SWNT was investigated. The combination of poor and good surfactants results in a large tunability of the selected dt range. Initiated by different FC8/FC12 ratios on SWNT for as-prepared and aged samples, social or narcissistic sortings of flavin self-assembly were demonstrated for sonication- and aging-assisted dispersions.

2. Materials and Methods

2.1. Materials and Instrumentation

Synthesis of flavin derivatives and precursors followed the previous literature [28], which will be elaborated in the Supplementary Materials. 4,5-Dimethyl-1,2-phenylenediamine, 1-chlorooctane, 1-chlorododecane, 1-chlorohexadecane, and 1-chloroeicosane were purchased from TCI. All solvents and chemicals were reagent grade and were used as-received. As-purchased plasma-grown SWNT (PSWNT) (RN-220 SWCNTs, batch #: R26-036, nanotube purity of 30–70%, Nano Integris Inc., Boisbriand, QC, Canada) was used. The SWNT dt distribution was 1.3 ± 0.35 nm. High-pressure carbon monoxide (HiPco) process SWNT (dt distribution: 1.0 ± 0.35 nm, Nano Integris Inc., Boisbriand, QC, Canada) [39] was also used for control. For synthesis, silica gel with 70–230 mesh (Silica gel 60, Merck, Darmstadt, Germany) was used as a stationary phase for flash chromatography. All measurements were carried out at room temperature unless otherwise noted. Melting points (m.p.) of the synthesized compounds were measured using a m.p. apparatus (SMP3, Stuart Scientific, St Neots, UK). 1H and 13C NMR spectra were acquired on a FT-NMR spectrometer (Biospin Avance II and Avance III HD 400, Bruker, Billerica, MA, USA) operating at Larmor frequencies of 400 MHz and 100 MHz, respectively. All spectra were recorded in 5-mm NMR tubes containing 0.70 mL of CDCl3 (DLM-7TB-100S, Cambridge Isotope Lab., Tewksbury, MA, USA) with 0.05% tetramethylsilane (TMS) as an internal reference at 295 K. Elemental analysis was conducted using an elemental analyzer (2400 CHNS/O series II, PerkinElmer, Waltham, MA, USA) in the CHN acquisition mode and calibrated against acetanilide as a reference with a typical error range of ±0.2%. Solubility of flavins in p-xylene was obtained by absorption measurement. Those absorption spectra were obtained from the solution by heating excess flavins in p-xylene and subsequent centrifugation (5000 g for 10 min) and filtration (poly(vinylidene fluoride), 0.2 μm). The resulting solubility was obtained by using extinction coefficient (12,600 L/mol·cm) [40,41]. Fourier-transform infrared (FTIR) spectra were acquired from JASCO FT/IR 4700 (Tokyo, Japan) by using pellets from ground sample/KBr.

2.2. Preparation of SWNT Dispersion

A mixture of PSWNT (1 mg) and flavin derivatives (0.61 mM, i.e., 0.86, 1.00, 1.13, and 1.27 mg for respective FC8, FC12, FC16, and FC20, respectively) was added to p-xylene (4 mL) which was dried over 3 Å molecular sieve (Alfa Aesar, Haverhill, MA, USA) overnight before use. The resulting mixture was subjected to 5 min bath sonication (Branson 1510, 70 W, Emerson, Saint Louis, MO, USA) for mixing, and further to 1 h tip sonication (40% power, 18.8 W/mL, probe tip diameter: 13 mm, VCX 750, Sonics & Materials, Newtown, CT, USA). During sonication, the temperatures of the sample vials were maintained at 15, 25, and 35 °C using an external water circulator (Lab Companion RW-2025G, Jeio Tech, Daejeon, Korea). Centrifugations with typical (5 and 30 kg) and optional (1 and 60 kg) g forces were conducted by using a high-performance centrifuge with a fixed angle rotor (Avanti J-26 XPI and JA-25.50, respectively, Beckman Coulter, Brea, CA, USA) at room temperature using an organic solvent-tolerant centrifugal tube (50 mL, Cat. #: 3114-0050, fluorinated poly(ethylene-co-propylene), Nalgene, Sigma-Aldrich, Saint Louis, MO, USA). 80% of the supernatant was carefully collected for further measurements. For dispersions with lower and higher flavin concentrations, 0.5 and 2.44 mM were utilized. HiPco SWNT was dispersed in a similar manner as mentioned above.

Tandem Surfactant Dispersion

SWNT dispersions with tandem surfactants were obtained by mixing FC12 and other flavin derivatives (i.e., FC8, FC16, and FC20) to maintain 0.61 mM with a similar protocol as mentioned above. Aging experiments were conducted at room temperature.

2.3. Absorption Measurement

UV-vis-short-wavelength infrared (SWIR) absorption spectra were recorded on a JASCO V-770 (Tokyo, Japan) with cuvettes having 1 mm path length (21/Q/1, Starna scientific, Ilford, UK) unless otherwise noted. SWIR rather than near IR was utilized because of the extended measurement up to 2100 nm. Absorbances were measured via a double-beam configuration. Wavelength accuracies for UV-vis and for IR regions were 0.3 nm and 1.5 nm, respectively.

2.4. Photoluminescence Excitation (PLE) Measurement

The measurements were conducted using a Spex Nanolog 3-211 spectrofluorometer (Jobin Yvon, Horiba, Japan). A 450 W xenon lamp (220–1000 nm, Ushio, Tokyo, Japan) was utilized as a light source, according to the literature [32]. A double monochromator with 1200 g/mm blazed at 500 nm was utilized for wavelength selection. Emission from a sample was collected from 90° of the excitation direction, filtered by a 830-nm long-pass filter (RG-830, Schott, Mainz, Germany) and entered into spectrometer (iHR320, 150 g/mm, Horiba, Kyoto, Japan) equipped with a liquid N2-cooled InGaAs array detector (512 × 1 pixels, Symphony II IGA 1600, Horiba, Kyoto, Japan) for the near infrared (NIR) range. The excitation and emission intensities were corrected against instrumental variations using sensitivity correction factors. For PLE map measurement of SWNT, the bandwidth of excitation and emission wavelengths were 14 nm and 10 nm, respectively. The increments of the excitation and emission wavelengths were 5 and 1 nm, respectively. Fluorescence quartz cuvette (QS, Hellma, Plainview, NY, USA) with a 10 mm beam-pass was utilized for the measurement. The InGaAs detector in our setup had a detection limits up to 1600 nm.

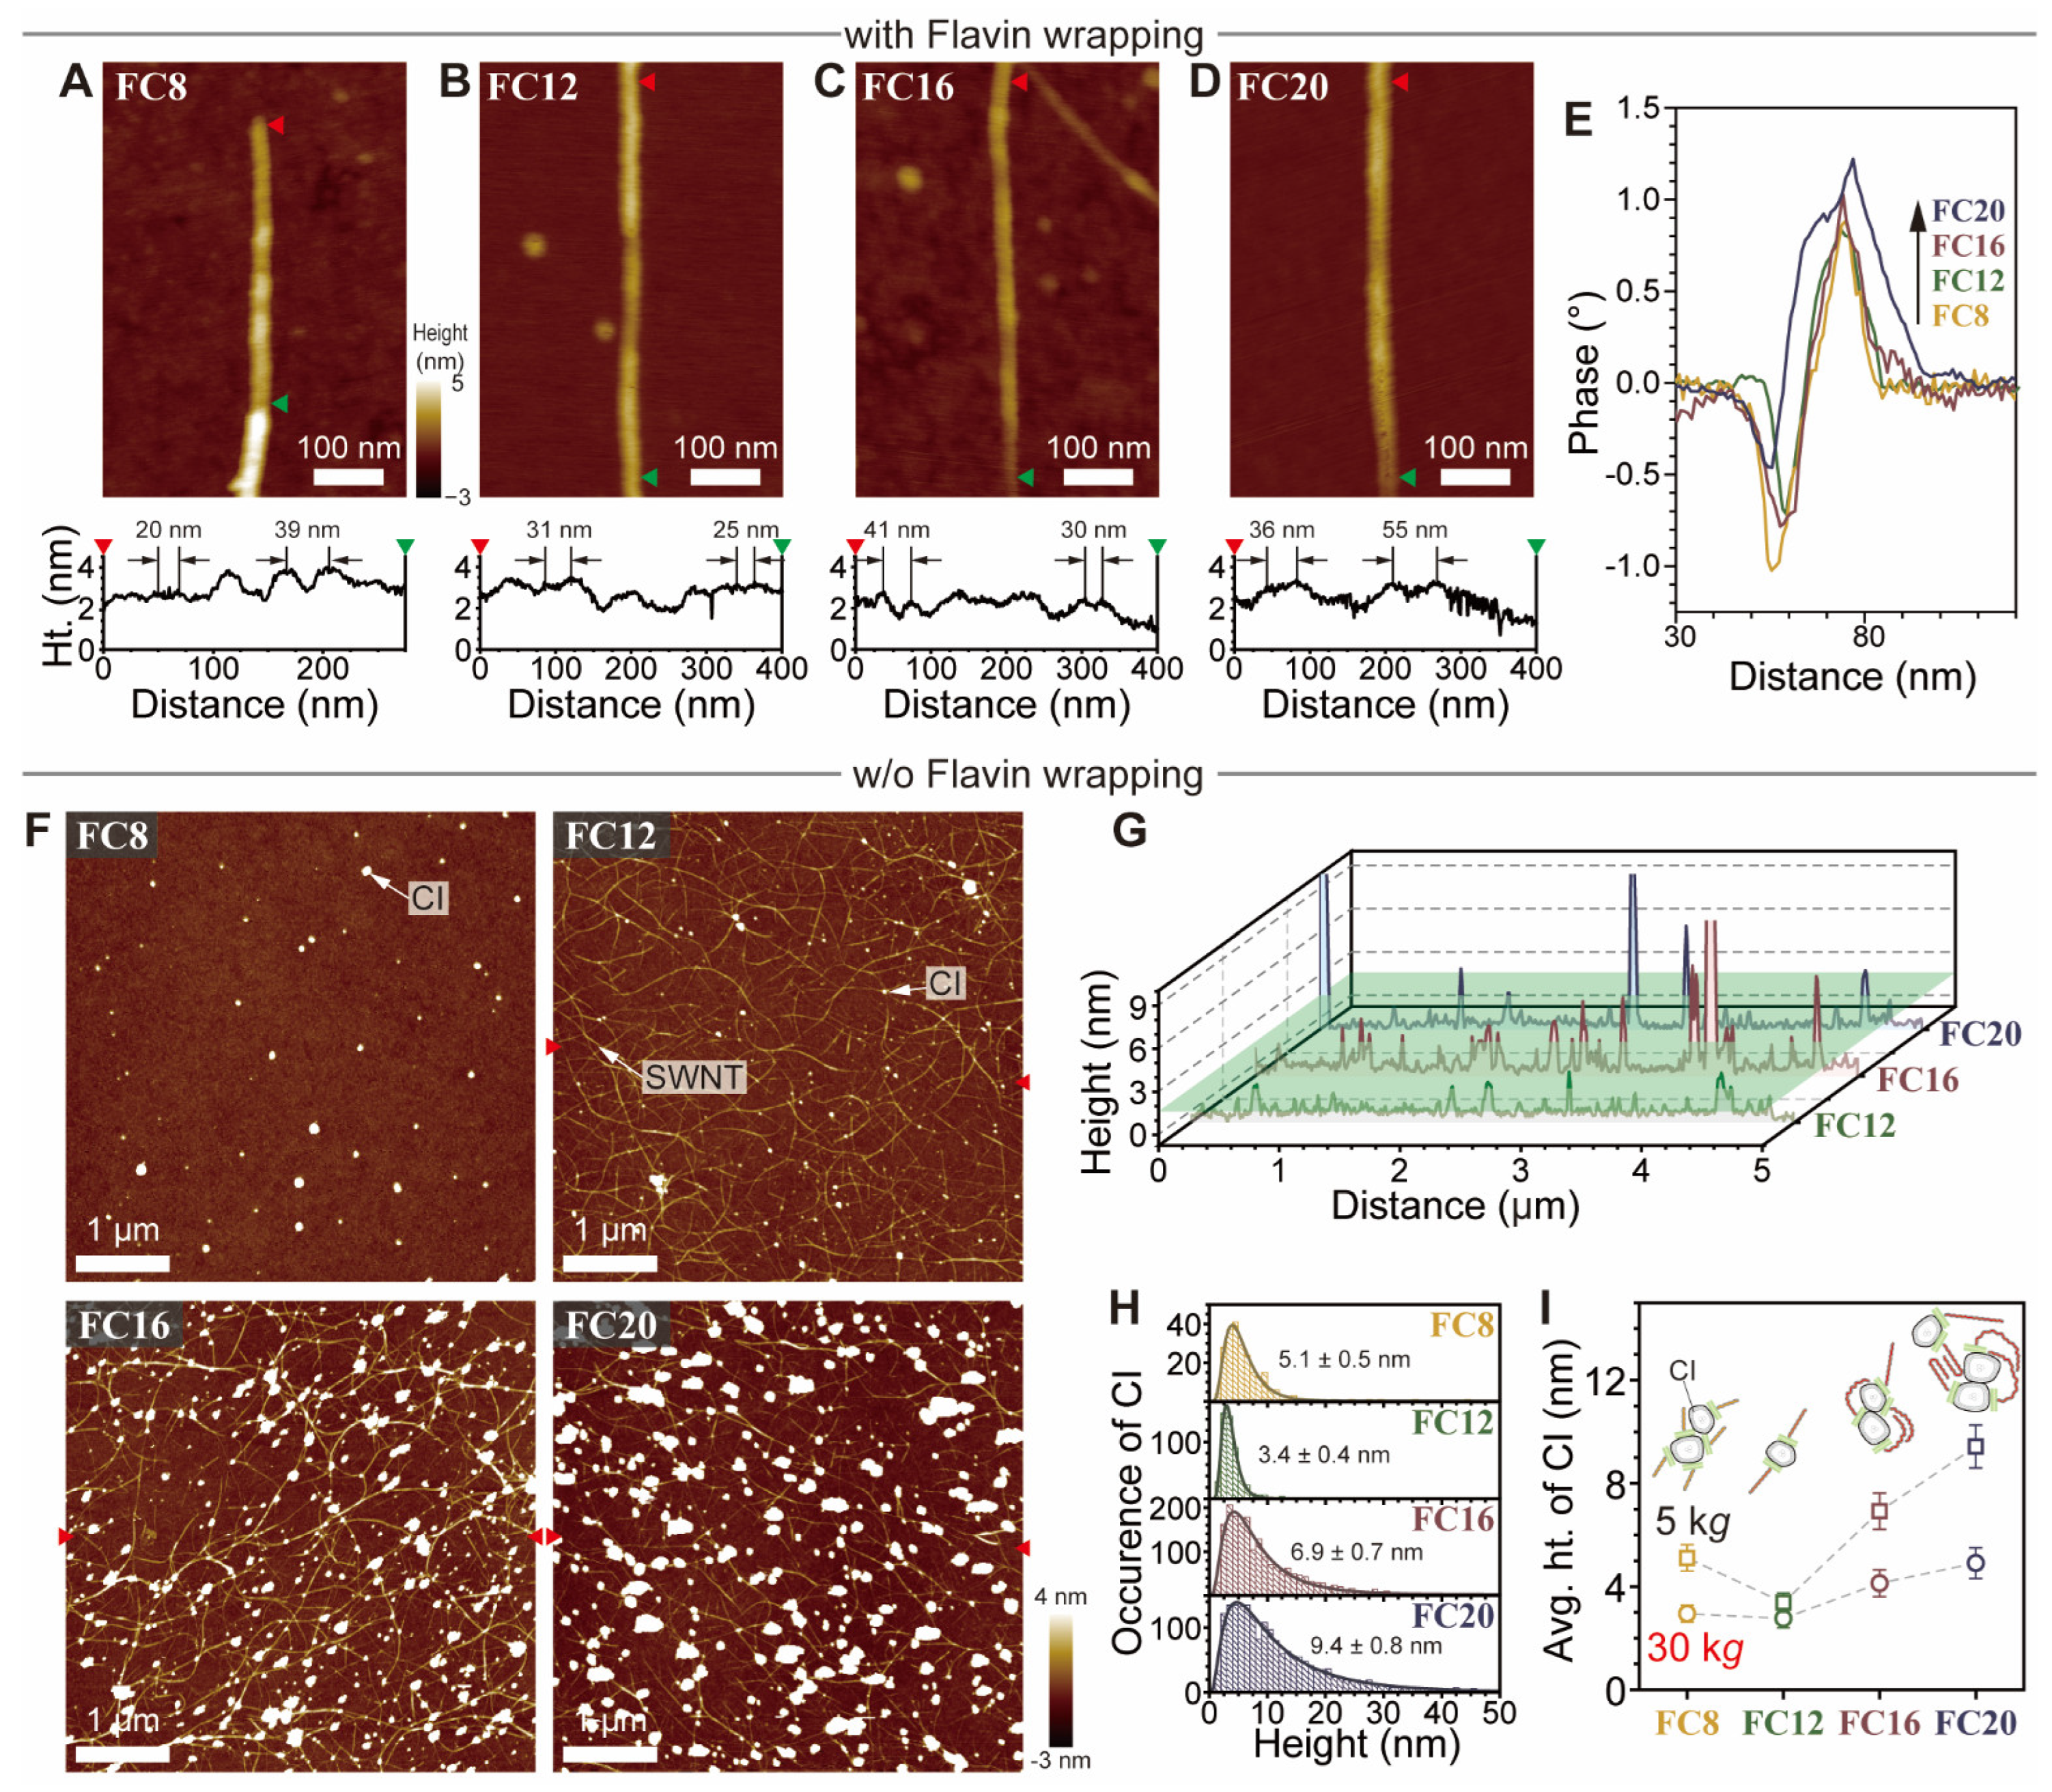
2.5. Atomic Force Microscopy (AFM) Measurement

The measurements were conducted by using a commercially available AFM (NX10, Park Systems, Suwon, Korea). An Al-coated silicon cantilever with a spring constant 37 N/m, a resonance frequency of 300 kHz and a quoted radius of approximately 6 nm (ACTA, App Nano, Mountain View, CA, USA) were utilized to measure height topographies. A 512 × 512 pixel image was collected from a 5 μm × 5 μm area. Prior to AFM measurement, 200 μL of the PSWNT dispersion was dropcast on 285 nm-thick SiO2/Si or mica substrates and dried for 10 min. For flavin-wrapped SWNT, the sample was dropcast on a freshly cleaved mica and was rinsed with p-xylene several times to preserve flavin self-assembly on SWNT while extra flavins were removed. SWNT images were acquired at a resolution of 1024 × 1024 pixels from a 1 μm × 1 μm area. For the case of flavin-removed SWNT, the flavins/SWNT on SiO2/Si substrate was rinsed with acetone several times until no green fluorescence originating from flavin derivatives was observed upon irradiation with a hand-held UV lamp (i.e., 365 nm). The rinsed substrate was dried by a gentle N2 blow. The measured height and phase topographies were analyzed by using the XEI 4.3.4 program. The height distribution of CIs was extracted from more than four topographies per sample in which approximately 4600 and 3000 CIs (i.e., 5 and 30 kg dispersion, respectively) were analyzed.

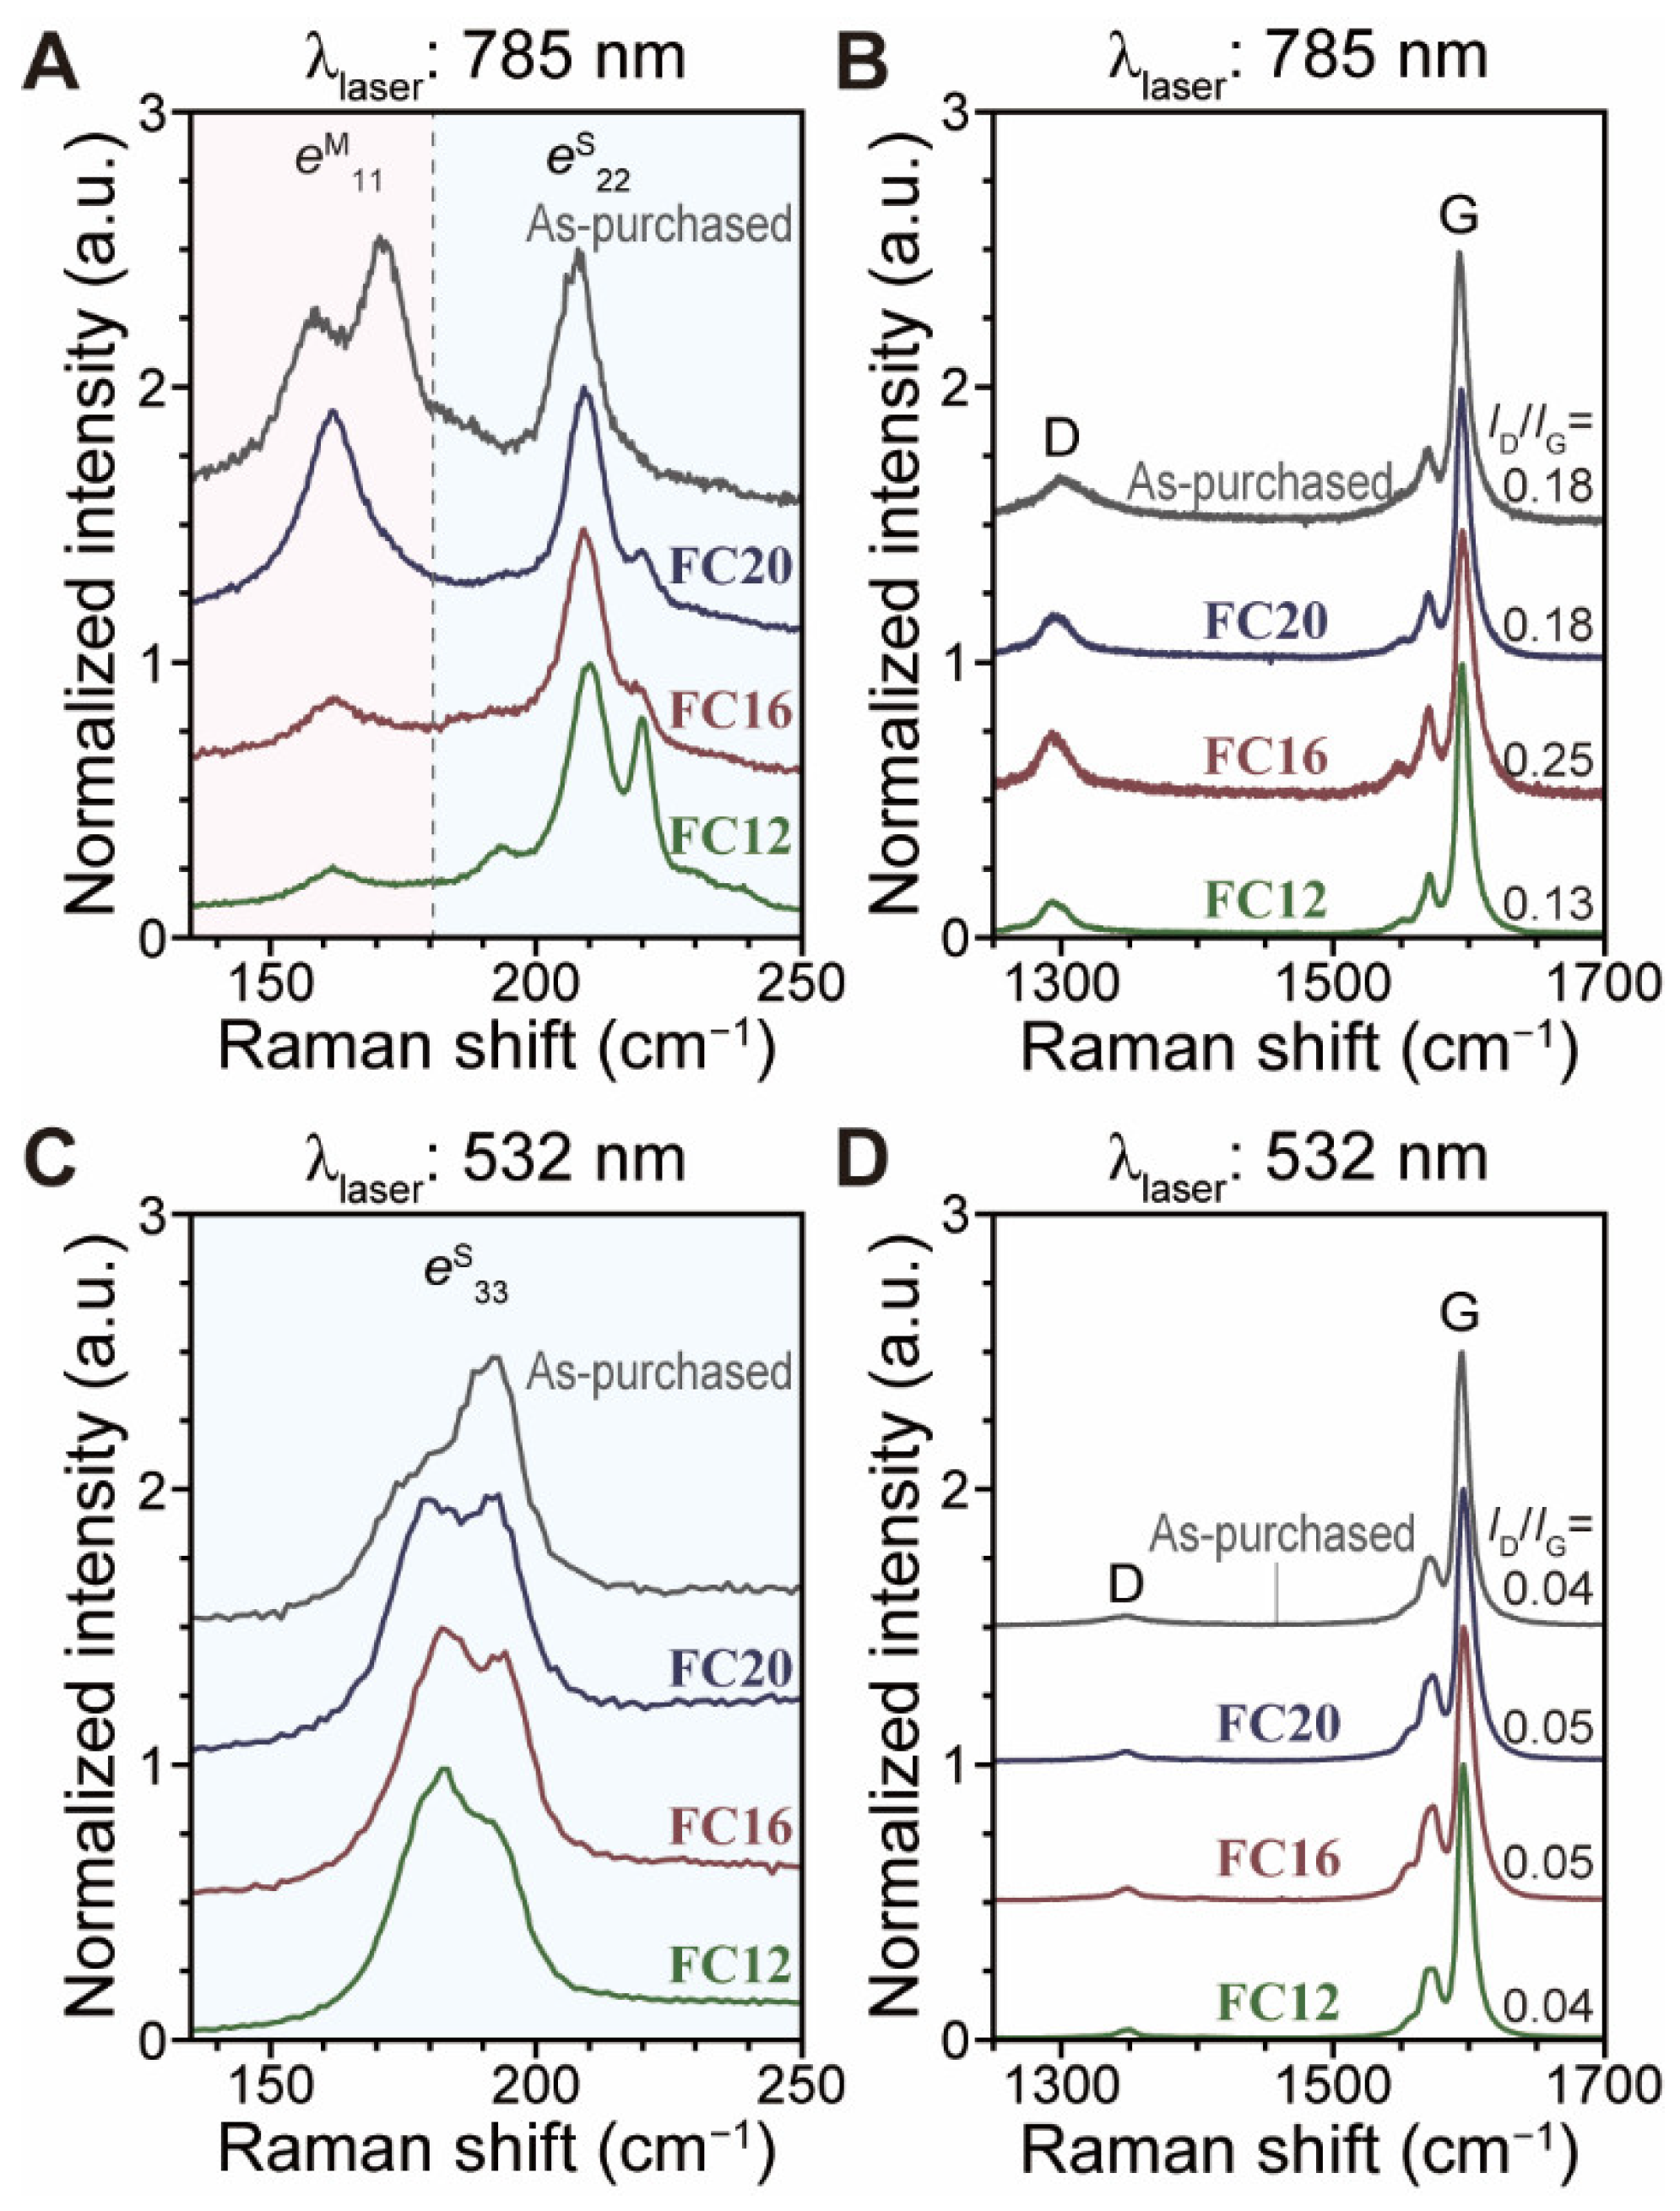
2.6. Raman Measurement

The measurements were performed by using a custom-made micro Raman setup [42]. via back scattering geometry. Briefly, scattered light from two different lasers (785 and 532 nm, 0785-08-11 and 08-DPL 532 nm 100 mW; Cobolt AB, Solna, Sweden) was collected via 50× objective lens (MPlan, N.A.: 0.75, Olympus, Japan) and delivered to spectrometer with a Si array CCD (Triax 320, focal length: 320 mm, 1800 gr/mm, resolution: 2 cm−1; 26 μm/pixel, 1024 × 256, Syncerity; Horiba Jobin-Yvon, Kyoto, Japan). The laser spot size is approximately 1 μm and an additional Si peak at 520.89 cm−1 was used as an internal reference. A total of 50 μL of SWNT dispersion was dropcast on a 285 nm-thick SiO2/Si substrate and dried at 90 °C on a hot plate. The sample was concentrated by repeating this process several times and washed with copious amounts of acetone to remove flavins. The laser power was below 0.2 mW to minimize sample damage. The spectra were acquired by averaging several points and were normalized against the maximum at each region. For Raman spectra of flavin derivatives, 785-nm excitation on powder sample was utilized with power of 50 mW, whereas 532-nm excitation results in fluorescence emission of flavin derivatives.

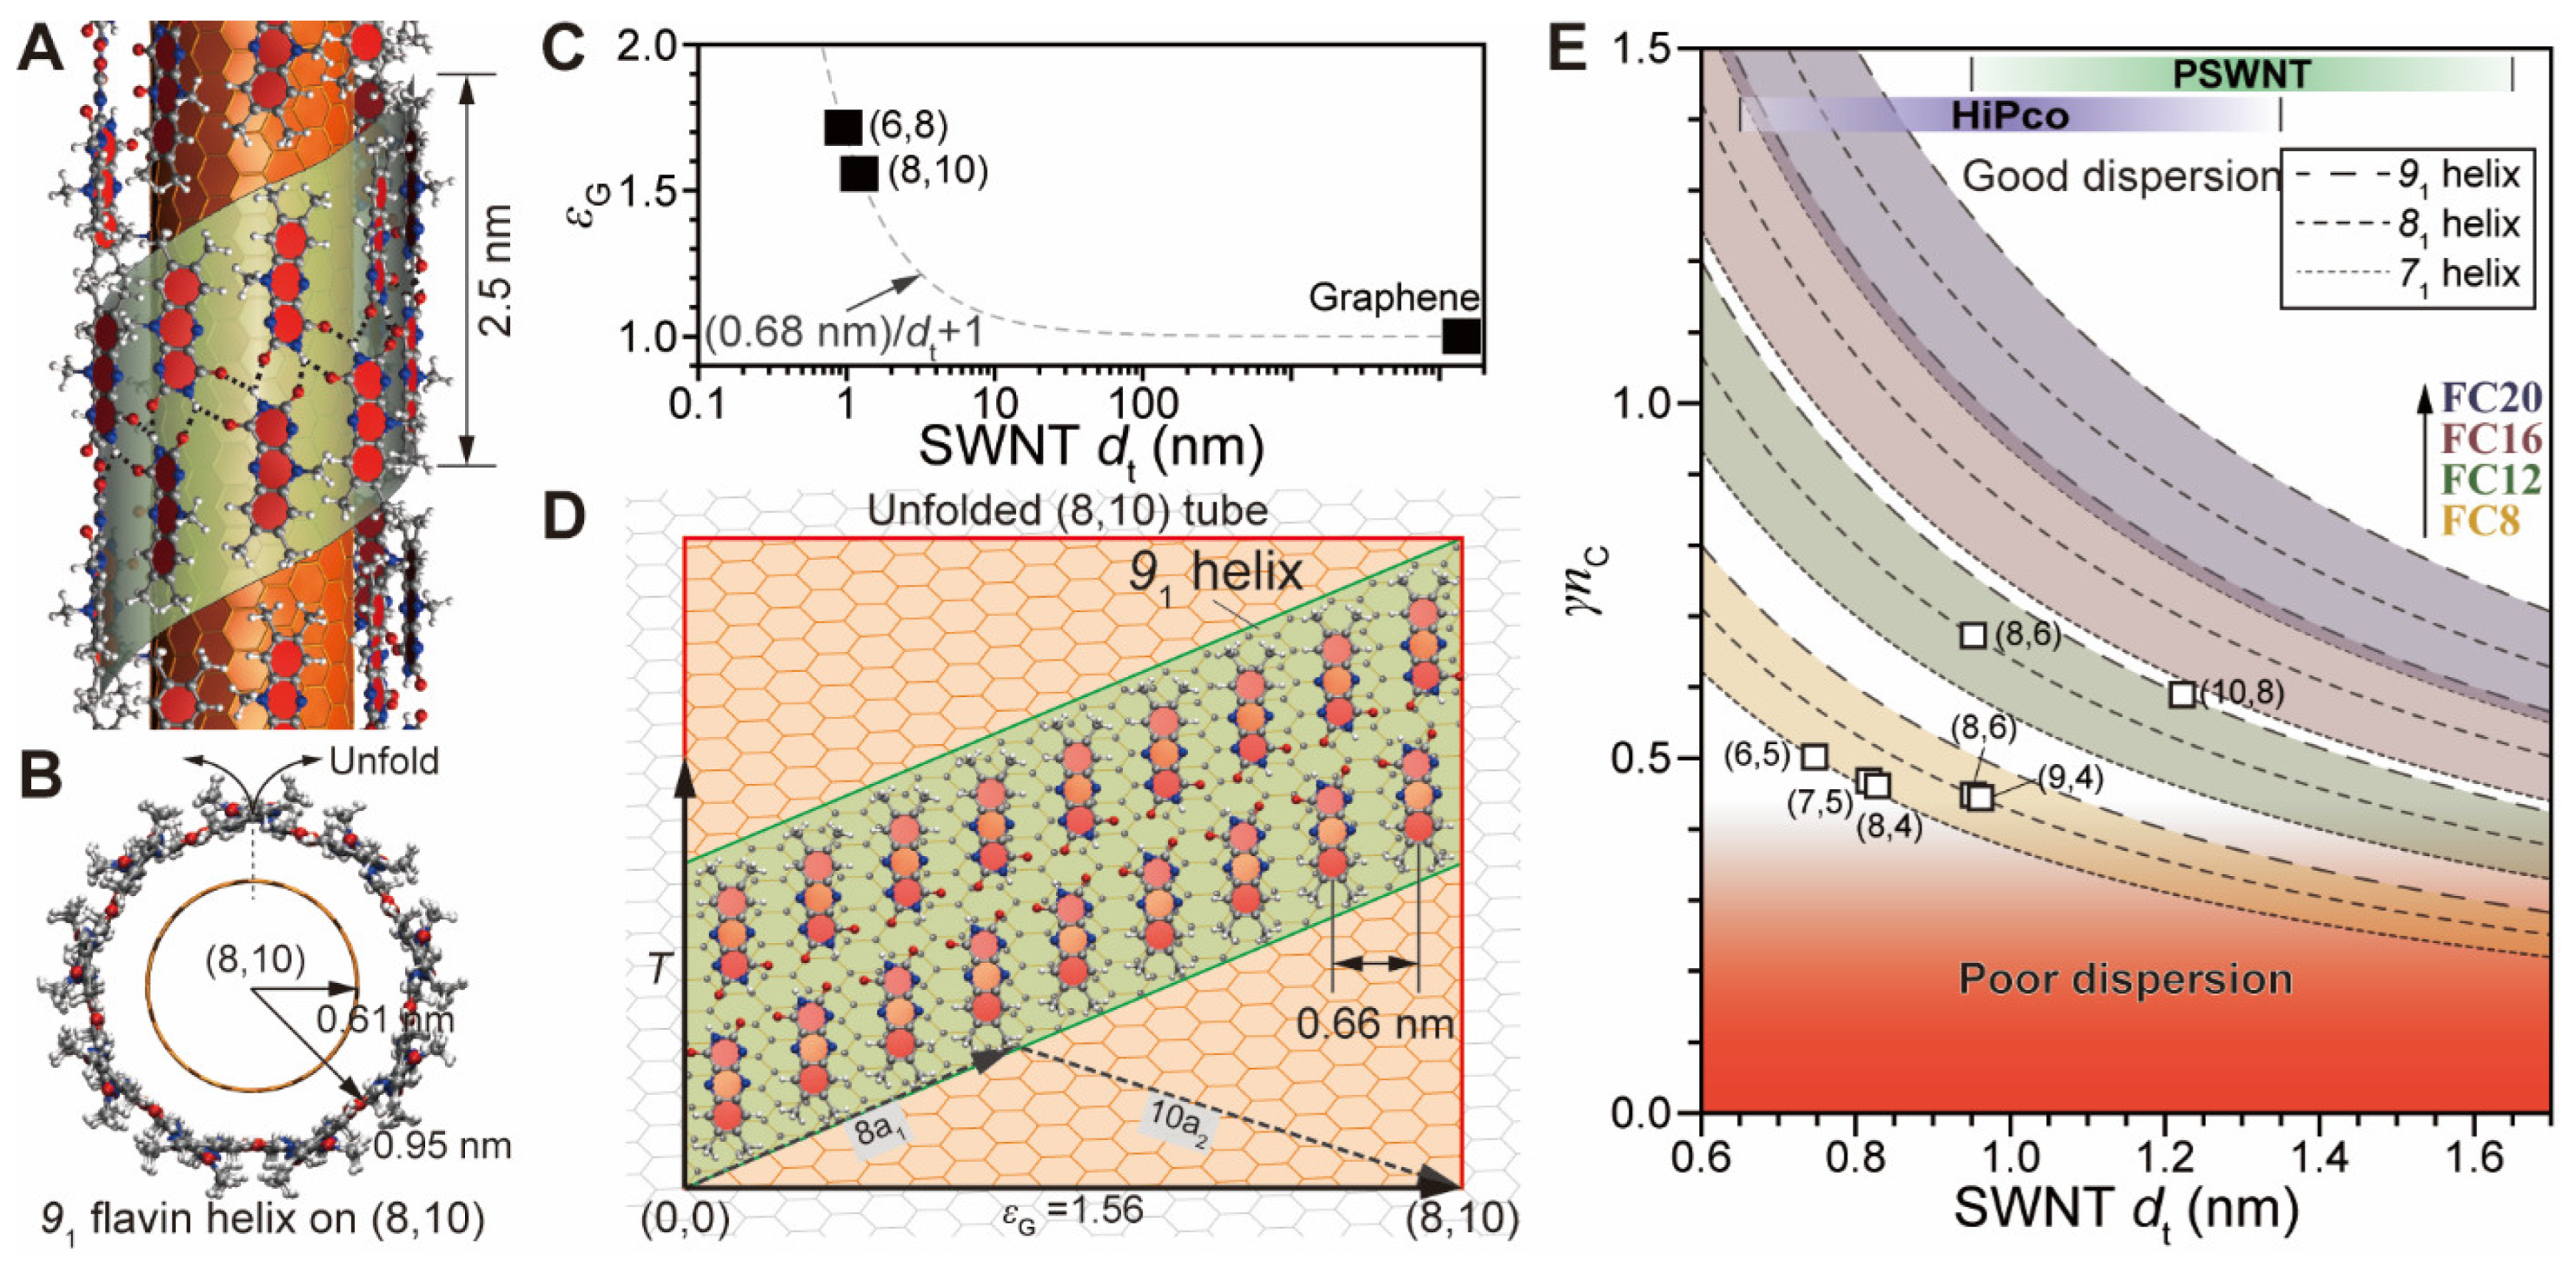
2.7. Geometrical Modeling of Flavin-Wrapped SWNT

Visualization of flavin wrapping on SWNT and strained graphene: xyz coordinates of various SWNTs were generated by using free software based on C–C distance of 1.42 Å [43]. Flavin dimers and subsequent 81 flavin helix on (6,8) tube was generated according to the method in the literature [27]. More vigorous building methods are listed in Supplementary Materials. Molecular mechanics simulation was performed by using COMPASS force field with convergence tolerance of 0.9 μeV for geometry optimization implemented in Materials Studio. Hexagonal unit cell containing three unit lengths of (8,10) and four unit lengths of 91 flavins is utilized for the initial configuration. Side chain was omitted for clarity. Visual molecular dynamics (VMD) software was used for molecular visualization [44].

2.8. Transmission Electron Microscopy (TEM) Measurement

The measurements were conducted by using Tecnai G2 F30ST (FEI company, Hillsboro, OR, USA) operating at 300 kV acceleration voltage. For TEM measurement, 1 mg of as-purchased PSWNT was mixed with 4 mL N-methyl-2-pyrrolidone (NMP) and subjected to 10 min bath sonication. Subsequently, TEM grids covered with ultrathin carbon support (LC200-Cu, lot no.: 180912, 200 mesh, TED Pella, Redding, CA, USA) were floated upside-down on top of a drop of the prepared PSWNT dispersion on a slide glass substrate. Excess sample was washed with NMP. Then, the grid was dried under vacuum overnight.

2.9. Scanning Electron Microscopy (SEM) Measurement

The measurements were conducted by using Schottky emission SEM (SU-70, Hitachi, Tokyo, Japan) operating at 10 kV acceleration voltage. To prepare SWNT film for SEM measurement, SWNT dispersions (10 mL) were filtered using a 1.0 μm pore-sized poly(tetrafluoroethylene) (PTFE) filter (PTFE1025D, Hyundai Micro, Seoul, Korea) and washed with acetone to remove residual flavin. Images of SWNT films were typically obtained with a working distance of ca. 11 mm under 100 k magnification. All samples were measured without conductive metal coating.

2.10. Matrix-Assisted Laser Desorption Ionization–Time of Flight (MALDI-TOF) Mass Spectrometry (MS) Measurement

2.10.1. Sample Preparation

To determine the composition of tandem flavin derivatives on the SWNT surface, flavin-adsorbed SWNT was selectively collected by filtration method. SWNT dispersions with tandem surfactants denoted by the as-prepared and the aged samples were filtered by PTFE membrane filter (pore size: 0.1 μm, J010A025A, Advantec, Tokyo, Japan). SWNT dispersion (10–20 μL) was carefully dropped repeatedly to the same spot (spot size: <2 mm) by using a micropipette, which was rinsed with p-xylene (few mL) to remove excess flavin on the filter. A piece of filter containing SWNT was placed into an eppendorf tube with 50 μL of p-xylene and was subjected to bath sonication for redispersion of SWNT. For the measurement, 2 μL sample dispersion was mixed with 2 μL of 88.4 mM dithranol in tetrahydrofuran as matrix, and 2 μL of the mixed solution was dropcast on the MSP 96 target plate (Bruker, Billerica, MA, USA).

2.10.2. Measurement

The measurement was performed on a Autoflex Max (Bruker, Billerica, MA, USA) equipped with smartbeam-II solid-state pulsed laser (wavelength: 355 nm, laser spot size: <10 μm, repetition rate: 2 kHz). Laser power was set to 40% of the maximum peak intensity (>100 μJ/pulse). Positive ions were detected in the reflection mode. A total of 20,000 laser shots were applied to the sample. The composition ratio of FC8 and FC12 was determined by comparing MS spectrum regions at specific mass to charge ratio (m/z) from FC8 and FC12.

3. Results

In this study, we investigated the single/tandem effects of flavin lS on the dispersion of s-SWNT, as shown schematically in Figure 1A. SWNT is helically wrapped by the flavin or isoalloxazine moiety, and its side tail extends to the media. A single SWNT batch contains not only SWNT but also CIs and a metallic catalyst. Although the metallic catalyst can be removed by centrifugation [45], the CIs, which are either amorphous and graphitic forms of carbon [46,47] or defective few-layered graphene material [48] depending on SWNT batches, are inevitably incorporated into the dispersion owing to structural similarities with SWNT. To assess the effects of alkyl lS in flavin surfactants on SWNT dispersion, we synthesized four flavin derivatives, viz. FC8, FC12, FC16, and FC20 (Figure 1B), containing N10-linked 8, 12, 16, and 20 n-alkyl side chains, respectively. The syntheses were performed over two steps, involving the mono-alkylation of 4,5-dimethyl-1,2-phenylenediamine followed by the construction of an isoalloxazine ring according to a literature-reported protocol [24,28]. Briefly, reactions between three equivalents of 4,5-dimethyl-1,2-phenylenediamine and one equivalent of 1-chlorinated octane, dodecane, hexadecane, and eicosane were performed in refluxing TEA to form the respective monoalkylated phenylenediamine derivatives 14 (yield: 25–60%). Thereafter, reactions between 14 and alloxan in a 1:1 molar ratio were performed in glacial acetic acid in the presence of boric oxide to produce the corresponding flavin derivatives FC8, FC12, FC16, and FC20 (yield: 50–58%).
The structures of the n-alkyl flavins and intermediates 14 were confirmed using elemental analysis, 1H-NMR (Figures S1A–D and S3A–D in the Supplementary Materials, respectively), and 13C-NMR spectroscopies (Figures S2A–D and S4A–D, respectively) (see Supplementary Materials). The signals in the 1H NMR spectra of FC8, FC12, FC16, and FC20, and 14 were identified as per previous literature [25,28,49]. For instance, as shown in the 1H-NMR spectra of all flavin derivatives (Figure S3A–D), the positions and intensities of the aromatic protons above 7 ppm remained unchanged, whereas the intensities of the aliphatic side chain protons at 1.3 ppm increased with increasing length of the flavin side chain. Consequently, these flavin derivatives were utilized to disperse SWNT.
SWNT dispersions were prepared in p-xylene by using sonication in the presence of flavin derivatives as surfactants, as per literature [24,28,33,48]. In particular, equimolar flavin derivative (0.61 mM) was added to PSWNT (0.25 wt./v.%) with a dt value ranging from 0.95 to 1.65 nm in p-xylene to eliminate the concentration-dependent effect. After dispersion through tip sonication and subsequent centrifugation at 5 or 30 kg (see Materials and Methods section for the details), 80% of the supernatants were obtained using FC12, FC16, and FC20. Unless otherwise stated, the dispersion derived from FC8 was not centrifuged owing to the instability of SWNT dispersion.
FC8-PSWNT dispersion does not show good PSWNT dispersibility compared to other flavin derivatives, and exhibits dt-selective SWNT dispersion when smaller-dt SWNT is used. Figure 2A shows UV-vis-SWIR absorption spectra of FC8-PSWNT with and without the 5- and 30-kg centrifugation step. Without centrifugation, the dispersion exhibits broad background absorption and broad optical transitions, suggesting a bundled SWNT structure. Specifically, the absorption spectrum contains the first and second semiconducting excitonic transitions (eS11 and eS22, respectively) of the PSWNT in the wavelength ranges of 800–1200 nm and 1200–2100 nm, respectively, which are in good agreement with previous literature [24]. Moreover, weak absorption bands originating from the first metallic excitonic transitions (eM11) are observed in the wavelength range of 600–800 nm. The PLE map that determines optical transitions of s-SWNT (inset of Figure 2A) does not show photoluminescence (PL) activity originating from SWNT chiralities denoted by (n, m), indicating that the dispersion mostly consists of bundled SWNT. Progressively decreasing centrifugal forces (30, 5, and 1 kg, bottom spectra of Figure 2A) and increasing flavin concentration to 2.44 mM still result in large amounts of PSWNT precipitation, as is evident from absence of the SWNT absorption, except in the flavin absorption region (300–500 nm). This result suggests that FC8 shows poor PSWNT dispersibility. AFM was utilized to investigate the detailed SWNT topography. Figure 2B clearly shows that most SWNT exist as bundled states and only a few as individualized states. The height profile (Figure 2C) indicates that bundled and individualized SWNT exhibit heights greater than 3.5 nm and 2.0 nm, respectively. Considering PSWNT diameter up to 1.65 nm, this result suggests that while the flavin moiety wraps around PSWNT, its tail length is insufficient to provide SWNT buoyancy. To demonstrate this point, HiPco SWNT, whose average dt range (0.65–1.35 nm) is smaller than that of PSWNT, was subjected to FC8 dispersion with 5-kg centrifugation in a similar manner as that for PSWNT. While the 0.61 mM dispersion is unstable, the 2.44 mM FC8 dispersion exhibits sharp absorption features originating from HiPco SWNT, as shown in Figure 2D. Interestingly, the corresponding PLE map (Figure 2E) exhibits smaller-dt chirality enrichments of SWNT in the order (8,4), (9,5), (8,6), (7,5), and (6,5) tubes. Their average dt is 0.86 nm, which contrasts sharply with that of the 2.44 mM FC12-HiPco dispersion: The absorption results (Figure S5A) show much larger dt distribution, with eS11 extending up to 1600 nm, and the corresponding PLE map (Figure S5B) shows that PL-based chiralities range from (6,5) to (10,8) with a number-average dt of 0.96 nm. PL-intensity based chirality abundances of FC12- and FC8-HiPco were illustrated as Weisman plots in Figure S5C. Clearly, FC8-HiPco exhibits smaller dt enrichment whose most abundant species are (8,4) as 38% as compared to FC12-HiPco in which comparably larger-dt (9,5), (8,6), and (7,6) altogether accounts for 32%. These results indicate that dt-selective SWNT dispersion originates from lS.
The remaining flavin surfactants exhibit preferential s-SWNT enrichment and flavins with longer lS exhibit slightly larger dt selectivity. Figure 3A,B shows the absorption spectra of PSWNT dispersions obtained using FC12, FC16, and FC20 with respective centrifugations. In contrast to FC8, the absorption spectra of 5 kg of centrifuged dispersions obtained using FC12, FC16, and FC20 contain well-resolved eS11 and eS22 transitions. While the indicated s-SWNT absorption, including eS11 and eS22, does not appear to change significantly, weak absorption bands originating from eM11 are present in the 600–800 nm range and increases with increasing lS. Additionally, this trend is accompanied by an increased background absorption. However, a closer inspection of background-subtracted absorption spectra (Figure S6) reveals that flavins with longer lS tend to have larger dt. This result is consistent with the findings that the lS variation of PFO [20,34] and flavin derivatives [25] affects the SWNT chirality selection owing to the side chain involvement for SWNT wrapping. Because of the quadruple hydrogen-bonding of flavin helix, the side chain of flavin is not expected to make contact with SWNT sidewalls [27,28], and these effects (i.e., inclusion of a small amount of m-SWNT) appear to originate from the increase in dispersibility caused by increasing side chain. To investigate this, PSWNT dispersions using lower flavin concentrations (i.e., 0.5 mM) were conducted in a similar protocol. The resulting absorption spectra (Figure S7A,B) show that, as opposed to 0.61 mM dispersions, these dispersions exhibit a near absence of m-PSWNT irrespective of lS while still exhibiting lower background absorption. Because N10-alkyl flavin preferentially selects s-SWNT [24], this result clearly indicates that flavin dispersibility and stoichiometry between flavin and SWNT are crucial for better selection of s-SWNT, in accordance with chirality selectivity by flavin concentration change [33]. In this regard, the shorter the lS of FC12 than those of FC16 and FC20, the better is the s-SWNT enrichment.
Second, background absorptions increase with increasing lS. This result indicates that a longer side chain increases the dispersibility of both SWNT and background absorption. Especially in aromatic solvents, the background absorption in flavin/SWNT dispersion mainly originates from CIs [33]. CIs are few-layered defective graphene material, which contributes to background absorption along with the SWNT bundle [46,47]. For a qualitative comparison of this effect, the background absorption (β) and background-subtracted SWNT absorbance (α), based on the eS22 and eM11 region on the x axis in wavenumber scale, are defined as shown in Figure S8A–F, according to the literature [51] wherein the eS22 enclosure was drawn from 8400 to 16,000 cm−1 (i.e., 1190–625 nm). In this range, α is further classified into s-SWNT (αsem) and m-SWNT (αmet). Evidently, the increasing side chain and reduced centrifugation results in larger β. Figure 3C,D show the trends of α, β and α/(α + β) as figures of merit for determining the purity of the dispersions. With increasing lS, α increases slightly owing to an increase in the m-SWNT content, whereas β increases drastically. This result clearly suggests that longer lS incorporates more CIs. Moreover, α/(α + β), which denotes net SWNT contribution among SWNT and CIs, decreases with increasing lS (Figure 3D). The best α/(α + β) value was obtained from FC12-PSWNT with a 30-kg centrifugation, resulting in a value of 0.309, which is slightly lower (i.e., 0.403) than that of PFO-SWNT dispersion [51]. Alternatively, an increased centrifugal force results in reduced β, as shown Figure 3C. Notably, dispersions obtained from 60-kg centrifugation (Figure S9A–C) afford α and β values similar to those of the 30-kg samples.
Photoluminescence (PL) measurements of PSWNT with increasing flavin lS result in lower relative quantum yield (ΦR) of SWNT owing to increasing CIs. Figure 4A (Figure S10A) shows the PLE maps of FC8-, FC12-, FC16-, and FC20-PSWNT dispersions centrifuged at 5 kg (30 kg). The PLE maps of FC12, FC16, and FC20 dispersions show well-resolved sharp PL peaks that are assigned to various SWNT chiralities as indicated [24]. Furthermore, as evidenced by PL emission spectra obtained by excitation at 885 nm, all PLE maps exhibit similar chirality distributions, albeit with lower overall intensity for longer lS (Figure 4B and Figure S10B). Among them, (10,8) chirality exhibits the highest PL intensity (IPL) within the detection limit. Along with the increased CIs in absorption, this result indicates that increased CIs reduces SWNT IPL. Assuming that (10,8) chirality explains the absorption at 885 nm and that the chirality distribution is the same, we can obtain the relative quantum yield of (10,8), i.e., ΦR,(10,8), whose equations are described in Supplementary Materials according to literature [28,33,52]. The (10,8) tube shows the eS11 and eS22 at 1520 nm and 885 nm, respectively. Briefly, ΦR,(10,8) is proportional to the normalized area-based IPL of (10,8) (I(10,8),normalized) over absorbance of (10,8) (α(10,8)). Especially, the background absorption β885nm from bundled SWNT and CIs does not contribute to SWNT PL. Therefore, I(10,8), normalized instead of I(10,8) was utilized to compensate nonradiative contribution given by I(10,8)/[α885nm/(α885nm + β885nm)]. The dispersion was diluted such that eS22 of (10,8) dropped below 0.1 absorbance, as shown in Figure 4C [28,52,53]. Figure 4D shows the corresponding Lorentzian deconvoluted PL emission spectrum, and the other samples (Figure S11A–E) were treated similarly. This analysis yielded the values of α885nm, β885nm and I(10,8),normalized. Figure 4E depicts trends that ΦR,(10,8) decreases as the lS and centrifugal forces increase. Because CIs are located near SWNT, the PL of SWNT is reduced due to the quenching.
Raman spectroscopy was utilized to confirm the dt-selectivity and increased m-PSWNT resulting from an increasing lS. The radial breathing mode (RBM) is an out-of-plane tangential vibration mode that is inversely proportional to SWNT dt [33,48]. The selectivity was verified by using 785-nm and 532-nm lasers to probe samples of 5 kg (Figure 5A–D) and 30 kg (Figure S12A–D) dispersed by 0.61 mM in which the 785-nm laser is used to probe smaller-dt s-SWNT and larger-dt m-SWNT whereas the 532-nm one is used to probe s-SWNT with a larger dt range. First, the 785-nm-excited RBM spectra of PSWNT derived from various flavin derivatives (Figure 5A) show that as lS increases, PSWNT dispersions show increased intensity of the 165 cm−1 band and decreased intensity of the 225 cm−1 band originating from respective eM11 and eS22, indicating decreasing smaller-dt s-SWNT and increasing m-SWNT, respectively. This is consistent with the absorption observations. Additionally, the m-SWNT bands from FC12FC20 are smaller than those of as-purchased PSWNT. The resulting D and G bands (Figure 5B) originating from disordered and graphitic vibrations, respectively, are positioned at 1293 and 1595 cm−1, respectively [54]. The intensity ratio of D to G bands (ID/IG) is the lowest for FC12 (i.e., 0.13) and highest for FC16 (i.e., 0.25). The reason for overall higher ID/IG is mainly due to the lower quantum efficiency of the CCD detector in the near IR. When the 532-nm laser is used, RBM regions of PSWNT dispersed by flavins (Figure 5C) show similar RBM bands originating from eS33 regardless of lS, whereas as-purchased PSWNT show two larger bands at approximately 180–190 cm−1. The resulting D and G bands (Figure 5D) are positioned at 1350 and 1596 cm−1. While G band positions remain similar regardless of excitation energy, D band positions excited by the 532-nm laser were upshifted compared to those excited by the 785-nm laser due to the energy-dispersive two-phonon process of the D band [54]. Concerning lS, samples of 30 kg display more systematic trends. Figure S12A shows a 785-nm-excited RBM spectrum region with progressively increasing m-SWNT bands at ~165 cm−1. Figure S12B displays the D and G bands, wherein ID/IG increases (i.e., 0.20, 0.25, and 0.32) with increasing chain length. As lS increases for the 532-nm laser excitation, RBM spectra (Figure S12C) show a systematic increase in the intensity of the 190 cm−1 band, and ID/IG value (Figure S12D) increases progressively (i.e., 0.04, 0.05, and 0.06). The slight discrepancy in the trends between samples of 5kg and 30 kg appears to stem from sample heterogeneity. Overall, changing FC12 to FC20 results in increased m-SWNT and ID/IG selectivity, along with larger dt s-SWNT selectivity. Considering the trace amount of m-SWNT, the slight increase in ID/IG with increasing lS is attributed to the contribution of increased CIs [48], as observed in absorption spectra.
Considering the dt selectivity of flavin derivatives, it would be important to establish lS per carbon atom in SWNT based on dt to provide stable dispersion (see Materials and Methods section and Supplementary Materials for the detailed geometric modeling). The structural motif adopted in a helical flavin assembly on SWNT is well-known [25,27,28,29,30,31] and has an 81 flavin helix on (6,8) SWNT [25,27,30,55], whose side and top views are shown in Figure S13A,B. Moreover, the helical motifs for SWNTs with different dt values vary, such as 71, 81, and 91 with increasing dt [31]. For instance, (6,5) and (8,6) tubes with dt values of 0.75 and 0.95 nm, respectively, accommodate 71 and 81 flavin helices, suggesting that increasing dt by 0.2 nm results in two more flavins in the unit cell. Therefore, (8,10), having dt = 1.22 nm and containing 488 carbon atoms in the translational (T) length of 3.33 nm, can accommodate 91 flavin helix with 18 flavins [56,57]. The 91 helical motif was generated by rotating the flavin dimer by 40°, followed by 2.78-Å translation along the z axis by nine times for a unit cell length of 2.5 nm, as shown in the side and top views of Figure 6A,B. The unfolding of concentric SWNT and flavin helix cylinders in Figure 6B causes the inner graphene cylinder to stretch along the chiral vector (Ch) [29]. Figure 6C depicts the graphene stretch ratio (εG) according to dt: εG = (0.68 nm)/(dt + 1), which was derived from the ratio between SWNT dt and flavin helix diameter, with 0.68 nm denoting twice the vdW distance between the concentric cylinders. The trend indicates that smaller-dt SWNT requires higher εG. Figure 6D (Figure S13C) depicts a pictorial illustration of an unfolded flavin/(8,10) (and (6,8)) graphene surface with 91 (81) helical flavin arrangement on a two-dimensional graphene sheet stretched by εG = 1.56 [29].
The aforementioned dt selectivity based on flavin surfactants creates a relationship for SWNT dt vs. lS of flavin to promote good SWNT dispersion. A consideration of the 91 flavin assembly on the stretched graphene surface suggests that the ratio between flavin per carbon atom in a given SWNT (γ) exists. For instance, (8,10) has the γ value of 0.049 (i.e., ~20 carbon atoms of SWNT corresponding to the footprint of isoalloxazine). The result of multiplying γ with the number of carbon atoms in the alkyl side chain of flavin (nC) is 0.049 × nC. FC12 possesses the shortest nC required to form stable PSWNT dispersion, with γnC with 0.59, suggesting that the carbon atom in SWNT requires 0.59 methylene and methyl groups in the side chain for PSWNT buoyancy. For smaller-dt SWNT, the (8,6) tube with 81 FC12 helix shows an increased γnC value of 0.672 due to the increased γ = 0.056 (see Supplementary Materials). Figure 6E depicts γnC values for flavin surfactants based on three helical motifs (i.e., 71, 81, and 91 helices). Several SWNT chiralities [i.e., mainly (8,4) and (7,5)] observed with HiPco SWNT dispersion suggest that FC8 could exhibit a 71 helix. Therefore, Figure 6E considers the flavin helix polymorphism. The margin and regimes for good SWNT dispersibility are indicated by the red shaded regime and the aforementioned polymorphism. Thus, it can be deduced that the aforementioned larger-dt selectivity for flavin with longer lS is related to γnC. For example, the marginal region for poor/good dispersions is more overlapped with larger dt SWNT derived from γnC of FC12 than those derived from FC16 and FC20. Therefore, FC12 is more likely to select SWNT with smaller dt. In addition, chirality-specific SWNT dispersion observed in the FC8 case originates from γnC situated in the marginal regime between good and poor dispersions. This result suggests that the surfactant with marginal γnC is expected to have chiral selectivity.
Next, the reason behind the increase in background absorptions with increasing lS of flavin is investigated. The morphology of as-purchased PSWNT was examined by TEM. Figure S14A exhibits the as-purchased PSWNT which contains SWNT, CIs, and metal catalyst. A high magnification TEM image (Figure S14B) reveals that CI is a few-layered defective graphene structure having an interlayer distance of 0.38 nm, as evident by the fast Fourier transform (FFT) image of the inset. SEM measurements revealed CI trends in the case of PSWNT dispersion assisted by flavins (Figure S14C–E). For this, PSWNT films were created by filtration of PSWNT dispersion followed by washing with copious amounts of acetone to remove flavin derivatives. The size and number in CIs, which are highlighted in red, in SWNT films derived from surfactants initially increase from FC12 to FC16, and remain similar from FC16 to FC20. This observation can be attributed to the increased vdW interaction between the alkyl side chain of flavin and flat graphene sidewall of CIs. The longer the alkyl side chain, the more vdW interaction occurs, as shown in Figure 1A. These results are consistent with the absorption results.
AFM was used to confirm the effect of flavin lS on the morphology of PSWNT and CIs in dispersions. Individual PSWNT wrapped by FC8, FC12, FC16, and FC20 are confirmed using AFM after gentle p-xylene washing to remove extra flavins and subsequent annealing on mica, as shown in Figure 7A–D. The height images show helical grooves formed by flavin wrapping along SWNT with a period of 20–55 nm on top of an average diameter of 2.0 nm of the flavin-PSWNT construct (see line profiles). Moreover, their phase images (Figure S15A–D) show that flavin wrapping with longer lS causes greater phase shifts (Figure 7E), which originate from the softness of the longer side chain [58,59]. When the samples are washed with acetone, the flavin-removed [25] topographies are witnessed. Figure 7F depicts the SWNT and CI topographies based on flavin lS generated using centrifugation of 5 kg and deposited on a 285-nm-thick SiO2/Si substrate. While the FC8-PSWNT sample contains only CIs, the FC12, FC16, and FC20 samples formed from dispersions prepared with centrifugation of 5 kg contain random networked SWNT with uniform heights interfaced with CI agglomerates. Interestingly, most CI agglomerates are adsorbed on the SWNT sidewall rather than existing separately on the SiO2/Si substrate, which is consistent with previous TEM results [48]. The SWNT morphologies does not significantly change in height, whereas the size and number of CI agglomerates increase with increasing alkyl lS. These results indicate that an increased lS induces larger CI agglomerates but has no effect on SWNT morphologies. A comparison of the height profiles derived from FC12FC20 (Figure 7G) revealed that increasing lS induces more CIs with heights greater than 1.6 nm, which is an upper limit of individualized PSWNT having a dt value of approximately 1.3 ± 0.35 nm [33]. These results indicate that the majority of PSWNTs dispersed by p-xylene with flavins are dispersed in individual states with CI aggregates on top and that background absorption changes previously discussed originate from variations in the CI content.
Figure 7H shows the height histograms of CIs in flavin-derived SWNT dispersions. CI agglomerates were subjected to size analysis, and the histogram fitting is best described as a lognormal distribution function herein. The dispersions formed using FC12 exhibit the smallest average height (i.e., 3.4 nm) of CIs and the narrowest height distribution among the four. This finding closely resembles the results of the absorption experiments. Using a similar method, 30 kg of prepared samples (Figure S16A–C) were found to exhibit smaller height trends but lesser distributions. Figure 7I shows a plot of the average height of the CIs vs. flavin derivative as a function of the two centrifugal forces. Samples prepared with centrifugation of 5kg and 30 kg show an initial decrease in CI size, followed by an increase as the length of the alkyl side chain increases. Because CI is an agglomerate form of defective few-layered graphene [48], its size should be enhanced by longer flavin side chains as a consequence of vdW interactions, as shown in Figure 1A. For FC8, the limited dispersion of PSWNT promotes higher concentrations of FC8 in p-xylene, resulting in increased adsorption to the CIs and formation of large aggregates. Along with the absorption measurement, the AFM analysis provides a qualitative correlation between the CI content and flavin lS due to vdW interaction, indicating that FC12 is the best for maximizing net SWNT purity.
Moreover, the existing δ relationship between the flavin lS and CI content contributed to the overall SWNT purity. Solubility parameters δ have provided insight into bare SWNT dispersibility in solvents [60,61], SWNT micellarized by various aqueous surfactants [62], and a surfactant-SWNT in various solvents [33]. According to the literature [33,63], minimizing the enthalpy of mixing (Hmix) caused by the difference between δδ) of the solvent and the side chain results in an overall negative Gibbs energy gain, ultimately leading to high purity dispersion of SWNT, which is governed by H m i x = ϕ 1 ϕ 2 ( δ 1 δ 2 ) 1 / 2 , where φn and δn are the mole fractions and δ of each component in a mixture, respectively. The Δ values were calculated from each flavin component using the van Krevelen formulation [63] shown in Equation (1),
δ = δ D 2 + δ P 2 + δ H 2
where δD, δP, and δH are the molecular attractions due to molar dispersion forces, molar polarization forces, and H-bonding, respectively. Each δ subcomponent is derived from the molar volume and energy (or force) according to Equation (2),
δ D = Σ F D V i ,   δ P = Σ F P 2 V i ,   δ H = Σ E H V i
where FD is the molar attraction constant due to molar dispersion forces, FP2 is the molar attraction constant due to molar polarization forces, EH is the H-bonding energy, and Vi is the group contribution to molar volume.
Table S1 listed δ and its subcomponents (δD, δP, and δH) associated with side chains, p-xylene [63], and various nanoscale carbon allotropes, including carbon nano-onion (CNO) [64], SWNT [61], graphene [65], and carbon black (CB) [66]. As shown in Figure 8A, with increasing lS, the δ values in three dimension approach those of p-xylene along with changes in the subcomponent δD. Generally, Δδ < 5 MPa1/2 provides good miscibility between components and solvent [63], and Δδ < 1.6 MPa1/2 observed for all side chains against p-xylene (Table S1) fall within this range. It is noteworthy that graphene, SWNT, and CB have higher δD values than p-xylene. Considering the Δδ between various nanocarbons, increasing flavin lS results in a reduced Δδ for graphene, SWNT, and CB (Figure 8B). Because CI has a similar crystalline structure to CB, albeit with a few-layered graphene and a much higher sp2 content [48], the solvent polarity parameter based formulation explains why flavins with longer lS promote the formation of greater amounts of CIs. Overall, a comparison of Δδ is in accord with the observed dispersion trends for SWNT and CIs.
Control of sonication bath temperature, which has been utilized to control SWNT dispersibility [35,37], enables further reduction of the co-dispersed CI concentration. Figure 9A–C show the absorption spectra of SWNT dispersion formed using FC12, FC16, and FC20 and sonication at three temperatures of 15, 25, and 35 °C. For FC12-PSWNT dispersion, with increasing sonication temperature, β is greatly reduced compared to α, which is maintained almost constant. Conversely, FC16 and FC20 reduce both α and β with increasing temperatures. To understand this behavior in terms of temperature and lS, we considered the following ideal chemical equilibrium νflavin(sol) + SWNT(s)  νflavin-SWNT(sol), where ν is number of flavins associated with an SWNT. The equilibrium constant for this process is K = [νflavin-SWNT]/[flavin]ν. Since νflavin-SWNT is proportional to absorbance α, the enthalpy change (ΔH) of the reaction can be obtained using the van’t Hoff equation:
ln   K = Δ H R T + Δ S / R
where ΔS is the entropy change, R is the gas constant (8.314 J/mol·K), and T is the absolute temperature. β can be treated in a similar manner. Here, K is proportional to the concentration of νflavin-SWNT.
The plots of the temperature-dependent changes in α and β (Figure 9D,E) show that increasing the sonication bath temperature greatly reduces β compared to α, irrespective of the flavin lS. This is partially consistent with the temperature dependency of polythiophene-SWNT dispersion [37]. The slopes of these plots, which correspond to −ΔH/R, are all positive. Using this data, ΔH trends for α and β according to lS (Figure 9F) were obtained. The data show that ΔH associated with α linearly decreases from −5 to −15 kJ/mol with increasing lS, whereas ΔH associated with β has a minimum at FC16 and FC20. This result indicates that SWNT along with CIs are stabilized by a flavin possessing a longer side chain. Similarly, the ΔHs associated with α and β of the FC16- and FC20-derived PSWNT dispersions originate from different side chain configurations (i.e., hairpin-folded or interdigitated structures) because flavin-SWNT have radially extended side chains in solvents, such as p-xylene [28,33], whereas flavin on disk-like CIs exhibit vertically extended side chain and promotes interaction with adjacent flavin-functionalized CIs, as depicted in cartoon in the AFM results (Figure 7I). The enthalpic change of CIs with increasing lS stems from possible interdigitation of the vertically extended n-alkyl flavin side chains between CIs at the expense of solvation.
The aforementioned dispersions prepared under various conditions were compared. Each dispersion was analyzed in terms of αsem, αmet, and β. Using 0.61 mM FC12-PSWNT dispersion at room temperature as reference, Figure 10A shows a ternary plot of αsem, αmet, and β located at each vertex. Most contributions originate from β, which ranges from 69% to 84%, irrespective of conditions. Within our experimental scope, decreasing lS, increasing sonication bath temperature, increasing g-force, and decreasing FC12 concentration result in decreased β. Among them, varying side chain results in a dramatic change in β. Moreover, Figure 10B depicts the purity of s-SWNT which ranges from 93.5% to 96.5%. Particularly, a lower FC12 concentration and higher g-force lead to an increased αsem/α owing to the s-SWNT preference, whereas increasing lS and decreased sonication temperature show the opposite trend. The self-assembly nature of flavin explains the behaviors caused by the extrinsic parameter. The concerted H-bonding and π–π interaction between flavins and SWNT [27] are known to be much stronger than vdW interaction between flavin derivatives and defective CI. Therefore, thermal energy induces a larger disruption of vdW-interacted CIs.
Thus far, the effects of a single flavin surfactant on dt-dependent SWNT dispersion have been investigated. However, we discovered that a tandem mixture of two flavins can further fine-tune the dt-distribution of SWNT by utilizing self-assembly of tandem flavins. Figure 11A–C show the absorption spectra of PSWNT dispersions prepared by using combinations FC8/FC12, FC16/FC12, and FC20/FC12 containing isomolar amounts of two flavins, including those from the individual and averaged and aged samples. In tandem combinations, all dispersions have much lower absorbances than the average spectra. The fact that SWNT contents generated by tandem flavins have a propensity towards flavin with shorter lS demonstrates the significance of flavin solubility. Another aspect to consider is the lower dt propensity of the dispersed SWNT derived from the FC8/FC12 tandem mixture. Evidently, the eS11 band at 1625 nm is larger than that of FC12-derived dispersion and it was further strengthened in the aged sample (i.e., three years old). The corresponding PLE maps (Figure S17A–C) and PL emission spectra (Figure S17D) clearly indicate the dt distribution change of PSWNT when tandem surfactants are combined. In addition, at both centrifugal forces, such aging effects were not significant for single surfactant-SWNT dispersions (Figure S18A,B). Moreover, the aforementioned aged sample with different chirality selection implies that dynamic equilibrium is involved. This is consistent with the observation reported by Mollahosseini et al. [67] that a mixture of 99% FC12 and 1% flavin functionalized with a fullerene derivative (PCBM) promotes heterostructured flavin-SWNT dispersion formation, whereas the one comprised of 100% flavin functionalized with PCBM does not produce a SWNT dispersion.
The ratio of tandem surfactant on SWNT is disproportionated when compared to the 1:1 flavin ratios obtained by MALDI-TOF MS. Herein, three samples were prepared: an isomolar solution of FC8/FC12, the as-prepared FC8/FC12 on PSWNT, and the aged FC8/FC12 on PSWNT without free flavins (see Materials and Methods section). It is noteworthy that the FC8/FC12 composition on PSWNT was obtained by filtration of the SWNT and subsequent redispersion of SWNT while free flavins were removed. The MS spectrum of the control shows that FC8/FC12 mixture exhibits the strongest peaks at 356 and 412 m/z with 50:50 ratio, and their molecular weights are two atomic units larger than those of FC8 and FC12 (i.e., 354.45 and 410.55 g/mol, respectively). This result suggests that 355-nm pulsed laser irradiation during the MALDI-TOF process induces photoreduction of FC8 and FC12 (ref: [24,68]) into the corresponding reduced forms (FrC8 and FrC12, the chemical structures of which are shown in Figure S19A,B, respectively) as opposed to no change in dithranol as reference (Figure S19C,D). However, the FC8/FC12 ratios on SWNT in the as-prepared and aged samples increase from 51/49 to 63/37, indicating an increased population of FC8 on SWNT via the dynamic equilibrium process. The question is why FC8 is being driven to the SWNT surface. We attributed this behavior to the relatively low solubility of FC8 among flavins. Figure S20A,B show the absorption spectra of entire flavin surfactants in p-xylene and the derived solubilities in p-xylene using extinction coefficient of flavin (12,600 L/mol·cm) [40,41]. FC12 shows higher molar solubility (2.32 mM) than others (1.51, 1.99, and 1.93 mM for FC8, FC16 and FC20). The lower solubilities for FC16 and FC20 appear to originate from the aforementioned ‘hairpin’ folding of n-alkyl chain greater than n-dodecyl [69,70].
Helical flavin assembly on SWNT can be viewed as templated self-assembly process on SWNT. Self-sorting of surfactants would occur in the case of dual surfactants. Self-sorting behavior from tandem surfactants is either social sorting or narcissistic sorting, as shown in schematic of Figure 12A [71,72,73,74]. Social sorting is a statistical distribution of dissimilar assembly motifs, whereas narcissistic assembly generates homologous assembly through self-recognition. Because of the sonication-assisted self-assembly of flavins, as-prepared FC8/FC12-PSWNT dispersion is regarded as statistical 1:1 social sorting mainly by a kinetic process, where sonication [45] is an enormous energy source for self-assembly [75]. Meanwhile, during the aging period, FC8/FC12 on PSWNT dispersion undergoes dynamic equilibrium between bound flavins on SWNT and ‘free’ FC8/FC12 in solution, as depicted in Figure 12A, and FC8 is narcissistically enriched on SWNT.
The aged sample displayed narcissistic sorting. As shown in Figure 12B, 0.61 mM FC12-HiPco dispersion was subjected to FC8 addition, aging, and bath-sonication. The absorption spectrum (black trace) shows well-resolved eS11 and eS22. While addition of FC8 does not yield an immediate spectral change (red trace) except lowered absorbance, one-week aged samples show a dt-dependent redshift of eS11 up to 2.2 meV for larger dt SWNT possibly due to small SWNT bundling, as shown in the electronvolt scale (Figure 12C). The absorption spectrum (magenta trace) was then restored to its original eS11 positions after a brief bath sonication. The corresponding PLE maps (Figure 12D) show such dt-dependent changes for such treatments. First, the as-prepared sample exhibits (9,5), (8,6), and (7,5) enrichment as major chiralities and does not change significantly after FC8 addition. However, the aging period induces (8,4) and (7,5) enrichment by lowering IPL of the larger dt SWNT (see the max IPL of each map). Brief bath-sonication of this sample partially recovered the PL-based SWNT abundance (i.e., (9,5), (8,6), and (7,5) enrichment) similar to that of the as-prepared sample. Considering the aforementioned smaller-dt SWNT selectivity by FC8, the aging of FC8/FC12-HiPco sample induces narcissistic sorting of FC8 on SWNT surface.
Next, we investigated social sorting by varying the FC8/FC12 ratio for PSWNT and HiPco dispersions. Figure 13A shows the absorption spectrum change by changing FC8/FC12 molar ratio from 0:10 to 5:5 with the concentration maintained at 0.61 mM. Any increase of the FC8 ratio above 5 does not yield a stable dispersion, setting the lower limit for stable PSWNT dispersion. Evidently, increasing the FC8 portion over FC12 promotes dt distribution narrowing whose eS11 is centered at approximately 1625 nm. Overall absorbance at 940 nm as reference decreases with an increasing FC8 ratio, as evident by Figure 13B. The corresponding PLE maps (Figure 13C) show that with an increasing FC8 ratio, IPL of (13,5) chirality at 1625 nm increases, whereas that of (10,8) chirality decreases. The corresponding normalized PL emission spectra (Figure 13D) exhibit (13,5) enrichment. The usage of HiPco having smaller average dt results in few chirality enrichments of SWNT in both absorption and PL spectroscopies (see Figure S21A to S21M for photograph of the dispersion, entire absorption, and PLE maps). Figure 13E shows the absorption spectrum change of HiPco dispersion with an increasing FC8 ratio. When FC8:FC12 is equal to 6:4, few chirality enrichments such as (8,4), (7,6), (6,5), and (8,3) occur albeit the reduced absorbance (Figure 13F). Notably, this absorbance exhibits a very low background. These results indicated that the marginal dispersibility of SWNT induced by surfactants is a key parameter for both selection of SWNT chiralities and exclusion of CIs. The corresponding PLE maps (Figure 13G) pinpoint the SWNT chiralities enriched during this process. While the initial PLE map from FC8/FC12 = 0/10 displays the denoted 12 different SWNT chiralities, the 6:4 sample mainly shows the four SWNT chiralities. PL emission (Figure 13H) further supports such few chirality enrichments.

4. Conclusions

In this study, we investigated the single/tandem effects of flavin lS on the purity, m-/s-ratio, and dt selectivity of SWNT using isomolar flavin concentration. A two-step sequence was used to synthesize FC8, FC12, FC16, and FC20. In p-xylene, FC12, FC16, and FC20 produced stable s-enriched PSWNT dispersions, whereas FC8 produced a poor one owing to shorter lS. FC8 dispersion with a smaller average dt SWNT revealed specific chirality selection towards smaller dt. Flavins with longer lS exhibited s-SWNT dispersion with higher CIs and m-SWNT. Considering helical flavin wrapping motifs on the SWNT, we empirically derived ‘lS per carbon atom in SWNT’ to provide stable SWNT dispersion according to SWNT dt. Moreover, morphology change of CIs according to increasing lS was ascribed to the vdW interaction and side-chain configurations. The smaller solubility parameter difference was ascribed to the apparent increase in CIs, which affected the quantum yield of SWNT due to fluorescence quenching of nearby metallic CIs. Increasing sonication bath temperatures enables flavin derivatives to disperse CIs less efficiently than SWNTs. Based on this, the enthalpy changes of both SWNT and CIs were derived according to lS. The overall purity of SWNT over CIs increased with decreasing lS and FC12 concentration, increasing g-force and sonication bath temperature. A tandem mixture of the flavin surfactants was employed to fine-tune SWNT dispersibility and dt-selectivity via either social or narcissistic sorting. While the as-prepared tandem surfactants exhibit social sorting behavior with statistical adsorption, the aged tandem surfactants on SWNT exhibited narcissistic sorting of flavin with shorter lS owing to the lower solubility. Increasing the proportion of flavin with lower solubility induces SWNT dt narrowing towards smaller dt and promotes few chirality enrichments upon using smaller average dt SWNT. These findings address an important aspect of unanswered lS in surfactant design for s-SWNT purity control. The dt modulation concepts uncovered in this study should be deployable for optoelectronic and energy applications, such as thin-film transistor and thermoelectric applications, dependent upon dt.

Supplementary Materials

The following supporting information can be downloaded at: https://www.mdpi.com/article/10.3390/nano12193380/s1, Scheme S1: Sideview (left) and topview (right) of 91 flavin helix-wrapped (8,10) tube (A) before and (B) after geometry optimization. Lumiflavin (methyl flavin) was utilized for molecular mechanics (MM) simulation.; Figure S1: 1H NMR and 13C NMR spectra of 1-4; Figure S2: 1H NMR and 13C NMR spectra of 1-4; Figure S3: 1H NMR and 13C NMR spectra of FC8, FC12, FC16, and FC20; Figure S4: 1H NMR and 13C NMR spectra of FC8, FC12, FC16, and FC20; Figure S5: absorption spectrum and corresponding PLE map of 2.44 mM FC12-HiPco; Figure S6: larger dt SWNT propensity of flavin with longer lS; Figure S7: dispersion of PSWNT with low flavin concentration; Figure S8: defining α and β in the absorption spectra in wavenumber scale; Figure S9: comparison of PSWNT dispersions according to centrifugal forces; Figure S10: PLE maps of FC12-, FC16-, and FC20-PSWNT dispersions centrifuged at 30 kg; Figure S11: comparison of absorption and PL emission spectra for ΦR, (10,8) determinations; Figure S12: Raman spectrum change of PSWNT with 30 kg centrifugation; Figure S13: calculation of the lS per carbon atom in the SWNT; Figure S14: variation of CI present in PSWNT films prepared by varying flavin lS; Figure S15: the corresponding AFM phase images of flavin-wrapped PSWNT; Figure S16: SWNT and CI morphology trends in FC8-, FC12-, FC16-, and FC20-PSWNT; Figure S17: PLE maps of PSequationWNT dispersions by using tandem flavin surfactants; Figure S18: comparison of absorption spectra from the as-prepared and the aged samples; Figure S19: chemical structures in MS spectra; Figure S20: solubility determination of flavin derivatives by using absorption spectra; Figure S21: effect of FC8/FC12 ratio on dt distribution of HiPco dispersion; Entire and compound spectra of FrC8, FrC12, FrC16, and FrC20 acquired by MALDI-TOF MS; Table S1: δ and its subcomponents.

Author Contributions

Conceptualization, writing, supervision, and funding acquisition: S.-Y.J.; methodology: M.P. and S.H. All authors have read and agreed to the published version of the manuscript.

Funding

This research was mainly supported by the Basic Science Research Program through the National Research Foundation of Korea (NRF) funded by the Ministry of Education, Science, and Technology (NRF-2022R1A2C1006932 and NRF-2020R1A4A1017737).

Institutional Review Board Statement

Not applicable.

Informed Consent Statement

Not applicable.

Data Availability Statement

The data presented in this study are available on request from the corresponding author.

Conflicts of Interest

The authors declare no conflict of interest.

References

  1. Lee, R.S.; Kim, H.J.; Fischer, J.E.; Thess, A.; Smalley, R.E. Conductivity Enhancement in Single-Walled Carbon Nanotube Bundles Doped with K and Br. Nature 1997, 388, 255–257. [Google Scholar] [CrossRef]
  2. Bekyarova, E.; Itkis, M.E.; Cabrera, N.; Zhao, B.; Yu, A.; Gao, J.; Haddon, R.C. Electronic Properties of Single-Walled Carbon Nanotube Networks. J. Am. Chem. Soc. 2005, 127, 5990–5995. [Google Scholar] [CrossRef]
  3. Nirmalraj, P.N.; Lyons, P.E.; De, S.; Coleman, J.N.; Boland, J.J. Electrical Connectivity in Single-Walled Carbon Nanotube Networks. Nano Lett. 2009, 9, 3890–3895. [Google Scholar] [CrossRef]
  4. Seliuta, D.; Subačius, L.; Kašalynas, I.; Shuba, M.; Paddubskaya, A.; Ksenevich, V.; Kuzhir, P.; Maksimenko, S.; Valušis, G. Electrical Conductivity of Single-Wall Carbon Nanotube Films in Strong Electric Field. J. Appl. Phys. 2013, 113, 183719. [Google Scholar] [CrossRef]
  5. Liew, K.M.; Wong, C.H.; He, X.Q.; Tan, M.J. Thermal Stability of Single and Multi-Walled Carbon Nanotubes. Phys. Rev. B 2005, 71, 075424. [Google Scholar] [CrossRef]
  6. Duong, H.M.; Papavassiliou, D.V.; Mullen, K.J.; Wardle, B.L.; Maruyama, S. Calculated Thermal Properties of Single-Walled Carbon Nanotube Suspensions. J. Phys. Chem. C 2008, 112, 19860–19865. [Google Scholar] [CrossRef]
  7. Duzynska, A.; Taube, A.; Korona, K.P.; Judek, J.; Zdrojek, M. Temperature-Dependent Thermal Properties of Single-Walled Carbon Nanotube Thin Films. Appl. Phys. Lett. 2015, 106, 183108. [Google Scholar] [CrossRef]
  8. Zheng, M.; Jagota, A.; Semke, E.D.; Diner, B.A.; McLean, R.S.; Lustig, S.R.; Richardson, R.E.; Tassi, N.G. DNA-Assisted Dispersion and Separation of Carbon Nanotubes. Nat. Mater. 2003, 2, 338–342. [Google Scholar] [CrossRef]
  9. Zheng, M.; Jagota, A.; Strano, M.S.; Santos, A.P.; Barone, P.; Chou, S.G.; Diner, B.A.; Dresselhaus, M.S.; McLean, R.S.; Onoa, G.B.; et al. Structure-Based Carbon Nanotube Sorting by Sequence-Dependent DNA Assembly. Science 2003, 302, 1545–1548. [Google Scholar] [CrossRef]
  10. Tu, X.; Manohar, S.; Jagota, A.; Zheng, M. DNA Sequence Motifs for Structure-Specific Recognition and Separation of Carbon Nanotubes. Nature 2009, 460, 250–253. [Google Scholar] [CrossRef]
  11. Arnold, M.S.; Stupp, S.I.; Hersam, M.C. Enrichment of Single-Walled Carbon Nanotubes by Diameter in Density Gradients. Nano Lett. 2005, 5, 713–718. [Google Scholar] [CrossRef] [PubMed]
  12. Arnold, M.S.; Green, A.A.; Hulvat, J.F.; Stupp, S.I.; Hersam, M.C. Sorting Carbon Nanotubes by Electronic Structure Using Density Differentiation. Nat. Nanotechnol. 2006, 1, 60–65. [Google Scholar] [CrossRef]
  13. Green, A.A.; Hersam, M.C. Processing and Properties of Highly Enriched Double-Wall Carbon Nanotubes. Nat. Nanotechnol. 2009, 4, 64–70. [Google Scholar] [CrossRef] [PubMed]
  14. Liu, H.; Nishide, D.; Tanaka, T.; Kataura, H. Large-Scale Single-Chirality Separation of Single-Wall Carbon Nanotubes by Simple Gel Chromatography. Nat. Commun. 2011, 2, 309. [Google Scholar] [CrossRef] [PubMed]
  15. Hirano, A.; Tanaka, T.; Urabe, Y.; Kataura, H. pH- and Solute-Dependent Adsorption of Single-Wall Carbon Nanotubes onto Hydrogels: Mechanistic Insights into the Metal/Semiconductor Separation. ACS Nano 2013, 7, 10285–10295. [Google Scholar] [CrossRef] [PubMed]
  16. Wei, X.; Tanaka, T.; Yomogida, Y.; Sato, N.; Saito, R.; Kataura, H. Experimental Determination of Excitonic Band Structures of Single-Walled Carbon Nanotubes Using Circular Dichroism Spectra. Nat. Commun. 2016, 7, 12899. [Google Scholar] [CrossRef]
  17. Khripin, C.Y.; Fagan, J.A.; Zheng, M. Spontaneous Partition of Carbon Nanotubes in Polymer-Modified Aqueous Phases. J. Am. Chem. Soc. 2013, 135, 6822–6825. [Google Scholar] [CrossRef]
  18. Fagan, J.A.; Hároz, E.H.; Ihly, R.; Gui, H.; Blackburn, J.L.; Simpson, J.R.; Lam, S.; Hight Walker, A.R.; Doorn, S.K.; Zheng, M. Isolation of >1 nm Diameter Single-Wall Carbon Nanotube Species Using Aqueous Two-Phase Extraction. ACS Nano 2015, 9, 5377–5390. [Google Scholar] [CrossRef]
  19. Li, H.; Gordeev, G.; Garrity, O.; Peyyety, N.A.; Selvasundaram, P.B.; Dehm, S.; Krupke, R.; Cambré, S.; Wenseleers, W.; Reich, S.; et al. Separation of Specific Single-Enantiomer Single-Wall Carbon Nanotubes in the Large-Diameter Regime. ACS Nano 2020, 14, 948–963. [Google Scholar] [CrossRef]
  20. Nish, A.; Hwang, J.-Y.; Doig, J.; Nicholas, R.J. Highly Selective Dispersion of Single-Walled Carbon Nanotubes Using Aromatic Polymers. Nat. Nanotechnol. 2007, 2, 640–646. [Google Scholar] [CrossRef]
  21. Chen, F.; Wang, B.; Chen, Y.; Li, L.-J. Toward the Extraction of Single Species of Single-Walled Carbon Nanotubes Using Fluorene-Based Polymers. Nano Lett. 2007, 7, 3013–3017. [Google Scholar] [CrossRef] [PubMed]
  22. Akazaki, K.; Toshimitsu, F.; Ozawa, H.; Fujigaya, T.; Nakashima, N. Recognition and One-Pot Extraction of Right- and Left-Handed Semiconducting Single-Walled Carbon Nanotube Enantiomers Using Fluorene-Binaphthol Chiral Copolymers. J. Am. Chem. Soc. 2012, 134, 12700–12707. [Google Scholar] [CrossRef] [PubMed]
  23. Kato, Y.; Fukuzawa, M.; Toshimitsu, F.; Nakashima, N. Separation of Semiconducting Single-Walled Carbon Nanotubes Using a Flavin Compound. Chem. Lett. 2015, 44, 566–567. [Google Scholar] [CrossRef]
  24. Park, M.; Kim, S.; Kwon, H.; Hong, S.; Im, S.; Ju, S.-Y. Selective Dispersion of Highly Pure Large-Diameter Semiconducting Carbon Nanotubes by a Flavin for Thin-Film Transistors. ACS Appl. Mater. Interfaces 2016, 8, 23270–23280. [Google Scholar] [CrossRef]
  25. Nakashima, N.; Fukuzawa, M.; Nishimura, K.; Fujigaya, T.; Kato, Y.; Staykov, A. Supramolecular Chemistry-Based One-Pot High-Efficiency Separation of Solubilizer-Free Pure Semiconducting Single-Walled Carbon Nanotubes: Molecular Strategy and Mechanism. J. Am. Chem. Soc. 2020, 142, 11847–11856. [Google Scholar]
  26. Huang, W.; Toshimitsu, F.; Ozono, K.; Matsumoto, M.; Borah, A.; Motoishi, Y.; Park, K.H.; Jang, J.W.; Fujigaya, T. Thermoelectric Properties of Dispersant-Free Semiconducting Single-Walled Carbon Nanotubes Sorted by a Flavin Extraction Method. Chem. Commun. 2019, 55, 2636–2639. [Google Scholar] [CrossRef]
  27. Ju, S.-Y.; Doll, J.; Sharma, I.; Papadimitrakopoulos, F. Selection of Carbon Nanotubes with Specific Chiralities Using Helical Assemblies of Flavin Mononucleotide. Nat. Nanotechnol. 2008, 3, 356–362. [Google Scholar]
  28. Ju, S.-Y.; Kopcha, W.P.; Papadimitrakopoulos, F. Brightly Fluorescent Single-Walled Carbon Nanotubes via an Oxygen-Excluding Surfactant Organization. Science 2009, 323, 1319–1323. [Google Scholar]
  29. Konevtsova, O.V.; Roshal, D.S.; Dmitriev, V.P.; Rochal, S.B. Carbon Nanotube Sorting due to Commensurate Molecular Wrapping. Nanoscale 2020, 12, 15725–15735. [Google Scholar] [CrossRef]
  30. Ogunro, O.O.; Wang, X.-Q. Quantum Electronic Stability in Selective Enrichment of Carbon Nanotubes. Nano Lett. 2009, 9, 1034–1038. [Google Scholar] [CrossRef]
  31. Sharifi, R.; Samaraweera, M.; Gascón, J.A.; Papadimitrakopoulos, F. Thermodynamics of the Quasi-Epitaxial Flavin Assembly around Various-Chirality Carbon Nanotubes. J. Am. Chem. Soc. 2014, 136, 7452–7463. [Google Scholar] [CrossRef] [PubMed]
  32. Oh, H.; Sim, J.; Ju, S.-Y. Binding Affinities and Thermodynamics of Noncovalent Functionalization of Carbon Nanotubes with Surfactants. Langmuir 2013, 29, 11154–11162. [Google Scholar] [CrossRef] [PubMed]
  33. Choi, I.-S.; Park, M.; Koo, E.; Ju, S.-Y. Dispersions of Carbon Nanotubes by Helical Flavin Surfactants: Solvent Induced Stability and Chirality Enrichment, and Solvatochromism. Carbon 2021, 184, 346–356. [Google Scholar] [CrossRef]
  34. Gomulya, W.; Costanzo, G.D.; de Carvalho, E.J.F.; Bisri, S.Z.; Derenskyi, V.; Fritsch, M.; Fröhlich, N.; Allard, S.; Gordiichuk, P.; Herrmann, A.; et al. Semiconducting Single-Walled Carbon Nanotubes on Demand by Polymer Wrapping. Adv. Mater. 2013, 25, 2948–2956. [Google Scholar] [CrossRef]
  35. Lee, H.W.; Yoon, Y.; Park, S.; Oh, J.H.; Hong, S.; Liyanage, L.S.; Wang, H.; Morishita, S.; Patil, N.; Park, Y.J.; et al. Selective Dispersion of High Purity Semiconducting Single-Walled Carbon Nanotubes with Regioregular Poly(3-alkylthiophene)s. Nat. Commun. 2011, 2, 541. [Google Scholar] [CrossRef]
  36. Wang, H.; Koleilat, G.I.; Liu, P.; Jiménez-Osés, G.; Lai, Y.-C.; Vosgueritchian, M.; Fang, Y.; Park, S.; Houk, K.N.; Bao, Z. High-Yield Sorting of Small-Diameter Carbon Nanotubes for Solar Cells and Transistors. ACS Nano 2014, 8, 2609–2617. [Google Scholar] [CrossRef]
  37. Gomulya, W.; Salazar Rios, J.M.; Derenskyi, V.; Bisri, S.Z.; Jung, S.; Fritsch, M.; Allard, S.; Scherf, U.; dos Santos, M.C.; Loi, M.A. Effect of Temperature on the Selection of Semiconducting Single Walled Carbon Nanotubes Using Poly(3-dodecylthiophene-2,5-diyl). Carbon 2015, 84, 66–73. [Google Scholar] [CrossRef]
  38. Sim, J.; Kim, S.; Jang, M.; Park, M.; Oh, H.; Ju, S.-Y. Determination of the Absolute Enantiomeric Excess of the Carbon Nanotube Ensemble by Symmetry Breaking Using the Optical Titration Method. Langmuir 2017, 33, 11000–11009. [Google Scholar] [CrossRef]
  39. Nikolaev, P.; Bronikowski, M.J.; Bradley, R.K.; Rohmund, F.; Colbert, D.T.; Smith, K.A.; Smalley, R.E. Gas-Phase Catalytic Growth of Single-Walled Carbon Nanotubes from Carbon Monoxide. Chem. Phys. Lett. 1999, 313, 91–97. [Google Scholar] [CrossRef]
  40. Frier, C.; Décout, J.-L.; Fontecave, M. Method for Preparing New Flavin Derivatives:  Synthesis of Flavin−Thymine Nucleotides and Flavin−Oligonucleotide Adducts. J. Org. Chem. 1997, 62, 3520–3528. [Google Scholar] [CrossRef]
  41. Ju, S.-Y.; Papadimitrakopoulos, F. Synthesis and Redox Behavior of Flavin Mononucleotide-Functionalized Single-Walled Carbon Nanotubes. J. Am. Chem. Soc. 2008, 130, 655–664. [Google Scholar] [CrossRef] [PubMed]
  42. Koo, E.; Ju, S.-Y. Role of Residual Polymer on Chemical Vapor Grown Graphene by Raman Spectroscopy. Carbon 2015, 86, 318–324. [Google Scholar] [CrossRef]
  43. S. Maruyama’s Site. Available online: http://www.photon.t.u-tokyo.ac.jp/~maruyama/wrapping3/wrapping.html (accessed on 31 May 2022).
  44. Humphrey, W.; Dalke, A.; Schulten, K. VMD: Visual Molecular Dynamics. J. Mol. Graph. 1996, 14, 33–38. [Google Scholar] [CrossRef]
  45. O’Connell, M.J.; Bachilo, S.M.; Huffman, C.B.; Moore, V.C.; Strano, M.S.; Haroz, E.H.; Rialon, K.L.; Boul, P.J.; Noon, W.H.; Kittrell, C.; et al. Band Gap Fluorescence from Individual Single-Walled Carbon Nanotubes. Science 2002, 297, 593–596. [Google Scholar] [CrossRef] [PubMed]
  46. Naumov, A.V.; Ghosh, S.; Tsyboulski, D.A.; Bachilo, S.M.; Weisman, R.B. Analyzing Absorption Backgrounds in Single-Walled Carbon Nanotube Spectra. ACS Nano 2011, 5, 1639–1648. [Google Scholar] [CrossRef] [PubMed]
  47. Itkis, M.E.; Perea, D.E.; Jung, R.; Niyogi, S.; Haddon, R.C. Comparison of Analytical Techniques for Purity Evaluation of Single-Walled Carbon Nanotubes. J. Am. Chem. Soc. 2005, 127, 3439–3448. [Google Scholar] [CrossRef]
  48. Park, M.; Choi, I.-S.; Ju, S.-Y. Quantification and Removal of Carbonaceous Impurities in a Surfactant-Assisted Carbon Nanotube Dispersion and Its Implication on Electronic Properties. Nanoscale Adv. 2022, 4, 3537–3548. [Google Scholar] [CrossRef]
  49. Subramani, C.; Yesilbag, G.; Jordan, B.J.; Li, X.; Khorasani, A.; Cooke, G.; Sanyal, A.; Rotello, V.M. Recognition Mediated Encapsulation and Isolation of Flavin–Polymer Conjugates Using Dendritic Guest Moieties. Chem. Commun. 2010, 46, 2067–2069. [Google Scholar] [CrossRef]
  50. Rong, Z.; Kjaergaard, H.G. Internal Methyl Rotation in the CH Stretching Overtone Spectra of ortho-, meta-, and para-Xylene. J. Phys. Chem. A 2002, 106, 6242–6253. [Google Scholar] [CrossRef]
  51. Ding, J.; Li, Z.; Lefebvre, J.; Cheng, F.; Dubey, G.; Zou, S.; Finnie, P.; Hrdina, A.; Scoles, L.; Lopinski, G.P.; et al. Enrichment of Large-Diameter Semiconducting SWCNTs by Polyfluorene Extraction for High Network Density Thin Film Transistors. Nanoscale 2014, 6, 2328–2339. [Google Scholar] [CrossRef]
  52. Crochet, J.; Clemens, M.; Hertel, T. Quantum Yield Heterogeneities of Aqueous Single-Wall Carbon Nanotube Suspensions. J. Am. Chem. Soc. 2007, 129, 8058–8059. [Google Scholar] [CrossRef] [PubMed]
  53. Wei, X.; Tanaka, T.; Li, S.; Tsuzuki, M.; Wang, G.; Yao, Z.; Li, L.; Yomogida, Y.; Hirano, A.; Liu, H.; et al. Photoluminescence Quantum Yield of Single-Wall Carbon Nanotubes Corrected for the Photon Reabsorption Effect. Nano Lett. 2020, 20, 410–417. [Google Scholar] [CrossRef] [PubMed]
  54. Dresselhaus, M.S.; Jorio, A.; Souza Filho, A.G.; Saito, R. Defect Characterization in Graphene and Carbon Nanotubes Using Raman Spectroscopy. Philos. Trans. R. Soc. A 2010, 368, 5355–5377. [Google Scholar] [CrossRef] [PubMed] [Green Version]
  55. Sim, J.; Oh, H.; Koo, E.; Ju, S.-Y. Effect of Tight Flavin Mononucleotide Wrapping and Its Binding Affinity on Carbon Nanotube Covalent Reactivities. Phys. Chem. Chem. Phys. 2013, 15, 19169–19179. [Google Scholar] [CrossRef]
  56. Saito, R.; Fujita, M.; Dresselhaus, G.; Dresselhaus, M.S. Electronic Structure of Chiral Graphene Tubules. Appl. Phys. Lett. 1992, 60, 2204–2206. [Google Scholar] [CrossRef]
  57. Jishi, R.A.; Inomata, D.; Nakao, K.; Dresselhaus, M.S.; Dresselhaus, G. Electronic and Lattice Properties of Carbon Nanotubes. J. Phys. Soc. Jpn. 1994, 63, 2252–2260. [Google Scholar] [CrossRef]
  58. Magonov, S.N.; Elings, V.; Whangbo, M.H. Phase Imaging and Stiffness in Tapping-Mode Atomic Force Microscopy. Surf. Sci. 1997, 375, L385–L391. [Google Scholar] [CrossRef]
  59. Thanawan, S.; Radabutra, S.; Thamasirianunt, P.; Amornsakchai, T.; Suchiva, K. Origin of Phase Shift in Atomic Force Microscopic Investigation of the Surface Morphology of NR/NBR Blend Film. Ultramicroscopy 2009, 109, 189–192. [Google Scholar] [CrossRef]
  60. Cheng, Q.; Debnath, S.; Gregan, E.; Byrne, H.J. Effect of Solvent Solubility Parameters on the Dispersion of Single-Walled Carbon Nanotubes. J. Phys. Chem. C 2008, 112, 20154–20158. [Google Scholar] [CrossRef]
  61. Bergin, S.D.; Sun, Z.; Rickard, D.; Streich, P.V.; Hamilton, J.P.; Coleman, J.N. Multicomponent Solubility Parameters for Single-Walled Carbon Nanotube−Solvent Mixtures. ACS Nano 2009, 3, 2340–2350. [Google Scholar] [CrossRef]
  62. Ham, H.T.; Choi, Y.S.; Chung, I.J. An Explanation of Dispersion States of Single-Walled Carbon Nanotubes in Solvents and Aqueous Surfactant Solutions Using Solubility Parameters. J. Colloid Interface Sci. 2005, 286, 216–223. [Google Scholar] [CrossRef] [PubMed]
  63. Krevelen, D.W.V. Properties of Polymers, 3rd ed.; Elsevier: New York, NY, USA, 1990; p. 203. [Google Scholar]
  64. Zuaznabar-Gardona, J.C.; Fragoso, A. Determination of the Hansen Solubility Parameters of Carbon Nano-Onions and Prediction of Their Dispersibility in Organic Solvents. J. Mol. Liq. 2019, 294, 111646. [Google Scholar] [CrossRef]
  65. Hernandez, Y.; Lotya, M.; Rickard, D.; Bergin, S.D.; Coleman, J.N. Measurement of Multicomponent Solubility Parameters for Graphene Facilitates Solvent Discovery. Langmuir 2010, 26, 3208–3213. [Google Scholar] [CrossRef] [PubMed]
  66. Süß, S.; Sobisch, T.; Peukert, W.; Lerche, D.; Segets, D. Determination of Hansen Parameters for Particles: A Standardized Routine based on Analytical Centrifugation. Adv. Powder Technol. 2018, 29, 1550–1561. [Google Scholar] [CrossRef]
  67. Mollahosseini, M.; Karunaratne, E.; Gibson, G.N.; Gascón, J.A.; Papadimitrakopoulos, F. Fullerene-Assisted Photoinduced Charge Transfer of Single-Walled Carbon Nanotubes through a Flavin Helix. J. Am. Chem. Soc. 2016, 138, 5904–5915. [Google Scholar] [CrossRef]
  68. Song, S.H.; Dick, B.; Penzkofer, A. Photo-Induced Reduction of Flavin Mononucleotide in Aqueous Solutions. Chem. Phys. 2007, 332, 55–65. [Google Scholar] [CrossRef]
  69. Shi, J.X.; Yang, H.; Xing, S.Y.; Zhang, H. Molecular Dynamics Simulation of the Fold of Alkyl Groups with Different Lengths when N-Hexane Molecules Forming Ordered Structure on Their Functionalized Graphene. Surf. Sci. 2022, 716, 121965. [Google Scholar] [CrossRef]
  70. Alagbe, B.D.; Gibb, B.C.; Ashbaugh, H.S. Evolution of the Free Energy Landscapes of n-Alkane Guests Bound within Supramolecular Complexes. J. Phys. Chem. B 2021, 125, 7299–7310. [Google Scholar] [CrossRef]
  71. He, Z.; Jiang, W.; Schalley, C.A. Integrative Self-Sorting: A Versatile Strategy for the Construction of Complex Supramolecular Architecture. Chem. Soc. Rev. 2015, 44, 779–789. [Google Scholar] [CrossRef]
  72. Stranick, S.J.; Parikh, A.N.; Tao, Y.T.; Allara, D.L.; Weiss, P.S. Phase Separation of Mixed-Composition Self-Assembled Monolayers into Nanometer Scale Molecular Domains. J. Phys. Chem. 1994, 98, 7636–7646. [Google Scholar] [CrossRef]
  73. Mayoral, M.J.; Rest, C.; Schellheimer, J.; Stepanenko, V.; Fernández, G. Narcissistic versus Social Self-Sorting of Oligophenyleneethynylene Derivatives: From Isodesmic Self-Assembly to Cooperative Co-Assembly. Chem.-Eur. J. 2012, 18, 15607–15611. [Google Scholar] [CrossRef] [PubMed]
  74. Kanno, R.; Tanaka, K.; Ikami, T.; Ouchi, M.; Terashima, T. Reversible Co-Self-Assembly and Self-Sorting Systems of Polymer Micelles in Water: Polymers Switch Association Partners in Response to Salts. Macromolecules 2022, 55, 5213–5221. [Google Scholar] [CrossRef]
  75. Whitesides, G.M.; Grzybowski, B. Self-Assembly at All Scales. Science 2002, 295, 2418–2421. [Google Scholar] [CrossRef] [PubMed] [Green Version]
Figure 1. (A) Schematic showing the effect of flavin lS on the SWNT dispersions. (Left) SWNT wrapped by helical isoalloxazine wrapping with n-alkyl side chains. (Right) lS-induced SWNT dispersion containing flavin-wrapped SWNTs and CIs with different degree. (B) Synthetic routes to prepare FC8, FC12, FC16, and FC20. Note that N10 site for different lS is indicated. Conditions: (a) TEA, 130 °C, 12 h; yield: 1: 32%, 2: 60%, 3: 46%, 4: 25%; (b) glacial acetic acid, B2O3, 60 °C, 6 h; yield; FC8: 56%, FC12: 58%, FC16: 53%, FC20: 50%.
Nanomaterials 12 03380 g001
Figure 2. dt-dependent FC8-SWNT dispersions. (A) UV-vis-SWIR absorption spectra of FC8-PSWNT dispersions with or without centrifugation. Inset: PLE map of FC8-PSWNT dispersion before centrifugation. (n, m) and circle denote the SWNT chiralities and their cross position between eS22 and eS11 according to the literature [24]. (B) AFM height image of FC8-PSWNT dispersion without centrifugation deposited on 285 nm-thick SiO2/Si substrate. (C) Line profile of the dashed line in (B). (D) Absorption spectrum of 5-kg-centrifuged 2.44 mM FC8-HiPco dispersion, acquired by using a cuvette of beam path 10 mm. The feature near 1650–1800 nm was originated from overtones of C–H stretching of p-xylene [50]. (E) The corresponding PLE map showing smaller dt enrichment of SWNT.
Nanomaterials 12 03380 g002
Figure 3. SWNT dispersibility of flavin derivatives as function of increasing lS and varying centrifugation force. UV-vis-SWIR absorption spectra of PSWNT dispersions by using FC12 (olive), FC16 (brown), FC20 (navy) and centrifugal forces of (A) 5 and (B) 30 kg. α and β denote SWNT contribution and background absorption, respectively. The noise signals in the region from 2500 to 2700 nm originates from infrared vibrations of residual water [48]. Insets display photographs of each set of the dispersions, showing tone-down of the dispersions with 30 kg. (C) α (empty), β (solid), and (D) α/(α + β) contributions according to centrifugal forces (i.e., 5 kg (square) and 30 kg (circle)) and lS.
Nanomaterials 12 03380 g003
Figure 4. Characterization of ΦR. (A) PLE maps of FC12-, FC16-, and FC20-PSWNT dispersions obtained from 5-kg centrifugation. Circle indicates PL positions of SWNT chiralities. (B) Overlaid PL emission spectra of PSWNT according to the lS. Excitation: 885 nm. (C) Absorption and (D) PL emission spectra obtained from FC12-PSWNT dispersion. PL emission spectrum was deconvoluted by Lorentzian shapes and pink shade denotes PL of (10,8) tube. Electron–phonon (e-ph) interaction between different SWNT species was denoted. The asterisk symbol indicates a band whose chirality is unknown in our PLE map but is used for increasing the deconvolution accuracy. (E) ΦR, (10,8) according to lS and centrifugal force.
Nanomaterials 12 03380 g004
Figure 5. Raman spectrum changes of PSWNT with centrifugation of 5 kg with varying lS of flavin. (A) RBM and (B) G band spectra excited by a 785-nm laser. As-purchased PSWNT was used as a control. The dispersions were deposited on a 285-nm-thick SiO2/Si substrate and were washed with copious amount of acetone to remove flavins. The corresponding (C) RBM and (D) G band spectra of the sample excited by a 532-nm laser.
Nanomaterials 12 03380 g005
Figure 6. Calculation of the lS per carbon in the SWNT using the geometry of a 91 flavin helix-wrapped (8,10) tube. (A) Side view of helical wrapping of flavin spaced with vdW distance (0.34 nm) on (8,10) tube with dt = 1.22 nm. SWNT. Note that unit length of flavin helix is 2.5 nm. (B) Top view of flavin wrapping on (8,10) tube. (C) Plot of SWNT dt vs. graphene stretch ratio εG along Ch. Note that each SWNT chirality have different εG. (D) Projected view of 91 isoalloxazine helix on graphene sheet with εG = 1.56 while the length of translational vector (T) of (8,10) tube remains unchanged. (E) Plot of SWNT dt vs. γnC according to flavin derivatives and helical motifs (71, 81, and 91 helices). dt ranges of HiPco and PSWNT are indicated. Chirality-dependent helical motifs are obtained from Ref. [29].
Nanomaterials 12 03380 g006
Figure 7. Morphologies of SWNT and CIs in FC8-, FC12-, FC16- and FC20-PSWNT dispersions centrifuged at 5 kg with or without flavin wrappings. Cases with flavin wrapping: AFM height images of (A) FC8-, (B) FC12-, (C) FC16-, and (D) FC20-wrapped SWNT on mica. (Bottom) height traces of flavin wrapping on SWNT along the length indicated by triangles in images. (E) Their phase traces along the dashed lines as shown in Figure S15A to S15D. Cases without flavin wrapping: (F) height images of each dispersion deposited on a 285-nm-thick SiO2/Si substrate and (G) height profiles extracted from pair of triangles in (F). Limit of individualized PSWNT is indicated by a 1.6-nm green plane. (H) Height histograms of CIs fitted by using a Lognormal function. Average height and standard deviation are listed. (I) Plot of average height of CIs vs. lS of the flavin surfactants according to centrifugal force. Cartoons illustrate the interaction of CIs and flavin derivatives.
Nanomaterials 12 03380 g007
Figure 8. Comparison of δ and its subcomponents for flavin side chains, p-xylene and representative nano carbon allotropes. (A) Comparison of each entity in terms of δD, δP, and δH. (B) Δδ of p-xylene and nano carbon allotropes against lS of flavin.
Nanomaterials 12 03380 g008
Figure 9. Sonication bath temperature dependent absorption spectrum change according to lS. Changes of α from (A) FC12-, (B) FC16-, and (C) FC20-PSWNT dispersions which were prepared by sonication at 15, 25, and 35 °C (from light to dark colors), respectively. Gray shades denote β. van’t Hoff plots for (D) α and (E) β from FC12- (green), FC16- (purple), and FC20-derived dispersions (blue) at 940 nm vs. reciprocal sonication temperatures. The solid lines show the linear regressions from each point. (F) ΔH vs. α and β according to number of carbon atom in flavin side chain (nc). The dotted lines are drawn for visual guidance.
Nanomaterials 12 03380 g009
Figure 10. Trends of various parameters (lS, g-force, temperature, and FC12 concentration) affecting αsem, αmet, and β. (A) Ternary plot of αsem, αmet, and β based on 0.61 mM FC12-PSWNT dispersion at room temperature. Inset: its full scale. Scales are read in a counter-clockwise manner. (B) αsem/(αsem + αmet) plot according to various parameters.
Nanomaterials 12 03380 g010
Figure 11. Absorption spectra of PSWNT dispersions generated using isomolar tandem mixtures of flavin surfactants (A) FC8/FC12, (B) FC16/FC12, and (C) FC20/FC12, compared to those from respective single surfactant dispersion, averaged, and aged tandem samples. All measurements except the aged dispersion were acquired by using a cuvette of beam path 10 mm. The average spectra were obtained by averaging each single flavin spectrum. (D) MALDI-TOF MS spectra of (top) isomolar FC8/FC12 solution, (middle) surfactants present on the as-prepared FC8/FC12-PSWNT, and (bottom) surfactants present on the aged FC8/FC12-PSWNT.
Nanomaterials 12 03380 g011
Figure 12. Social or narcissistic sortings of tandem FC8/FC12 on SWNT affecting dt enrichment of SWNT dispersions. (A) Schematic of social sorting (left) and narcissistic sorting (right) modes of flavin derivatives on SWNT surface. (B) Comparison of absorption spectra from the as-prepared FC12-PSWNT dispersion (black), and after the addition of isomolar FC8 (red), after the one-week aged (blue) and after the bath-sonicated sample (magenta). All absorption measurements were acquired by using a cuvette of beam path 10 mm. (C) The corresponding normalized eS11 absorption spectra with dt-dependent redshift degree of the aged sample against 1.1 eV band. (D) PLE maps of FC12-PSWNT and FC8/FC12-PSWNT dispersions with addition, aging, and bath sonication treatments. It is noteworthy that enriched chiralities of SWNT are different.
Nanomaterials 12 03380 g012
Figure 13. Kinetically driven chirality enrichment behavior of FC8/FC12 with PSWNT and HiPco SWNT types. PSWNT: (A) The absorption spectra of PSWNT prepared by varying ratios of FC8/FC20 while the total concentration of flavins remains the same (0.61 mM). The spectra were normalized against maximum eS22 bands at 940 nm and offset by same interval. (B) Absorbance trend of the 1623-nm peak according to the ratio. (C) The corresponding PLE maps and (D) PL emission spectra of PSWNT according to the ratio. HiPco: (E) The absorption spectra of HiPco prepared by varying ratios of FC8/FC20 while the total concentration of flavins remains the same (2.44 mM). (F) Absorbance trend of the 1126-nm peak according to the ratio. (G) The corresponding PLE maps and (H) PL emission spectra of PSWNT according to the ratio.
Nanomaterials 12 03380 g013
Publisher’s Note: MDPI stays neutral with regard to jurisdictional claims in published maps and institutional affiliations.

