Article

Reverse Magnetization Behavior Investigation of Mn-Al-C-(α-Fe) Nanocomposite Alloys with Different α-Fe Content Using First-Order Reversal Curves Analysis

by
Seyed Nourallah Attyabi
1,
Seyyed Ali Seyyed Ebrahimi
1,*,
Zahra Lalegani
1 and
Bejan Hamawandi
2,*
1
Advanced Magnetic Materials Research Center, School of Metallurgy and Materials, College of Engineering, University of Tehran, Tehran 111554563, Iran
2
Department of Applied Physics, KTH Royal Institute of Technology, SE-106 91 Stockholm, Sweden
*
Authors to whom correspondence should be addressed.
Nanomaterials 2022, 12(19), 3303; https://doi.org/10.3390/nano12193303
Submission received: 20 August 2022 / Revised: 8 September 2022 / Accepted: 19 September 2022 / Published: 22 September 2022
(This article belongs to the Special Issue Novel RE-free Nanocomposite Magnets)

Abstract

:
The reverse magnetization behavior for bulk composite alloys containing Mn-Al-C and α-Fe nanoparticles (NPs) has been investigated by hysteresis loops, recoil, and first-order reversal curves (FORC) analysis. The effect of adding different percentages of α-Fe (5, 10, 15, and 20 wt. %) on the magnetic properties and demagnetization behavior of Mn-Al-C nanostructured bulk magnets was investigated. The fabricated nanocomposites were characterized by XRD and VSM for structural analysis and magnetic behavior investigations, respectively. The demagnetization curve of the sample Mn-Al-C-5wt. % α-Fe showed a single hard magnetic behavior and showed the highest increase in remanence magnetization compared to the sample without α-Fe, and therefore this combination was selected as the optimal composition for FORC analysis. Magnetic properties for Mn-Al-C-5 wt. % α-Fe nanocomposite were obtained as Ms = 75 emu/g, Mr = 46 emu/g, Hc = 3.3 kOe, and (BH)max = 1.6 MGOe, indicating a much higher (BH)max than the sample with no α-Fe. FORC analysis was performed to identify exchange coupling for the Mn-Al-C-0.05α-Fe nanocomposite sample. The results of this analysis showed the presence of two soft and hard ferromagnetic components. Further, it showed that the reverse magnetization process in the composite sample containing 5 wt. % α-Fe is the domain rotation model.

1. Introduction

Magnetic nanocomposites are one of the most promising ways to achieve a new generation of permanent magnets. In the last few decades, magnetic nanocomposites have attracted a lot of attention due to their high coercivity and improved remanence on a single domain scale. So far, Nd2Fe14B/α-Fe, SmCo/α-Fe, etc., alloys have been extensively studied due to their high coercivity [1,2,3,4,5,6].
In the early 1990s, Kneller and Hawig [7], and subsequently Skomski and Coey [8], re-examined the experimental work of Coehoorn et al. [9,10]. They showed that at the nanoscale, the soft ferromagnetic phase (high magnetism) with the hard ferromagnet (high coercivity) can produce magnetic composite materials with a further improvement of (BH)max. In this case, interphase magnetic exchange coupling is created in a composite system that takes advantage of the best characteristics of the constructive phases. Hard magnetic phases provide high anisotropy with high coercivity field, whereas soft magnetic phases provide high saturation.
The use of low-cost and plentiful elements is effective in reducing the cost of magnet production, which is very important for the development of permanent magnets in some applications. However, their magnetic properties are still much lower than those of Nd2Fe14B magnets. L10MnAlC-(α-Fe) nanocomposite is one of the promising systems without rare earth elements that may be a good candidate for spring exchange magnet [11,12]. Mn-Al-C alloys have large exchange lengths and wide domain walls [13,14].
Therefore, it is important to find a way to increase the coercivity and remanence and to understand the mechanisms of reverse magnetization in the Mn-Al-C-(α-Fe) nanocomposite. There are numerous reports of increased coercivity by milling MnAl and MnAlC alloys fabricated by different methods [15,16,17,18,19,20].
Mechanical milling increases coercivity by decreasing grain size and increasing defects, but often the saturation magnetism and remanence decrease due to phase decomposition, formation of defects, and reduction in chemical order. However, using annealing, its magnetism can be restored due to an increased chemical order and reduced defects [21,22,23,24].
Studies that report on the reverse magnetization behavior of Mn-Al-C-(α-Fe) nanocomposites prepared by mechanical milling are very limited [14,22,25]. According to reports, the (BH)max of Mn-Al-C systems is typically below 1MGOe.
In this paper, we report the effect of Fe addition on the magnetic properties and reverse magnetization behavior of Mn-Al-C-(α-Fe) alloy composites prepared by mechanical milling method using FORC analysis. To the best of our knowledge, no studies on FORC analysis of Mn-Al alloys have been published. We were able to obtain a high (BH)max (1.6 MGOe) and thus take an important step in improving the magnetic properties of hard magnets without rare earth elements.

2. Experimental

2.1. Materials and Instrumentation

In this study, the impact of adding different amounts of α-Fe on the magnetic properties and demagnetization (reverse magnetization) behavior of Mn-Al-C nanostructured bulk magnets was investigated. For this purpose, α-Fe powders (purchased from US Research Nanomaterials, Inc., Houston, TX, USA) with a particle size of 35–45 nm were used. Further, a cyclohexane medium was used for experiments to prevent oxidation.
The actual composition of the cast alloys was determined by inductivity coupled plasma-optical emission spectroscopy (ICP-OES, Varian 730-ES, Palo Alto, Santa Clara, CA, USA) and the amount of carbon was measured using the LECO CS-244 carbon determinator (ASTM E1019). A high-energy planetary ball mill (Fritsch Pulverisette, model 6) with hardened chrome steel balls was used to grind the cast ingots. The phase analysis of the final nanocomposite samples was investigated using an x-ray diffractometer (XRD, Rigaku-Dmax 2500, Rigaku Corporation, Tokyo, Japan) with Cu-Kα radiation (λ = 1.54 A ˙ ) and 2θ range from 10° to 100°. Reverse magnetization behavior and FORC analysis of composite alloys were investigated by a vibrating sample magnetometer (VSM, Meghnatis Daghigh Kavir Co.; Kashan Kavir; Iran) at room temperature with maximum applied field of 15 kOe.

2.2. Mn52Al45.7C2.3 Nano Powder Fabrication

The alloy with nominal composition Mn52Al45.7C2.3 (at. %) was prepared by a vacuum induction melting process and was cast into a copper mold. Before the melting, due to the high vapor pressure of Mn, an extra 3 wt. % Mn was added. The re-melting process was performed twice under a controlled atmosphere (Ar) to ensure the homogeneity of the cast alloy and also to adjust the composition of the main alloy. Then, the resultant ingot was homogenized in a vacuum furnace (P = 1 ∗ 10−4 Torr) at 1000 °C for 5 h. Afterward, it was cooled in air to obtain the ferromagnetic τ phase. Finally, Mn52Al45.7C2.3 ingot was milled by high-energy planetary milling in a hardened-steel chamber (volume 100 cc) and ball size 5 mm in cyclohexane medium as a surfactant with a ball-to-powder weight ratio of 20:1 for 5 h. The Mn52Al45.7C2.3 nano powder with an average particle size of 100 nm was obtained (see Supplementary Materials, Figure S1).

2.3. Processing of Nanostructured Bulk Magnets

Mn52Al45.7C2.3 nano powders were mixed with different weight ratios of α-Fe powder (0–20 wt. %). The mixture was mechanically milled in a cyclohexane medium for 1 h to obtain a completely homogeneous composite powder. The composite powder was placed in a tungsten carbide mold with a diameter of 5 mm and pressed under a constant uniaxial pressure of 5.1 GPa. Afterward, the obtained bulk sample was annealed in a vacuum tube furnace at 400 °C for 30 min in order to achieve optimal magnetic properties. The samples with different weight percentages of α-Fe NPs are listed in Table 1.

3. Results and Discussions

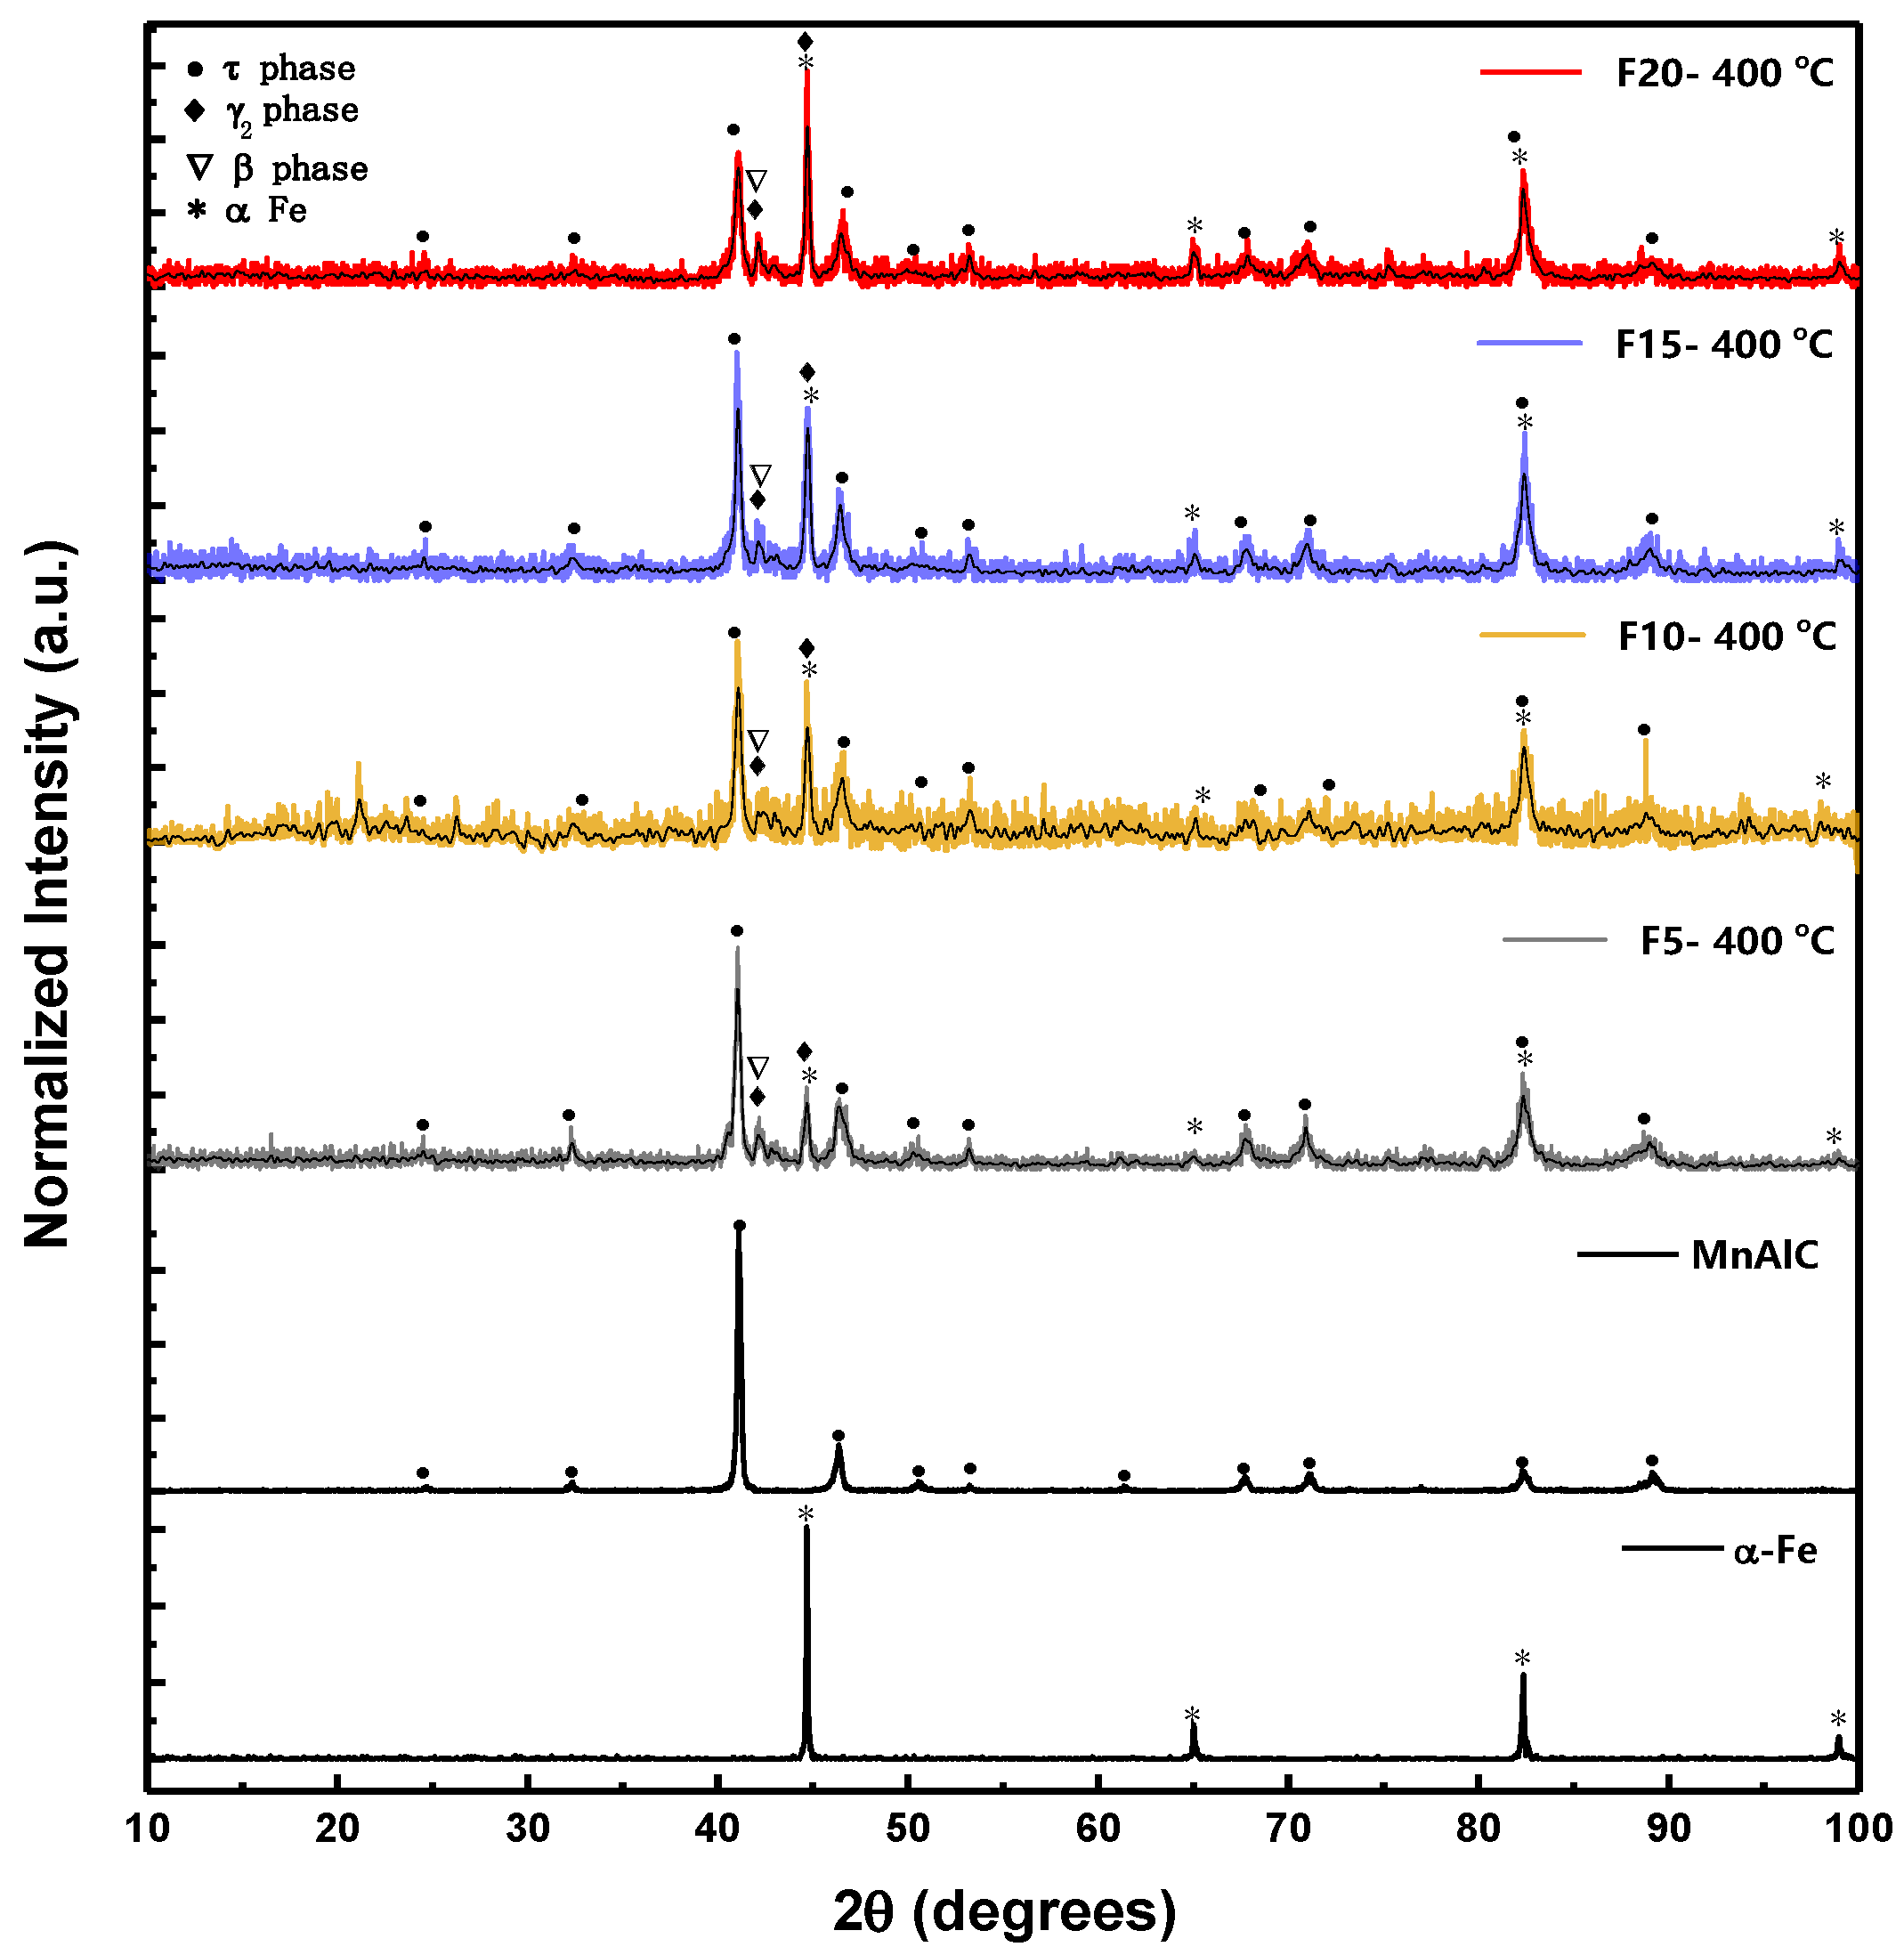
3.1. Structural Analysis

The XRD patterns of Mn-Al-C alloy and Fe NPs as well as Mn-Al-C-(X wt. % α-Fe) magnetic composite NPs with X = 0 to X = 20 are shown in Figure 1. The Mn-Al-C alloy is homogenized at 1000 °C for 5 h and then cooled in the air to room temperature. The pure τ phase was identified according to the diffraction pattern of this alloy. The XRD pattern of Mn-Al-C and α-Fe NPs is in good agreement with the JCPDS card no. 00-037-1073 and 00-006-0696, respectively.
It can be seen that all XRD patterns of magnetic composite samples show a hard magnetic phase (L10 tetragonal P4/mmm space group (#123)) and a soft magnetic phase of α-Fe (space group Im-3m (229)). The τ-MnAlC phases are metastable and after two millings, some low intensity peaks with non-magnetic phases of β-Mn3Al2 (cubic space group p4132 (213), JCPDS card no. 00-048-1568) and γ2-Al8Mn5 (rhombohedral space group R3m (160), JCPDS card no. 00-032-0021) were observed. Further, in the XRD pattern of composite NPs, the peak 2θ = 44.67° corresponding to the plane (1 1 0) of the BCC phase has increased with increasing α-Fe concentration.
Moreso, the addition of α-Fe NPs had no effect on the phase structure in these alloys and no mechanical alloying occurred.

3.2. Magnetic Properties

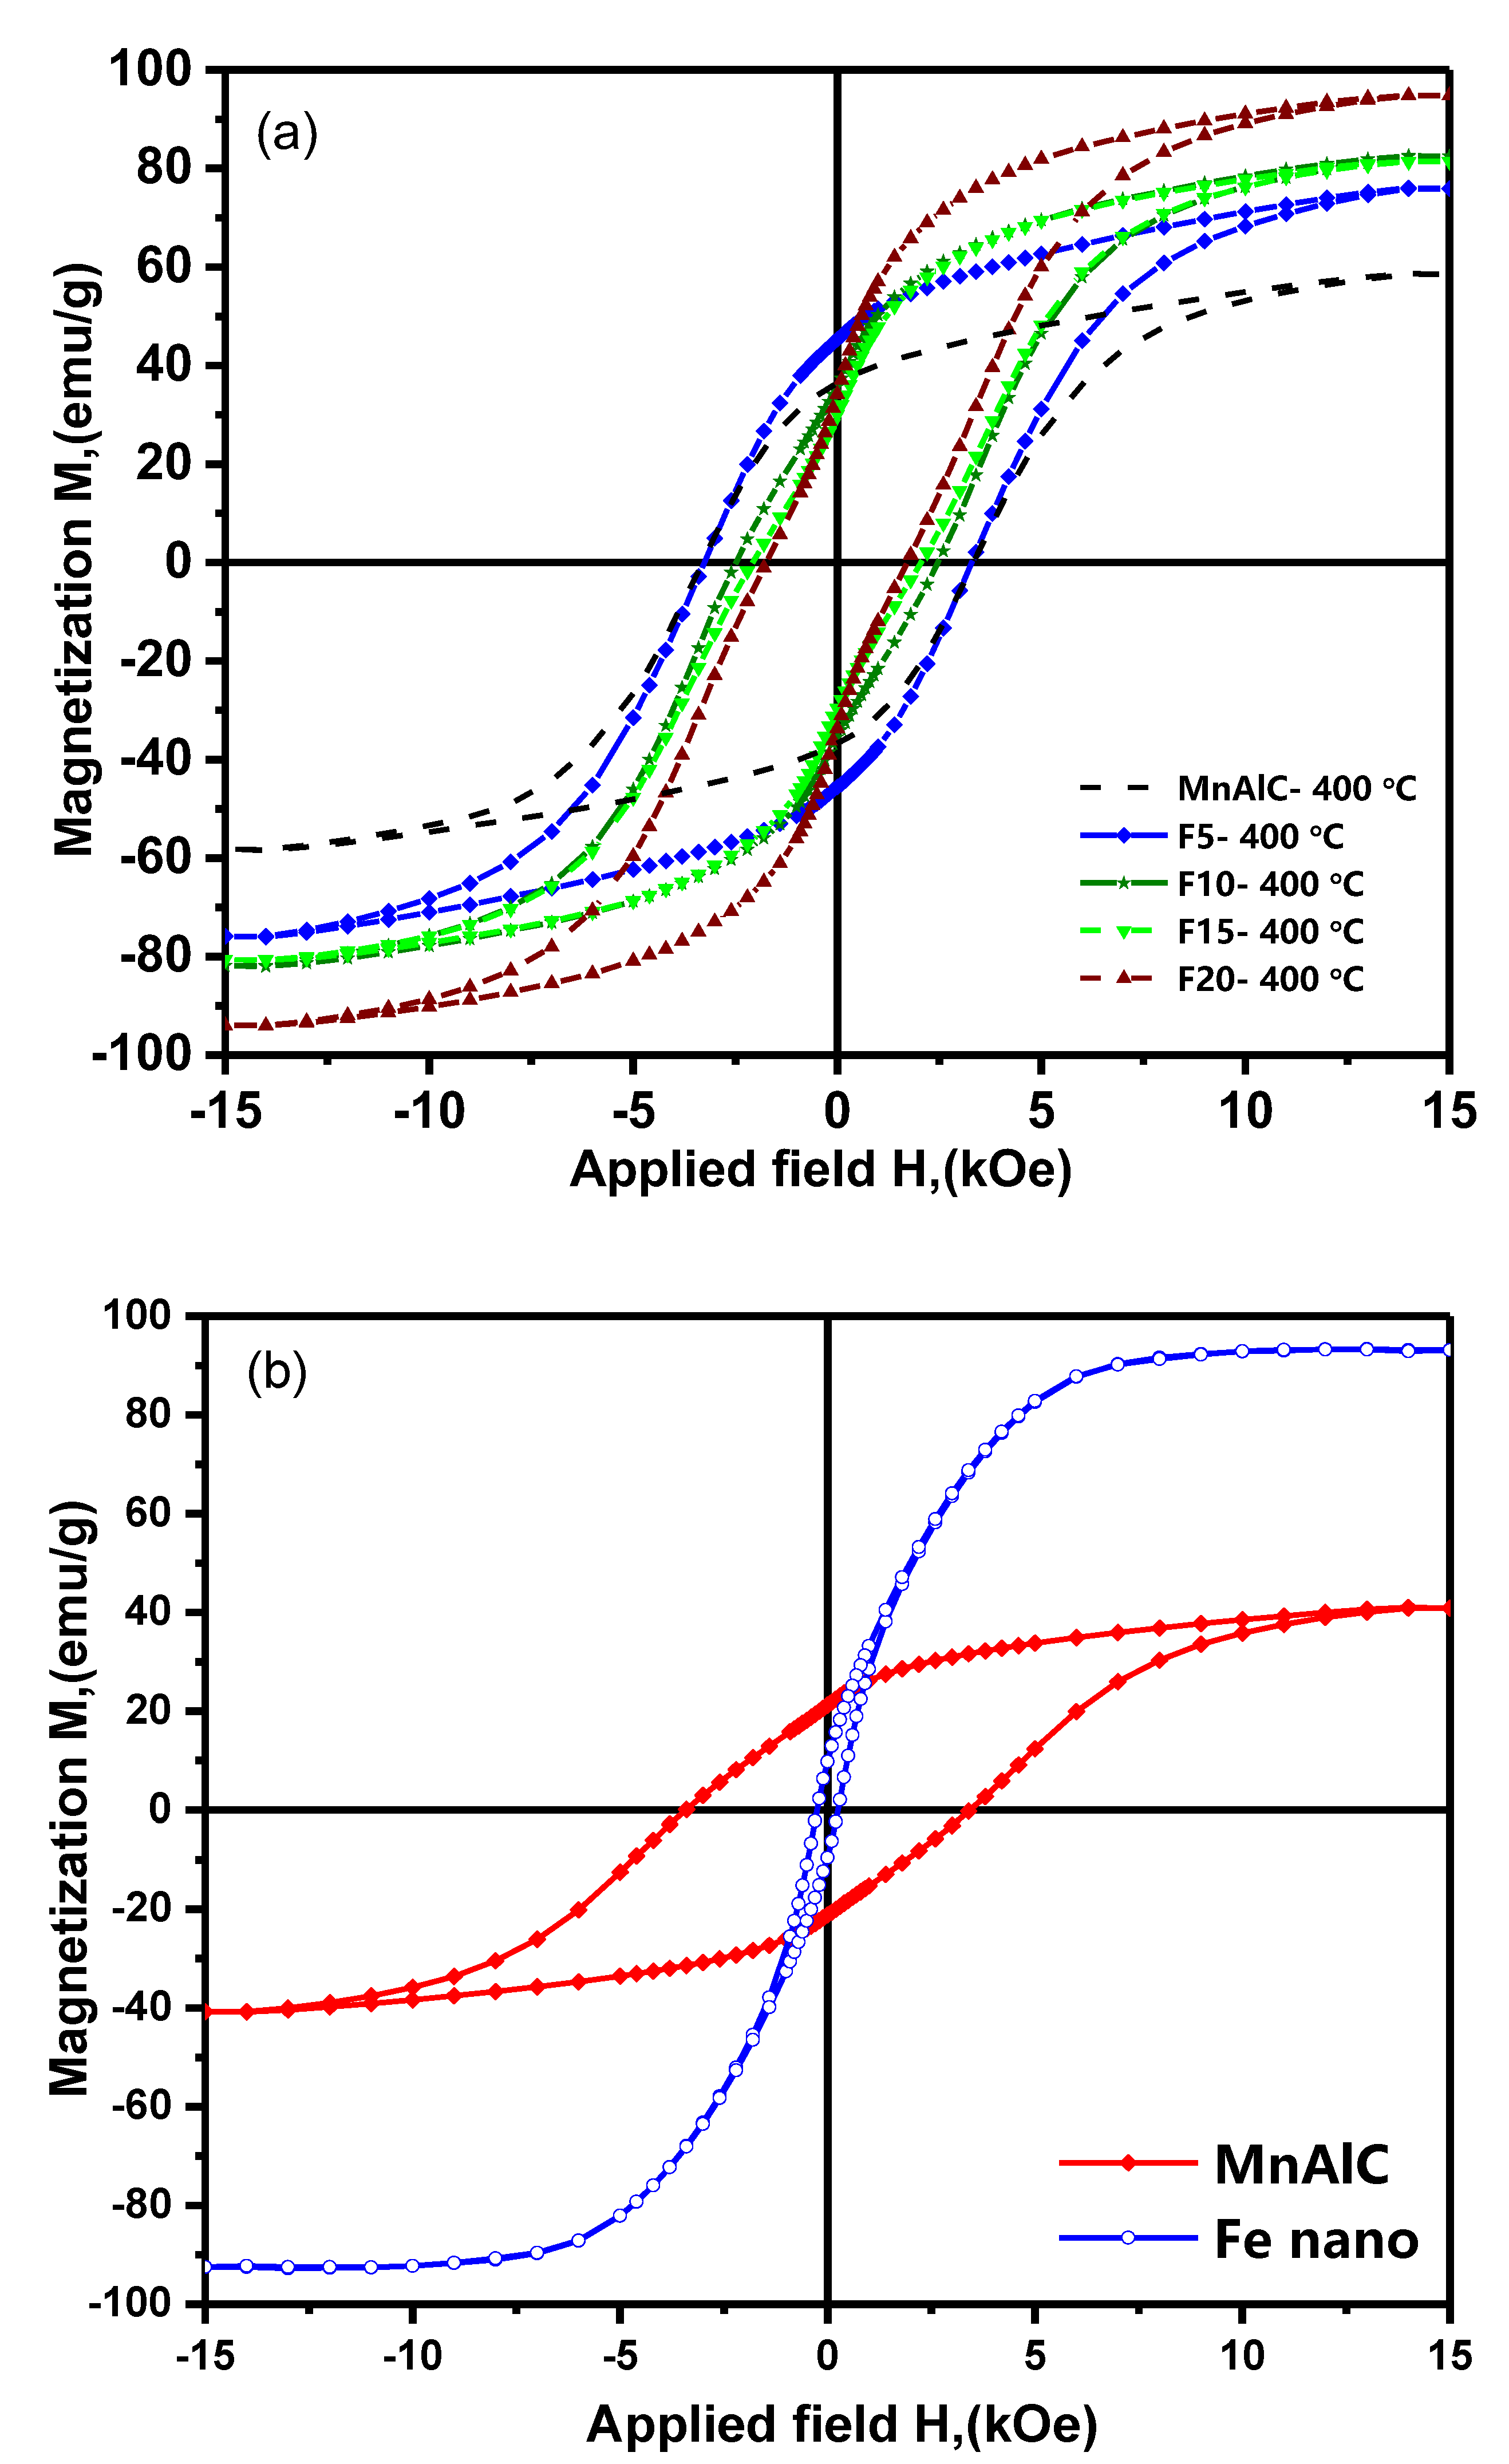
3.2.1. Hysteresis Loops Investigation

Magnetic measurements were performed at room temperature by VSM with a magnetic field of 15 kOe. Figure 2 shows the hysteresis loops of ferromagnetic Mn-Al-C alloy, Mn-Al-C-α-Fe nanocomposite alloys with 5–20 wt.% α-Fe (annealed at 400 °C for 30 min), and α-Fe.
According to Figure 2, the M(H) demagnetization curve of the F5 sample in the second quarter, between Mr and M = 0, is convex similar to that of the Mn-Al-C single-phase permanent magnet. This indicates that the demagnetization curve of the Mn-Al-C-0.05α-Fe alloy has a single hard magnetic behavior. It means the hard magnetic phase is uniformly under the reversed external magnetic field and indicates the hard and soft magnetic phases have good exchange coupling.
However, for samples F10, F15, and F20 the demagnetization curve is concave. In both hard and soft magnetic nanocomposites, a constricted loop is obtained if there is no exchange coupling. In this case, a kink is created in the curve [7].
According to Figure 2, it can be inferred that the optimal magnetic properties belong to the sample containing 5 wt.% α-Fe, because in this sample there is the highest increase in remanence magnetization compared to the sample without α-Fe. In addition, the maximum energy product is (BH)max = 1.6 MGOe, which is an increase of 60% compared to the Mn-Al-C sample. Increasing the saturation magnetization (Ms), the remanence magnetization (Mr), and the squareness (Mr/Ms), and thus the increase in (BH)max for 5 wt% α-Fe sample compared to the sample without α-Fe can be due to the uniform distribution of soft and hard phases, and the uniform NPs size of Mn-Al-C and α-Fe phases. It can also be a sign of a strong exchange coupling effect. The obtained magnetic properties for Mn-Al-C-(0.05α-Fe) alloy are more improved properties compared to the properties reported in the literature. A comprehensive comparison of the properties reported on the Mn-Al alloy with the present work is also given in Table 2. Since there is an exchange coupling between the hard phase and the soft phase, crystallographic coherency between the two phases is required. This means that the easy magnetization axis directions in the hard and soft phases are parallel. Therefore, the remanence magnetization for the soft phase (Mrs) and for the hard phase (Mrh) are aligned [7,26,27].
One of the reasons for the increase in squareness Mr/Ms is the existence of exchange couplings between particles. Based on the model proposed by Kneller [7], exchange coupling of soft phase (with cubic structure) and hard phase (with tetragonal/hexagonal structure) in polycrystalline samples containing independent magnetic grains with random magnetic orientation occurs when the easy magnetization axis directions in the soft and hard phases are perfectly aligned, and in this case the relative residual is reported to be mr = Mr/Ms ≥ 0.68. According to our results, its value for F5 sample is 0.61, which indicates that the easy magnetization axis direction in many soft phases is aligned with the easy direction in hard phases. For other samples containing more than 5 wt. % α-Fe, this value is much less than 0.5. The decrease in Mr and Hc is due to the increase in the soft phase; and due to the occurrence of soft/hard biphases, it is clearly visible in the hysteresis loops of Figure 2 in the form of kinks. This low value of squareness can be attributed to the high content of soft phase NPs in the composite and possibly the agglomeration of soft phase particles, which prevents the exchange coupling with the hard phase and increases the magnetostatic interaction, thus weakening the exchange interactions. According to Coey’s theory of magnetic exchange couplings [8], the size of soft phase should not be more than twice the wall thickness of hard phase, which is usually about a few tens of nanometers. According to the calculations of Luo et al. [13], the Mn-Al domain wall thickness was announced as 10.9 nm. Coey and Skomski [8] stated that fine particles of soft phase retain their coercivity, and as the particle size increases, the coercivity decreases by 1/D2 due to the presence of heterogeneous magnetostatic fields.
In 2013, Skomski et al. [99] performed a simulation on soft nanostructures and concluded that the presence of a soft phase in the hard phase matrix is relatively better than the hard geometry in a soft one, and embedded soft phase particles are better than sandwiched soft layers, and the nucleation field is a function of the soft phase size. The embedded soft spherical particles have the highest coercivity. For very small soft particles, the nucleation field is close to the anisotropic field of the hard phase.
According to Figure 2, by adding α-Fe, the coercivity and squareness remained constant whereas the saturation and remanence magnetization increased, and with increasing the amount of α-Fe soft phase, the values of coercivity, squareness, and remanence magnetization decreased. The saturation magnetization of the F20 sample is almost identical to the saturation magnetization of the α-Fe soft phase. Therefore, the main challenge is the uniform distribution of the soft phase in the hard phase in order to maintain Hc and achieve a high (BH)max.

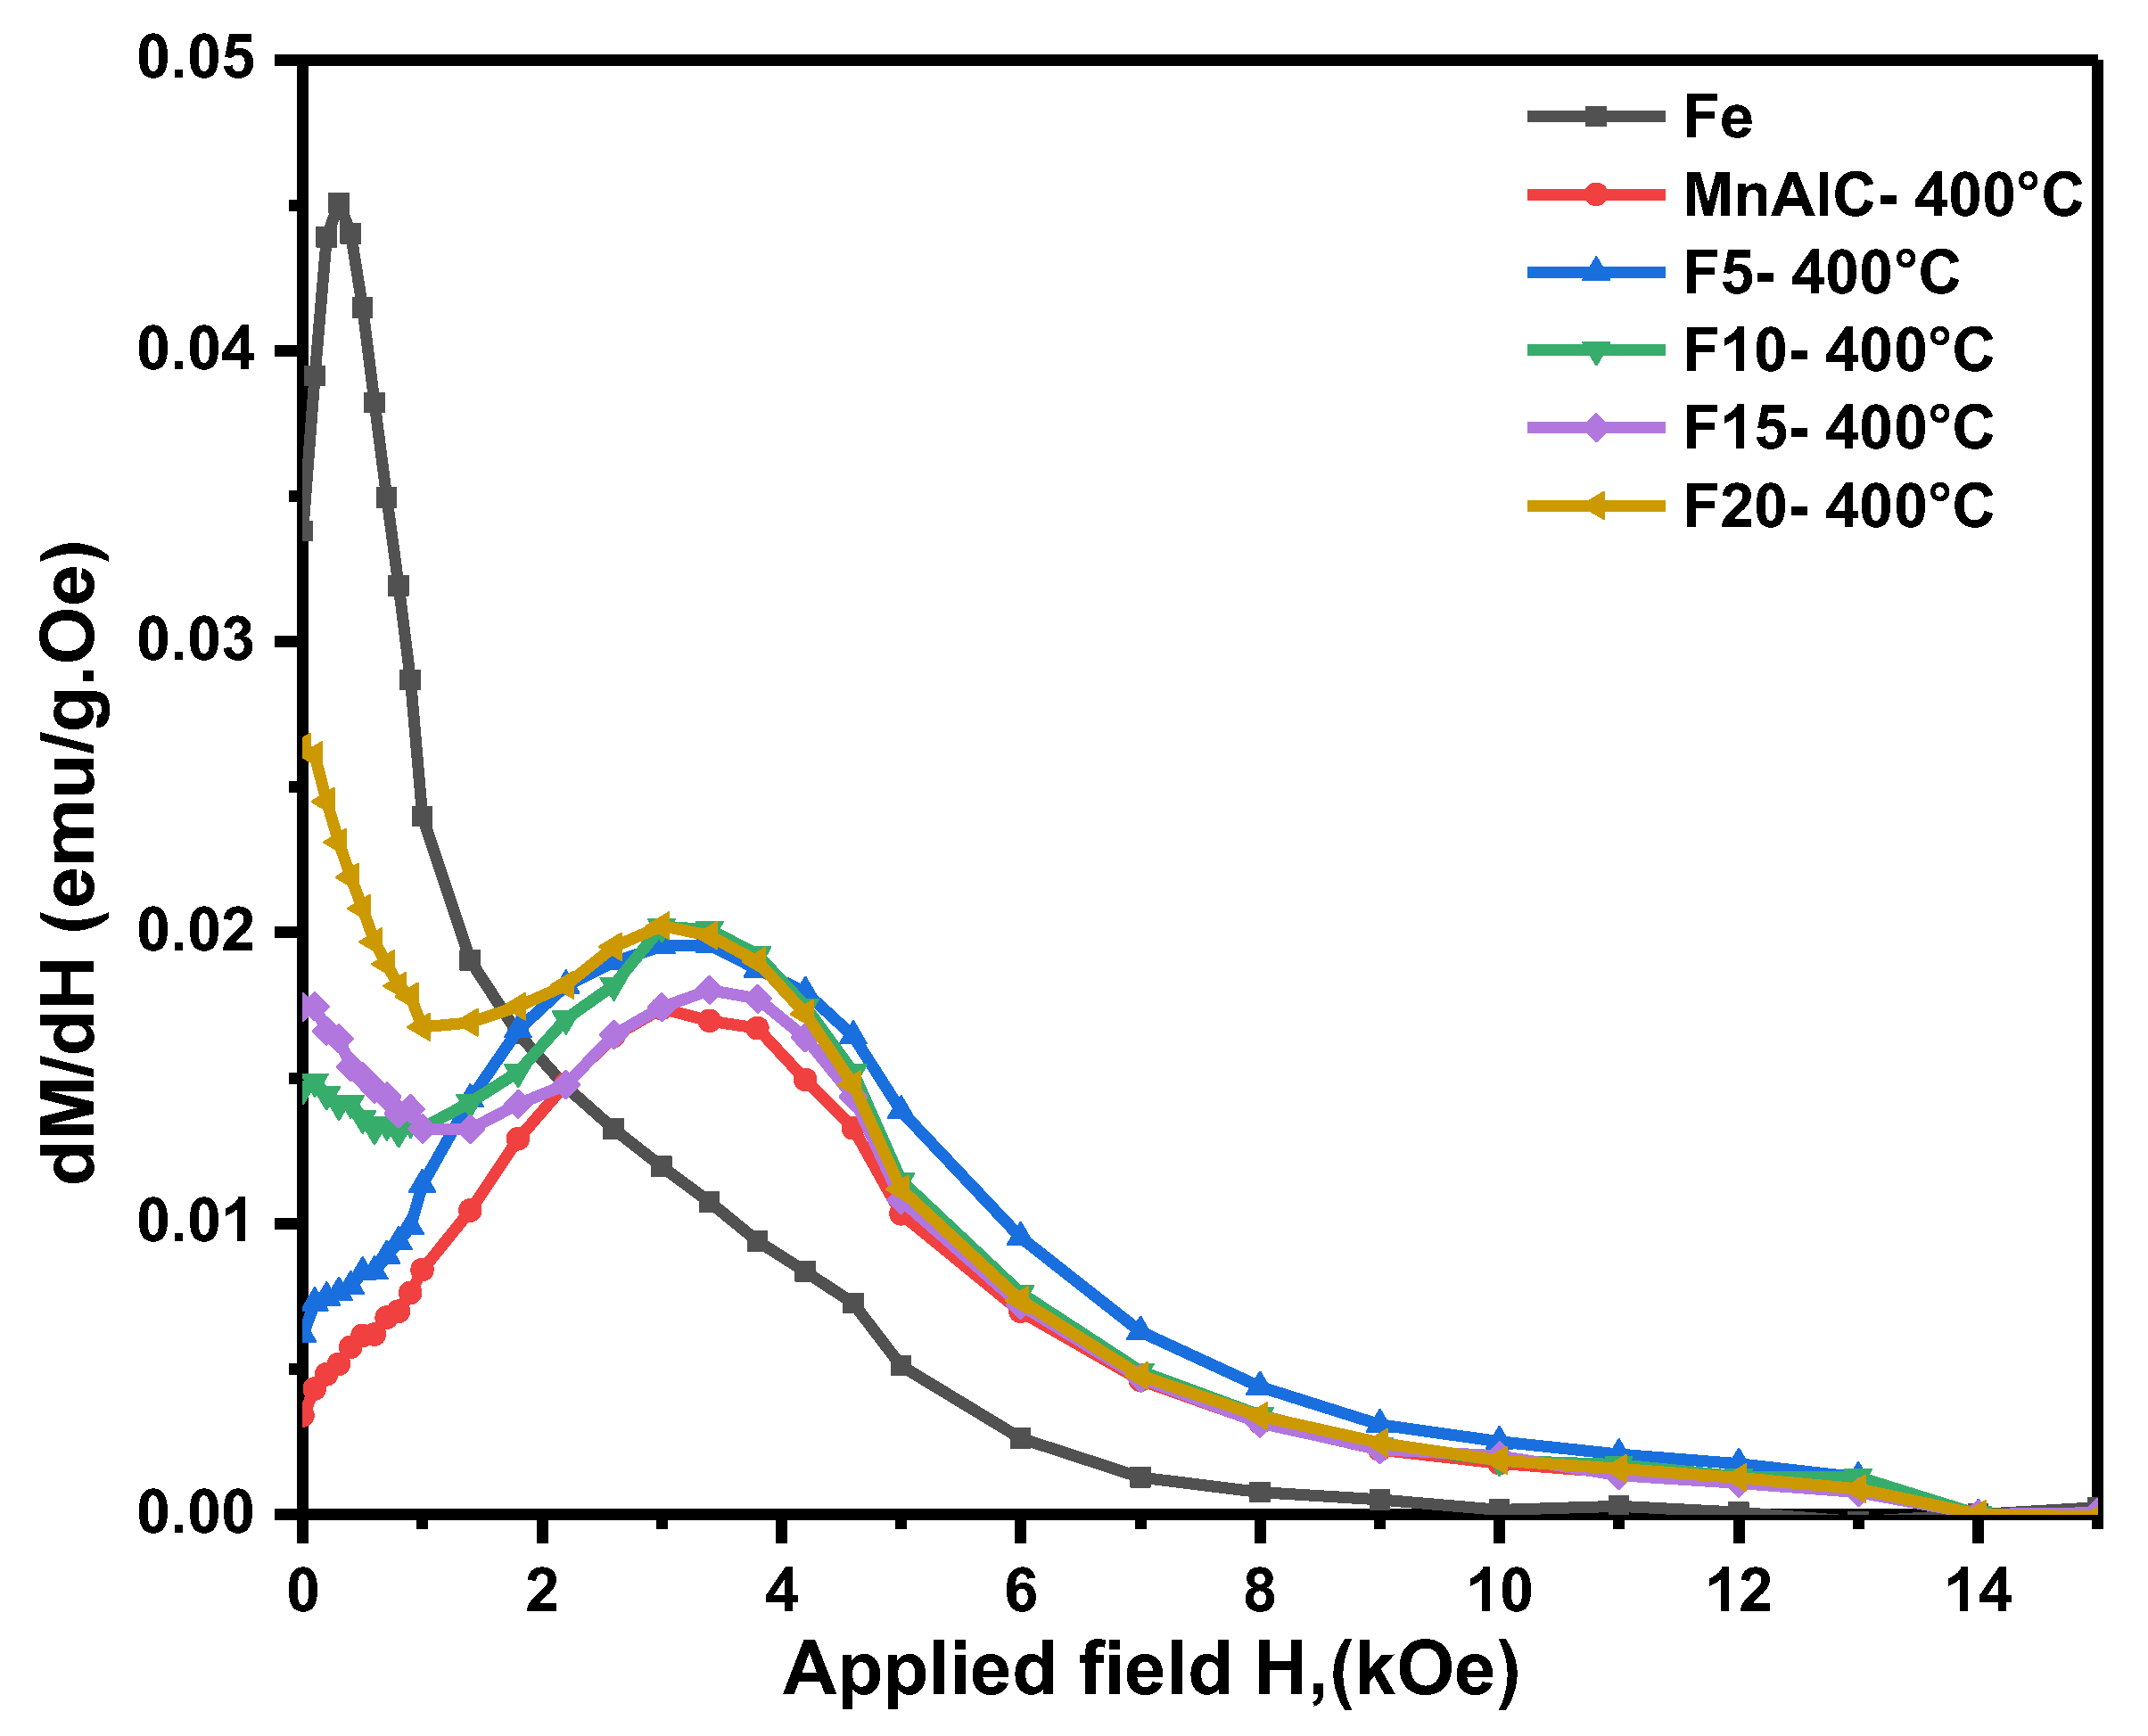
3.2.2. Switching Field Distribution Curves Investigation

Magnetic exchange coupling can be proved by a kink-free smooth hysteresis loop. The smoothness of the hysteresis loop can be evaluated by the hysteresis derivative (dM/dH) vs. H curve known as the switching field distribution curve (Figure 3). The switching field distribution is known as the phase-exchange property and indicates the particles coercivity distribution in the samples [100,101,102].
According to Figure 3, two peaks are observed for samples F10, F15, and F20 that confirm the biphase magnetic behavior. A peak appears near the zero field (H = 0), which has grown as the amount of soft magnetic phase in the nanocomposites increases. This means that the α-Fe phase is not associated with a good exchange coupling. According to Figure 3, the second peak is a wide peak that indicates the coercivity of hard magnetic NPs. The presence of a single peak for F5 composite NPs is similar to the behavior of hard magnetic single phase Mn-Al-C, indicating reverse magnetization in one stage and hard/soft phase exchange coupling. The switching field distribution curve peak of the F5 sample is located in the 3.3 kOe field, whereas this peak for the Mn-Al-C sample is in the 2.9 kOe field.
As can be seen in Figure 3, the coercivity distribution of sample F5 is wider than the Mn-Al-C (i.e., wider peak), which is a sign of weakness in exchange coupling. The peak of sample F5 extends from both sides of the lower and higher coercivity fields and is elongated. One of the main reasons for the expansion to the lower fields is the presence of a soft phase, and given that Ks < Kh, in the lower applied field it seeks to rotate. Although the hard phase acts as a barrier and prevents the rotation of the soft-phase magnetic domains in the low field, due to the size of the α-Fe soft phase NPs being larger than the critical size, some domains in the lower field have switched to the applied field.
Additionally, the presence of soft phases in the hard phase matrix reduces the antiferromagnetic coupling between the Mn–Mn pair at the interphase boundaries and leads to an increase in the coercivity of the hard NPs; hence, the switching field distribution has elongated to the higher fields. In addition, in samples F10, F15, and F20, the switching field distribution is extended to higher coercivity fields, but due to the formation of biphase magnetic particles, the coercivity in the samples has decreased.

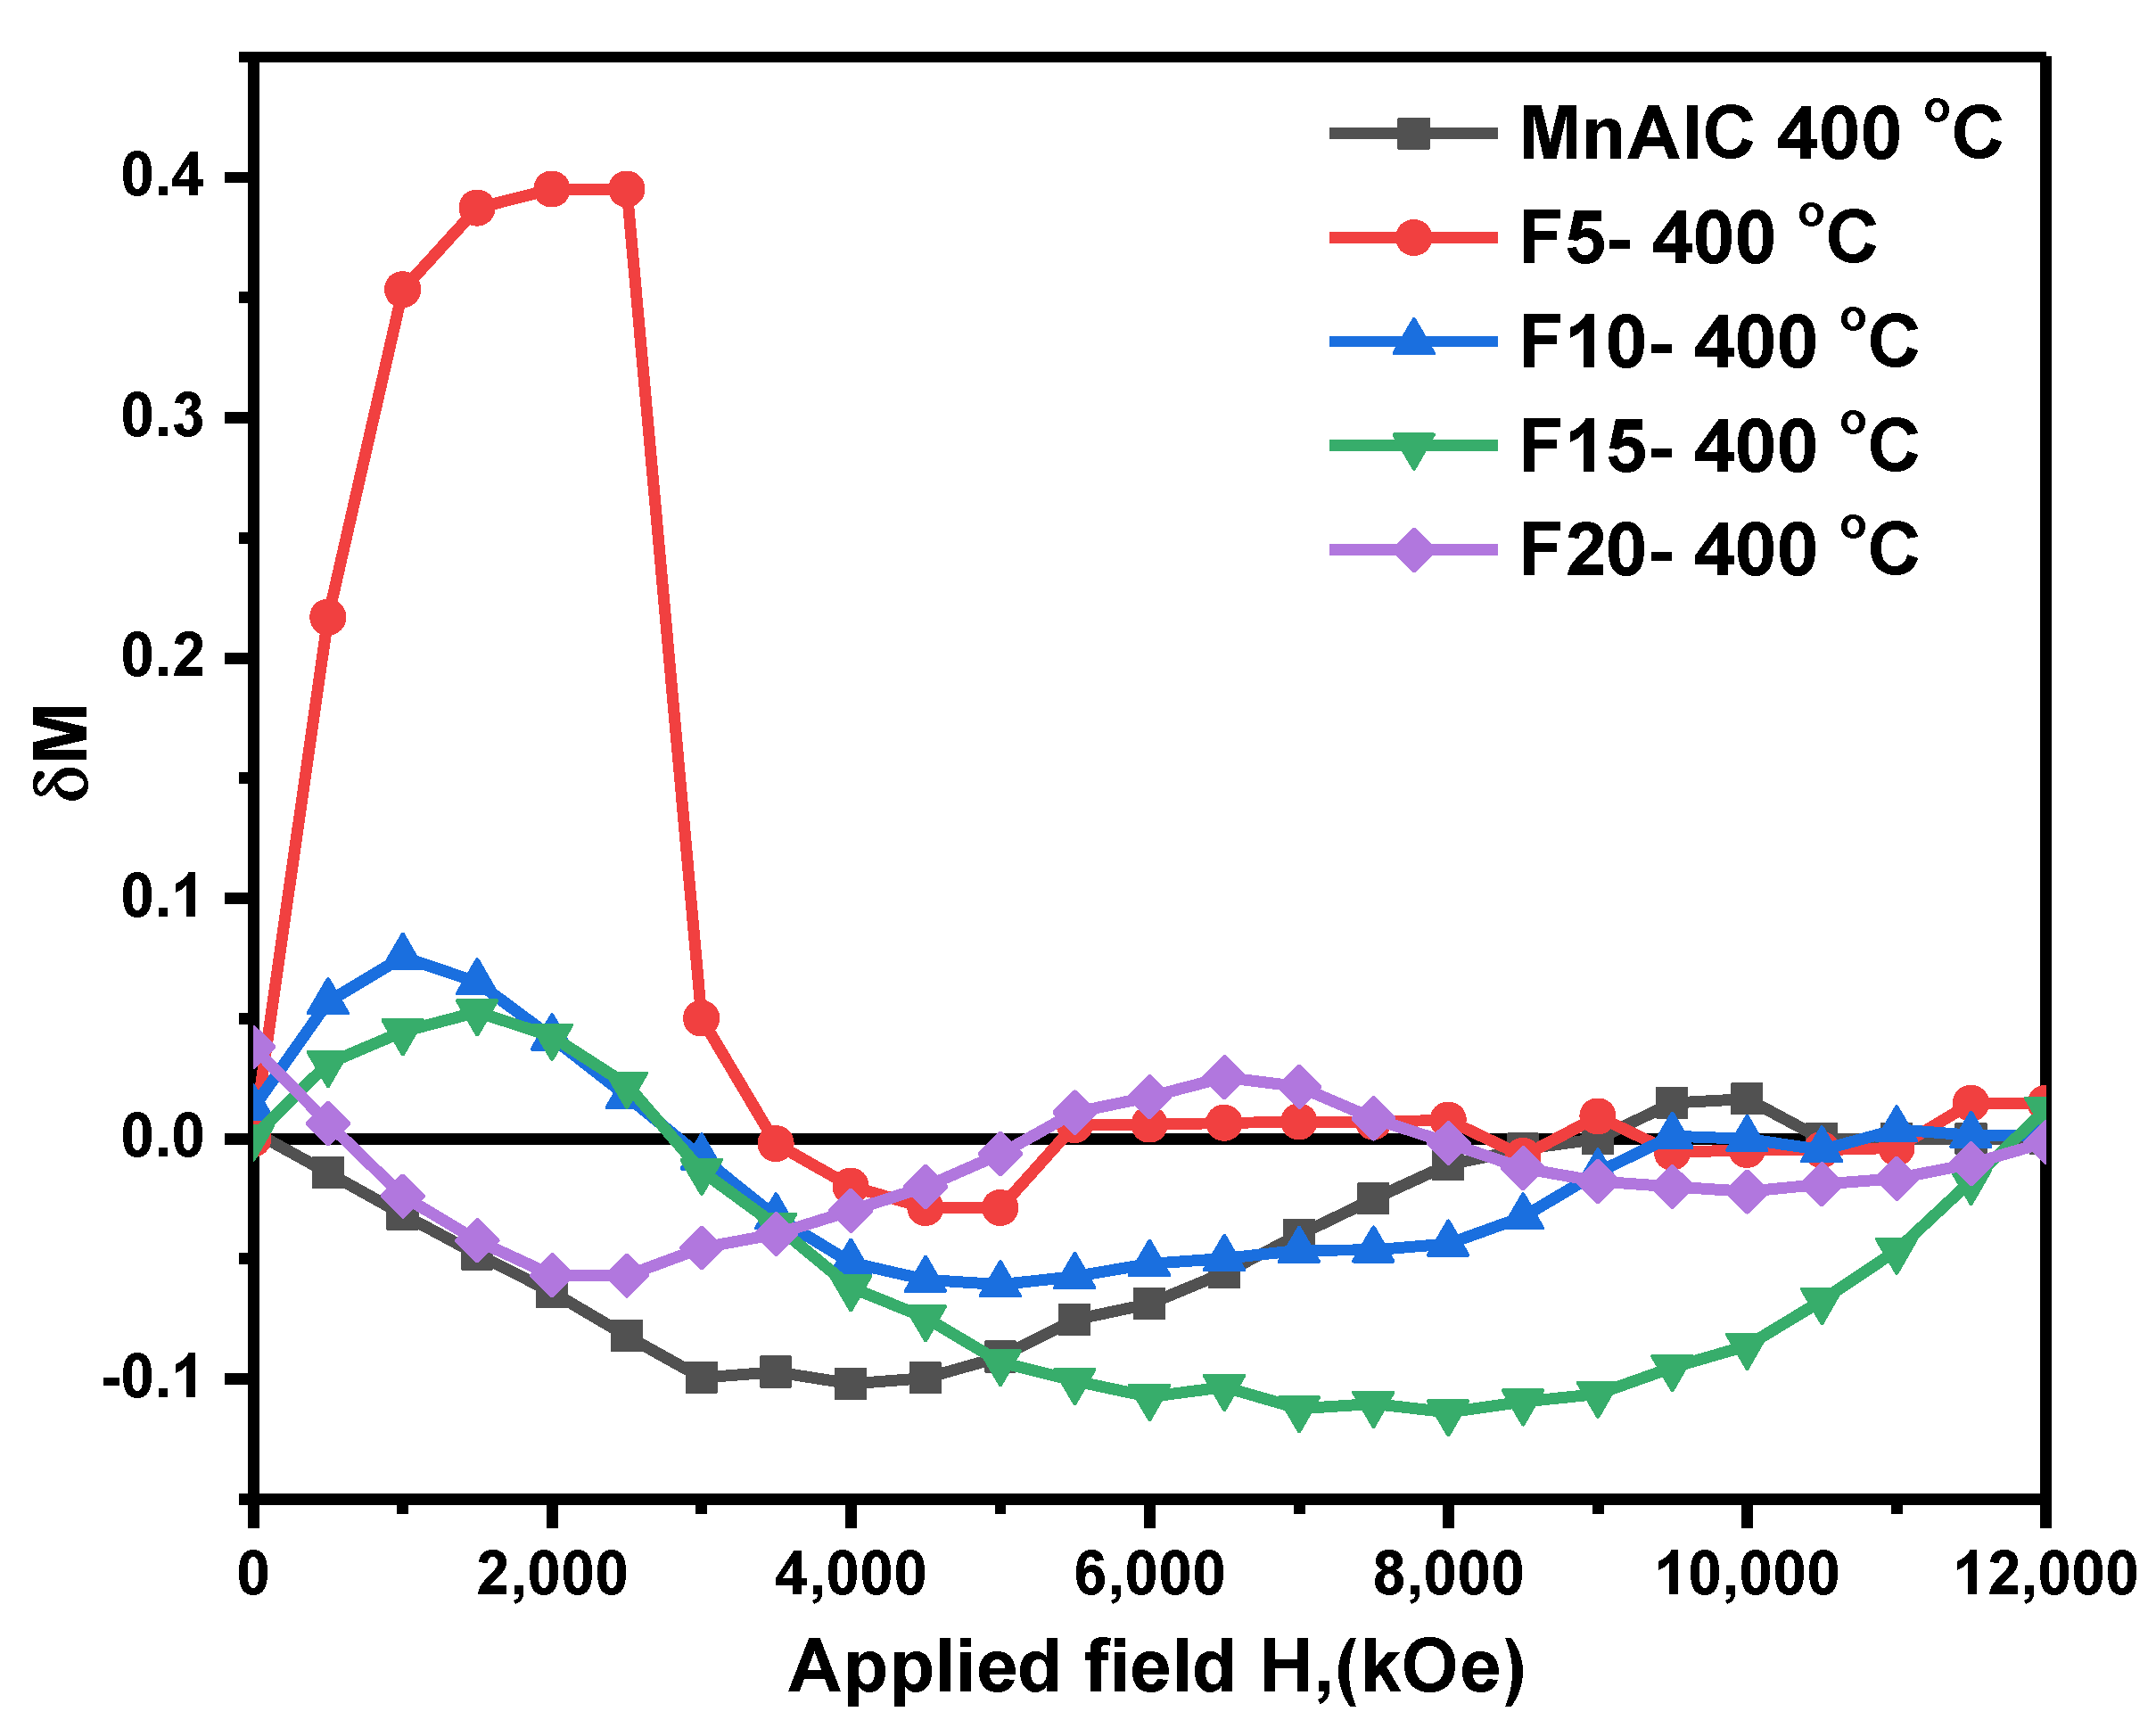
3.2.3. Henkel Plots Investigation

To study and determine the mechanism of interaction between magnetic composite NPs and to confirm the interparticle exchange coupling, the samples were investigated by the Henkel plot (δMH curve). The δMH curve provides qualitative information about the interactions of magnetic NPs with the following equation [53,103,104,105]:
δM = Md (H) − [1 − 2Mr (H)]
where Md(H) is the normalized demagnetization remanence, Mr(H) is the normalized isothermal remanent magnetization, and H is the applied magnetic field.
Mr(H) was measured by gradually increasing and removing the magnetic field (H > 0), and this was repeated until saturation magnetization (H = Hsat). Md(H) was also measured after saturation of the sample and removal of Hsat, by applying and removing a negative magnetic field (H < 0) and finally normalized by Mr(Hsat).
According to Wohlfarth’s analysis, δM > 0 indicates a ferromagnetic exchange coupling between the hard and soft phases in the system, whereas δM < 0 is due to the bipolar interactions (magnetostatic interactions).
Figure 4 shows the Henkel plots of the samples. As shown in Figure 4, for the Mn-Al-C sample, δM is negative, indicating the predomination of interparticle magnetostatic interactions and no magnetic exchange coupling in the sample. In the F5 curve, there is a peak in the positive region of δM, which indicates the dominance of exchange coupling interactions. A slight negative peak can also be seen in the 3.5 kOe–5.5 kOe field, indicating a weak magnetostatic interaction in the sample, which has caused the switching field distribution to expand. With an increasing soft phase, the negative δM peak becomes more pronounced and the positive peak height decreases, which indicates a decrease in magnetic exchange coupling and the predominance of strong interparticle magnetostatic interactions, leading to the destruction of magnetic properties. The maximum positive peak height of δM is for the F5 sample, which confirms that the strongest interparticle exchange coupling is obtained for this sample, leading to optimal magnetic properties.

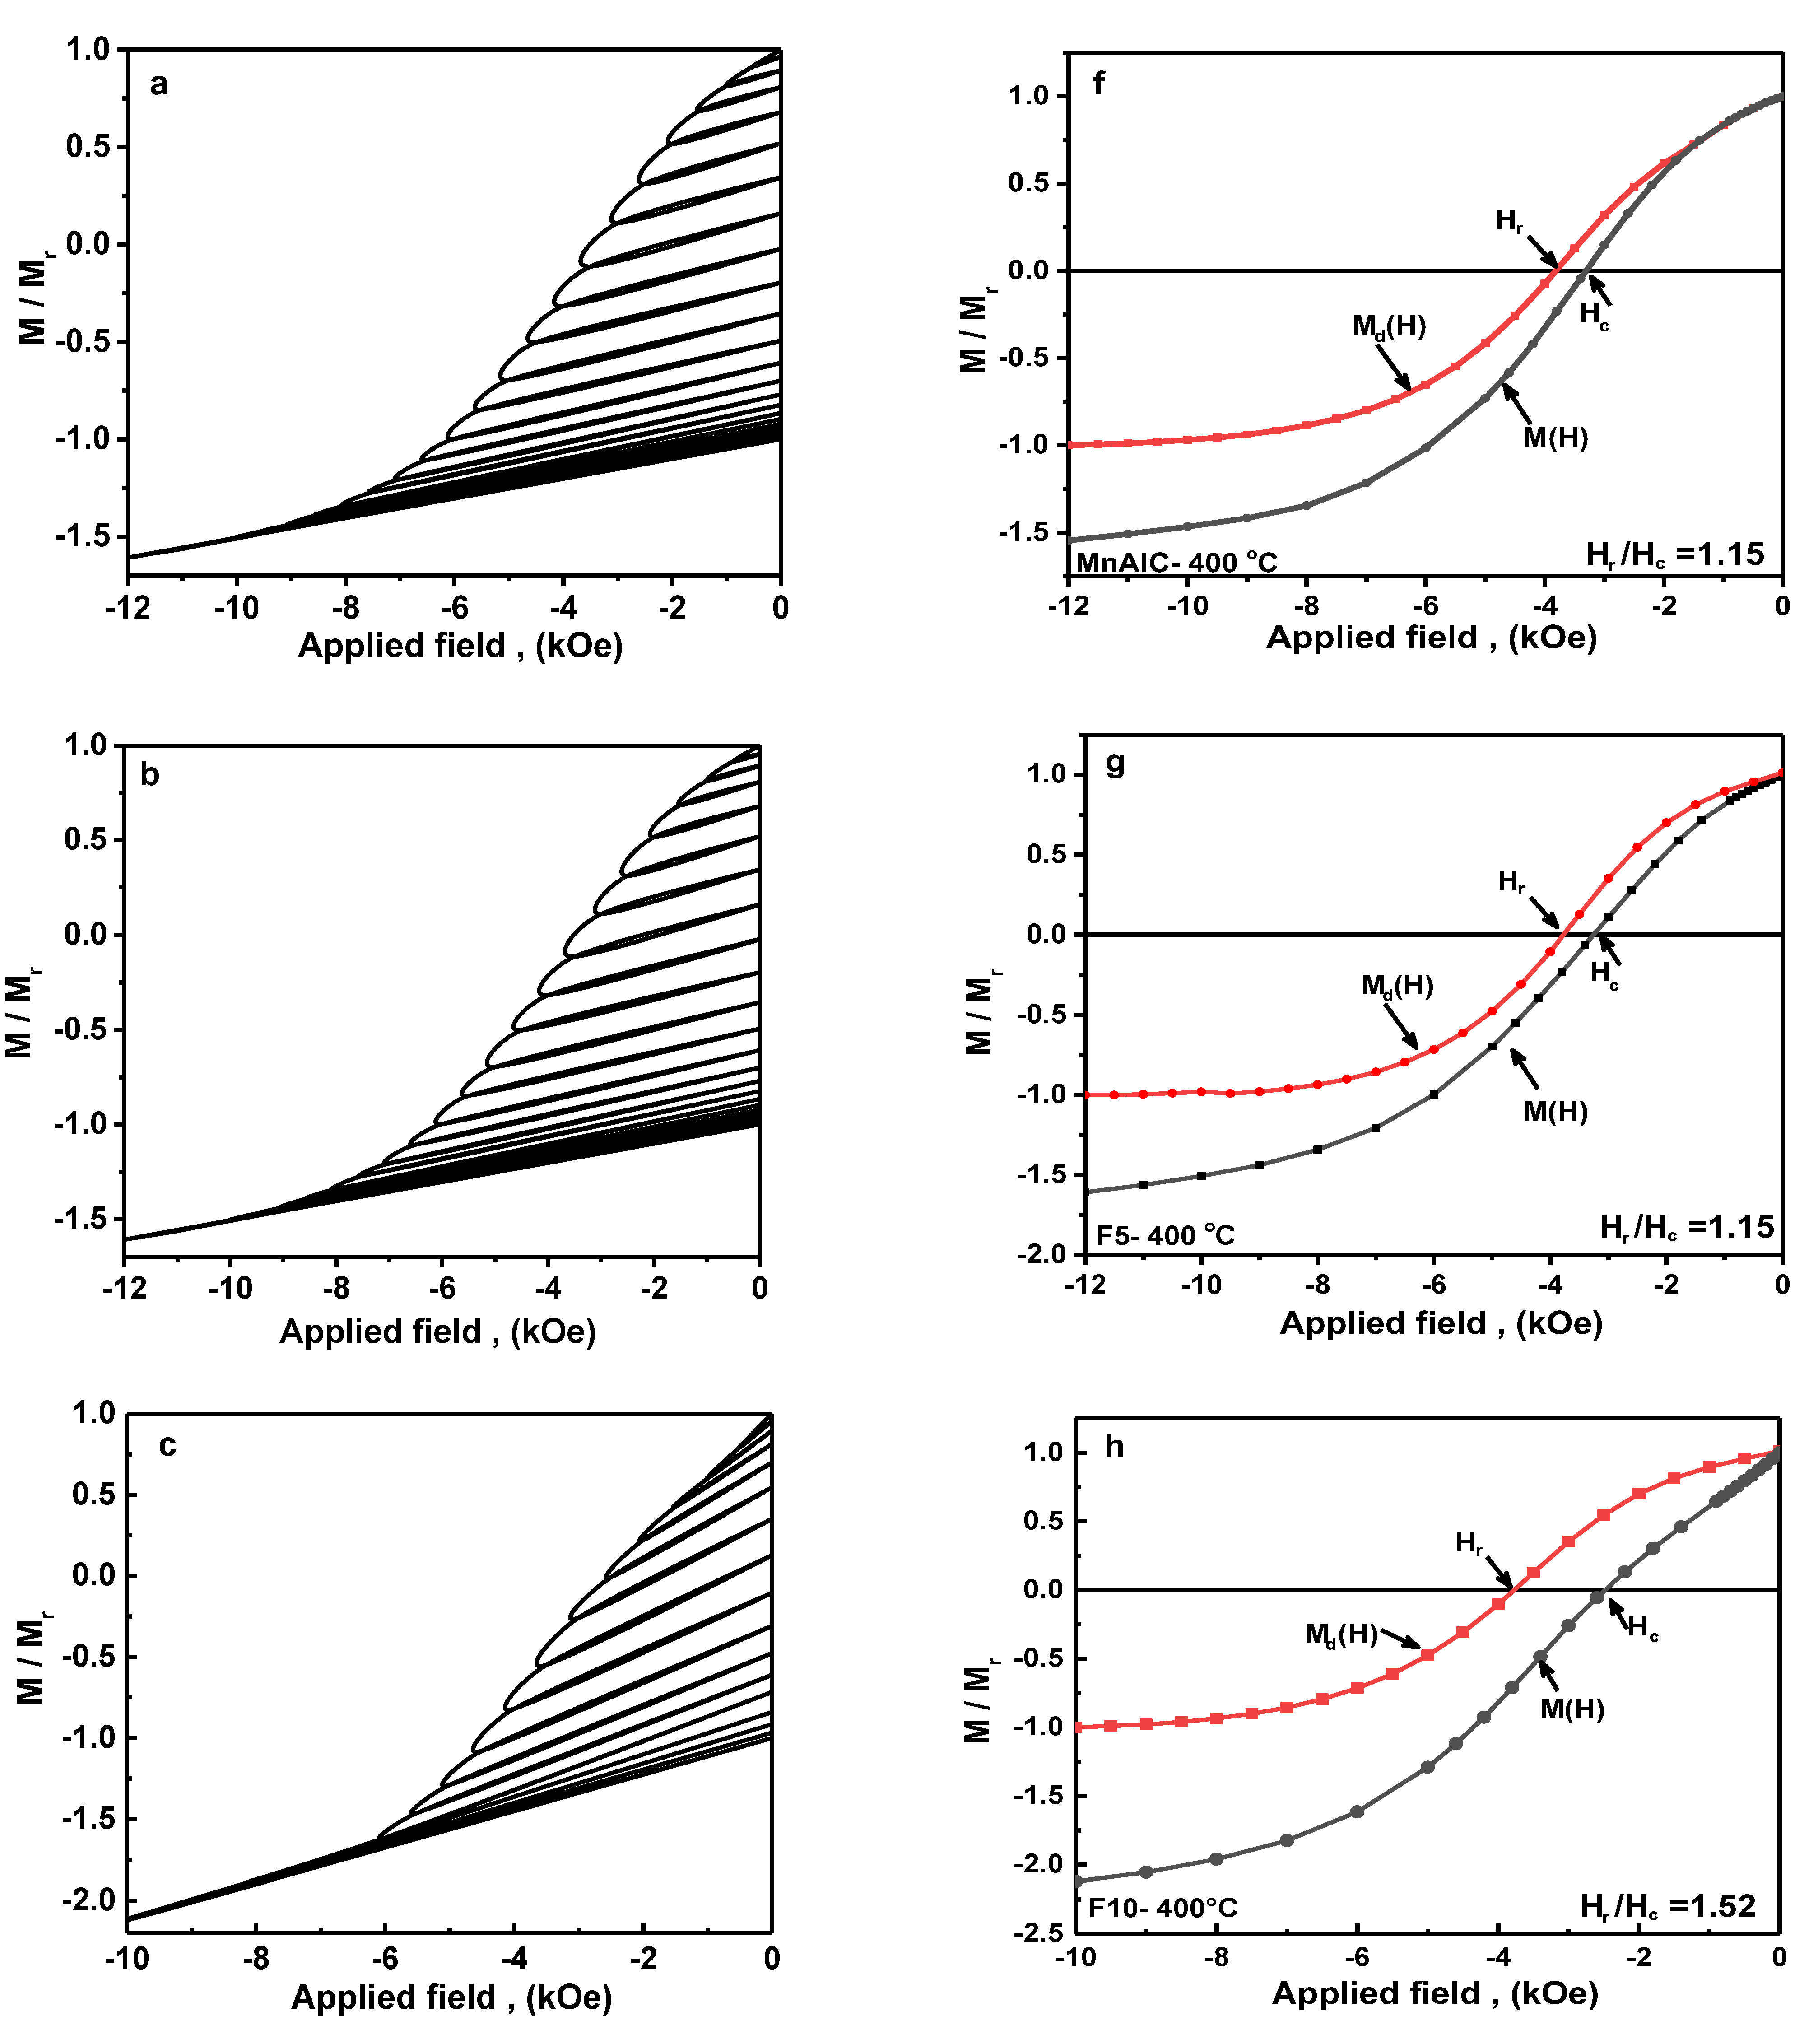
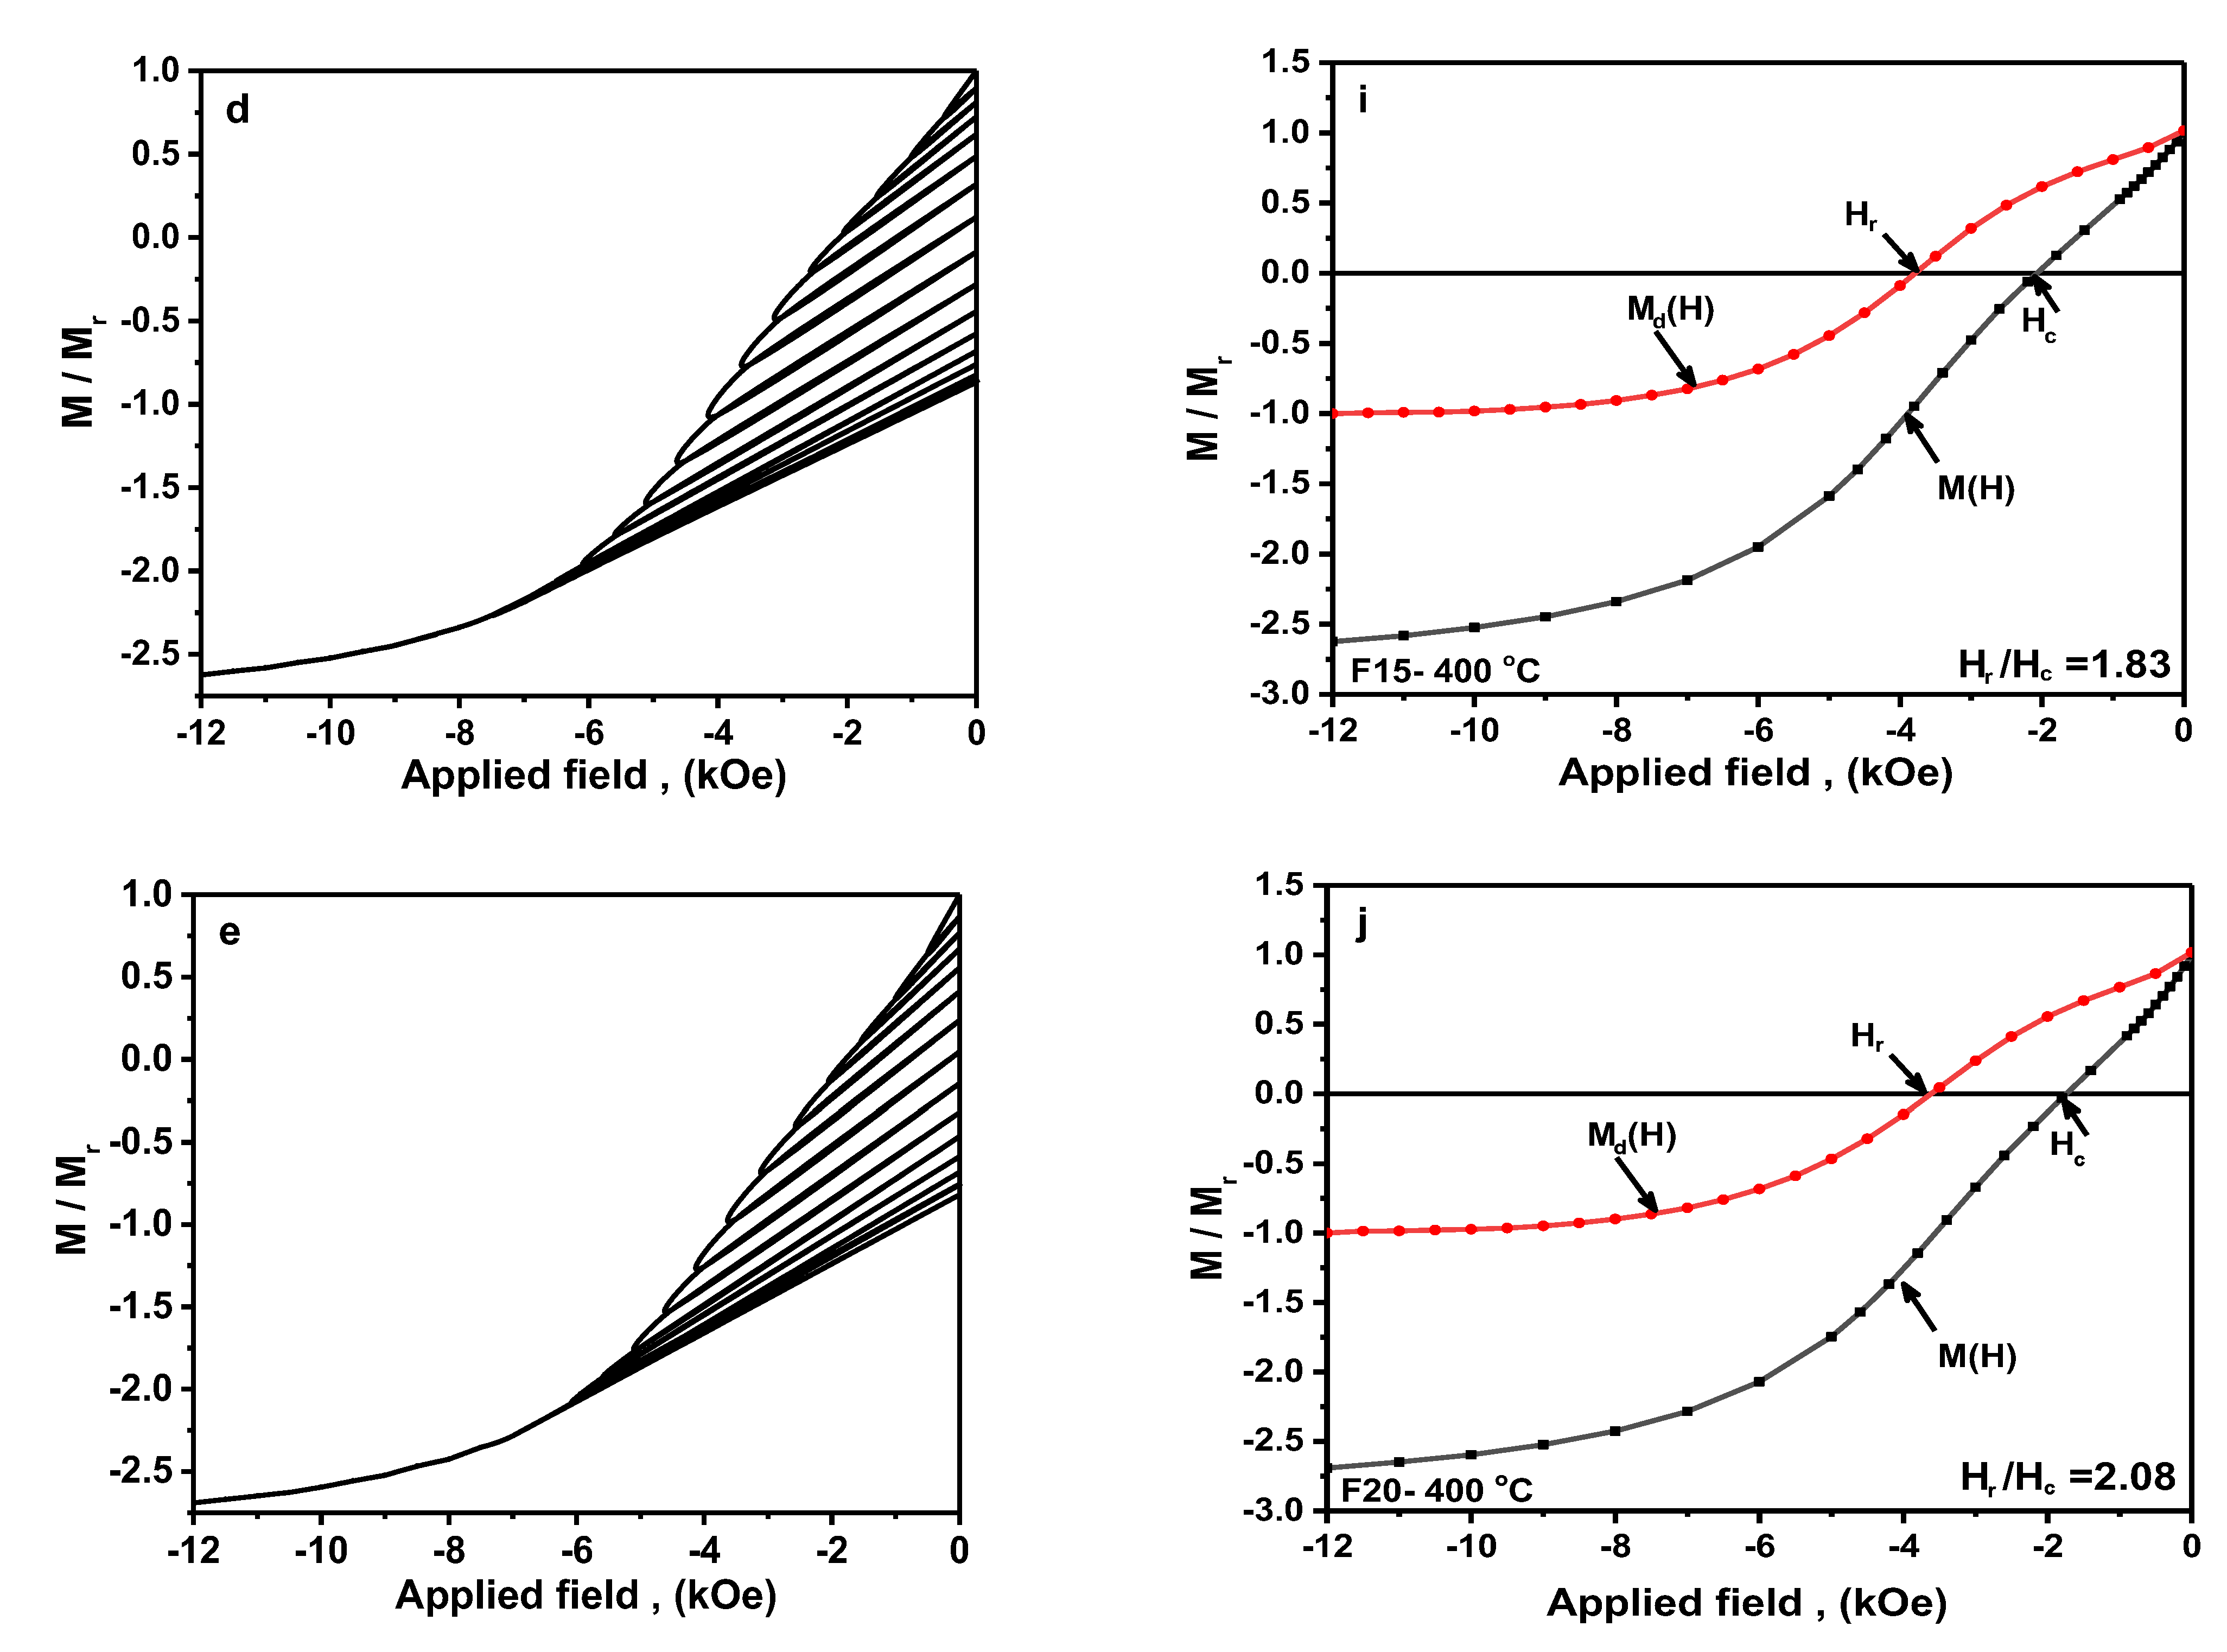
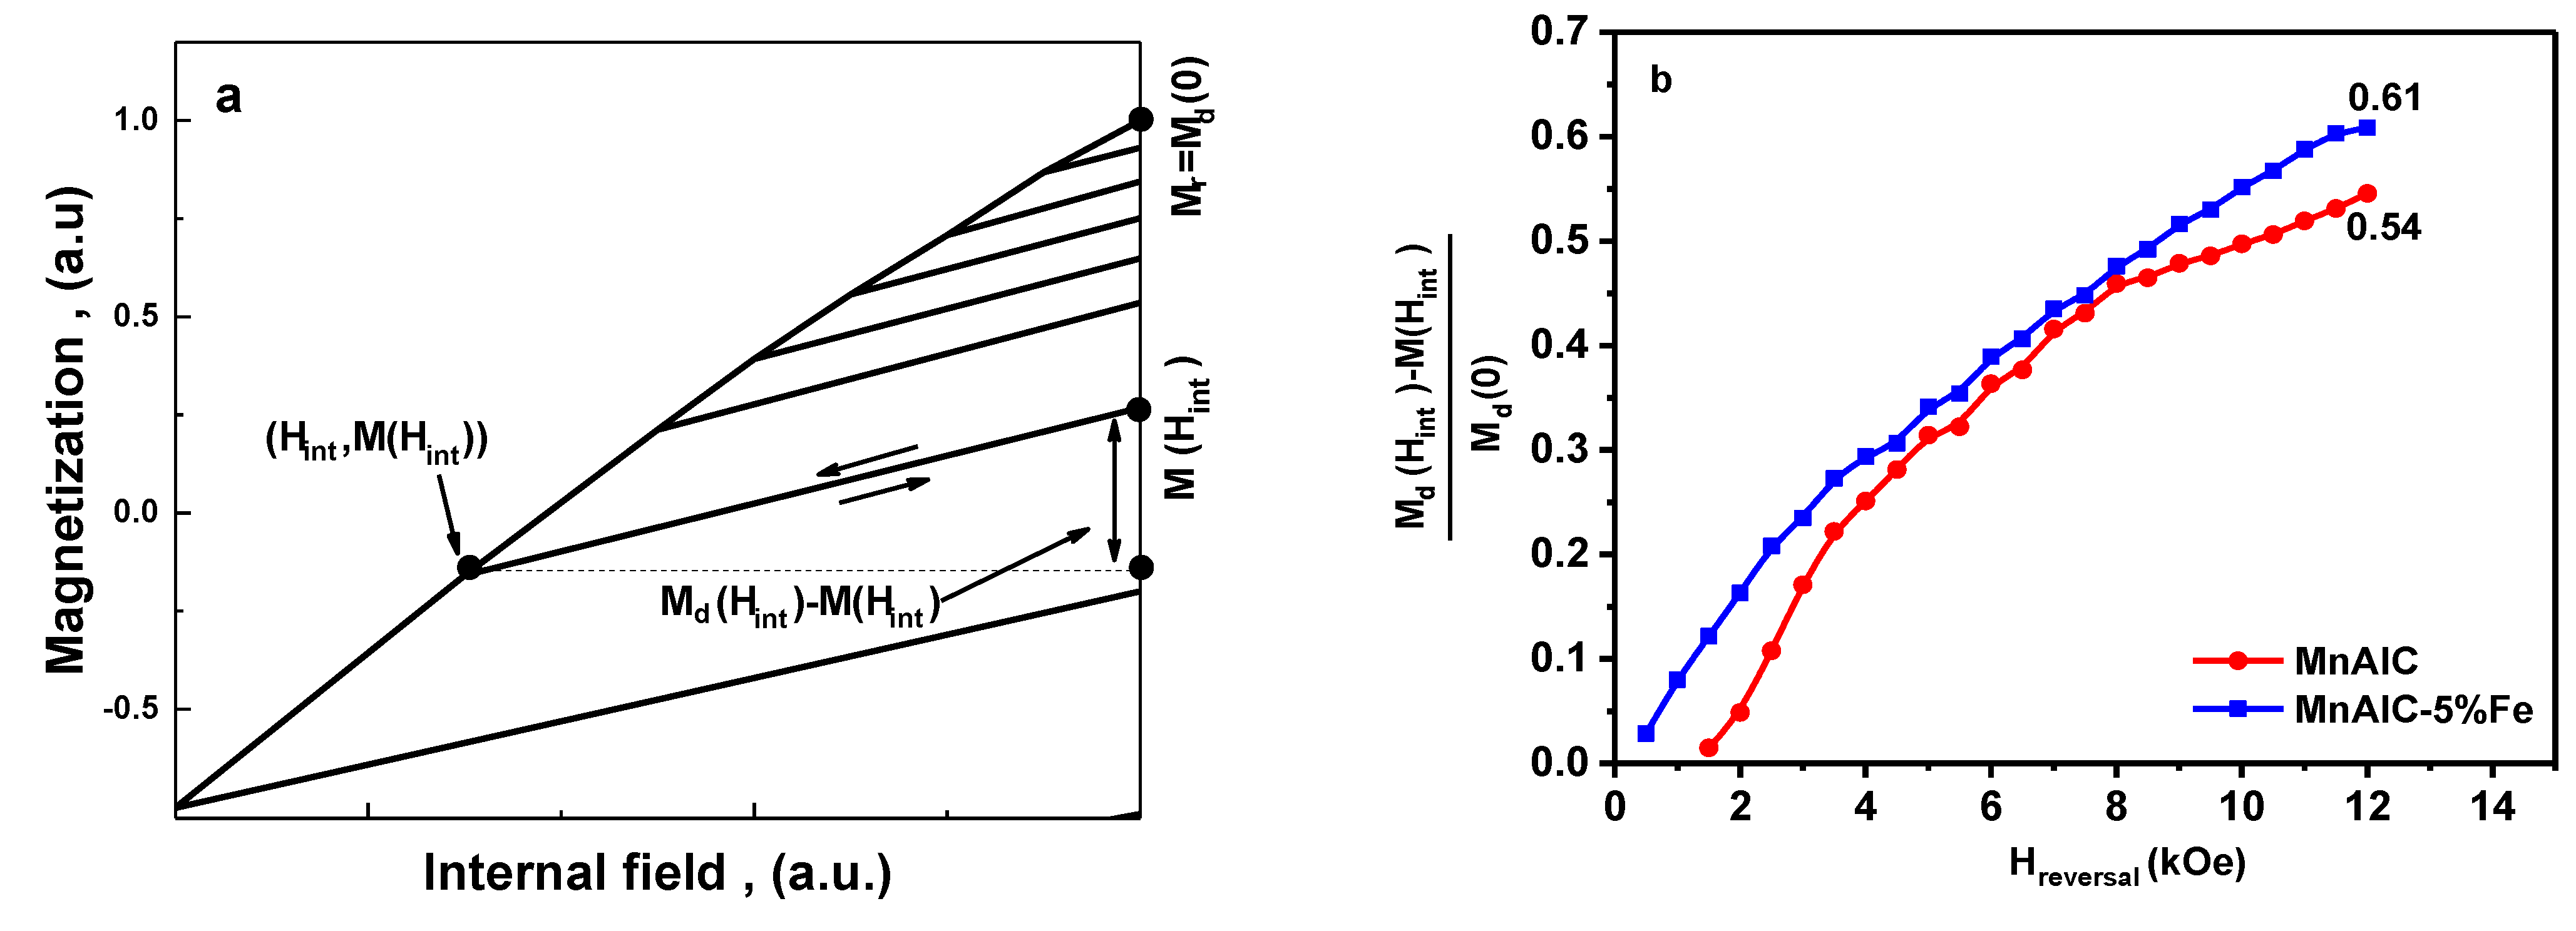
3.2.4. Recoil Curves Investigation

The recoil demagnetization curves are plotted in Figure 5 to better understand the reverse magnetization behavior of the samples. For this purpose, a 12 kOe magnetic field was applied and then reduced to zero to obtain Mr. The reversed field (Hd) was then applied and then reduced to zero. Magnetization under zero field after applying Hd (Md(H)) was measured and this method was repeated until Hd = 12 kOe. As shown in the Figure 5a,b, the recoil curves of the Mn-Al-C and F5 samples are very similar.
The magnets with highly reversible magnetic behaviors are called exchange-spring magnets [7,106,107]. By increasing the soft phase in composite, the reversibility increases and a high remanent reversible score in the sub-coercive fields can be seen for the F20 sample, but because Mr/Ms < 0.5, they cannot be considered as exchange-spring magnets. With increasing in the amount of soft phase, the curves in Figure 5 change from convex to concave. It indicates that the size of NPs in the soft phase is close to the critical size (bs ≈ bcs) in the F5 sample. Therefore, this sample has an optimal microstructure, and increasing the number of soft phases and their accumulation together causes to overaged microstructure. Therefore, the demagnetization curve is concave. The curves of F10 and F15 samples are slightly convex, which indicates that there is some exchange coupling in these magnets as well. This is consistent with the Henkel plots results of these samples.
According to Kneller and Hawig’s micromagnetic models [7], single-phase magnets always have a closed recoil loop due to reversible behavior, which can simultaneously indicate reverse magnetization and stronger exchange coupling. Meanwhile, according to the micromagnetic finite element model calculated by Zheng [108], the reduction in the recoil loop area can occur by reducing the soft magnetic phase. Recoil loop area in nanocomposite magnets is generally interpreted as failure in interparticle exchange coupling and is attributed to the reverse magnetization behavior in grain boundaries or uncoupled soft magnetic regions, where magnetic moments are unstable due to high exchange energy, and a distribution is observed in the hard magnetic anisotropy constant K [109]. However, in the SmCo/α-Fe and τ-MnAlC systems, it has been reported that the presence of an open recoil loop may not be due to failure in interphase exchange coupling [30,110]. The presence of open loops is not only due to the addition of soft magnetic single-phase in nanocomposite magnets, but also by the grain boundaries, grain size reduction, and distribution in the hard magnetic phase anisotropy constant K.
The magnetic phase of Mn-Al-C is a single-phase alloy with no soft magnetic phase, and has an open recoil loop, which near Hc, the loop area reaches a maximum. Hence, changes in the hard magnetic particle anisotropy and a decrease in particle size could be responsible for the open recoil loop. If some Mn atoms are coupled antiferromagnetically (due to the high concentration of Mn with the formation of the Mn-rich τ-phase and also the presence of defects in the lattice), it is possible that the recoil loop has an area.
To better understanding of the interparticle coupling, the diagrams of Md(H) and M(H) are plotted as a function of the applied reversal field for samples Mn-Al-C and F5 (Figure 5f–n). Hr is the dc remanence coercivity of which is determined by Md(Hr) = 0 and Hc is the intrinsic coercivity which is determined by M(Hc) = 0 condition [7,111,112]. The Hr/Hc ratio for Mn-Al-C and F5 samples is 1.15 which is close to the theoretical value predicted by Wohlfarth, i.e., Hr/Hc = 1.09, whereas this ratio is much higher for other alloys [7,111]. These results show that the F5 alloy, like the Mn-Al-C, has a good single hard magnetic behavior.
According to the Stoner–Wohlfarth model for ideal single-domain grains, Hc is equal to anisotropy field Ha. In real magnets, Hc is much lower than Ha, and this is due to the less energy to reverse magnetism in the defects and the distribution of constant anisotropy. Ha or K is basically related to the magnetization reversal stability in the grains. Grains with higher Ha can resist a stronger magnetizing field. Therefore, reversing the magnetization in defective areas (grains with less Ha) can help to reverse the magnetization of grains with higher Ha under less field and cause a sharp decrease in Hc. On the other hand, the reversal of magnetization in the areas with accumulated α-Fe particles (less Ha), could help to reverse the magnetization of τ-Mn-Al-C particles with higher Ha under the lower field and cause a sharp decrease in Hc. Therefore, the Hrc/Hc ratio is closely related to the reversal of magnetization and the resistance of the domains to rotation or domain wall movement due to the applied magnetic field.
Hard single-phase ferromagnetics generally have a low reversible magnetism. To prove this property, recoil curves are used, and magnetic reversibility and irreversibility curves are plotted in Figure 6 and Figure 7. The magnetization is expected to be reversible in the presence of exchange coupling. The reversible process is associated with the rotation of the magnetism or the displacement of the domain wall in a single potential well [30]. Here the recoil curve used to determine critical parameters is shown in Figure 6a. Reversible magnetization changes (Md(Hint) − M(Hint)) were investigated by removing reverse magnetic field. Figure 6b shows the normalized recovered magnetization [Md(Hint) − M(Hint)]/Md(0) as a function of the applied reverse field (Hreversal) for samples F0 and F5. The difference in magnetization in Figure 6 can be due to the interparticle exchange spring coupling behavior. According to Figure 6, the value obtained for sample F5 is 0.61, which is higher than 0.54 for sample Mn-Al-C. This indicates that there is a stronger spring exchange behavior in the F5 sample in comparison with the iron-free sample. Therefore, by adding 5% of the soft phase, the magnetic recovery is increased.
Irreversible changes are related to energy loss through the movement of the domain wall or the switching of magnetization in a single domain particle [113,114,115]. The irreversible part is described by the dc field demagnetization remanence (Md(H)), which remanence after saturation is in one direction and the dc field is in the opposite direction. The irreversible changes in the reverse magnetization process for the hard magnetic single-phase alloy Mn-Al-C and the hard/soft magnetic NPs Mn-AL-C/Fe as D(H) = [MrMd(H)]/2Mr ≈ − ΔMirr(H)/2Mr were plotted versus H (Figure 7). It should be noted that the D(H) vs. H curve is measured in the optimum state of the alloy (isotropic grains) according to the one-dimensional purely inhomogeneous magnetization rotation model [7].
The total irreversible change in magnetization is as follows:
Δ M irr = 2 M r 0 ϑ 1 c o s θ . d θ = 2 M r sin θ
θ is the angle between the field H and the easy axis of particles magnetization rotation, and 0 θ 90 o (with assumption of equal probabilities of all angles in the easy axis plane between the field H and the easy axis of magnetization rotation).
The negative applied external field required to destabilize the initial magnetization and initiate the reversal of the magnetization is defined as nucleation field Hn [7]. When the reverse field H increases from H = 0 in the opposite direction, reverse magnetization does not occur irreversibly until H < Hn. When H increases to H1 = Hn/cos θ, all particles reverse their magnetization by their easy magnetization axis at an angle θ relative to the applied field H. Equation (2) was written as a math function in the Origin software and fitting was done using the nonlinear curve fit option and the nucleation field was obtained. Curves fitting indicated that nucleation (switching) fields for Mn-Al-C hard single-phase magnetic alloy and F5 sample are 2.8 kOe and 3.3 kOe, respectively. Therefore, Hn for sample F5 is higher than Mn-Al-C. The antiferromagnetic coupling of Mn–Mn may occur less at the phase boundaries and therefore the nucleation field may increase. The nucleation field close to the coercivity field (Hn/Hc ≈ 1) for sample F5 indicates the presence of effective exchange coupling in this sample, whereas Hn is smaller than Hc for Mn-Al-C, which indicates the presence of magnetostatic interactions.

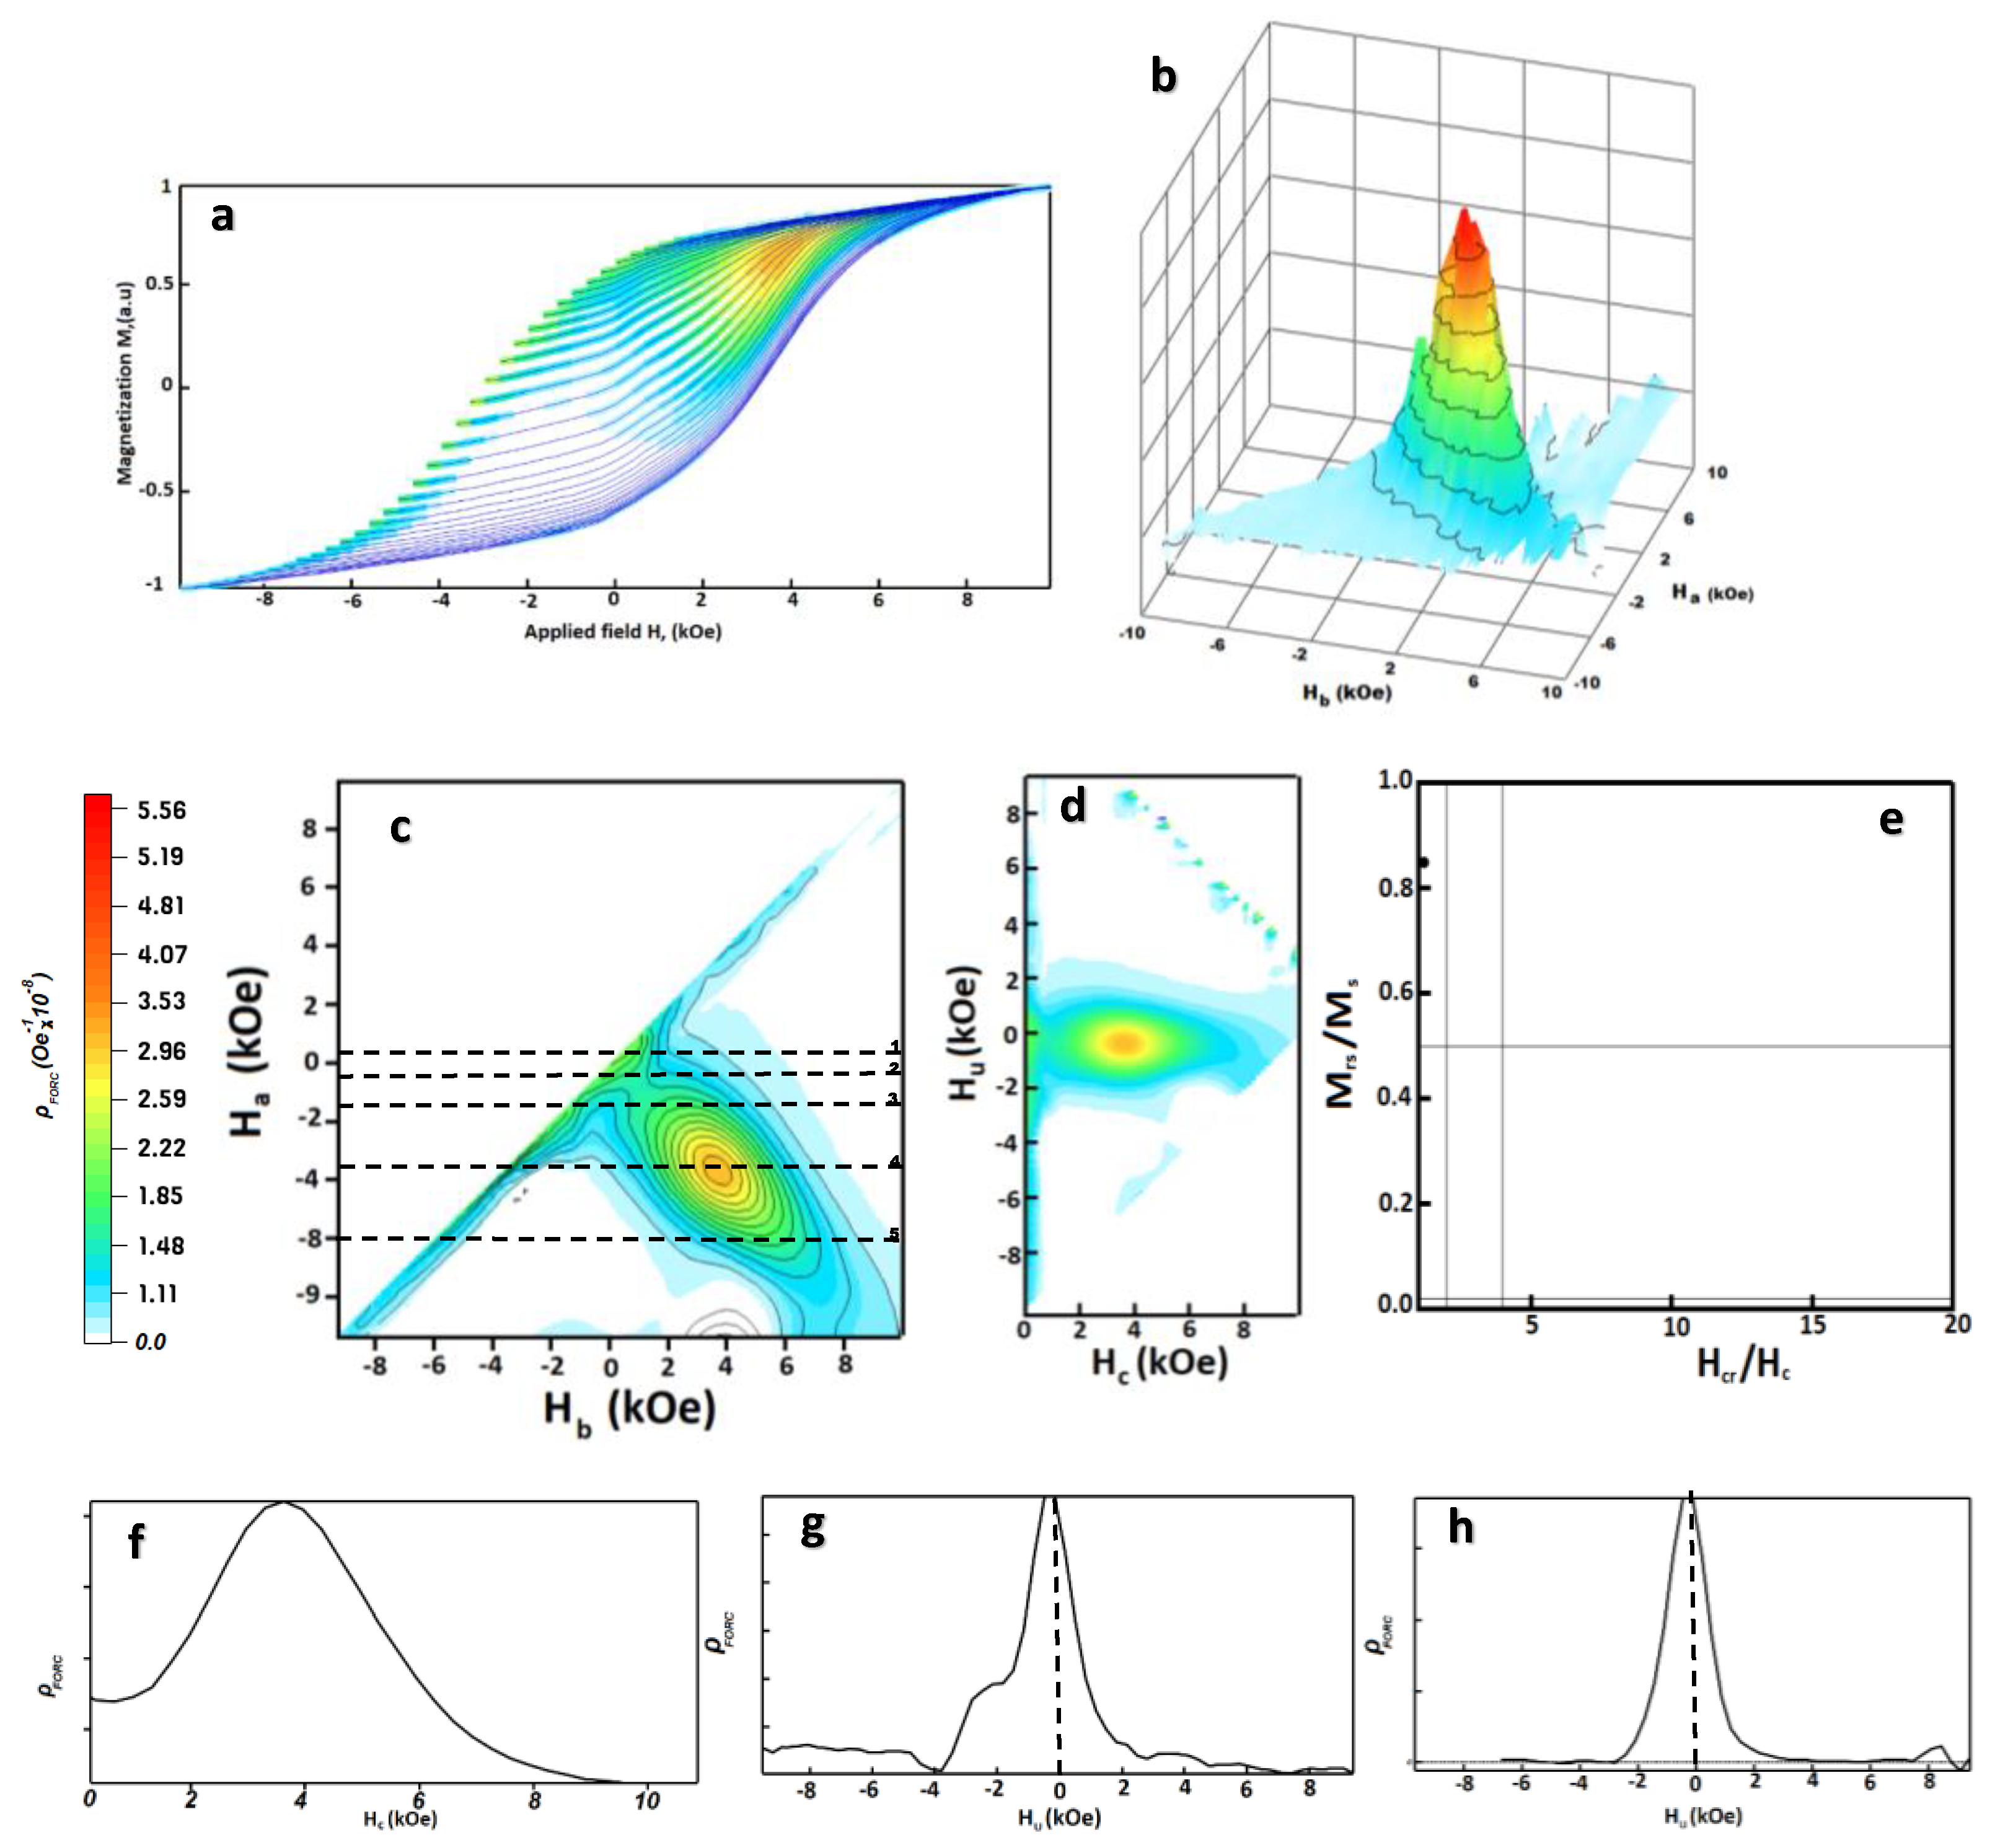
3.2.5. First Order Reversal Curves (FORC) Analysis

In order to investigate the coercivity mechanism (demagnetization behavior) of F5 sample and identify the existing interaction field, FORC measurements were performed on this nanocomposite. Using FORC analysis, quantitative information can be obtained about the distribution of the coercivity field (Hc) of each magnetic component and the dipolar and magnetic exchange interactions (Hu) between magnetic compounds [116,117,118]. A large number of partial hysteresis loops (hysterons), called first-order reversal curves, were obtained for the L10-MnAlC/α-Fe nanocomposite, as shown in Figure 8a. For this purpose, the sample was exposed to the maximum possible external magnetic field (10 kOe) until the sample reached saturated magnetization and then the field was reduced to the reversal field Hr. Magnetization was measured from this reversal field to the maximum external magnetic field and the FORC was created. A set of FORCs was measured using this method for a series of decreasing reversal fields.
The magnetization in the FORC in the applied H field for the reversal field Hr is shown with M (Hr, H), where HHr [119,120,121,122]. The FORC distribution can be defined by the following equation.
ρ ( H r , H ) = 1 2   2 M   ( H r , H )   H r     H
It is known that the FORC distribution becomes non-zero when there is irreversible switching in the magnetization reversal. In addition, the zero FORC distribution is attributed to the occurrence of reversible switching [123,124].
To better illustrate FORC, defining a new set of coordinates can be helpful. For this purpose, the FORC diagram can be rotated from the plane (Hr, H) to the plane (Hc, Hu) at an angle of 45°.
H u = H r + H 2 , H c = H r H 2
If each magnetic phase is independently reversed, it is predicted that two peaks corresponding to each of the hard and soft magnetic phases will appear in the FORC diagram. Conversely, when an exchange coupling occurs between the hard and soft magnetic phases, a single peak (two peaks combine at the same peak) must be observed [4,125]. In the FORC diagram, closed lines are usually considered as single-domain particle fingerprints, whereas open lines that diverge toward the Hu axis are fingerprints for multi-domain behavior [126,127].
2D and 3D FORC diagrams of composite NPs as well as its vertical and horizontal profiles and Day plot of single domain are presented in Figure 8. Figure 8b–d shows the FORC contour diagram for F5 nanocomposite. According to Figure 8f, the horizontal profile of F5 sample shows a single peak at Hc (3.5 kOe) which is close to the coercivity of the F5 alloy. The smooth surface of this peak indicates the strong coupling interaction that governs its magnetic behavior. There is a distribution of interaction field Hu (vertical axis) and switching field Hc (horizontal axis), which the former is due to interparticle interactions, and the latter is due to the switching of different particles at different applied field. Peaks in FORC distributions tend to negative interaction fields Hu, a property that is usually associated with the exchange interaction that occurs between magnetic particles [119,124,128]. Figure 8g,h show the interaction field distribution Hu = 0 and Hu = 3.5 kOe which the maximum FORC distribution is concentrated near Hu = −300 Oe and tends to negative Hu field.
The FORC distribution in the Figure 8d is elongated along the central horizontal axis of Hc (horizontally elongated rings), a teardrop-like feature observed in the contour line pattern. Another point is the closed contour lines. These two properties are characteristic of the single-domain particles [123,129,130]. Additionally, the diagram of squareness (Mrs/Ms) versus the remanent coercivity force (Hcr/Hc) is plotted in Figure 8e. This diagram can be used to estimate the type of magnetic domain and shows that the particles size range is in the stable single domain particle region. Single domain particles have a high surface-to-volume ratio, which causes the boundary of the domain regions to disappear and volumetric energies such as de-magnetic energy are increased, hence single-domain particles have high magnetostatic energy [131,132]. This is the reason of the negative value in the δM diagram of Figure 4 for the Mn-Al-C, indicating magnetostatic energy.
Wide distribution on the Hc axis is a statistical representation of the coercivity distribution between domains and has been interpreted as a wide particle size distribution as well as the presence of different anisotropy between particles [130].
Figure 8c shows the FORC distribution of F5 nanocomposite in coordinates (Hr, H). For F5 nanocomposite, reversal occurs primarily by rotation of the domain (reverse magnetization nucleation) in the soft phase due to the low K. It can be seen from line 1 in Figure 8c. The zero ρ is related to the reversible change in magnetization. After the domain rotation, the beginning of irreversible processes can be observed from the FORC distribution due to decreasing the inverse field. This can be seen by scanning line 2 in Figure 8c. This field corresponds to the nucleation field of the soft phase. However, the soft phase domains begin to rotate toward the external applied field, but the nearest hard phases prevent the soft phase from escaping despite the high uniaxial anisotropic force. The applied inverse field did not have enough energy to overcome the rotation of the magnetization vector within the magnetic domain. The external field has an optional direction (θ angle) relative to the easy direction of the phase particles, which causes some of the magnetism to be reversible and some to be irreversible, i.e., the magnetism has rotated from one stable direction to another stable direction, hence the distribution of the FORC in these areas (between lines 2 and 3) is non-zero.
A more positive distribution of FORC around point 3 indicates the occurrence of an irreversible magnetization process. Between lines 3 and 4, the FORC distribution continues to increase, reaching a maximum (around 3500 Oe), indicating a non-zero FORC distribution. This indicates that the applied inverse field is sufficient to overcome the further rotation of the moments and domains. The domains in the soft phase suddenly begin to exceed the hard phases, leading to the irreversible switching of the hard and soft phases. This is due to the fact that both the soft and hard phases are coupled with each other. Therefore, the magnetism of the particles switches from positive to negative. However, some particles with higher anisotropy still exist. Subsequently, these domains are overcome by increasing the applied inverse field, which leads to a non-zero FORC distribution. Hence, when the nanocomposite reaches its negative saturation, irreversible switching occurs and the FORC distribution is zero.

4. Conclusions

The α-Fe NPs with weight percentages of 5, 10, 15, and 20% were added to the hard magnetic phase of Mn-Al-C and the magnetic properties and reverse magnetization behavior of nanostructured bulk magnets were investigated. The demagnetization curve (second quarter of the hysteresis loop) of the sample containing 5 wt. % α-Fe was convex. Whereas, for samples with more iron, the curve was concave. Therefore, Mn-Al-C-0.05 α-Fe sample showed good exchange coupling for hard and soft magnetic phases. In addition, the maximum energy product is (BH)max = 1.6 MGOe, which is an increase of 60% compared to the Mn-Al-C sample. A high value of relative residual (0.61) was obtained for the sample containing 5 wt.% α-Fe, which indicates that the easy magnetization axis direction in many soft phases is aligned with the easy direction in hard phases. Switching field distribution diagrams showed that at high concentrations of soft iron phase, this phase is not associated with good exchange coupling and there are biphase magnetic behaviors. The results of the recoil diagram showed that there is a stronger exchange spring behavior in the Mn-Al-C-0.05 α-Fe sample than in the iron-free sample and the magnetization recovery is increased by adding 5% of the soft phase. FORC analysis also showed that the particles in the Mn-Al-C-0.05 α-Fe sample are single-domain. A major peak for this alloy was observed in the FORC diagram, indicating an exchange coupling that is consistent with the results of Henkel plots and recoil analysis.

Supplementary Materials

The following supporting information can be downloaded at: https://www.mdpi.com/article/10.3390/nano12193303/s1, Figure S1: SEM images (in different magnification) and size distribution of Mn52Al45.7C2.3 nano powders.

Author Contributions

Conceptualization, S.A.S.E.; Investigation, S.N.A.; Methodology, S.N.A.; Project administration, S.A.S.E.; Resources, S.A.S.E.; Software, Z.L.; Supervision, S.A.S.E.; Validation, S.N.A.; Visualization, S.N.A.; Writing—original draft, S.N.A. and Z.L.; Writing—review and editing, S.A.S.E. and B.H. All authors have read and agreed to the published version of the manuscript.

Funding

This research did not receive any specific grant from funding agencies in the public, commercial, or not-for-profit sectors.

Institutional Review Board Statement

Not applicable.

Informed Consent Statement

Not applicable.

Data Availability Statement

The data presented in this study are available on request from the corresponding author or first author.

Conflicts of Interest

The authors declare that they have no conflict of interest.

References

  1. Wei, Y.; Li, Y.Q.; Zhang, D.T.; Yue, M. Improvement of magnetic properties of smco 5/α-Fe nanocomposite magnets by magnetic field annealing. J. Magn. 2018, 23, 381–385. [Google Scholar] [CrossRef]
  2. Ryo, H.S.; Hu, L.X.; Yang, Y.L. Micromagnetic study for magnetic properties of exchange coupled nanocomposite magnetic systems with Nd2Fe14B grains embedded in α-Fe matrix. J. Magn. Magn. Mater. 2017, 426, 46–52. [Google Scholar] [CrossRef]
  3. Pop, V.; Gutoiu, S.; Dorolti, E.; Leostean, C.; Isnard, O.; Chicinas, I.; Pana, O. The influence of milling and annealing on the structural and magnetic behavior of Nd2Fe14B/α-Fe magnetic nanocomposite. J. Alloys Compd. 2013, 581, 821–827. [Google Scholar] [CrossRef]
  4. Rong, C.-B.; Zhang, Y.; Kramer, M.J.; Liu, J.P. Correlation between microstructure and first-order magnetization reversal in the SmCo5/α-Fe nanocomposite magnets. Phys. Lett. A 2011, 375, 1329–1332. [Google Scholar] [CrossRef]
  5. Rong, C.; Zhang, Y.; Poudyal, N.; Wang, D.; Kramer, M.J.; Liu, J.P. Bulk SmCo5/α-Fe nanocomposite permanent magnets fabricated by mould-free Joule-heating compaction. J. Appl. Phys. 2011, 109, 07A735. [Google Scholar] [CrossRef]
  6. Zhang, P.Y.; Hiergeist, R.; Lüdke, J.; Albrecht, M.; Ge, H.L. Magnetization reversal behavior in high coercivity Zr doped α-Fe/Nd2Fe14B nanocomposite alloys. J. Appl. Phys. 2010, 108, 043905. [Google Scholar] [CrossRef]
  7. Kneller, E.F.; Hawig, R. The exchange-spring magnet: A new material principle for permanent magnets. IEEE Trans. Magn. 1991, 27, 3588–3600. [Google Scholar] [CrossRef]
  8. Coey, J.M.D.; Skomski, R. New magnets from interstitial intermetallics. Phys. Scr. 1993, 1993, 315–321. [Google Scholar] [CrossRef]
  9. Coehoorn, R.; de Mooij, D.; Duchateau, J.; Buschow, K. Novel Permanent Magnetic Materials Made by Rapid Quenching. J. Phys. Colloq. 1988, 49, C8-669–C668-670. [Google Scholar] [CrossRef]
  10. Buschow, K.H.J.; De Mooij, D.B.; Coehoorn, R. Metastable ferromagnetic materials for permanent magnets. J. Less Common Met. 1988, 145, 601–611. [Google Scholar] [CrossRef]
  11. Bance, S.; Bittner, F.; Woodcock, T.G.; Schultz, L.; Schrefl, T. Role of twin and anti-phase defects in MnAl permanent magnets. Acta Mater. 2017, 131, 48–56. [Google Scholar] [CrossRef]
  12. Coey, J.M.D. Permanent magnets: Plugging the gap. Scr. Mater. 2012, 67, 524–529. [Google Scholar] [CrossRef]
  13. Luo, L.; Anuniwat, N.; Dao, N.; Cui, Y.; Wolf, S.A.; Lu, J. Magneto-transport and domain wall scattering in epitaxy L10 MnAl thin film. J. Appl. Phys. 2016, 119, 103902. [Google Scholar] [CrossRef]
  14. Wang, H.X.; Si, P.Z.; Jiang, W.; Liu, J.J.; Lee, J.G.; Choi, C.J.; Ge, H.L. Structure and magnetic properties of MnAl/α-Fe nano-composite powders prepared by high-energy ball milling. Adv. Mater. Res. 2011, 287–290, 1492–1495. [Google Scholar]
  15. Lu, W.; Niu, J.; Wang, T.; Xia, K.; Xiang, Z.; Song, Y.; Zhang, H.; Yoshimura, S.; Saito, H. Low-energy mechanically milled τ-phase MnAl alloys with high coercivity and magnetization. J. Alloys Compd. 2016, 675, 163–167. [Google Scholar] [CrossRef]
  16. Wei, J.Z.; Song, Z.G.; Yang, Y.B.; Liu, S.Q.; Du, H.L.; Han, J.Z.; Zhou, D.; Wang, C.S.; Yang, Y.C.; Franz, A.; et al. τ−MnAl with high coercivity and saturation magnetization. Am. Inst. Phys. 2014, 4, 127113. [Google Scholar] [CrossRef]
  17. Chaturvedi, A.; Yaqub, R.; Baker, I. Microstructure and Magnetic Properties of Bulk Nanocrystalline MnAl. Metals 2014, 4, 20–27. [Google Scholar] [CrossRef]
  18. Law, J.Y.; Rial, J.; Villanueva, M.; López, N.; Camarero, J.; Marshall, L.G.; Blázquez, J.S.; Borrego, J.M.; Franco, V.; Conde, A.; et al. Study of phases evolution in high-coercive MnAl powders obtained through short milling time of gas-atomized particles. J. Alloys Compd. 2017, 712, 373–378. [Google Scholar] [CrossRef]
  19. Rial, J.; Villanueva, M.; Céspedes, E.; López, N.; Camarero, J.; Marshall, L.G.; Lewis, L.H.; Bollero, A. Application of a novel flash-milling procedure for coercivity development in nanocrystalline MnAl permanent magnet powders. J. Phys. D Appl. Phys. 2017, 50, 105004. [Google Scholar] [CrossRef]
  20. Muñoz-Rodríguez, C.; Feng, L.; Palmero, E.M.; Mix, T.; Rial, J.; Olsson, F.; Skårman, B.; Vidarsson, H.; Larsson, P.O.; Woodcock, T.G.; et al. Fabrication of bulk τ MnAl–C magnets by hot-pressing from ε-phase gas-atomized and milled powder. J. Alloys Compd. 2020, 847, 156361. [Google Scholar] [CrossRef]
  21. Rial, J.; Švec, P.; Švec, P.; Bollero, A.; Deledda, S. Coercivity development in MnAl ribbons by microstructural modifications achieved through cold-rolling process. J. Magn. Magn. Mater. 2021, 529, 167826. [Google Scholar] [CrossRef]
  22. Saravanan, P.; Saju, S.; Vinod, V.T.P.; Černík, M. Structural and magnetic properties of rare-earth-free MnAl(MCNT)/Fe nanocomposite magnets processed by resin-bonding technique. J. Mater. Sci. Mater. Electron. 2020, 31, 9878–9887. [Google Scholar] [CrossRef]
  23. Rial, J.; Palmero, E.M.; Bollero, A. Efficient Nanostructuring of Isotropic Gas-Atomized MnAl Powder by Rapid Milling (30 s). Engineering 2019, 6, 173–177. [Google Scholar] [CrossRef]
  24. Bittner, F.; Freudenberger, J.; Schultz, L.; Woodcock, T.G. The impact of dislocations on coercivity in L10-MnAl. J. Alloys Compd. 2017, 704, 528–536. [Google Scholar] [CrossRef]
  25. Hernandez, J.S.T.; Maccari, F.; Marshall, L.G.; Tabares, J.A.; Alcázar, G.A.P. Exchange Coupling in MnAlC/α-Fe Nanocomposite Magnets. J. Supercond. Nov. Magn. 2018, 31, 3941–3947. [Google Scholar] [CrossRef]
  26. Koch, C.C.; Ovid’Ko, I.A.; Seal, S.; Veprek, S. Structural Nanocrystalline Materials: Fundamentals and Applications; Cambridge University Press: Cambridge, UK, 2007. [Google Scholar]
  27. Krishnan, K.M. Fundamentals and Applications of Magnetic Materials. MRS Bull. 2017, 42, 540. [Google Scholar]
  28. Feng, L.; Nielsch, K.; Woodcock, T.G. Enhanced thermal stability of the τ-phase in MnAl-C alloys with Ni additions. J. Alloys Compd. 2021, 871, 159554. [Google Scholar] [CrossRef]
  29. Xiang, Z.; Deng, B.; Zhang, X.; Wang, X.; Cui, E.; Yu, L.; Song, Y.; Lu, W. Nanocrystalline MnAlV rare-earth-free Permanent Magnetic Alloys with Improved Magnetization and Thermal Stability. Intermetallics 2020, 116, 106638. [Google Scholar] [CrossRef]
  30. Tong, X.; Sharma, P.; Makino, A. Investigations on low energy product of MnAl magnets through recoil curves. J. Phys. D Appl. Phys. 2020, 53, 175001. [Google Scholar] [CrossRef]
  31. Si, P.-Z.; Choi, C.-J.; Park, J.; Ge, H.-L.; Du, J. Phase transformation and enhanced coercivity in B-N-doped MnAl nanocrystalline bulk alloys prepared by high pressure torsion. AIP Adv. 2020, 10, 015320. [Google Scholar] [CrossRef]
  32. Zhao, S.; Wu, Y.; Wang, J.; Jia, Y.; Zhang, T.; Zhang, T.; Jiang, C. Realization of large coercivity in MnAl permanent-magnet alloys by introducing nanoprecipitates. J. Magn. Magn. Mater. 2019, 483, 164–168. [Google Scholar] [CrossRef]
  33. Sato, S.; Irie, S. Metamagnetic behavior in L10-MnAl synthesized by the post annealing of electrodeposited MnAl powder. AIP Adv. 2019, 9, 035015. [Google Scholar] [CrossRef] [Green Version]
  34. Si, P.Z.; Park, J.; Qian, H.D.; Choi, C.J.; Li, Y.S.; Ge, H.L. Enhanced magnetic performance of bulk nanocrystalline MnAlC prepared by high pressure compaction of gas atomized powders. Bull. Mater. Sci. 2019, 42, 1–6. [Google Scholar] [CrossRef]
  35. Ohtani, T.; Kato, N.; Kojima, S.; Kojima, K.; Sakamoto, Y.; Konno, I.; Tsukahara, M.; Kubo, T. Magnetic properties of Mn-Al-C permanent magnet alloys. IEEE Trans. Magn. 1977, 13, 1328–1330. [Google Scholar] [CrossRef]
  36. Martínez Sánchez, H.; Zamora Alfonso, L.E.; Trujillo Hernandez, J.S.; Pérez Alcázar, G.A. Evidence of exchange coupling in τ-MnAlC/FeCo system. J. Magn. Magn. Mater. 2019, 473, 221–227. [Google Scholar] [CrossRef]
  37. Xiang, Z.; Wang, X.; Song, Y.; Yu, L.; Cui, E.; Deng, B.; Batalu, D.; Lu, W. Effect of cooling rates on the microstructure and magnetic properties of MnAl permanent magnetic alloys. J. Magn. Magn. Mater. 2019, 475, 479–483. [Google Scholar] [CrossRef]
  38. Shafeie, S.; Fang, H.; Hedlund, D.; Nyberg, A.; Svedlindh, P.; Gunnarsson, K.; Sahlberg, M. One step towards MnAl-based permanent magnets-Differences in magnetic, and microstructural properties from an intermediate annealing step during synthesis. J. Solid State Chem. 2019, 274, 229–236. [Google Scholar] [CrossRef]
  39. Zhao, S.; Wu, Y.; Zhang, C.; Wang, J.; Fu, Z.; Zhang, R.; Jiang, C. Stabilization of τ-phase in carbon-doped MnAl magnetic alloys. J. Alloys Compd. 2018, 755, 257–264. [Google Scholar] [CrossRef]
  40. You, J.; Guo, Y. Plasma enhanced atomic layer deposition of Co thin film on τ-MnAl for effective magnetic exchange coupling and enhanced energy products. J. Alloys Compd. 2018, 758, 116–121. [Google Scholar] [CrossRef]
  41. Tang Nguyen, V.; Calvayrac, F.; Bajorek, A.; Randrianantoandro, N. Mechanical alloying and theoretical studies of MnAl(C) magnets. J. Magn. Magn. Mater. 2018, 462, 96–104. [Google Scholar] [CrossRef]
  42. Si, P.Z.; Qian, H.D.; Choi, C.J.; Park, J.; Ge, H.L. A novel method for measuring the phase transformation temperature and enhanced coercivity in cold-rolled MnAlCx (x = 0–5) alloys. J. Magn. Magn. Mater. 2018, 451, 540–545. [Google Scholar] [CrossRef]
  43. Rial, J.; Švec, P.; Palmero, E.M.; Camarero, J.; Švec, P., Sr.; Bollero, A. Severe tuning of permanent magnet properties in gas-atomized MnAl powder by controlled nanostructuring and phase transformation. Acta Mater. 2018, 157, 42–52. [Google Scholar] [CrossRef]
  44. Qian, H.D.; Si, P.Z.; Choi, C.J.; Park, J.; Cho, K.M. Phase transformation and magnetic properties of MnAl powders prepared by elemental-doping and salt-assisted ball milling. AIP Adv. 2018, 8, 056216. [Google Scholar] [CrossRef]
  45. Parvin, M.S.; Oogane, M.; Kubota, M.; Tsunoda, M.; Ando, Y. Epitaxial L10-MnAl Thin Films with High Perpendicular Magnetic Anisotropy and Small Surface Roughness. IEEE Trans. Magn. 2018, 54, 1–4. [Google Scholar] [CrossRef]
  46. Palmero, E.M.; Rial, J.; de Vicente, J.; Camarero, J.; Skårman, B.; Vidarsson, H.; Larsson, P.O.; Bollero, A. Development of permanent magnet MnAlC/polymer composites and flexible filament for bonding and 3D-printing technologies. Sci. Technol. Adv. Mater. 2018, 19, 465–473. [Google Scholar] [CrossRef]
  47. Jia, Y.; Wu, Y.; Zhao, S.; Wang, J.; Jiang, C. Relation between solidification microstructure and coercivity in MnAl permanent-magnet alloys. Intermetallics 2018, 96, 41–48. [Google Scholar] [CrossRef]
  48. Fang, H.; Cedervall, J.; Hedlund, D.; Shafeie, S.; Deledda, S.; Olsson, F.; Von Fieandt, L.; Bednarcik, J.; Svedlindh, P.; Gunnarsson, K.; et al. Structural, microstructural and magnetic evolution in cryo milled carbon doped MnAl. Sci. Rep. 2018, 8, 2525. [Google Scholar] [CrossRef]
  49. Crisan, A.D.; Vasiliu, F.; Nicula, R.; Bartha, C.; Mercioniu, I.; Crisan, O. Thermodynamic, structural and magnetic studies of phase transformations in MnAl nanocomposite alloys. Mater. Charact. 2018, 140, 1–8. [Google Scholar] [CrossRef]
  50. Øygarden, V.; Rial, J.; Bollero, A.; Deledda, S. Phase-pure τ-MnAlC produced by mechanical alloying and a one-step annealing route. J. Alloys Compd. 2019, 779, 776–783. [Google Scholar] [CrossRef]
  51. Si, P.; Qian, H.; Wang, X.; Yang, Y.; Park, J.; Ge, H.; Choi, C.-J. High-Pressure Synthesis of High Coercivity Bulk MnAl-C Magnets from Melt-Spun Ribbons. J. Electron. Mater. 2019, 48, 794–798. [Google Scholar] [CrossRef]
  52. Shao, Z.; Zhao, H.; Zeng, J.; Zhang, Y.; Yang, W.; Lai, Y.; Guo, S.; Du, H.; Wang, C.; Yang, Y.; et al. One step preparation of pure τ-MnAl phase with high magnetization using strip casting method. AIP Adv. 2017, 7, 056213. [Google Scholar] [CrossRef]
  53. Dang, R.; Ma, X.; Liu, J.; Zhang, Y.; Qian, S. The fabrication and characterization of MnAl/FeCo composite thin films with enhanced maximum energy products. Mater. Lett. 2017, 197, 8–11. [Google Scholar] [CrossRef]
  54. Si, P.-Z.; Qian, H.-D.; Choi, C.-J.; Park, J.; Han, S.; Ge, H.-L.; Shinde, K.P. In situ Observation of Phase Transformation in MnAl(C) Magnetic Materials. Materials 2017, 10, 1016. [Google Scholar] [CrossRef] [PubMed]
  55. Liu, Z.; Su, K.; Cheng, Y.; Ramanujan, R. Structure and Properties Evolutions for Hard Magnetic MnAl and MnGa Based Alloys Prepared by Melt Spinning or Mechanical Milling. Mater. Sci. Eng. Adv. Res. 2015, 1, 12–19. [Google Scholar] [CrossRef]
  56. Shen, J.; Li, J.; Ren, S. Metal-redox for MnAl-Based ternary magnetic nanocrystals. RSC Adv. 2016, 6, 41781–41784. [Google Scholar] [CrossRef]
  57. Sato, T.; Ohsuna, T.; Kaneko, Y. Enhanced saturation magnetization in perpendicular L10-MnAl films upon low substitution of Mn by 3d transition metals. J. Appl. Phys. 2016, 120, 243903. [Google Scholar] [CrossRef]
  58. Marshall, L.G.; McDonald, I.J.; Lewis, L.H. Quantification of the strain-induced promotion of τ-MnAl via cryogenic milling. J. Magn. Magn. Mater. 2016, 404, 215–220. [Google Scholar] [CrossRef]
  59. Fang, H.; Kontos, S.; Ångström, J.; Cedervall, J.; Svedlindh, P.; Gunnarsson, K.; Sahlberg, M. Directly obtained τ-phase MnAl, a high performance magnetic material for permanent magnets. J. Solid State Chem. 2016, 237, 300–306. [Google Scholar] [CrossRef]
  60. Singh, N.; Mudgil, V.; Anand, K.; Srivastava, A.K.; Kotnala, R.K.; Dhar, A. Influence of processing on structure property correlations in τ-MnAl rare-earth free permanent magnet material. J. Alloys Compd. 2015, 633, 401–407. [Google Scholar] [CrossRef]
  61. Bittner, F.; Schultz, L.; Woodcock, T.G. Twin-like defects in L10 ordered τ-MnAl-C studied by EBSD. Acta Mater. 2015, 101, 48–54. [Google Scholar] [CrossRef]
  62. Chaturvedi, A.; Yaqub, R.; Baker, I. A comparison of τ-MnAl particulates produced via different routes. J. Phys. Condens. Matter 2014, 26, 064201. [Google Scholar] [CrossRef] [PubMed]
  63. Nie, S.H.; Zhu, L.J.; Lu, J.; Pan, D.; Wang, H.L.; Yu, X.Z.; Xiao, J.X.; Zhao, J.H. Perpendicularly magnetized τ-MnAl(001) thin films epitaxied on GaAs. Appl. Phys. Lett. 2013, 102, 152405. [Google Scholar] [CrossRef]
  64. Park, J.H.; Hong, Y.K.; Bae, S.; Lee, J.J.; Jalli, J.; Abo, G.S.; Neveu, N.; Kim, S.G.; Choi, C.J.; Lee, J.G. Saturation magnetization and crystalline anisotropy calculations for MnAl permanent magnet. J. Appl. Phys. 2010, 107, 09A731. [Google Scholar] [CrossRef]
  65. Fischer, G.A.; Rudee, M.L. Effect of magnetic annealing on the τ-phase of MnAl thin films. J. Magn. Magn. Mater. 2000, 213, 335–339. [Google Scholar] [CrossRef]
  66. Crew, D.C.; McCormick, P.G.; Street, R. MnAl and MnAlC permanent magnets produced by mechanical alloying. Scr. Metall. Mater. 1995, 32, 315–318. [Google Scholar] [CrossRef]
  67. Yang, Y.C.; Ho, W.W.; Lin, C.; Yang, J.L.; Zhou, H.M.; Zhu, J.X.; Zeng, X.X.; Zhang, B.S.; Jin, L. Neutron diffraction study of hard magnetic alloy MnAlC. J. Appl. Phys. 1984, 55, 2053–2054. [Google Scholar] [CrossRef]
  68. Houseman, E.L.; Jakubovics, J.P. Domain structure and magnetization processes in MnAl and MnAlC alloys. J. Magn. Magn. Mater. 1983, 31–34 Pt 2, 1005–1006. [Google Scholar] [CrossRef]
  69. Willens, R.H. Melt extracted MnAl and MnAlC. IEEE Trans. Magn. 1980, 16, 1059–1061. [Google Scholar] [CrossRef]
  70. Saravanan, P.; Vinod, V.T.P.; Černík, M.; Selvapriya, A.; Chakravarty, D.; Kamat, S.V. Processing of Mn–Al nanostructured magnets by spark plasma sintering and subsequent rapid thermal annealing. J. Magn. Magn. Mater. 2015, 374, 427–432. [Google Scholar] [CrossRef]
  71. Jian, H.; Skokov, K.P.; Gutfleisch, O. Microstructure and magnetic properties of Mn–Al–C alloy powders prepared by ball milling. J. Alloys Compd. 2015, 622, 524–528. [Google Scholar] [CrossRef]
  72. Pasko, A.; LoBue, M.; Fazakas, E.; Varga, L.K.; Mazaleyrat, F. Spark plasma sintering of Mn–Al–C hard magnets. J. Phys. Condens. Matter 2014, 26, 064203. [Google Scholar] [CrossRef] [PubMed]
  73. Lee, J.-G.; Wang, X.-L.; Zhang, Z.-D.; Choi, C.-J. Effect of mechanical milling and heat treatment on the structure and magnetic properties of gas atomized Mn–Al alloy powders. Thin Solid Film. 2011, 519, 8312–8316. [Google Scholar] [CrossRef]
  74. Lee, J.-G.; Li, P.; Choi, C.-J.; Dong, X.-L. Synthesis of Mn–Al alloy nanoparticles by plasma arc discharge. Thin Solid Film. 2010, 519, 81–85. [Google Scholar] [CrossRef]
  75. Zeng, Q.; Baker, I.; Cui, J.B.; Yan, Z.C. Structural and magnetic properties of nanostructured Mn–Al–C magnetic materials. J. Magn. Magn. Mater. 2007, 308, 214–226. [Google Scholar] [CrossRef]
  76. Fazakas, E.; Varga, L.K.; Mazaleyrat, F. Preparation of nanocrystalline Mn–Al–C magnets by melt spinning and subsequent heat treatments. J. Alloys Compd. 2007, 434–435, 611–613. [Google Scholar] [CrossRef]
  77. Zeng, Q.; Baker, I.; Yan, Z.-C. Nanostructured Mn–Al permanent magnets produced by mechanical milling. J. Appl. Phys. 2006, 99, 08E902. [Google Scholar] [CrossRef]
  78. Saito, T. Magnetic properties of Mn–Al–C alloy powders produced by mechanical grinding. J. Appl. Phys. 2005, 97, 10F304. [Google Scholar] [CrossRef]
  79. Saito, T. Magnetic properties of Mn–Al system alloys produced by mechanical alloying. J. Appl. Phys. 2003, 93, 8686–8688. [Google Scholar] [CrossRef]
  80. Madugundo, R.; Koylu-Alkan, O.; Hadjipanayis, G.C. Bulk Mn-Al-C permanent magnets prepared by various techniques. AIP Adv. 2016, 6, 056009. [Google Scholar] [CrossRef]
  81. Tyrman, M.; Ahmim, S.; Pasko, A.; Etgens, V.; Mazaleyrat, F.; Quetel-Weben, S.; Perrière, L.; Guillot, I. Anisotropy of the ferromagnetic L10 phase in the Mn-Al-C alloys induced by high-pressure spark plasma sintering. AIP Adv. 2018, 8, 056217. [Google Scholar] [CrossRef]
  82. Dehghan, H.; Ebrahimi, S.A. Effect of hot deformation conditions on magnetic properties of rare earth free magnetic Mn-Al-C alloy. J. Magn. Magn. Mater. 2019, 477, 55–61. [Google Scholar] [CrossRef]
  83. Volegov, A.S.; Müller, K.H.; Bittner, F.; Mix, T.; Neznakhin, D.S.; Volegova, E.A.; Nenkov, K.; Schultz, L.; Woodcock, T.G. Magnetic viscosity of L10 structured Mn-Ga and Mn-Al alloys. J. Magn. Magn. Mater. 2017, 441, 750–756. [Google Scholar] [CrossRef]
  84. Saravanan, P.; Hsu, J.-H.; Vinod, V.T.P.; Černík, M.; Kamat, S.V. MWCNT reinforced τ-Mn-Al nanocomposite magnets through spark plasma sintering. J. Alloys Compd. 2017, 695, 364–371. [Google Scholar] [CrossRef]
  85. Kobayashi, R.; Mitsui, Y.; Umetsu, R.; Takahashi, K.; Mizuguchi, M.; Koyama, K. Magnetic-Field-Induced Acceleration of Phase Formation in τ-Mn-Al. Mater. Trans. 2017, 58, 1511–1518. [Google Scholar] [CrossRef]
  86. Madugundo, R.; Hadjipanayis, G.C. Anisotropic Mn-Al-(C) hot-deformed bulk magnets. J. Appl. Phys. 2016, 119, 013904. [Google Scholar] [CrossRef]
  87. Singh, N.; Shyam, R.; Upadhyay, N.K.; Dhar, A. Development of rare-earth free Mn-Al permanent magnet employing powder metallurgy route. IOP Conf. Ser. Mater. Sci. Eng. 2012, 73, 012042. [Google Scholar] [CrossRef]
  88. Saravanan, P.; Vinod, V.T.P.; Černík, M.; Chakravarty, D.; Ghosal, P.; Kamat, S.V. Exchange coupled rare-earth free Mn-Al/Fe nanocomposite magnets by spark plasma sintering. Mater. Lett. 2014, 137, 369–372. [Google Scholar] [CrossRef]
  89. Lucis, M.J.; Prost, T.E.; Jiang, X.; Wang, M.; Shield, J.E. Phase Transitions in Mechanically Milled Mn-Al-C Permanent Magnets. Metals 2014, 4, 130–140. [Google Scholar] [CrossRef]
  90. Pasko, A.; Mazaleyrat, F.; Lobue, M.; Fazakas, E.; Varga, L.K. Hard magnetic properties of melt-spun Mn-Al-C alloys. EPJ Web Conf. 2013, 40, 06008. [Google Scholar] [CrossRef]
  91. Obi, O.; Burns, L.; Chen, Y.; Bennett, S.; Sawicki, M.; Kaplan, D.; Arango, A.M.; Lewis, L.H.; Harris, V.G. Effect of ambient aging on heat-treated mechanically alloyed Mn-Al-C powders. IEEE Trans. Magn. 2013, 49, 3372–3377. [Google Scholar] [CrossRef]
  92. Kohmoto, O.; Kageyama, N.; Kageyama, Y.; Haji, H.; Uchida, M.; Matsushima, Y. Magnetic properties of mechanically alloyed Mn-Al-C powders. J. Phys. Conf. Ser. 2011, 266, 012016. [Google Scholar] [CrossRef]
  93. Kinemuchi, Y.; Fujita, A.; Ozaki, K. High-pressure synthesis of L10 MnAl with near-stoichiometric composition. Dalton Trans. 2016, 45, 10936–10941. [Google Scholar] [CrossRef] [Green Version]
  94. Moon, K.-W.; Lee, G.-T.; Jeon, K.-W.; Kim, J. Synthesis and Magnetic Properties of τ-MnAlC Powders. J. Nanosci. Nanotechnol. 2015, 15, 8735–8738. [Google Scholar] [CrossRef]
  95. Obi, O.; Burns, L.; Chen, Y.; Fitchorov, T.; Kim, S.; Hsu, K.; Heiman, D.; Lewis, L.H.; Harris, V.G. Magnetic and structural properties of heat-treated high-moment mechanically alloyed MnAlC powders. J. Alloys Compd. 2014, 582, 598–602. [Google Scholar] [CrossRef]
  96. Liu, Z.; Chen, C.; Zheng, Z.; Tan, B.; Ramanujan, R. Phase transitions and hard magnetic properties for rapidly solidified MnAl alloys doped with C, B, and rare earth elements. J. Mater. Sci. 2012, 47, 2333–2338. [Google Scholar] [CrossRef]
  97. Huang, J.H.; Kuo, P.C. Sintered MnAl and MnAlC magnets. Mater. Sci. Eng. B 1992, 14, 75–79. [Google Scholar] [CrossRef]
  98. Nagata, Y.; Sano, H.; Ohta, K. Hard Magnetic MnAl and MnBi Ribbons Made from Molten State by Rapid Cooling. Jpn. J. Appl. Phys. 1984, 23, 580–584. [Google Scholar] [CrossRef]
  99. Skomski, R.; Manchanda, P.; Kumar, P.K.; Balamurugan, B.; Kashyap, A.; Sellmyer, D.J. Predicting the future of permanent-magnet materials. IEEE Trans. Magn. 2013, 49, 3215–3220. [Google Scholar] [CrossRef]
  100. Hirian, R.; Dudric, R.; Isnard, O.; Barbu-Tudoran, L.; Pop, V. Influence of heat treatment, near the temperature region of Fe α-γ transformation, on the interphase exchange coupling of Nd2Fe14B + Fe nanocomposites. J. Magn. Magn. Mater. 2021, 520, 166960. [Google Scholar] [CrossRef]
  101. Neupane, D.; Ghimire, M.; Adhikari, H.; Lisfi, A.; Mishra, S.R. Synthesis and magnetic study of magnetically hard-soft SrFe12-yAlyO19-xWt.% Ni0.5Zn0.5Fe2O4 nanocomposites. AIP Adv. 2017, 7, 055602. [Google Scholar] [CrossRef]
  102. Dahal, J.; Neupane, D.; Mishra, S. Exchange-Coupling Behavior in SrFe12O19/La0.7Sr0.3MnO3 Nanocomposites. Ceramics 2019, 2, 10. [Google Scholar] [CrossRef]
  103. Gao, R.W.; Zhang, D.H.; Li, W.; Li, X.M.; Zhang, J.C. Hard magnetic property and δM(H) plot for sintered NdFeB magnet. J. Magn. Magn. Mater. 2000, 208, 239–243. [Google Scholar] [CrossRef]
  104. Attyabi, S.N.; Radmanesh, S.M.A.; Ebrahimi, S.A.S.; Dehghan, H. The Synthesis and Characterization of Hard-Soft Mn52Al45.7C2.3-α-Fe Nanocomposite Magnets. J. Supercond. Nov. Magn. 2022, 35, 1229–1240. [Google Scholar] [CrossRef]
  105. Ma, C. Magnetic properties of exchange coupled SmCo5/FeCo composite particles synthesized by magnetic self-assembly. Chem. Phys. Lett. 2018, 696, 31–35. [Google Scholar] [CrossRef]
  106. Coey, J.M.D. Perspectives in permanent magnetism. J. Magn. Magn. Mater. 1995, 140–144 Pt 2, 1041–1044. [Google Scholar] [CrossRef]
  107. Kang, K.; Lewis, L.H. Recoil hysteresis of Sm-Co/Fe exchange-spring bilayers. J. Appl. Phys. 2005, 98, 113906. [Google Scholar] [CrossRef]
  108. Zheng, B.; Zhang, H.-W.; Zhao, S.-F.; Chen, J.-L.; Wu, G.-H. The physical origin of open recoil loops in nanocrystalline permanent magnets. Appl. Phys. Lett. 2008, 93, 182503. [Google Scholar] [CrossRef]
  109. Rong, C.-b.; Liu, J.P. Grain boundary contribution to recoil loop openness of exchange-coupled nanocrystalline magnets. Appl. Phys. Lett. 2009, 94, 172510. [Google Scholar] [CrossRef]
  110. Choi, Y.; Jiang, J.S.; Pearson, J.E.; Bader, S.D.; Liu, J.P. Origin of recoil hysteresis loops in Sm-Co/Fe exchange-spring magnets. Appl. Phys. Lett. 2007, 91, 022502. [Google Scholar] [CrossRef]
  111. Wohlfarth, E.P. Relations between Different Modes of Acquisition of the Remanent Magnetization of Ferromagnetic Particles. J. Appl. Phys. 1958, 29, 595–596. [Google Scholar] [CrossRef]
  112. Zeng, W.; Yang, H.; Wu, Q.; Pan, M.; Yu, N.; Gu, Y.; Ge, H. Effect of the Ga Content on the Magnetic Properties and Microstructure of the Nanocrystalline Ce-Fe-B Alloys. J. Supercond. Nov. Magn. 2021, 34, 1225–1229. [Google Scholar] [CrossRef]
  113. Birčáková, Z.; Kollár, P.; Jakubčin, M.; Füzer, J.; Bureš, R.; Fáberová, M. Reversible and irreversible magnetization processes along DC hysteresis loops of Fe-based composite materials. J. Magn. Magn. Mater. 2019, 483, 183–190. [Google Scholar] [CrossRef]
  114. Miyaura, A.; Kawaguchi, T.; Hagiwara, M.; Fujihara, S. Controlled 90° domain wall motion in BaTiO3 piezoelectric ceramics modified with acceptor ions localized near grain boundaries. SN Appl. Sci. 2019, 1, 286. [Google Scholar] [CrossRef]
  115. Liu, L.; Liu, Z.; Zhang, X.; Feng, Y.; Wang, C.; Sun, Y.; Lee, D.; Yan, A.; Wu, Q. Magnetization reversal process in (Sm, Dy, Gd) (Co, Fe, Cu, Zr)z magnets with different cellular structures. AIP Adv. 2017, 7, 056221. [Google Scholar] [CrossRef]
  116. Ilse, S.E.; Groß, F.; Schütz, G.; Gräfe, J.; Goering, E. Understanding the interaction of soft and hard magnetic components in NdFeB with first-order reversal curves. Phys. Rev. B 2021, 103, 024425. [Google Scholar] [CrossRef]
  117. Dobrotă, C.-I.; Stancu, A. What does a first-order reversal curve diagram really mean? A study case: Array of ferromagnetic nanowires. J. Appl. Phys. 2013, 113, 043928. [Google Scholar] [CrossRef]
  118. Groß, F.; Ilse, S.E.; Schütz, G.; Gräfe, J.; Goering, E. Interpreting first-order reversal curves beyond the Preisach model: An experimental permalloy microarray investigation. Phys. Rev. B 2019, 99, 064401. [Google Scholar] [CrossRef]
  119. Pike, C.R.; Roberts, A.P.; Verosub, K.L. Characterizing interactions in fine magnetic particle systems using first order reversal curves. J. Appl. Phys. 1999, 85, 6660–6667. [Google Scholar] [CrossRef]
  120. Pike, C.R.; Roberts, A.P.; Dekkers, M.J.; Verosub, K.L. An investigation of multi-domain hysteresis mechanisms using FORC diagrams. Phys. Earth Planet. Inter. 2001, 126, 11–25. [Google Scholar] [CrossRef]
  121. Pike, C.R. First-order reversal-curve diagrams and reversible magnetization. Phys. Rev. B 2003, 68, 104424. [Google Scholar] [CrossRef]
  122. Egli, R.; Winklhofer, M. Recent Developments on Processing and Interpretation Aspects of First-Order Reversal Curves (FORC). Cepия Ecтественные науки 2014, 156, 14–53. [Google Scholar]
  123. Chen, A.; Egli, R.; Moskowitz, B. First-order reversal curve (FORC) diagrams of natural and cultured biogenic magnetic particles. J. Geophys. Res. 2007, 112, B08S90. [Google Scholar] [CrossRef]
  124. Roy, D.; Anil Kumar, P.S. Exchange spring behaviour in SrFe12O19-CoFe2O4 nanocomposites. AIP Adv. 2015, 5, 077137. [Google Scholar] [CrossRef]
  125. Panagiotopoulos, I. A simple approach to the First Order Reversal Curves (FORC) of two-phase magnetic systems. J. Magn. Magn. Mater. 2011, 323, 2148–2153. [Google Scholar] [CrossRef]
  126. Muxworthy, A.R.; Roberts, A.P. First-Order Reversal Curve (FORC) Diagrams. In Encyclopedia of Geomagnetism and Paleomagnetism; Gubbins, D., Herrero-Bervera, E., Eds.; Springer: Dordrecht, The Netherlands, 2007; pp. 266–272. [Google Scholar]
  127. Roberts, A.P.; Pike, C.R.; Verosub, K.L. First-order reversal curve diagrams: A new tool for characterizing the magnetic properties of natural samples. J. Geophys. Res. Solid Earth 2000, 105, 28461–28475. [Google Scholar] [CrossRef]
  128. Volodchenkov, A.D.; Kodera, Y.; Garay, J.E. Synthesis of strontium ferrite/iron oxide exchange coupled nano-powders with improved energy product for rare earth free permanent magnet applications. J. Mater. Chem. C 2016, 4, 5593–5601. [Google Scholar] [CrossRef]
  129. Egli, R. Theoretical aspects of dipolar interactions and their appearance in first-order reversal curves of thermally activated single-domain particles. J. Geophys. Res. 2006, 111, B12S17. [Google Scholar] [CrossRef]
  130. Oroujizad, S.; Almasi-Kashi, M.; Alikhanzadeh-Arani, S. A FORC investigation into the effect of Cu additive on magnetic characteristics of Co-Ni alloy nanoparticles. J. Magn. Magn. Mater. 2019, 473, 169–175. [Google Scholar] [CrossRef]
  131. Kafrouni, L.; Savadogo, O. Recent progress on magnetic nanoparticles for magnetic hyperthermia. Prog. Biomater. 2016, 5, 147–160. [Google Scholar] [CrossRef]
  132. Butler, R.F.; Banerjee, S.K. Theoretical single-domain grain size range in magnetite and titanomagnetite. J. Geophys. Res. 1975, 80, 4049–4058. [Google Scholar] [CrossRef]
Figure 1. XRD patterns of Fe NPs, Mn-Al-C alloy, and magnetic composite samples.
Nanomaterials 12 03303 g001
Figure 2. (a) Hysteresis loops of Mn-Al-C alloy, Mn-Al-C-α-Fe nanocomposite alloys with different amounts of α-Fe annealed at 400 °C for 30 min; (b) hysteresis loops of α-Fe and Mn-Al-C alloy without annealing.
Nanomaterials 12 03303 g002
Figure 3. Switching field distribution curves of samples.
Nanomaterials 12 03303 g003
Figure 4. Henkel plots of the samples.
Nanomaterials 12 03303 g004
Figure 5. (ae) Recoil demagnetization curves, (fj) magnetization curves M(H) and dc demagnetization remanence Md(H) vs applied reversal field.
Nanomaterials 12 03303 g005aNanomaterials 12 03303 g005b
Figure 6. (a) Recoil curves showing critical parameters, and (b) comparison of reversible magnetization as a function of applied reversal field for Mn-Al-C and F5 samples.
Nanomaterials 12 03303 g006
Figure 7. Irreversible magnetization vs applied reversal field for Mn-Al-C and F5 samples.
Nanomaterials 12 03303 g007
Figure 8. The calculated FORC analysis for sample F5 (milled and annealed at 400 °C); (a) a set of FORC measurements; (bd) 3D and 2D diagrams calculated according to part a; (e) Day plot diagram; (f) cross section of the fork diagram with the maximum coercivity distribution (along the axis Hc = 0); (g,h) cross section of maximum interaction distribution along the axis Hu = 0 and Hu = 3.5 kOe.
Nanomaterials 12 03303 g008
Table 1. Alloy samples with different α-Fe content.
SampleComposition
F0Mn-Al-C
F5Mn-Al-C-0.05α-Fe
F10Mn-Al-C-0.1α-Fe
F15Mn-Al-C-0.15α-Fe
F20Mn-Al-C-0.2α-Fe
Table 2. Properties reported on the Mn-Al alloy, and comparison with the present work.
CompositionMs
(emu/g)
Mr
(emu/g)
Hc
(kOe)
(BH)max
(MGOe)
MethodRef.
Mn52Al45.7C2.3 + 5 wt.% Fe76463.31.6VIM + HEBM + mix HEBM + HTThis work
Mn55Al4575–65353.5 PFC + CR[21]
Mn53Al45C2 58~1.9 * AM and IM + HD[28]
Mn53.35Al43.65V375.8352.13 AM + SRMS + HT[29]
Mn54Al46125~352.041.42IM + RMS + HT + BM + SPS[30]
B-N-doped MnAl79 40~3.9 * IM + HPT[31]
(Mn0.54Al0.46) 99.8Tb0.2~31~145.43 AM + MSHT + HEBM[32]
79.71912.3 ED + HT[33]
Mn54Al460–5525–53–4.2 GA + SABM[23]
Mn:Al:C = 54:46:2.44~91 ~39 ~2.8–3.4 * IM + HT + P[34]
70.01 wt. %Mn, 29.48 wt. %Al
and 0.51 wt. %C
932.77IM + E+HT[35]
Mn53.3Al45C1.7/FeCo (95/5 wt. %)76.43 32.71 ~2.77 *0.7MS and AM + BM + P and S[36]
Mn55Al45118.2 ~451.5 IM + SRMS[37]
Mn55Al45C2108200.7 IM + A[38]
(Mn0.54Al0.46) 100-xCx, x = 386.7 ~353.26 AM + HEBM[39]
MnAl/Co-252432.7523.38 [40]
Mn54.2Al43.8C2111.78501.87.8HEBM + A+aged[41]
Mn54Al46Cx, x = 2~125~42~2.3 * IM + CR[42]
Mn54Al46~55~28~2.5 GA + SABM + A[43]
Mn54Al46 (MnAlSi0.5)70.333~4.5 * IM + SAHEBM[44]
Mn48Al5296~77~3 MAS + A[45]
(Mn57Al43) 100C1.198036.701.47 GA + mixpolymer + E[46]
(Mn0·54Al0.46) 98C280 ~461.47 VAM + MS[47]
Mn54.3Al44C1.788 ~371.6 0.66AM + cryomilled HEBM+[25]
Mn1.1Al0.9C0.0299291.6 Cryomilled + Flash heat[48]
Mn55Al45~71~142 AM + MS[49]
Mn0.55Al0.45C0.0285 ~43~1.5 *0.78MA + A[50]
Mn54Al46C2.44~60~28~2.9 * IM + MS + A + P[51]
MnAlC (70.03 wt.% Mn, 29.28 wt.% Al and 0.69 wt.% C)95~40~2.2 * SSR + A + HT + HP[14]
Mn56Al4463.9 ~242.8 IM + SC + G[52]
Mn54Al46~10–43~5–253–4 GA + SABM + A[19]
Mn54Al4622.6 12.94.9 GA + MM + A[18]
MnAl thin film/FeCO (8 nm)~90~81~3.44.7DC MAS + Post A[53]
Mn53Al45C2~8772~2.85 *3.0IM + CW + R[24]
Mn54Al46105~20~1.2 * high-frequency VIM + A[54]
Mn51Al46C3~443222.83 AM + SABM + A[55]
MnAlCo15.1 ~50.85 [56]
(Mn, Fe) Al77~543.8 2.0UHV-MAS + A[57]
Mn54Al4650.824~2.8 * AM + MS + cryomilled HEBM[58]
Mn57Al43~62 ~355.3 AM + MS + A+BM[15]
(Mn0.55Al0.45) 100C283342.8 IM + G + HEBM[59]
Mn54Al46~29 161.8 AM + HEBM + A[60]
Mn53Al45C29872~1.6 * IM + HE[61]
Mn54Al4610873~3.73.1AM + SRMS + A[16]
Mn54Al4639.8 ~234.2 GA + ε-phase + MM + ECAE[17]
Mn54Al4660 ~32 3.62 GA + MM + HT[62]
70~62~8.1 4.44MBES + A[63]
Mn54Al46 + 10 wt%Fe~16 ~6 ~3.3 * IM + mix + HSV BM + A[14]
98.3 4.7M + Q(ε-phase) + A[64]
Mn68.8Al29.98Ni0.78C0.4448~351.5 DC MAS[65]
70.7Mn 28.2Al 1.1 C85393.41.29MA(HEBM) + CC + HT[66]
Mn1.074 Al0.871 C0.05584 2.8 5.5WE[67]
71.5 Mn, 27.9Al, 0.6 C73 0.32 1.32 Alloy + Q + HT[68]
Mn55Al4583492.141.6M + rapid Q(ε-phase) + HT[69]
Mn (56at. %) Al (44at. %)28 ~12 2.44 MA + SPS + Rapid thermal A[70]
Mn53.3Al45C1.7~80 54.8 ~2.8~2AM + HEBM + A[71]
Mn54Al44C28448~1.8 IM + MS + M + SPS[72]
Mn–30 wt.% Al~60 41.23.1 1.59IM + GA(ε-phase) + BM + HT[73]
(Mn20Al80) 0.95C0.05 8.8 5.6 MA + PAD + HT[74]
Mn54Al4689 45 4.8 AM + HEBM + A[75]
Mn54Al44C292521.71.5VIM + SRMS[76]
Mn54Al4687 ~38 4.8 AM + HEBM + A[77]
Mn-29%Al-0.5%C-0.5%Ni 60 1.95 1.43AM + HEBM + HT[78]
~40 24 2.3 MA(HEBM) + HT[79]
Mn53.5Al44.5C282502.2 1.8AM + HEBM + HT + HD[80]
Mn54Al44C286 41~1.7 * M + MS + cryogenic MM + SPS[81]
~75 32 2 IM + HD[82]
Mn54Al46~75 ~41 ~3.7 * AM + VibrationM + post A[83]
Mn55Al44 + 2.0 wt.% MWCNT82.345.6 3.64 2.26AM + mix + HEBM + SPS[84]
Al-55at.%Mn72.2 ~30 ~1.5 * IM + Q (ε-phase) + IFHT[85]
Mn53.5Al44.5C283512.21.8AM + HD[86]
Mn54Al46~5 ~3 ~2.4 MA(HEBM) + SPS[87]
Mn (56 at. %) and Al (44 at. %)40.3~19 2.3 MA + mix + HEBM + SPS[88]
Mn54Al43C3~59 ~40 3.6 AM + MS(ε phase) + HEBM + HT[89]
Mn54Al44C2~90~46~1.9 * IM + MS + A[90]
Mn0.53 Al 0.46 C0.0181 28 2.2 MA + M + HT + AA[91]
50%Mn-50%Al52 ~21 2.6 MA(HEBM) + two-step HT[92]
~110 ~36 1.95 mix (HEBM) + M+ vibration M + HPS[93]
Mn54Al44C260.34 37.36 3.8 MS + HEBM + A[94]
Mn0.53Al0.46C0.0172 37 1.9 0.6MA(HEBM) + A[95]
Mn53.3Al45C1.7127461.541.53AM + SRMS[96]
70.5 wt.%Mn-29.5 wt.%A1, 0.8 wt.% C 431.51.2IM + Q (ε-phase) + BM + A + CC + S[97]
571.83 2.1IM + SRMS + HT[98]
* Unit conversion from T to MGOe according to 1T = 0.01 MGOe. Abbreviations: M = melt; AM = arc melt; VAM = vacuum arc melting; IM = induction melt; VIM = vacuum induction melt; HD = hot-deformation; SRMS = single-roller melt-spinning; RMS = roller melt-spinning; MS = melt-spinning; HT = heat treatment; HEBM = high energy ball milling; SABM = surfactant-assisted ball milled; BM = ball milling; SPS = spark plasma sintering; HPT = high pressure torsion; HPS = high-pressure synthesis; HP= high press; P = press; ED = electrodeposite; GA = Gas-atomized; HE= hot extruded; WE = warm extruded; E = extruded; A = aged; MA = mechanical alloying; MM= Mechanical milling; S = sinter; A = annealing; CR = cold rolling; CC = cold compact; CW = cold worked; SAHEBM = salt-assisted high-energy ball milling; MAS = magnetron sputtering; SSR = solid-state reaction; SC = strip casting; G = grind; R = recovered; ECAE = equal channel angular extrusion; MBES = molecular-beam epitaxy system; HSV BM = high-speed vibration ball mill; Q = quench; PAD = plasma arc discharge; IFHT = In-field heat treatment; AA = ambient aging; PFC = planar flow casting.
Publisher’s Note: MDPI stays neutral with regard to jurisdictional claims in published maps and institutional affiliations.

