Article

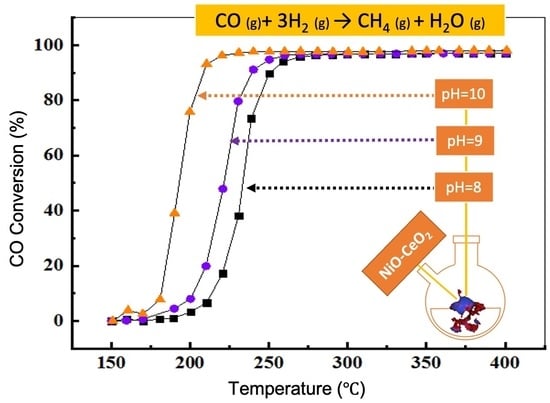
CO Methanation over NiO-CeO2 Mixed-Oxide Catalysts Prepared by a Modified Co-Precipitation Method: Effect of the Preparation pH on the Catalytic Performance

by
Amar Bendieb Aberkane
1,*,
María Pilar Yeste
2,
Fayçal Djazi
1 and
Miguel Ángel Cauqui
2,*
1
Laboratoire de Recherche sur la Physico-Chimie des Surfaces et Interfaces (LRPCSI), Faculté de Technologie, Département de Génie des Procédés, Université 20 Août 1955-Skikda, BP 26, Route d’El Hadaiek, Skikda 21000, Algeria
2
Departamento de Ciencia de los Materiales e Ingeniería Metalúrgica y Química Inorgánica, Universidad de Cádiz, Campus Río San Pedro s/n, 11510 Cádiz, Spain
*
Authors to whom correspondence should be addressed.
Nanomaterials 2022, 12(15), 2627; https://doi.org/10.3390/nano12152627
Submission received: 7 July 2022 / Revised: 26 July 2022 / Accepted: 26 July 2022 / Published: 30 July 2022

Abstract

:
In this study, a series of NiO-CeO2 mixed-oxide catalysts have been prepared by a modified co-precipitation method similar to the one used for the synthesis of hydrotalcites. The syntheses were carried out at different pH values (8, 9 and 10), in order to determine the influence of this synthetic variable on the properties of the obtained materials. These materials were characterized by using different techniques, such as TGA, XRD, ICP, N2 adsorption-desorption isotherms, H2 temperature-programmed reduction (H2-TPR), and electron microscopy, including high-angle annular dark-field transmission electron microscopy (HAADF-TEM) and EDS. The characterization results revealed the influence of the preparation method, in general, and of the pH value, in particular, on the textural properties of the oxides, as well as on the dispersion of the Ni species. The catalyst prepared at a higher pH value (pH = 10) was the one that exhibited better behavior in the CO methanation reaction (almost 100% CO conversion at 235 °C), which is attributed to the achievement, under these synthetic conditions, of a combination of properties (metal dispersion, specific surface area, porosity) more suitable for the reaction.

Graphical Abstract

1. Introduction

CO methanation is a chemical process in which methane (CH4) is obtained from syngas (Equation (1)). It has attracted much attention in recent years, in relation to: (i) the removal of residual CO fractions in large ammonia production plants, or in hydrogen-rich gases feeding proton exchange membrane fuel cells (PEMFCs) [1,2], and (ii) the production of synthetic natural gas (SNG), in a process in which syngas is previously obtained by gasification of coal or biomass [3]. With the development of so-called ‘green’ hydrogen [4], CO methanation has also found a potential application in energy storage.
CO ( g ) + 3 H 2 ( g ) CH 4 ( g ) + H 2 O ( g )     Δ H 298 0 = 206   kJ / mol
Considering both thermodynamic and kinetic factors, it is favoured under low temperature and high pressure, or high temperature experimental conditions. In recent decades, much research has focused on the development of stable, highly active and selective CO methanation catalysts. Due to their high activity and low price, Ni-based catalysts have often been proposed as the best option for activating the reaction. The effect of the support has also proved to be particularly important [5,6,7,8]. Thus, for example, Le et al. investigated Ni catalysts supported on different supports such as Al2O3, SiO2, TiO2, ZrO2 and CeO2 and determined that, of these, CeO2 was the most active for CO methanation [5]. As is well established, the catalytic properties of CeO2 are due to its unique oxygen storage capacity, its redox properties, and the possibility of exhibiting oxygen vacancies under a wide range of conditions.
CO methanation is a structure-sensitive reaction and, therefore, parameters such as the size of the metal particles significantly affect the activity and selectivity of the catalysts [9,10,11]. In reference to this, different synthetic approaches have been reported that allow influence over these parameters. For example, high surface area and active Ni/CeO2 catalysts were prepared, by using a surfactant-assisted co-precipitation method [12]. Hard-templated mesoporous NiO-CeO2 mixed oxides, with different Ni/Ce molar ratios, were also found very active and highly selective to CH4 [13]. Yan et al. [14] reported that the control of nucleation and crystal growth, induced by plasma decomposition of nickel precursor in Ni/SiO2, resulted in improved activity and enhanced coke resistance, compared with analogous systems prepared by thermal decomposition. Jiang et al. reported the preparation of a Ni/Al2O3 catalyst with an NiO loading of 40 wt% through a novel cation-anion double-hydrolysis strategy. The resulting Ni/Al2O3 catalyst showed high Ni dispersion with small particle size (<5 nm), despite the high metal loading. Upon promotion with Zr, the catalyst exhibited improved catalytic performance, mainly attributable to the high degree of Ni dispersion and the abundance of oxygen vacancies, which enhanced the adsorption and dissociation of CO [15]. Traditional methods, including impregnation, sol-gel, deposition-precipitation or hydrothermal synthesis, have also been applied [16,17,18,19]. Although all these synthetic procedures were aimed at improving Ni dispersion, some other parameters, such as support texture and metal-support interaction, have also been highlighted in these investigations as playing a key role in the catalytic performance of Ni for CO methanation; however, the relative influence of these parameters on the final behaviour of the material is often unclear.
In this paper, we report on the synthesis of a series of NiO-CeO2 mixed oxides prepared by using a modified co-precipitation method similar to the one used for the synthesis of hydrotalcites. Hydrotalcite-like materials are an important class of inorganic solids, having a structural similarity with the hydrotalcite mineral Mg6Al2(OH)16CO3·4H2O. They exhibit the general formula [M2+1−xM3+x(OH)2][An]x/n·yH2O, where M2+ and M3+ refer to divalent and trivalent metal cations, respectively (Ni2+ and Ce3+ in our case), and An is a charge-compensating anion sandwiched between the cationic layers (CO32−, OH, etc.). The molar ratio [M3+/(M2+ + M3+)] normally varies between 0.2 and 0.4. As reported in a recent review by Kumari et al. [20], hydrotalcite-like materials (and mixed metal oxides derived from their calcination) exhibit unique characteristics for heterogeneous catalytic applications, such as thermal stability and the possibility of tailoring properties, such as basicity/acidity, specific surface area, or porosity. It is also likely that the interaction between M2+(Ni) and M3+(Ce) species differs from that obtained by conventional co-precipitation methods. The pH value has been used as a synthesis variable in order to determine its influence on the properties of the final product. Through the application of different characterisation techniques, results have been obtained that provide insight into the influence of parameters—such as the available Ni surface area, the Ni–CeO2 interaction, and the textural properties of these materials—on their performance in the CO methanation reaction.

2. Materials and Methods

2.1. Preparation of Catalysts

Ni–Ce mixed oxides with a calculated molar ratio Ni/Ce = 3 were obtained by co-precipitation following the hydrotalcite route at pH values of 8, 9, and 10 (±0.22).
Ni(NO3)2·6H2O [Sigma Aldrich, Schnelldorf, Germany, 98%] and Ce(NO3)3·6H2O, [Sigma Aldrich, Schnelldorf, Germany, 99%] were used as precursors. An aqueous solution of these precursors, with the appropriate Ni/Ce molar ratio (Ni(NO3)2·6H2O (0.6 M), Ce(NO3)3·6H2O (0.2 M), formed solution A. Na2CO3 (Cheminova International S.A, Madrid, Spain, 98%) was dissolved in water, to obtain the alkaline solution, B (0.16 M). Solution A was added dropwise to solution B under vigorous stirring, using a NaOH solution (2M) for pH control. After 24 h at room temperature, the precipitates were transferred to the reflux system and stirred at 85 °C for 24 h. The resulting gels were washed with pure water and ethanol several times to remove any excess salts. After filtration and washing/centrifugation, the solids were dried overnight in an oven at 100 °C. Finally, the samples were calcined in a muffle furnace at 600 °C for 1 h, with a heating ramp of 10 °C/min. The resulting materials were denoted as NiOCeO2-8, NiOCeO2-9, and NiOCeO2-10, where the numbers indicate the pH used in the synthesis.

2.2. Catalysts Characterization

Thermogravimetric analysis (TGA) was used to identify the optimum calcination temperature. The analyses were carried out using a thermogravimetric analyser (TA instruments Q50). The samples were heated in air to 900 °C at a rate of 10 °C/min.
Powder X-ray experiments were carried out on a Bruker D8 Advance A-25 diffractometer working in Bragg-Brentano geometry, using Cu Kα radiation (λ = 1.54 Å) as the radiation source. X-ray diffractograms were collected at room temperature over the 2 Theta range from 10 to 80°, with a stepwise increment of 0.02° and an acquisition time of 3 s at every angle. After the data collection, the XRD pattern analyses of all samples were identified in accordance with the reference patterns recorded in the JCPDS database. Scherrer and Bragg equations were used to estimate the crystallite size and lattice parameters.
The Ni content in the prepared catalysts was determined using inductively coupled plasma atomic emission spectroscopy (ICP-AES) (thermo elemental IRIS Intrepid model, Thermo Fisher Scientific, Waltham, MA, USA).
The SBET (specific surface area) of the catalysts were measured by N2 adsorption-desorption isotherms at −196 °C, using an automatic volumetric system (Autosorb iQ3, Quantachrome Instruments, Boynton Beach, FL, USA). Prior to the measurement, the samples were degassed under vacuum for 2 h at 200 °C to remove physically adsorbed components and other adsorbed gases from the catalyst surface. The pore volume of the catalysts was obtained using the BJH method (Barret-Joyner-Halenda).
TPR studies were carried out on a Micromeritics AutoChem II 2920 instrument (Norcross, GA, USA), equipped with a thermal conductivity detector (TCD). For analysis, typically 50 mg of the sample was placed between two plugs of quartz wool in a tubular quartz reactor, then treated under a mixture of 5% H2/Ar at a flow rate of 50 mL/min in the temperature range 30–900 °C at a heating rate of 10 °C/min. The hydrogen consumption was quantitatively determined after calibration of the TCD response, using CuO as a standard.
The Ni dispersion, Ni metallic surface area and metallic Ni particle size of the prepared catalysts were estimated by hydrogen chemisorption at 35 °C (using a Micromeritics ASAP 2020C Instrument, Norcross, GA, USA). In a typical run, 150 mg of the sample were reduced in situ under H2 (5%)/Ar (60 mL/min) flow at 650 °C for 1 h. After reduction, the sample was kept in He flow at 650 °C for 1 h and then cooled in vacuum at 35 °C under He flow. The values for Ni dispersion (DNi), metal surface area (SNi) and Ni particle size (dNi) were provided directly by the instrument software and estimated using Equations (2)–(4).
D Ni ( % ) = V m W Ni V molar M c F s 100 × 100
S Ni ( m 2 / g ) = V m N A F s A Ni V molar
d Ni ( nm ) = 60 M c ρ Ni S Ni
where Vm is the volume of hydrogen chemisorbed (cm3 g−1), Vmolar is the molar volume of hydrogen (cm3 mol−1), Mc is the Ni percentage by weight, WNi is the atomic weight of Ni (g mol−1), ANi is the cross-sectional area of Ni atom (m2 atom−1), ρNi is the Ni density (g cm−3) and Fs is the stoichiometry factor, which expresses the ratio between the number of active metal atoms and the number of adsorbate molecules (Nis/H2). In this case, an Fs of 2 was assumed.
Scanning transmission electron microscopy (STEM) studies, both in high-angle annular dark-field (HAADF) and analytical X-ray energy dispersive spectroscopy (XEDS) modes, were performed in a JEOL 2010 F microscope (JEOL, Peabody, MA, USA), operating at 200 kV, with a structural resolution of 0.19 nm.
The NiOCeO2 catalysts were tested in CO methanation reaction under atmospheric pressure using a fixed bed reactor system. Typically, 50 mg of catalyst was diluted with 100 mg of SiC to avoid the generation of hotspots in the catalyst bed during the reaction. The catalyst/SiC mixture was loaded into the quartz reactor (internal diameter = 6 mm and length = 235 mm) and brought into contact with a feed composed of 1 mol% CO, 50 mol% H2, and 49 mol%He at a flow rate of 100 mL/min in the reaction temperature range 150–400 °C and gas hourly space velocity (GHSV) of 120,000 mL/g·h. The flow rate of inlet and outlet gases were controlled with a mass flow controller (MFC). To measure the reaction temperature, a thermocouple was placed in the catalyst bed. Prior to the catalytic activity tests, the samples were subjected to an activation treatment. This treatment consisted of a reduction in the catalyst, under 5% H2/Ar (100 mL/min) for 1 h at 650 °C and atmospheric pressure. A PFEIFFER quadrupole mass spectrometer, model Thermostar QME-200-D35614 (Pfeiffer Vacuum GmbH, Aßlar, Germany) was also used, to quantify the gases at the inlet and the outlet. The activity results are presented as a total percentage of the conversion of CO (and CH4 yield) as a function of the reaction temperature.
CO   Conversion   ( % ) = C COin C COout C COin 100
CH 4   Yield   ( % ) = C CH 4 out C COin 100
here, CCOin represents the concentration of CO in the feed stream and CCOout (CCH4out), denote the concentration of CO and CH4 in the output stream.

3. Results

3.1. Catalysts Characterization

The TGA results (not shown) for our precursors indicated that above 600 °C no weight loss (corresponding to residual carbonates or nitrates species) was observed. This temperature was selected for calcination of the as-synthesised samples. Once calcined, the samples were characterized, to determine their chemical composition, structure and textural properties. The results of this characterization were discussed in detail elsewhere [21] and are gathered in Table 1. A CeO2 sample, prepared using the same synthetic method described for the mixed oxides (at pH = 8), was used as a reference in XRD experiments.
The fluorite-like structure of CeO2 and the cubic form of NiO were the only crystalline phases observed in the XRD patterns. The calculated lattice parameters are close to those reported for standard cubic NiO (4.177 Å) [22] and CeO2 (5.410 Å) [23]. However, in the case of CeO2 crystallites, a slight decrease of this parameter was observed as the pH of the preparation decreased, which can be interpreted, according to the literature, by the incorporation of Ni2+ species into the CeO2 lattice [22,24]. This incorporation will occur more noticeably in NiOCeO2-8 and NiOCeO2-9 samples.
As can be seen from results in Table 1, NiO crystallites are larger than CeO2 crystallites, and they become gradually smaller when the pH of the synthesis increases from 8 to 10. It is also important to note that the size of CeO2 crystallites is significantly smaller for NiO-CeO2 mixed oxides when compared to pure CeO2, suggesting that ceria crystallization is influenced by the presence of NiO.
With regard to the results obtained from the N2 adsorption-desorption isotherms, these NiO-CeO2 catalysts are mesoporous and have a medium specific surface area, which increases as the pH of the preparation increases, in close agreement with the results for the crystallite sizes, as discussed above. Thus, the highest surface area was obtained for the NiOCeO2-10 sample. It is also noteworthy that the pore size distribution obtained for this oxide is much narrower (homogeneous) and shifted towards smaller pores, even though it has a much higher total pore volume than the samples obtained at lower pH (Figure 1). These results point to differentiated textural properties in the case of sample NiOCeO2-10, in relation to samples NiOCeO2-9 and NiOCeO2-8.
The ability of a material to activate the CO methanation reaction is often associated with its greater, or lesser, facility to form oxygen vacancies [15,25]. The temperature-programmed reduction (TPR) technique can provide relevant information in this respect. Figure 2 shows the traces monitored on the TDC detector corresponding to H2 consumption during TPR experiments. As can be seen in this figure, very similar reduction profiles were obtained for the three NiO-CeO2 mixed oxides. We observed an intense and asymmetric peak above 350–360 °C and also some small contributions at lower temperatures. Therefore, all reduction processes (including Ni2+→Ni and Ce4+→Ce3+) took place at temperatures below 400 °C, in contrast to the CeO2-8 sample, which was reduced at higher temperatures.
The position of the main peak is commonly correlated in the literature with the size of the NiO particles (larger particles are reduced at higher temperatures) and/or with the strength of the NiO-support interaction (stronger interactions result in higher reduction temperatures) [26,27]. In this case, as the pH value of the preparation increased, the peak shifted slightly, towards lower temperatures. This effect could be explained in terms of the decrease in crystallite sizes with pH, observed by XRD. However, the existence of a difference in the degree of interaction between NiO and CeO2, depending on the synthetic conditions, cannot be discarded. The peaks observed at low temperatures can be attributed to the reduction of oxygen adsorbed on the vacancies caused by the incorporation of Ni2+ within the CeO2 network, or to the reduction of surface adsorbed oxygen species easily accessible to H2 at low temperatures [19,26,28].
The Ni dispersion and some other related parameters (Ni particle size and Ni surface area) were estimated by H2 chemisorption. As can be seen in Table 2, the Ni dispersion values are very similar for the NiOCeO2-8 and NiOCeO2-9 catalysts, with only a very slight decrease observed for the latter. In contrast, raising the pH of the synthesis up to 10 resulted in a significant decrease of the dispersion by a factor of more than 3. Equivalent trends were obtained for Ni surface area, and particle size. These results are particularly interesting if we consider the N NiO-crystallite size values obtained via XRD (very similar for the three samples) and seem to indicate that the reduction treatment results in a much lower metallic surface area in the case of the NiOCeO2-10 sample.
According to these results, it would be reasonable to expect to see a significant influence exerted by the preparation pH on the catalytic behaviour of these oxides, and, in particular, it would be sample NiOCeO2-10 that, in principle, should offer the worst performance, because it is the one with the lowest metal surface available for the reaction.
Complementing the chemisorption results with others obtained using more direct techniques, such as electron microscopy, provides a more realistic description of the materials studied, in terms of the arrangement of the CeO2 and NiO (Ni) phases. The results obtained in the electron microscopy characterization of the samples are displayed in Figure 3, Figure 4 and Figure 5.
Figure 3 shows a representative TEM image of the as-prepared NiO-CeO2 mixed oxides, in which NiO was found as plate-like particles and CeO2 appeared to form small crystals with a size of about 5 nm. The arrangement of the prepared systems would thus differ from the classical ones characterized by the existence of NiO particles dispersed on the surface of the oxide used as a support (CeO2). The reflections observed in the DDPs (shown as insets) were indexed on the basis of cubic (NiO) and fluorite (CeO2) structures, respectively, in close agreement with the results obtained by XRD.
After reduction treatment at 650 °C in H2(5%)/Ar, Ni appears as crystallites with different sizes, in some cases reaching values of around 40–50 nm, as shown in Figure 4, for samples NiOCeO2-8 and NiOCeO2-10. In order to better identify the different phases and spatial distribution of Ni and Ce, HAADF-STEM images and composition STEM-EDS mappings have been recorded (Figure 5).
Since the intensity of the HAADF-STEM images is proportional to the square of the atomic number of the element, the brightest areas in these images should correspond to the presence of Ce (Z = 58), and those of less intensity should correspond with the presence of Ni (Z = 28). However, because this intensity also depends on the thickness of the sample, the difference in contrast is not always indicative of the element’s distribution. Therefore, the corresponding STEM-EDS maps for the areas observed in the HAADF-STEM images have also been recorded. The combination of both techniques reveals the existence of Ni aggregates of different sizes and morphologies surrounded by CeO2. The images confirm the presence of Ni particles with a high heterogeneity in size, although the limited number of images recorded did not permit reliable size distributions to be obtained. It should be pointed out that, according to the results derived from H2-chemisorption studies, these distributions would be shifted towards larger particle size values in the case of sample NiOCeO2-10.

3.2. Catalytic Activity of NiOCeO2-pH in CO Methanation

The NiOCeO2 catalysts were tested in the catalytic CO methanation reaction. The CO conversion and CH4 yield curves are displayed in Figure 6. As can be deduced from this figure, there is a remarkable difference in the evolution of the curves, thus evidencing the effect of the synthesis pH on the catalytic performance of these materials. Both CO conversion and CH4 yield improve significantly as the pH of the synthesis increases from 8 to 9, and even more markedly from 9 to 10. This effect can be clearly evidenced from the values of temperature required to achieve a 50% CO conversion, which are: 232, 225 and 184 °C for samples NiOCeO2-8, NiOCeO2-9 and NiOCeO2-10, respectively. The CO conversion obtained with the NiOCeO2-10 catalyst at 235 °C was almost complete, while for the NiOCeO2-8 and NiOCeO2-9 catalysts it was necessary to increase the temperature up to 280 °C to achieve maximum conversion values. Similar differences were found in terms of CH4 yield, always indicating the superior response of the NiOCeO2-10 catalyst. For a better comparison of the capacity of the three catalysts to activate the reaction, and also with the aim of correcting for the effect of Ni loading (slightly higher in the case of the sample prepared at pH = 10 according to ICP results), the CO conversion rate and TOF values at low temperature (220 °C) have been calculated (Table 3).
The results shown in Table 3 indicate that when the activity is expressed in terms of Ni mass (or Ni atoms) the differences between the catalysts are even more pronounced. An increase in conversion rates by a factor of ~3 is observed between NiOCeO2-8 and NiOCeO2-9 and by a factor of 5 between NiOCeO2-8 and NiOCeO2-10. Differences in terms of TOF have also been estimated, showing the same trend.
The best performance is obtained with the sample exhibiting the lowest Ni dispersion. This finding agrees with those reported by other authors and points to the already reported structure-sensitive character of CO methanation. For example, Takenaka et al. reported that Ni metal particles with relatively large diameters (about 20−100 nm) were more active in the CO methanation reaction [8]. Aksoylu et al. also investigated structure/activity relationships in coprecipitated nickel-alumina catalysts using CO2 adsorption and methanation. They found that the higher catalytic activity was obtained at high Ni loadings due to the formation of large Ni particles [29]. Gao et al. compared the performance of Ni/Al2O3 and Ni/BHA (BHA: barium hexaaluminate) catalysts, with the same loading, for the production of SNG via CO methanation reaction. The presence of larger Ni particles (20–40 nm) is proposed as one of the explanations for the superior performance of the Ni/BHA catalyst [30].
Beyond metallic dispersion, the textural properties of catalysts (mainly total specific surface area and porosity) have been shown to play an important role in catalysis. In this sense, we must recall that one of the effects of pH on the properties of the oxides was the increase of the specific surface area as the pH of the synthesis increased. In addition, we should also mention the differences observed in the pore-size distribution curves. The NiOCeO2-10 catalyst showed a more homogeneous porosity, characterised by a narrow peak below 40 nm, with a rather small contribution of larger diameter pores. On the other hand, samples prepared at pH 8 and 9 showed a more heterogeneous porosity, with a main contribution around 30–50 nm and a higher relevance of larger pores (>60 nm). Therefore, the effect of these textural properties on the superior performance of NiOCeO2-10 cannot be ruled out, in close agreement with the results reported by Le et al. [5]. These authors evaluated the catalytic performance for CO and CO2 methanation over Ni/CeO2 catalysts with different surface areas and concluded that the catalytic activities increased with increasing CeO2 surface area.
Catalytic stability was evaluated at a fixed temperature (T = 250 °C) during 17 h of time on stream. This temperature was selected because it was the minimum temperature at which the respective highest conversions were simultaneously achieved for the three samples. Figure 7 shows CO conversion curves as a function of time. As can be seen, excellent stability was obtained with the NiOCeO2 catalysts, regardless of the synthesis conditions.

4. Conclusions

A series of NiOCeO2-pH (pH = 8, 9 and 10) mixed oxides was successfully prepared by a variation of the hydrotalcite method. The catalytic activity of these catalysts for CO methanation was investigated. NiOCeO2-pH mixed-oxide catalysts exhibited different physicochemical properties, resulting in catalysts with high activity at low temperature and outstanding stability at high temperature, in CO methanation. It was found that the catalytic activity increased when increasing the pH at which the samples were prepared, with the NiOCeO2-10 catalyst being the most active. The influence of this synthetic parameter on textural properties (higher pH results in higher surface area, narrower porosity distribution and larger Ni particle size) seems to be the reason for such behavior.
The results reported and the conclusions derived from them illustrate the correlation between the three basic axes in materials science: (i) preparation methods (and influence of synthetic variables), (ii) physicochemical properties of the materials obtained and (iii) performance. This correlation is of primary importance at the academic level, and also constitutes the basis for the design of new advanced and efficient materials for industrial applications.

Author Contributions

Conceptualization, A.B.A., M.Á.C. and F.D.; methodology, A.B.A., M.P.Y. and M.Á.C.; investigation, A.B.A. and M.P.Y.; resources, M.P.Y. and M.Á.C.; writing—original draft preparation, A.B.A.; writing—review and editing, M.Á.C.; supervision, M.P.Y., F.D. and M.Á.C.; funding acquisition, M.Á.C. All authors have read and agreed to the published version of the manuscript.

Funding

This research was funded by MCIN/AEI/10.13039/501100011033, project reference PID2020-113006RB-I00. The APC was co-funded by Plan Propio UCA 2022-23.

Institutional Review Board Statement

Not applicable.

Informed Consent Statement

Not applicable.

Acknowledgments

A special thankful to the European Union for the Erasmus+ program scholarship; special thanks to the General Direction for Scientific Research and Technological Development (Direction Générale de la Recherche Scientifique et du Développement Technologique -DGRSTD-, Algeria).

Conflicts of Interest

The authors declare no conflict of interest. The funders had no role in the design of the study; in the collection, analyses, or interpretation of data; in the writing of the manuscript, or in the decision to publish the results.

References

  1. Sehested, J.; Dahl, S.; Jacobsen, J.; Rostrup-Nielsen, J.R. Methanation of CO over nickel: Mechanism and kinetics at high H2/CO ratios. J. Phys. Chem. B 2005, 109, 2432–2438. [Google Scholar] [CrossRef] [PubMed]
  2. Rostrup-Nielsen, J.R.; Aasberg-Petersen, K. Fuel Cell Handbook; Wiley: New York, NY, USA, 2003; Volume 3. [Google Scholar]
  3. Fan, J.; Hong, H.; Jin, H. Biomass and coal co-feed power and SNG polygeneration with chemical looping combustion to reduce carbon footprint for sustainable energy development: Process simulation and thermodynamic assessment. Renew. Energy 2018, 125, 260–269. [Google Scholar] [CrossRef]
  4. Hermesmann, M.; Müller, T.E. Green, Turquoise, Blue, or Grey? Environmentally friendly Hydrogen Production in Transforming Energy Systems. Prog. Energy Combust. Sci. 2022, 90, 100996. [Google Scholar] [CrossRef]
  5. Le, T.A.; Kim, M.S.; Lee, S.H.; Kim, T.W.; Park, E.D. CO and CO2 methanation over supported Ni catalysts. Catal. Today 2017, 293–294, 89–96. [Google Scholar] [CrossRef]
  6. Da Silva, D.C.D.; Letichevsky, S.; Borges, L.E.P.; Appel, L.G. The Ni/ZrO2 catalyst and the methanation of CO and CO2. Int. J. Hydrogen Energy 2012, 37, 8923–8928. [Google Scholar] [CrossRef]
  7. Wang, Y.Z.; Li, F.M.; Cheng, H.M.; Fan, L.Y.; Zhao, Y.X. A comparative study on the catalytic properties of high Ni-loading Ni/SiO2 and low Ni-loading Ni-Ce/SiO2 for CO methanation. Ranliao Huaxue Xuebao/J. Fuel Chem. Technol. 2013, 41, 972–977. [Google Scholar] [CrossRef]
  8. Takenaka, S.; Shimizu, T.; Otsuka, K. Complete removal of carbon monoxide in hydrogen-rich gas stream through methanation over supported metal catalysts. Int. J. Hydrogen Energy 2004, 29, 1065–1073. [Google Scholar] [CrossRef]
  9. Liu, J.X.; Su, H.Y.; Li, W.X. Structure sensitivity of CO methanation on Co (0 0 0 1), (1 0 1 - 2) and (1 1 2 - 0) surfaces: Density functional theory calculations. Catal. Today 2013, 215, 36–42. [Google Scholar] [CrossRef]
  10. Rostrup-Nielsen, J.R.; Pedersen, K.; Sehested, J. High temperature methanation. Sintering and structure sensitivity. Appl. Catal. A Gen. 2007, 330, 134–138. [Google Scholar] [CrossRef]
  11. Panagiotopoulou, P.; Kondarides, D.I.; Verykios, X.E. Selective methanation of CO over supported Ru catalysts. Appl. Catal. B Environ. 2009, 88, 470–478. [Google Scholar] [CrossRef]
  12. Nematollahi, B.; Rezaei, M.; Lay, E.N. Preparation of highly active and stable NiO-CeO2 nanocatalysts for CO selective methanation. Int. J. Hydrogen Energy 2015, 40, 8539–8547. [Google Scholar] [CrossRef]
  13. Rombi, E.; Cutrufello, M.G.; Atzori, L.; Monaci, R.; Ardu, A.; Gazzoli, D.; Deiana, P.; Ferino, I. CO methanation on Ni-Ce mixed oxides prepared by hard template method. Appl. Catal. A Gen. 2016, 515, 144–153. [Google Scholar] [CrossRef]
  14. Yan, X.; Liu, Y.; Zhao, B.; Wang, Z.; Wang, Y.; Liu, C.J. Methanation over Ni/SiO2: Effect of the catalyst preparation methodologies. Int. J. Hydrogen Energy 2013, 38, 2283–2291. [Google Scholar] [CrossRef]
  15. Jiang, P.; Zhao, J.; Han, Y.; Wang, X.; Pei, Y.; Zhang, Z.; Liu, Y.; Ren, J. Highly Active and Dispersed Ni/Al2O3 Catalysts for CO Methanation Prepared by the Cation-Anion Double-Hydrolysis Method: Effects of Zr, Fe, and Ce Promoters. Ind. Eng. Chem. Res. 2019, 58, 11728–11738. [Google Scholar] [CrossRef]
  16. Gao, J.; Liu, Q.; Gu, F.; Liu, B.; Zhong, Z.; Su, F. Recent advances in methanation catalysts for the production of synthetic natural gas. RSC Adv. 2015, 5, 22759–22776. [Google Scholar] [CrossRef]
  17. Wang, Y.; Wu, R.; Zhao, Y. Effect of ZrO2 promoter on structure and catalytic activity of the Ni/SiO2 catalyst for CO methanation in hydrogen-rich gases. Catal. Today 2010, 158, 470–474. [Google Scholar] [CrossRef]
  18. Han, Y.; Zhao, J.; Quan, Y.; Yin, S.; Wu, S.; Ren, J. Highly efficient LaxCe1−xO2−x/2 nanorod-supported nickel catalysts for CO methanation: Effect of la addition. Energy Fuels 2021, 35, 3307–3314. [Google Scholar] [CrossRef]
  19. Liu, X.; Zuo, Y.; Li, L.; Huang, X.; Li, G. Heterosturcture NiO/Ce1−xNixO2: Synthesis and synergistic effect of simultaneous surface modification and internal doping for superior catalytic performance. RSC Adv. 2014, 4, 6397–6406. [Google Scholar] [CrossRef]
  20. Kumari, S.; Sharma, A.; Kumar, S.; Thakur, A.; Thakur, R.; Bhatia, S.K.; Sharma, A.K. Multifaceted potential applicability of hydrotalcite-type anionic clays from green chemistry to environmental sustainability. Chemosphere 2022, 306, 135464. [Google Scholar] [CrossRef]
  21. Aberkane, A.B.; Yeste, M.P.; Fayçal, D.; Goma, D.; Cauqui, M.Á. Catalytic soot oxidation activity of NiO-CeO2 catalysts prepared by a coprecipitation method: Influence of the preparation pH on the catalytic performance. Materials 2019, 12, 3436. [Google Scholar] [CrossRef] [Green Version]
  22. Araújo, A.J.M.; Silva, V.D.; Sousa, A.R.O.; Grilo, J.P.F.; Simões, T.A.; Macedo, D.A.; Nascimento, R.M.; Paskocimas, C.A. Battery-like behavior of Ni-ceria based systems: Synthesis, surface defects and electrochemical assessment. Ceram. Int. 2018, 45, 7157–7165. [Google Scholar] [CrossRef]
  23. Zhang, W.; Niu, X.; Chen, L.; Yuan, F.; Zhu, Y. Soot Combustion over Nanostructured Ceria with Different Morphologies. Nat. Publ. Gr. 2016, 6, 1–10. [Google Scholar] [CrossRef]
  24. Kumar, S.; Kim, Y.J.; Koo, B.H.; Lee, C.G. Structural and magnetic properties of Ni doped CeO2 nanoparticles. J. Nanosci. Nanotechnol. 2010, 10, 7204–7207. [Google Scholar] [CrossRef] [PubMed] [Green Version]
  25. Zhang, M.; Yu, F.; Li, J.; Chen, K.; Yao, Y.; Li, P.; Zhu, M.; Shi, Y.; Wang, Q.; Guo, X. High CO methanation performance of two-dimensional Ni/MgAl layered double oxide with enhanced oxygen vacancies via flash nanoprecipitation. Catalysts 2018, 8, 363. [Google Scholar] [CrossRef] [Green Version]
  26. Atzori, L.; Cutrufello, M.G.; Meloni, D.; Cannas, C.; Gazzoli, D.; Monaci, R.; Sini, M.F. Highly active NiO-CeO2 catalysts for synthetic natural gas production by CO2 methanation. Catal. Today 2018, 299, 183–192. [Google Scholar] [CrossRef]
  27. Le, T.A.; Kim, T.W.; Lee, S.H.; Park, E.D. Effects of Na content in Na/Ni/SiO2 and Na/Ni/CeO2 catalysts for CO and CO2 methanation. Catal. Today 2018, 303, 159–167. [Google Scholar] [CrossRef]
  28. Xu, S.; Yan, X.; Wang, X. Catalytic performances of NiO-CeO2 for the reforming of methane with CO2 and O2. Fuel 2006, 85, 2243–2247. [Google Scholar] [CrossRef]
  29. Aksoylu, A.E.; Akin, A.N.; Önsan, Z.I.; Trimm, D.L. Structure/activity relationships in coprecipitated nickel-alumina catalysts using CO2 adsorption and methanation. Appl. Catal. A Gen. 1996, 145, 185–193. [Google Scholar] [CrossRef]
  30. Gao, J.; Jia, C.; Li, J.; Gu, F.; Xu, G.; Zhong, Z.; Su, F. Nickel catalysts supported on barium hexaaluminate for enhanced CO methanation. Ind. Eng. Chem. Res. 2012, 51, 10345–10353. [Google Scholar] [CrossRef]
Figure 1. Pore size distribution obtained for NiOCeO2-8, NiOCeO2-9 and NiOCeO2-10 catalysts after calcination at 600 °C.
Nanomaterials 12 02627 g001
Figure 2. TPR profiles (H2 consumption) for samples CeO2-8 (a), NiOCeO2-8, (b) NiOCeO2-9 (c) and NiOCeO2-10 (d).
Nanomaterials 12 02627 g002
Figure 3. TEM image corresponding to the as-prepared NiOCeO2-8 catalyst.
Nanomaterials 12 02627 g003
Figure 4. TEM images corresponding to the reduced NiOCeO2-8 (a) and NiOCeO2-10 (b) catalysts.
Nanomaterials 12 02627 g004
Figure 5. HAADF images and EDS mappings corresponding to the reduced NiOCeO2-8 (left), NiOCeO2-9 (center) and NiOCeO2-10 (right) catalysts.
Nanomaterials 12 02627 g005
Figure 6. Catalytic performance of NiOCeO2 in CO methanation as a function of temperature: (a) CO conversion and (b) CH4 yield.
Nanomaterials 12 02627 g006
Figure 7. Stability tests for CO methanation at 250 °C.
Nanomaterials 12 02627 g007
Table 1. Structural and textural properties (XDR data, Ni content (ICP), BET surface area, pore volume, pore diameter) of NiOCeO2 catalysts after calcination at 600 °C.
SamplesCrystalline
Phases
Average
Crystallite Size (nm)
Lattice
Parameter
(Å)
Ni (wt%)SBET (m2/g)VP (cm3/g)DP
(nm)
CeO2-8CeO2-fluorite12.65.410--------
NiOCeO2-8NiO-cubic
CeO2-fluorite
18.7
5.2
4.170
5.397
28.0 730.4725.6
NiOCeO2-9NiO-cubic
CeO2-fluorite
14,3
4,2
4.173
5.399
28.0800.6030.3
NiOCeO2-10NiO-cubic
CeO2-fluorite
13.0
4.8
4.169
5.405
32.2910.4419.6
Table 2. H2-Chemisorption analysis of reduced NiOCeO2 catalysts.
SampleNi Dispersion (%)Ni Particle Size (nm)Ni Surface Area (m2/g)
NiOCeO2-88.112.515.1
NiOCeO2-97.713.214.3
NiOCeO2-102.441.04.6
Table 3. Catalytic results at 220 °C.
CatalystsCO Conversion
(%)
Conversion Rate
(mmolCO·gNi1·h)
TOF (s−1) × 103
NiOCeO2-816.72.95.9
NiOCeO2-948.38.417.9
NiOCeO2-1096.714.8101.3
Publisher’s Note: MDPI stays neutral with regard to jurisdictional claims in published maps and institutional affiliations.

